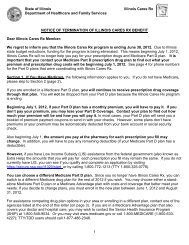
LETTER TO TRUSTEESThe General Assembly Retirement SystemThe Judges’ Retirement System <strong>of</strong> <strong>Illinois</strong>The <strong>State</strong> Employees’ Retirement System <strong>of</strong> <strong>Illinois</strong>The <strong>Illinois</strong> <strong>State</strong> Board <strong>of</strong> Investment (ISBI or Board) hasfiduciary responsibility for the pension assets <strong>of</strong> the GeneralAssembly Retirement System, the Judges’ Retirement System<strong>of</strong> <strong>Illinois</strong> and the <strong>State</strong> Employees’ Retirement System <strong>of</strong><strong>Illinois</strong>. The fair value <strong>of</strong> those assets totaled $8.7 billion atfiscal year ended June 30, <strong>2009</strong>. For the same period endingJune 30, 2008, net assets totaled $11.3 billion. The year endingJune 30, <strong>2009</strong> saw a continuation, in fact an exacerbation <strong>of</strong>the troubled environment for investors experienced throughthe previous fiscal year. While ISBI’s portfolio constructionprovided some protection in this very difficult period, its assetallocation, driven by an 8.5% actuarial assumption, made itvery difficult to dampen the losses experienced across themarketplace.Investment PolicyAs discussed in the previous <strong>Annual</strong> <strong>Report</strong>, ISBI madeadjustments to its asset allocation in FY 2008. Implementation<strong>of</strong> those changes was finalized early in FY <strong>2009</strong>.ISBI did not make new changes in FY <strong>2009</strong>; rather difficultywas experienced early this fiscal year, Quarter One andQuarter Two, in complying with the existing asset allocationpolicy. Under that policy, ISBI seeks to rebalance the portfolioon a regular basis to remain consistent with the assetallocation model. However, through the above-referenced timeperiod, asset values declined precipitously and liquidity, bothsystemically and within the ISBI portfolio, declined. Thus, itwas with great difficulty that the staff was able to rebalancethe portfolio in such away as to remain true to the assetallocation model.Further complicating these challenges was a dearth <strong>of</strong>liquidity within the securities lending program utilized by ISBIat <strong>State</strong> Street Bank and Trust. Within the cash collateral poolat <strong>State</strong> Street Quality Fund D, liquidity was constrained as aresult <strong>of</strong> Quality Fund D’s exposure to asset backed securities(ABS). While to date none <strong>of</strong> those securities have defaulted,liquidity left the marketplace, so too the demand for suchsecurities. As a result, the fund manager was forced to holdFigure 1Net Asset Allocation June 30, <strong>2009</strong>Fair Actual PolicyValue Asset Mix Target($ in Millions) % %U.S. equity 2,610,505,162 30 30U.S. equity hedge funds 880,939,190 10 10International equity 1,482,642,287 17 20Commingled Funds 335,484,184 4 0Fixed income 1 1,366,303,740 16 18Bank loans 197,259,098 2 2Real estate 875,929,700 10 10Private equity 2 450,491,810 5 5Infrastructure 2 305,969,947 3 5Cash 3 229,531,945 3 0Total 8,735,057,063 100 1001Maturities <strong>of</strong> one year or longer, including convertible bonds.2Interests in limited partnerships and other entities which have limited liquidity.3Includes money market instruments and other assets, less liabilities.4Holdings include fixed income and equity investments.ILLINOIS STATE BOARD OF INVESTMENT3
International Equity 17%U.S. Equity 30%Fixed Income 16%Private Equity 5%Bank Loans 2%Infrastructure 3%Cash 3%Commingled Funds 4%Real Estate 10%U.S. Equity Hedge Funds 10%ABS to maturity, thus limiting the liquidity <strong>of</strong> the fund. However,even as liquidity in the pool was constrained, revenue to theISBI portfolio through the securities lending program was atan all time high. For FY <strong>2009</strong> ISBI’s securities lending revenuewas $17,578,263.Despite the increased revenue generated by ISBI’s securitieslending program, the Board remains concerned about the riskassociated with the continued utilization <strong>of</strong> Quality Fund D. InSeptember <strong>of</strong> 2008 the Board directed <strong>State</strong> Street Bank andTrust to transfer ISBI’s exposure away from Quality Fund D tothe Navigator Fund, a regulated money market fund.Unfortunately, as <strong>of</strong> fiscal year end <strong>2009</strong>, <strong>State</strong> Street hasdeclined to make that transfer citing continued liquidityconstraints within Quality Fund D. It is anticipated that suchchanges will be made in FY 2010.Beyond the challenges presented in the securities lendingprogram, the Board also addressed issues within its fixedincome portfolio. A sizable portion <strong>of</strong> that portfolio wasmanaged by Western Asset Management (Western) in a CorePlus mandate. Consistent with that mandate, Western wasmarkedly exposed to investment grade mortgage backedsecurities. Further, in August <strong>of</strong> 2008, ISBI was advised thatWestern was buying for ISBI’s portfolio the bonds <strong>of</strong> financialservices companies. Both <strong>of</strong> these actions ultimately weredeleterious to the portfolio and caused the Board to lose itsconfidence in Western. As a result, ISBI terminated itsrelationship with the firm and transferred those assets to anexisting manager, Chicago Equity Partners. In so doing itchanged the mandate away from Core Plus to a moreconservative Core mandate. Further, the Board added a shortbond allocation to reduce risk and increase liquidity.Investment ResultsIn fiscal year <strong>2009</strong>, investors suffered from double digitdeclines in U.S. equity, international equity, private equity andreal estate as measured by market indices. Fixed income, asmeasured by Barclay’s Universal Index had a positive return.The ISBI total fund was down 20.1% for fiscal year <strong>2009</strong>, net <strong>of</strong>expenses. This follows a negative return <strong>of</strong> 6.2% for fiscal year2008, and positive returns <strong>of</strong> 17.1%, 11.0% and 10.1% for 2007,2006 and 2005, respectively.The Board continues to be concerned by some underperformanceby specific managers, but most <strong>of</strong> the currentmanagers have exceeded their individual benchmarks sinceinception. Figure 2 shows results over the three, five and tenyear time periods.U.S. EquitiesFor the twelve months ended June 30, <strong>2009</strong>, the Russell 3000Index, a broad representation <strong>of</strong> the U.S. market was down26.6%. Growth stocks exceeded value stocks; with the Russell3000 Growth Index down 24.5%, compared to the Russell 3000Value Index down 28.7%. Small capitalization stocksoutperformed large capitalization stocks; with the S&P 500declining 26.2% compared to a 25.0% decline for the Russell2000. ISBI’s U.S. equity portfolio was down 22.0% for fiscalyear <strong>2009</strong>, 4.6% above the Russell 3000.Figure 2 shows ISBI’s U.S. stock portfolio performance forthree, five and ten year time periods. The Board, throughstructure analysis, rebalancing and risk management,continues tracking the market with predictable consistency toachieve its objective.ILLINOIS STATE BOARD OF INVESTMENT4
- Page 1 and 2: 2009ANNUALREPORTILLINOISSTATEBOARDO
- Page 3: BOARD MEMBERSCHAIRMANRonald E. Powe
- Page 7 and 8: % Investment Returns June 30201510T
- Page 9 and 10: FINANCIAL HIGHLIGHTSFISCAL YEARS EN
- Page 11 and 12: FINANCIALSTATEMENTS2009ILLINOIS STA
- Page 13 and 14: MANAGEMENT’S DISCUSSION AND ANALY
- Page 15 and 16: STATEMENT OF NET ASSETSJUNE 30, 200
- Page 18 and 19: Note 2Deposits, Investments, and In
- Page 20 and 21: Note 2 (continued)Deposits, Investm
- Page 22 and 23: Note 2 (continued)Deposits, Investm
- Page 24 and 25: Note 3 General StateMember Systems
- Page 26 and 27: Note 4PensionsPlan DescriptionAll o
- Page 28 and 29: SUPPLEMENTALFINANCIALINFORMATION200
- Page 30 and 31: Moody’s S&P Shares/Quality Qualit
- Page 32 and 33: Moody’s S&P Shares/Quality Qualit
- Page 34 and 35: Moody’s S&P Shares/Quality Qualit
- Page 36 and 37: Moody’s S&P Shares/Quality Qualit
- Page 38 and 39: Moody’s S&P Shares/Quality Qualit
- Page 40 and 41: Moody’s S&P Shares/Quality Qualit
- Page 42 and 43: Moody’s S&P Shares/Quality Qualit
- Page 44 and 45: Moody’s S&P Shares/Quality Qualit
- Page 46 and 47: Moody’s S&P Shares/Quality Qualit
- Page 48 and 49: Moody’s S&P Shares/Quality Qualit
- Page 51 and 52: PORTFOLIO OF INVESTMENTSJUNE 30, 20
- Page 53 and 54: PORTFOLIO OF INVESTMENTSJUNE 30, 20
- Page 55 and 56:
PORTFOLIO OF INVESTMENTSJUNE 30, 20
- Page 57 and 58:
PORTFOLIO OF INVESTMENTSJUNE 30, 20
- Page 59 and 60:
PORTFOLIO OF INVESTMENTSJUNE 30, 20
- Page 61 and 62:
PORTFOLIO OF INVESTMENTSJUNE 30, 20
- Page 63 and 64:
PORTFOLIO OF INVESTMENTSJUNE 30, 20
- Page 65 and 66:
PORTFOLIO OF INVESTMENTSJUNE 30, 20
- Page 67 and 68:
PORTFOLIO OF INVESTMENTSJUNE 30, 20
- Page 69 and 70:
PORTFOLIO OF INVESTMENTSJUNE 30, 20
- Page 71 and 72:
PORTFOLIO OF INVESTMENTSJUNE 30, 20
- Page 73 and 74:
PORTFOLIO OF INVESTMENTSJUNE 30, 20
- Page 75 and 76:
PORTFOLIO OF INVESTMENTSJUNE 30, 20
- Page 77 and 78:
PORTFOLIO OF INVESTMENTSJUNE 30, 20
- Page 79 and 80:
PORTFOLIO OF INVESTMENTSJUNE 30, 20
- Page 81 and 82:
PORTFOLIO OF INVESTMENTSJUNE 30, 20
- Page 83 and 84:
PORTFOLIO OF INVESTMENTSJUNE 30, 20
- Page 85 and 86:
PORTFOLIO OF INVESTMENTSJUNE 30, 20
- Page 87 and 88:
PORTFOLIO OF INVESTMENTSJUNE 30, 20
- Page 89 and 90:
PORTFOLIO OF INVESTMENTSJUNE 30, 20
- Page 91 and 92:
PORTFOLIO OF INVESTMENTSJUNE 30, 20
- Page 93 and 94:
PORTFOLIO OF INVESTMENTSJUNE 30, 20
- Page 95 and 96:
PORTFOLIO OF INVESTMENTSJUNE 30, 20
- Page 97 and 98:
PORTFOLIO OF INVESTMENTSJUNE 30, 20
- Page 99 and 100:
PORTFOLIO DATAFISCAL YEARS ENDED JU
- Page 101 and 102:
INVESTMENT TRANSACTIONS WITH BROKER
- Page 103 and 104:
RESTRICTED INVESTMENTSPublic Act 95
- Page 105:
STAFF AND INVESTMENT MANAGERSEXECUT