Annual Report PDF file 2009 - State of Illinois
Annual Report PDF file 2009 - State of Illinois Annual Report PDF file 2009 - State of Illinois
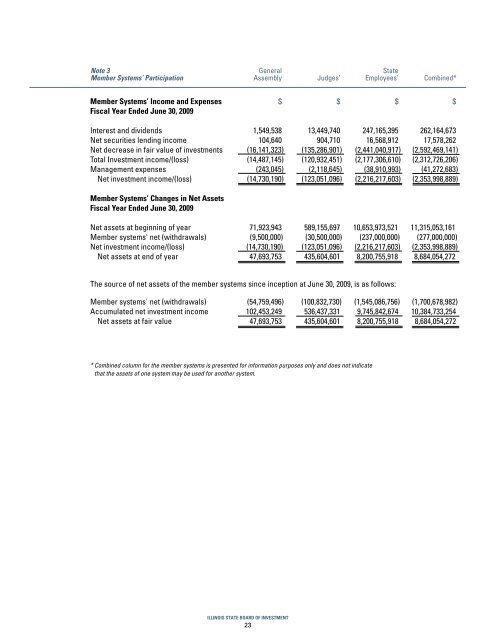
Note 3 General StateMember Systems’ Participation Assembly Judges’ Employees’ Combined*Member Systems’ Income and Expenses $ $ $ $Fiscal Year Ended June 30, 2009Interest and dividends 1,549,538 13,449,740 247,165,395 262,164,673Net securities lending income 104,640 904,710 16,568,912 17,578,262Net decrease in fair value of investments (16,141,323) (135,286,901) (2,441,040,917) (2,592,469,141)Total Investment income/(loss) (14,487,145) (120,932,451) (2,177,306,610) (2,312,726,206)Management expenses (243,045) (2,118,645) (38,910,993) (41,272,683)Net investment income/(loss) (14,730,190) (123,051,096) (2,216,217,603) (2,353,998,889)Member Systems’ Changes in Net AssetsFiscal Year Ended June 30, 2009Net assets at beginning of year 71,923,943 589,155,697 10,653,973,521 11,315,053,161Member systems' net (withdrawals) (9,500,000) (30,500,000) (237,000,000) (277,000,000)Net investment income/(loss) (14,730,190) (123,051,096) (2,216,217,603) (2,353,998,889)Net assets at end of year 47,693,753 435,604,601 8,200,755,918 8,684,054,272The source of net assets of the member systems since inception at June 30, 2009, is as follows:Member systems' net (withdrawals) (54,759,496) (100,832,730) (1,545,086,756) (1,700,678,982)Accumulated net investment income 102,453,249 536,437,331 9,745,842,674 10,384,733,254Net assets at fair value 47,693,753 435,604,601 8,200,755,918 8,684,054,272* Combined column for the member systems is presented for information purposes only and does not indicatethat the assets of one system may be used for another system.ILLINOIS STATE BOARD OF INVESTMENT23
NOTES TO FINANCIAL STATEMENTSJUNE 30, 2009 (CONTINUED)Note 3 (continued) General StateMember Systems’ Participation Assembly Judges’ Employees’ Combined*Member Systems’ Income and Expenses $ $ $ $Fiscal Year Ended June 30, 2008Interest and dividends 2,056,927 16,497,137 298,271,467 316,825,531Net securities lending income 107,307 864,473 15,652,690 16,624,470Net decrease in fair value of investments (6,734,639) (53,819,542) (968,688,184) (1,029,242,365)Total Investment income/(loss) (4,570,405) (36,457,932) (654,764,027) (695,792,364)Management expenses (270,594) (2,180,095) (39,399,947) (41,850,636)Net investment income/(loss) (4,840,999) (38,638,027) (694,163,974) (737,643,000)Member Systems’ Changes in Net AssetsFiscal Year Ended June 30, 2008Net assets at beginning of year 83,864,942 658,193,724 11,810,137,495 12,552,196,161Member systems' net (withdrawals) (7,100,000) (30,400,000) (462,000,000) (499,500,000)Net investment income/(loss) (4,840,999) (38,638,027) (694,163,974) (737,643,000)Net assets at end of year 71,923,943 589,155,697 10,653,973,521 11,315,053,161The source of net assets of the member systems since inception at June 30, 2008, is as follows:Member systems' net (withdrawals) (45,259,495) (70,332,730) (1,308,086,756) (1,423,678,981)Accumulated net investment income 117,183,438 659,488,427 11,962,060,277 12,738,732,142Net assets at fair value 71,923,943 589,155,697 10,653,973,521 11,315,053,161* Combined column for the member systems is presented for information purposes only and does not indicatethat the assets of one system may be used for another system.ILLINOIS STATE BOARD OF INVESTMENT24
- Page 1 and 2: 2009ANNUALREPORTILLINOISSTATEBOARDO
- Page 3 and 4: BOARD MEMBERSCHAIRMANRonald E. Powe
- Page 5 and 6: International Equity 17%U.S. Equity
- Page 7 and 8: % Investment Returns June 30201510T
- Page 9 and 10: FINANCIAL HIGHLIGHTSFISCAL YEARS EN
- Page 11 and 12: FINANCIALSTATEMENTS2009ILLINOIS STA
- Page 13 and 14: MANAGEMENT’S DISCUSSION AND ANALY
- Page 15 and 16: STATEMENT OF NET ASSETSJUNE 30, 200
- Page 18 and 19: Note 2Deposits, Investments, and In
- Page 20 and 21: Note 2 (continued)Deposits, Investm
- Page 22 and 23: Note 2 (continued)Deposits, Investm
- Page 26 and 27: Note 4PensionsPlan DescriptionAll o
- Page 28 and 29: SUPPLEMENTALFINANCIALINFORMATION200
- Page 30 and 31: Moody’s S&P Shares/Quality Qualit
- Page 32 and 33: Moody’s S&P Shares/Quality Qualit
- Page 34 and 35: Moody’s S&P Shares/Quality Qualit
- Page 36 and 37: Moody’s S&P Shares/Quality Qualit
- Page 38 and 39: Moody’s S&P Shares/Quality Qualit
- Page 40 and 41: Moody’s S&P Shares/Quality Qualit
- Page 42 and 43: Moody’s S&P Shares/Quality Qualit
- Page 44 and 45: Moody’s S&P Shares/Quality Qualit
- Page 46 and 47: Moody’s S&P Shares/Quality Qualit
- Page 48 and 49: Moody’s S&P Shares/Quality Qualit
- Page 51 and 52: PORTFOLIO OF INVESTMENTSJUNE 30, 20
- Page 53 and 54: PORTFOLIO OF INVESTMENTSJUNE 30, 20
- Page 55 and 56: PORTFOLIO OF INVESTMENTSJUNE 30, 20
- Page 57 and 58: PORTFOLIO OF INVESTMENTSJUNE 30, 20
- Page 59 and 60: PORTFOLIO OF INVESTMENTSJUNE 30, 20
- Page 61 and 62: PORTFOLIO OF INVESTMENTSJUNE 30, 20
- Page 63 and 64: PORTFOLIO OF INVESTMENTSJUNE 30, 20
- Page 65 and 66: PORTFOLIO OF INVESTMENTSJUNE 30, 20
- Page 67 and 68: PORTFOLIO OF INVESTMENTSJUNE 30, 20
- Page 69 and 70: PORTFOLIO OF INVESTMENTSJUNE 30, 20
- Page 71 and 72: PORTFOLIO OF INVESTMENTSJUNE 30, 20
- Page 73 and 74: PORTFOLIO OF INVESTMENTSJUNE 30, 20
Note 3 General <strong>State</strong>Member Systems’ Participation Assembly Judges’ Employees’ Combined*Member Systems’ Income and Expenses $ $ $ $Fiscal Year Ended June 30, <strong>2009</strong>Interest and dividends 1,549,538 13,449,740 247,165,395 262,164,673Net securities lending income 104,640 904,710 16,568,912 17,578,262Net decrease in fair value <strong>of</strong> investments (16,141,323) (135,286,901) (2,441,040,917) (2,592,469,141)Total Investment income/(loss) (14,487,145) (120,932,451) (2,177,306,610) (2,312,726,206)Management expenses (243,045) (2,118,645) (38,910,993) (41,272,683)Net investment income/(loss) (14,730,190) (123,051,096) (2,216,217,603) (2,353,998,889)Member Systems’ Changes in Net AssetsFiscal Year Ended June 30, <strong>2009</strong>Net assets at beginning <strong>of</strong> year 71,923,943 589,155,697 10,653,973,521 11,315,053,161Member systems' net (withdrawals) (9,500,000) (30,500,000) (237,000,000) (277,000,000)Net investment income/(loss) (14,730,190) (123,051,096) (2,216,217,603) (2,353,998,889)Net assets at end <strong>of</strong> year 47,693,753 435,604,601 8,200,755,918 8,684,054,272The source <strong>of</strong> net assets <strong>of</strong> the member systems since inception at June 30, <strong>2009</strong>, is as follows:Member systems' net (withdrawals) (54,759,496) (100,832,730) (1,545,086,756) (1,700,678,982)Accumulated net investment income 102,453,249 536,437,331 9,745,842,674 10,384,733,254Net assets at fair value 47,693,753 435,604,601 8,200,755,918 8,684,054,272* Combined column for the member systems is presented for information purposes only and does not indicatethat the assets <strong>of</strong> one system may be used for another system.ILLINOIS STATE BOARD OF INVESTMENT23


