Annual Report PDF file 2009 - State of Illinois
Annual Report PDF file 2009 - State of Illinois
Annual Report PDF file 2009 - State of Illinois

Create successful ePaper yourself
Turn your PDF publications into a flip-book with our unique Google optimized e-Paper software.
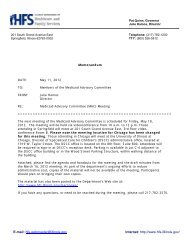
TEN YEAR SUMMARYFISCAL YEARS ENDED JUNE 30($ in millions)<strong>2009</strong> 2008 2007 2006 2005 2004 2003 2002 2001 2000$ $ $ $ $ $ $ $ $ $NET ASSETS(at fair value) 8,684.1 11,315.1 12,552.2 11,316.5 10,902.5 10,442.7 7,801.0 7,928.3 8,578.1 9,270.3Retirement Systems’ participationGeneral Assembly 47.7 71.9 83.9 79.0 80.8 81.3 47.4 52.2 60.5 68.9Judges’ 435.6 589.2 658.2 582.6 550.4 521.4 317.5 332.4 372.6 414.8<strong>State</strong> Employees’ 8,200.8 10,654.0 11,810.1 10,654.9 10,271.3 9,840.0 7,436.1 7,543.7 8,145.0 8,786.6CHANGES IN NET ASSETSNet investment income (loss) (2,354.0) (737.6) 1,877.7 1,173.0 1,007.4 1,506.8 12.7 (577.9) (652.3) 977.0Interest and dividends 262.2 316.8 319.5 306.2 262.1 184.4 186.8 213.4 244.4 227.6Net securities lendingincome 17.6 16.6 4.5 4.3 3.7 2.4 1.9 2.3 3.6 3.7Net gain (loss)on investments (2,592.5) (1,029.2) 1,594.3 892.6 766.1 1,337.9 (159.2) (775.0) (879.7) 766.4Management expenses (41.3) (41.9) (40.6) (30.1) (24.5) (17.9) (16.8) (18.6) (20.6) (20.7)Member Systems' netcontributions (withdrawals) (277.0) (499.5) (642.0) (759.0) (547.7) 1,134.9 (140.0) (71.9) (39.9) (15.7)RETURNS % % % % % % % % % %<strong>Annual</strong> total return* (20.1) (6.2) 17.1 11.0 10.1 16.4 0.3 (6.9) (7.1) 11.8Compound annual rate<strong>of</strong> return since 7-1-82(Adoption <strong>of</strong> PrudentPerson Legislation) 8.9 10.3 11.0 10.7 10.7 10.8 10.5 11.1 12.1 13.2* <strong>Annual</strong> total return reflects income earned and market appreciation (depreciation).ILLINOIS STATE BOARD OF INVESTMENT9