PHY221 Lab-05-5: Energy Diagram
PHY221 Lab-05-5: Energy Diagram
PHY221 Lab-05-5: Energy Diagram

Create successful ePaper yourself
Turn your PDF publications into a flip-book with our unique Google optimized e-Paper software.
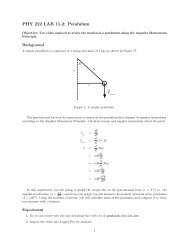
Therefore, the potential energy is constant and the kinetic energy of the system is constant for a circularorbit. A graph of Uvsr and Kvs.r is not very interesting since there will only be one datapoint on the graph.Elliptical OrbitHowever, for an elliptical orbit or an open orbit (such as a parabola or hyperbola), the distance between theplanet and star changes and the graph of potential and kinetic energy as a function of distance are muchmore interesting. These orbits are what you will study in this activity.Writing your program1. Start with the simulation of Earth’s orbit that you wrote in a previous lab. If you can’t find it or ifyou have deleted it, then you will have to ask a classmate to send you their code so that you can startwith theirs.2. The first three lines import the necessary libraries. You will need the graph library to plot your energygraph. Thus, make sure that the first three lines of the program are:from __future__ import divisionfrom visual import *from visual.graph import *3. The star (Sun) should be at the origin and the planet (Earth) should be at a distance of 1 AU (1.5 × 10 11 m) from the star on the +x axis.4. Check the constants for the mass of Sun and the mass of Earth to make sure that they are correct.5. Define a constant for R, the radius of Earth’s orbit if it is in circular motion.R = 1.5e116. Define the initial speed of the planet (Earth). For an elliptical orbit, let’s use 1.1 times the speed fora circular orbit (1.1v circle ).vi=1.1*sqrt(G*sun.m/R)7. Define the initial velocity of the planet to be 〈0, vi, 0〉 .8. Check that the initial momentum is calculated correctly as the mass of the planet times its initialvelocity.9. Before the while statement, create a graph that will have three plots for U, K, and E.UGraph=gdisplay(title="U vs. r", xtitle=’r (m)’,ytitle=’U (J)’, x=450, y=0, width=400, height=200)UPlot=gcurve(color=color.cyan)EPlot=gcurve(color=color.yellow)KPlot=gcurve(color=color.white)10. Inside your while loop, after r is calculated and before the gravitational force is calculated, calculatethe energies. The reason you need to calculate energy before the force, velocity, and momentum isthat you don’t want to calculate kinetic energy after the speed has been updated and potential energybefore the speed is updated. You have to be consistent and calculate the kinetic and potential energyat the same points in the orbit.Be sure to use the correct variable names for your star and planet. Here are examples of the calculations.2