Manual for the csvsimple package
Manual for the csvsimple package
Manual for the csvsimple package
- No tags were found...

Create successful ePaper yourself
Turn your PDF publications into a flip-book with our unique Google optimized e-Paper software.
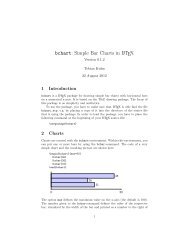
4.2 A Graphical PresentationFor this example, we use some artificial statistical data given by a CSV file.CSV file data.csvland,group,amountBayern,A,1700Baden-W\"{u}rttemberg,A,2300Sachsen,B,1520Th\"{u}ringen,A,1900Hessen,B,2100Firstly, we survey <strong>the</strong> file content using \csvautotabular.\csvautotabular{data.csv}land group amountBayern A 1700Baden-Württemberg A 2300Sachsen B 1520Thüringen A 1900Hessen B 2100The amount values are presented in <strong>the</strong> following diagram by bars where <strong>the</strong> group classificationis given using different colors.% This example requires <strong>the</strong> <strong>package</strong> tikz\begin{tikzpicture}[Group/A/.style={left color=red!10,right color=red!20},Group/B/.style={left color=blue!10,right color=blue!20}]\csvreader[head to column names]{data.csv}{}{%\begin{scope}[yshift=-\<strong>the</strong>csvrow cm]\path [draw,Group/\group] (0,-0.45)rectangle node[font=\bfseries] {\amount} (\amount/1000,0.45);\node[left] at (0,0) {\land};\end{scope} }\end{tikzpicture}Bayern1700Baden-Württemberg2300Sachsen1520Thüringen1900Hessen210019