Z-axis geometric efficiency in CT - ImPACT CT Scanner Evaluation ...
Z-axis geometric efficiency in CT - ImPACT CT Scanner Evaluation ...
Z-axis geometric efficiency in CT - ImPACT CT Scanner Evaluation ...
- No tags were found...

Create successful ePaper yourself
Turn your PDF publications into a flip-book with our unique Google optimized e-Paper software.
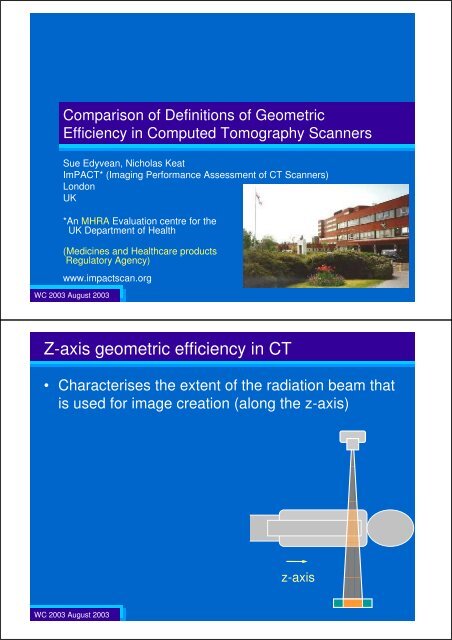
Comparison of Def<strong>in</strong>itions of GeometricEfficiency <strong>in</strong> Computed Tomography <strong>Scanner</strong>sSue Edyvean, Nicholas KeatImPA<strong>CT</strong>* (Imag<strong>in</strong>g Performance Assessment of <strong>CT</strong> <strong>Scanner</strong>s)LondonUK*An MHRA <strong>Evaluation</strong> centre for theUK Department of Health(Medic<strong>in</strong>es and Healthcare productsRegulatory Agency)www.impactscan.orgWC 2003 August 2003Z-<strong>axis</strong> <strong>geometric</strong> <strong>efficiency</strong> <strong>in</strong> <strong>CT</strong>• Characterises the extent of the radiation beam thatis used for image creation (along the z-<strong>axis</strong>)z-<strong>axis</strong>WC 2003 August 2003
Geometric <strong>efficiency</strong> (g.eff.)• S<strong>in</strong>gle slice– Usually little wasted dose,as all of beam is used forimag<strong>in</strong>g, except for narrow sliceswhere sometimes post-patientcollimation is usedWC 2003 August 2003Geometric <strong>efficiency</strong> (g.eff.)• Multi slice– Usually more unused dose, as aneven irradiation of slices is required– Penumbral region of the beamtherefore can’t be used for imag<strong>in</strong>gWC 2003 August 2003
Def<strong>in</strong>itions for z-<strong>axis</strong> <strong>geometric</strong> <strong>efficiency</strong> (g.eff.)• IEC 60601- 2- 44 Ed. 1 1999: Orig<strong>in</strong>al def<strong>in</strong>ition– “the full width at half maximum of the sensitivity profileexpressed as percentage of the full width at halfmaximum of the dose profile.”• IEC 60601- 2- 44 Ed. 2 Am.1 2003: New def<strong>in</strong>ition– “the <strong>in</strong>tegral of the dose profile along the z-direction,<strong>in</strong>tegrated over the range subtended by the detectorelements used dur<strong>in</strong>g acquisition, expressed as apercentage of the total <strong>in</strong>tegral of the dose profile <strong>in</strong> thez-direction”• g.eff. to be displayed on scan console when lessthan 70%WC 2003 August 2003Def<strong>in</strong>itions – paraphrased• Old def<strong>in</strong>ition:– Ratio of the measured imaged width to the measureddose profile width (add imaged widths for multi-slice)• New def<strong>in</strong>ition:– Integral of dose profile over range of nom<strong>in</strong>al slice widthdivided by <strong>in</strong>tegral of whole dose profiledoseprofilewidthmeasured add -> total imaged widthWC 2003 August 2003z-<strong>axis</strong>nom<strong>in</strong>al slice widthtotal nom<strong>in</strong>al acquisition width(nom<strong>in</strong>al total collimation)<strong>in</strong>tegral ofdose profile overrange of nom<strong>in</strong>alslice<strong>in</strong>tegral ofwhole doseprofile
Purpose of this study• Identify problems associated with old g.eff.• Compare two calculation approaches for new g.eff.• Compare values between old and newWC 2003 August 2003Methods of measurement – dose profiles• Kodak X-Omat V Radiotherapy film• Scanned at iso-centre• Read out with scann<strong>in</strong>g micro-densitometer• Optical density profile converted to dose profile876dose profiledose54321fwhm00 5 10 15 20 25 30 35 40distance along z-<strong>axis</strong>WC 2003 August 2003
Methods of measurement – imaged slice width• Angled metal plates scanned <strong>in</strong> axial mode• Width projected <strong>in</strong>to image → Z-sensitivity profileWC 2003 August 2003Problems with old g.eff.• Different measurement conditions (air vs phantom)• For multi slice scanners– Many image width comb<strong>in</strong>ations for one beam widthWC 2003 August 2003• Many measurements needed– e.g. Philips Mx8000 four slice scannerBeam width Image width comb<strong>in</strong>ations(mm)No. x slice (mm)12 x 0.5 1 x 14 4 x 1 2 x 2 1 x 410 4 x 2.5 2 x 5 1 x 10162 x 820 4 x 5 2 x 10
Problems with old g.eff. (cont<strong>in</strong>ued)• Different focal spots– Potentially doubles the number of values• Sixteen slice scanners – narrow slices– Need accurate measurement for imaged widths ~ < 1 mm– Not many exist<strong>in</strong>g test objects will do thatImPA<strong>CT</strong>’s ‘th<strong>in</strong> slice’ tool50 µm Titanium plates8° angle to scan planeWC 2003 August 2003Potential problems for calculation of new g.eff.• Dose profile– ..‘<strong>in</strong>tegrated over the range subtended by detectorelements used’ ( nom<strong>in</strong>al total acquisition width)– Position of dose profile relative to detectors is not def<strong>in</strong>ed– Shape asymmetric assume a reference position8dose profile76dose5432100 5 10 15 20 25 30 35 40distance along z-<strong>axis</strong>WC 2003 August 2003
Two approaches for new g.eff. calculation• Could either– Centre <strong>in</strong>tegration range on centre of dose profile• Def<strong>in</strong>e as halfway between fwhm– Position of range which gives maximum <strong>geometric</strong> <strong>efficiency</strong>A. dose profileB.dose profile887766dose543dose543221100 5 10 15 20 25 30 35 4000 5 10 15 20 25 30 35 40distance along z-<strong>axis</strong>distance along z-<strong>axis</strong>WC 2003 August 2003Two approaches for new g.eff. calculation• Comparison of two techniques– Maximum difference = 0.04 % (ss), 0.6 % (ms)– Mean difference = 0.1% (ms)A. dose profileB.dose profile887766dose543dose543221100 5 10 15 20 25 30 35 4000 5 10 15 20 25 30 35 40distance along z-<strong>axis</strong>distance along z-<strong>axis</strong>WC 2003 August 20031: Centred on dose profile2. Maximum g.eff.
Results• Analysed data from 13 scanners (all manufacturers)– 4 s<strong>in</strong>gle slice– 5 four slice– 1 eight slice– 3 sixteen slice• Total of 123 different slice width comb<strong>in</strong>ations– Old g.eff.• Compared new and old g.eff.WC 2003 August 2003S<strong>in</strong>gle slice - old g.eff. (imaged width / dose width)– Most scanners have values of approximately 100%– Values higher than 100% probably due to scatter– Low for narrow slices us<strong>in</strong>g post patient collimation120Geometric Efficiency (%)100806040200<strong>Scanner</strong> A<strong>Scanner</strong> B<strong>Scanner</strong> C<strong>Scanner</strong> D70%0 1 2 3 4 5 6 7 8 9 10Slice width (mm)WC 2003 August 2003
S<strong>in</strong>gle slice - new g.eff. (dose <strong>in</strong> nom<strong>in</strong>al width/wholeprofile)– g.eff. values lower than 100%– Radiation fall<strong>in</strong>g outside the nom<strong>in</strong>al width– Non rectangular dose profiles as widths gets th<strong>in</strong>ner100WC 2003 August 2003Geometric Efficiency (%)80604020070%<strong>Scanner</strong> A<strong>Scanner</strong> B<strong>Scanner</strong> C<strong>Scanner</strong> D0 1 2 3 4 5 6 7 8 9 10Slice width (mm)Multi slice - old g.eff. (imaged width / dose width)• Unused penumbra – values less than 100%• Many values for each scanner– e.g. Siemens Sensation 16 (small focus only)WC 2003 August 2003Slice width(mm)Imaged width1 slice 2 slice 3 slice 4 slice 6 slice 12 slice0.6 71%1 106%0.75 77%1.5 77% 88%3 88% 76%4.5 77% 87%5 95%6 87%9 77% 88%10 96%
Multi slice - old g.eff. (cont<strong>in</strong>ued)• Same beam width– Different values9 mmbeam18 mmbeamSlice width(mm)Imaged width1 slice 2 slice 3 slice 4 slice 6 slice 12 slice0.6 71%1 106%0.75 77%1.5 77% 88%3 88% 76%4.5 77% 87%5 95%6 87%9 77% 88%10 96%WC 2003 August 2003Multi slice - new g.eff. (dose <strong>in</strong> nom<strong>in</strong>al width/whole profile)• Values for each beam width only• Unused penumbra – values less than 100%dose with<strong>in</strong> nom<strong>in</strong>alwidth equals totaldosedose with<strong>in</strong> nom<strong>in</strong>alwidth less than totaldoseWC 2003 August 2003Geometric Efficiency (%)1008060402000 2 4 6 8 101214161820222426283032Collimation (mm)Four slice scanners only<strong>Scanner</strong> A<strong>Scanner</strong> B<strong>Scanner</strong> C<strong>Scanner</strong> D70%
Multi slice - new g.eff. versus old g.eff.• Mean ratio = 0.99, but standard deviation = 10%• Biggest differences at narrow collimations– total measured imaged width matches dose width, butboth greater than nom<strong>in</strong>al• Some valuesnow below70% 802 x 1 mmWC 2003 August 2003Geometric Efficiency (new) (%)120100604020070% new70% old0 20 40 60 80 100 120Geometric <strong>efficiency</strong> (old) (%)2 x 0.63 mm2 x 0.63 mmConclusions• Old g.eff. def<strong>in</strong>ition– Worked well enough for s<strong>in</strong>gle slice systems– Drawback is many slice width comb<strong>in</strong>ations for multi slice• New g.eff. does not use imaged width; only the doseprofile and nom<strong>in</strong>al width– Two calculation techniques are comparable– Results for s<strong>in</strong>gle slice are all generally lower• spread of dose outside of nom<strong>in</strong>al width not always identified before– Multi-slice new g.eff. values similar to old values• except for some th<strong>in</strong> slices where both imaged slice width and dosewidth are > nom<strong>in</strong>al Some values now below 70% thresholdWC 2003 August 2003
Comparison of Def<strong>in</strong>itions of GeometricEfficiency <strong>in</strong> Computed Tomography <strong>Scanner</strong>sSue Edyvean, Nicholas KeatImPA<strong>CT</strong>* (Imag<strong>in</strong>g Performance assessment of <strong>CT</strong> <strong>Scanner</strong>s)LondonUK*An MHRA <strong>Evaluation</strong> centre for theUK Department of Health(Medic<strong>in</strong>es and Healthcare productsRegulatory Agency)www.impactscan.orgWC 2003 August 2003