Stacked Deck: How the Dominance of Politics by - Demos
Stacked Deck: How the Dominance of Politics by - Demos
Stacked Deck: How the Dominance of Politics by - Demos
- No tags were found...

Create successful ePaper yourself
Turn your PDF publications into a flip-book with our unique Google optimized e-Paper software.
Dēmos.org<strong>Stacked</strong> <strong>Deck</strong><strong>How</strong> <strong>the</strong> <strong>Dominance</strong> <strong>of</strong> <strong>Politics</strong> <strong>by</strong> <strong>the</strong> Affluent & BusinessUndermines Economic Mobility in America<strong>by</strong>: David Callahan & J. Mijin Cha1
About DēmosDēmos is a public policy organization working for an America where we all havean equal say in our democracy and an equal chance in our economy.Dēmos220 Fifth Avenue, 2nd FloorNew York, New York 10001p: (212) 633-1405f: (212) 633-2015Dēmos MediaElektra GrayDirector <strong>of</strong> Communicationsegray@demos.orgp: 212.485.6014www.demos.org2
IntroductionIf <strong>the</strong>re is one idea that nearly all Americans can agree on, it isthat everyone should have a chance to improve <strong>the</strong>mselves anddo better in life. At <strong>the</strong> same time, Americans strongly believe inpolitical equality—<strong>the</strong> view that civic life should be a level playingfield and everyone should have a voice in <strong>the</strong> decisions that affect<strong>the</strong>ir lives.Yet today, <strong>the</strong>re is wide recognition that America is not living upto ei<strong>the</strong>r <strong>of</strong> <strong>the</strong>se cornerstone ideals. A host <strong>of</strong> indicators showthat <strong>the</strong> middle class is struggling —and worse, shrinking—andthat upward mobility is elusive for many Americans. 1 Meanwhile,evidence abounds that <strong>the</strong> U.S. political system is increasinglydominated <strong>by</strong> wealthy interests, and strong majorities <strong>of</strong> <strong>the</strong>public believe—rightly—that <strong>the</strong> deck is stacked against ordinaryvoters. 2What is less understood, though, is <strong>the</strong> interplay between <strong>the</strong>setwo problems—<strong>the</strong> way that a tilting <strong>of</strong> political life toward businessand <strong>the</strong> wealthy has served to undermine economic mobility.As private interests have come to wield more influence over publicpolicy, with ever larger sums <strong>of</strong> money shaping elections and<strong>the</strong> policymaking process, our political system has become less responsiveto those looking for a fair shot to improve <strong>the</strong>ir lives andmove upward. Recent developments have aggravated this longemerging trend. In particular, <strong>the</strong> Citizens United ruling and <strong>the</strong> rise1
<strong>of</strong> Super PACs have expanded <strong>the</strong> ability <strong>of</strong> wealthy individualsand corporations to shape election outcomes and set <strong>the</strong> policyagenda in Washington and state capitals across <strong>the</strong> country.These inequities in political power would still be unfair, but mightnot matter as much, if <strong>the</strong> interests <strong>of</strong> <strong>the</strong> affluent and corporationswere closely aligned with those <strong>of</strong> <strong>the</strong> general public. Butthis is <strong>of</strong>ten not <strong>the</strong> case. Wealthy interests are keenly focusedon concerns not shared <strong>by</strong> <strong>the</strong> rest <strong>of</strong> <strong>the</strong> American public, likekeeping taxes low on capital gains, and <strong>of</strong>ten oppose policies thatwould foster upward mobility among low-income citizens, such asraising <strong>the</strong> minimum wage. Even when <strong>the</strong> wealthy do share <strong>the</strong>public’s strong enthusiasm for policies that help Americans getahead, such as spending on higher education, <strong>the</strong>y <strong>of</strong>ten prioritizetax cuts or deficit reduction in ways that squeeze <strong>the</strong> resourcesavailable for <strong>the</strong>se very policies.“Wealthy interests are keenly focusedon concerns not shared <strong>by</strong> <strong>the</strong> rest <strong>of</strong> <strong>the</strong>American public.”This paper <strong>of</strong>fers an overview <strong>of</strong> <strong>the</strong> interplay between decliningupward mobility and growing political inequality, which we showis a self-reinforcing phenomenon. It reports on a growing body <strong>of</strong>new research on this nexus and <strong>of</strong>fers a set <strong>of</strong> policy recommendationsto reduce both political and economic inequality.2
WEALTH & INFLUENCEConcentrated wealth has long posed significant dangers to America’segalitarian ideals. This challenge animated progressive reformers overa century ago and, since <strong>the</strong> 1980s, has been a growing topic <strong>of</strong> discussionamid rising economic inequality. Yet now, thanks to scholarlyresearch conducted over <strong>the</strong> past decade, along with analysis <strong>of</strong> recenttrends and events, we can achieve a deeper understanding <strong>of</strong> exactlyhow today’s growing chasm <strong>of</strong> income and wealth translates into diminishedopportunities for Americans lower down <strong>the</strong> economic ladder. 3Below we discuss seven disturbing facts about <strong>the</strong> nexus betweenwealth and influence in America today:• The affluent have different priorities• The affluent don’t prioritize policies for upward mobility• The priorities <strong>of</strong> lower income Americans are <strong>of</strong>ten ignored orblocked• The affluent participate more in politics and civic life• The affluent have more influence over policy outcomes• The affluent have more ways to shape politics• Political and economic inequality are mutually reinforcing3
The Affluent Have Different PrioritiesSubstantial research now documents <strong>the</strong> different ways in which <strong>the</strong>wealthy and <strong>the</strong> general public view policy issues. Significant differencesbetween <strong>the</strong> two groups exist in such areas as tax and budgetissues, trade and globalization, regulation <strong>of</strong> business, labor, <strong>the</strong> socialsafety net, and <strong>the</strong> overall role <strong>of</strong> government.A recent survey funded <strong>by</strong> <strong>the</strong> Russell Sage Foundation found that <strong>the</strong>policy preferences <strong>of</strong> <strong>the</strong> wealthy (average income over $1 millionannually) vary widely from those <strong>of</strong> <strong>the</strong> general public. 4 As Table 1shows below, this survey found that <strong>the</strong> general public is more openthan <strong>the</strong> wealthy to a variety <strong>of</strong> policies designed to reduce inequalityand streng<strong>the</strong>n economic opportunity, including: raising <strong>the</strong> minimumwage, increasing <strong>the</strong> Earned Income Tax Credit, providing generousunemployment benefits, and directly creating jobs. For example, only 40percent <strong>of</strong> <strong>the</strong> wealthy think <strong>the</strong> minimum wage should be high enoughto prevent full-time workers from being in poverty while 78 percent <strong>of</strong><strong>the</strong> general public holds this view. Affluent voters are also less supportive<strong>of</strong> labor unions and less likely to support laws that make it easier forworkers to join unions—even as research shows that unions are crucialto enabling people to work <strong>the</strong>ir way into <strong>the</strong> middle class. 5Additionally, an earlier study <strong>by</strong> <strong>the</strong> Center for American Progress(CAP) found that 73 percent <strong>of</strong> low-income Americans (those makingunder $20,000) believed that <strong>the</strong> gap between rich and poor should bereduced, even if it means higher taxes for <strong>the</strong> wealthy, compared to 54percent <strong>of</strong> Americans making over $100,000. 6 Likewise, 84 percent <strong>of</strong>low-income Americans believed that <strong>the</strong> federal government shouldguarantee affordable health coverage for every American, comparedto 59 percent <strong>of</strong> affluent respondents who held this view. The CAPsurvey also found that just 36 percent <strong>of</strong> respondents making over$100,000 agreed that “labor unions play a positive role in our economy”—comparedto 55 percent <strong>of</strong> those making under $20,000.A notable area where <strong>the</strong> affluent have different priorities is deficitreduction, which wealthier Americans tend to see as more importantthan o<strong>the</strong>r economic priorities, such as job creation. Polls over <strong>the</strong> past4
two years have repeatedly found that while many Americans are worriedabout deficits and <strong>the</strong> national debt, addressing unemployment andimproving <strong>the</strong> economy has consistently been a bigger priority for <strong>the</strong>public. For example, a June 2010 NBC News/Wall Street Journal Pollfound that 33 percent <strong>of</strong> Americans named job creation and economicgrowth as <strong>the</strong>ir top priority; 15 percent named “deficit and governmentspending.” Most polls throughout 2011 and 2012 found that <strong>the</strong> publicremained focused on jobs and <strong>the</strong> economy over <strong>the</strong> deficit <strong>by</strong> two-Table 1:Jobs & Income Policy Preferences <strong>of</strong> Affluentvs. General PublicPolicy% Wealthyin Favor% General Publicin FavorGovernment must see that no one is withoutfood, clothing or shelterMinimum wage high enough so that no familywith a full-time worker falls below <strong>of</strong>ficial povertylineThe government should provide a decent standard<strong>of</strong> living for <strong>the</strong> unemployedThe government in Washington ought to see to itthat everyone who wants to work can find a jobThe Earned Income Tax Credit (EITC) should beincreased ra<strong>the</strong>r than decreased or kept <strong>the</strong> sameThe federal government should provide jobs foreveryone able and willing to work who cannot finda job in private employment43% 68%40% 78%23% 50%19% 68%13% 49%8% 53%Source: Benjamin I. Page, Larry M. Bartels, and Jason Seawright, “Democracy and <strong>the</strong> Policy Preferences <strong>of</strong> WealthyAmericans,” Perspectives on <strong>Politics</strong> [italicized] 11:1, pp. 51-73.5
to-one margins or more. 7 Exit polling on Election Day found that 59percent <strong>of</strong> voters rated <strong>the</strong> economy as <strong>the</strong> most important issue facing<strong>the</strong> country, compared to 15 percent who named <strong>the</strong> deficit. 8Yet if jobs and economic growth has clearly been <strong>the</strong> top priority <strong>of</strong>most Americans, this does not appear to be <strong>the</strong> case for affluent Americans.For example, a September 2012 survey <strong>by</strong> <strong>the</strong> Economist magazinefound that respondents making over $100,000 annually were twice aslikely to name <strong>the</strong> budget deficit as <strong>the</strong> most important issue in decidinghow <strong>the</strong>y would vote than middle or lower income respondents. 9The 2011 Russell Sage Foundation study also explored how <strong>the</strong> wealthyrespondents ranked different policies in terms <strong>of</strong> priority. The surveyfound that 87 percent <strong>of</strong> affluent households believed budget deficitswere a “very important” problem, <strong>the</strong> highest percentage <strong>of</strong> all listedperceived problems. The authors <strong>of</strong> <strong>the</strong> study comment fur<strong>the</strong>r:One third (32%) <strong>of</strong> all <strong>the</strong> open-ended responses mentionedbudget deficits or excessive government spending, far more thanmentioned any o<strong>the</strong>r issue. At various points in our interviews,respondents spontaneously commented on “government overspending.”Unmistakably, deficits are a major concern for most<strong>of</strong> our respondents. Nearly as many <strong>of</strong> our respondents (84%and 79%, respectively) called unemployment and education “veryimportant” problems. <strong>How</strong>ever, each <strong>of</strong> <strong>the</strong>se problems wasmentioned as <strong>the</strong> most important <strong>by</strong> only 11%, making <strong>the</strong>m adistant second to budget deficits among <strong>the</strong> concerns <strong>of</strong> wealthyAmericans.One reason that <strong>the</strong> affluent may be less concerned about job creationthan deficit reduction is that <strong>the</strong>y have generally been less affected <strong>by</strong>high unemployment rates and <strong>the</strong> economic downturn. Unemploymentrates vary greatly based on educational attainment, which alsocorresponds to affluence. The unemployment rate for those with lessthan a high school diploma was 12 percent in January 2013. 10 The6
unemployment rate in January 2013 for those with a bachelor’s degreeor higher, however, is 3.7 percent—a rate which is considered virtuallyfull employment <strong>by</strong> most economists. More generally, upper incomeAmericans were less negatively affected <strong>by</strong> <strong>the</strong> Great Recession andhave recovered more quickly.“Yet if jobs and economic growth has clearlybeen <strong>the</strong> top priority <strong>of</strong> most Americans, thisdoes not appear to be <strong>the</strong> case for affluentAmericans.”In addition to <strong>the</strong>se factors, <strong>the</strong> affluent are significantly less inclinedthan o<strong>the</strong>r groups <strong>of</strong> Americans to support an active role for governmentin addressing mass unemployment. As <strong>the</strong> authors <strong>of</strong> <strong>the</strong> 2011survey <strong>of</strong> wealthy Americans report:Most striking, given <strong>the</strong> high importance that <strong>the</strong> wealthy attributeto <strong>the</strong> problem <strong>of</strong> unemployment, is <strong>the</strong>ir overwhelming rejection<strong>of</strong> federal government action to help with jobs. Only 19%* <strong>of</strong> <strong>the</strong>wealthy say that <strong>the</strong> government in Washington ought to “see toit” that everyone who wants to work can find a job [presumably aprivate job]; 81% oppose this. A bare 8% say <strong>the</strong> federal governmentshould provide jobs [presumably public jobs] for everyoneable and willing to work who cannot find a job in private employment.Fully 91% disagree._____________________________________________* Democracy and <strong>the</strong> Policy Preferences <strong>of</strong> Wealthy Americans at: http://faculty.wcas.northwestern.edu/~jnd260/cab/CAB2012%20-%20Page1.pdf7
The Affluent Don’t Prioritize Policiesfor Upward MobilityEven when <strong>the</strong> affluent do support policies for upward mobility, <strong>the</strong>y<strong>of</strong>ten do not prioritize <strong>the</strong>se policies over o<strong>the</strong>r goals, such as lowertaxes. A case in point is higher education. While affluent Americansand business leaders broadly support access to higher education, alongwith <strong>the</strong> general public, 11 spending in this area has been cut in somestates where governors have prioritized cutting taxes—with strong supportfrom wealthy voters and corporate interests.In Florida, for example, Governor Rick Scott—who secured <strong>of</strong>ficewith a majority <strong>of</strong> <strong>the</strong> affluent vote in 2010—has continually chosen toprioritize tax cuts for corporations over investing in higher education. 12In order to fill a $2 billion budget deficit in 2011, <strong>the</strong> state chose to cut$300 million from higher education and slashed $350 million from <strong>the</strong>Bright Futures scholarship program, which provides higher educationfinancial assistance to students planning to attend Florida institutions. 13Florida’s steep higher education funding cuts are a relatively recent phenomenon.Previous to FY 2007, <strong>the</strong> state’s support for higher educationrose steadily for 15 years. 14 Between FY 2007 and FY 2012, however,higher education funding was cut 22 percent and FY 2013 saw afur<strong>the</strong>r $20 million reduction in funding. The education budget cuts arecoming at a time when Florida’s young adult population is considerablyexpanding and a larger share <strong>of</strong> students are seeking to pursue highereducation at <strong>the</strong> state’s public colleges and universities. 15At <strong>the</strong> same time he spearheaded steep cuts to education, GovernorScott pushed substantial tax cuts for corporations. In FY 2013, <strong>the</strong>state cut corporate taxes <strong>by</strong> $750 million and will continue to cut taxesevery year for three years, totaling a $2.5 billion tax cut. 16 AT&T andVerizon were particularly successful, as <strong>the</strong> state cut <strong>the</strong>ir taxes anywherefrom $35 million to $300 million per year. AT&T spent $1.68million on lob<strong>by</strong>ing <strong>the</strong> state legislature and deployed 74 Florida lob<strong>by</strong>ists,more than any o<strong>the</strong>r company in 2012. Given <strong>the</strong>ir potential taxsavings, <strong>the</strong> lob<strong>by</strong>ing expenditures were a smart investment for AT&T.8
In addition to winning <strong>the</strong> affluent vote when he ran for <strong>of</strong>fice, RickScott is himself independently wealthy, having made his money fromrunning several hospitals through his company, Columbia HealthcareCorp, which eventually became Columbia/HCA Healthcare Corp. 17 Hespent $73 million <strong>of</strong> his own money for his gubernatorial campaignand claimed that made him independent <strong>of</strong> special interests. 18 In total,Scott’s campaign spent $78 million, compared to just $10.5 millionspent <strong>by</strong> his opponent. 19 Though Scott largely financed his election, his$3 million inauguration, thrown during <strong>the</strong> depths <strong>of</strong> <strong>the</strong> Great Recession,was paid for entirely <strong>by</strong> corporate contributions. Companies witha stake in <strong>the</strong> Medicaid debate contributed a total <strong>of</strong> $800,000 and realestate developers and investors contributed more than $250,000. 20While Scott financed a large portion <strong>of</strong> his last campaign, his alliesformed a Super PAC, Let’s Get to Work, for his re-election, whichallows him to circumvent <strong>the</strong> state’s limit <strong>of</strong> $500 for individual contributions.21 Let’s Get to Work has already raised millions <strong>of</strong> dollars,much <strong>of</strong> which comes from large donations from corporate interests,particularly health care, insurance, and agribusiness, and much comesfrom a small number <strong>of</strong> very wealthy individuals, including a $250,000contribution from Sheldon Adelson. 22In o<strong>the</strong>r states, governors elected with strong support from affluentvoters and business groups have prioritized tax cuts over funding forprimary and secondary public education—despite <strong>the</strong> fact that <strong>the</strong>wealthy and corporate executives ostensibly support such educationspending. In New Jersey, for example, Governor Chris Christie—whom affluent voters supported <strong>by</strong> a 21-point margin when he wonelection in 2009 23 —spearheaded cuts to public education while simultaneouslyrolling back a surtax on <strong>the</strong> state’s wealthiest households. WhileChristie ran under <strong>the</strong> public financing program, he still raised $6 million,nearly half <strong>of</strong> which came from donations <strong>of</strong> $3,400, <strong>the</strong> state’scontribution limit. 24 In 2011, <strong>the</strong> governor and New Jersey legislature9
locked in new tax cuts for businesses that cost $184 million in FY 2012,$374 million in FY 2013 and will total $2.35 billion over five years. Ontop <strong>of</strong> this, <strong>the</strong> state passed an additional $882 million in breaks forspecific corporations. 25 Since taking <strong>of</strong>fice, Christie has doled out over$1.57 billion in tax breaks. 26Meanwhile, in 2010, Christie cut aid to school districts <strong>by</strong> $475 millionand cut education aid <strong>by</strong> ano<strong>the</strong>r $820 million in 2011. 27 Christie cutNew Jersey’s public school districts funding so deeply that educationadvocates successfully sued <strong>the</strong> state for failing to meet minimum educationstandards. 28 A judge ruled that <strong>the</strong> state’s funding formula underfundedschools <strong>by</strong> $1.6 billion over two years (nearly <strong>the</strong> same amountChristie has given away in corporate tax breaks) and that <strong>the</strong> burden <strong>of</strong><strong>the</strong> cuts fell disproportionately on poorer districts. Polling among registeredvoters in <strong>the</strong> state showed that 59 percent opposed <strong>the</strong> steep educationcuts. 29A similar story emerges from Pennsylvania, where Governor Tom Corbettand his allies in <strong>the</strong> state legislature cut roughly $860 million fromeducation funding in 2011–2012. 30 Pennsylvania continued to enacttax cuts for businesses and as a result, <strong>the</strong> state will lose $2.4 billionin revenue in 2013 from business tax cuts, three times as much as 10years ago. 31 The FY 2013 budget continued this trend <strong>by</strong> slashing $345million in financial assistance for college students and cutting over $1.1billion from higher education funding, yet still including $300 million inbusiness tax cuts. 32Corbett won <strong>of</strong>fice in 2010 with a 22 percent margin <strong>of</strong> supportamong <strong>the</strong> state’s most affluent voters. 33 Corbett raised $4 millionmore than his opponent ($58.4 million vs. $54.4 million). 34 Nearly $7million came from just 92 donations and over $8 million came fromonly three industries.10
The Priorities <strong>of</strong> Lower Income AmericansAre Often Ignored or BlockedWhile low-income Americans are voting at <strong>the</strong> highest rates since <strong>the</strong>mid-1960s, <strong>the</strong>y are still underrepresented in civic life and struggle tobe heard in <strong>the</strong> political process. Low-income voters participated atfar lower levels than affluent voters—as much as 30 percentage pointsless—in <strong>the</strong> 2008 and 2010 elections. While households earning lessthan $15,000 made up 13 percent <strong>of</strong> all households in 2009, <strong>the</strong>sevoters made up just 6 percent <strong>of</strong> <strong>the</strong> electorate in <strong>the</strong> 2008 election. 35According to <strong>the</strong> Census, more than 11 million Americans from householdsmaking under $30,000 reported not voting in <strong>the</strong> 2008 electionand an even greater number, 15 million, didn’t vote in 2010—a yearwhere numerous federal and state representatives won <strong>of</strong>fice explicitlyvowing to reduce spending on policies that benefit lower incomeAmericans. 36 Low-income Americans are even less likely to contributeto political campaigns or engage in a range <strong>of</strong> o<strong>the</strong>r political activities,as detailed fur<strong>the</strong>r in <strong>the</strong> following section.Depressed rates <strong>of</strong> political participation, and <strong>the</strong> huge role <strong>of</strong> moneyin politics, carry major downsides for lower-income populations andis <strong>of</strong> economic consequence given how many low-income Americansand nonvoters depend on government assistance and, more importantly,favor policies to streng<strong>the</strong>n <strong>the</strong> social safety net or create newpathways to <strong>the</strong> middle class. For example, <strong>the</strong> 2008 American NationalElection Study found that 17 percent <strong>of</strong> people who were politicallyinactive received means-tested government benefits, compared to just2 percent <strong>of</strong> campaign contributors. Among those inactives, 59 percentfavored universal health care and 27 percent lacked health insurance.In contrast, just 44 percent <strong>of</strong> campaign contributors favored universalhealthcare and 7 percent had no health insurance. 37The passage <strong>of</strong> <strong>the</strong> Affordable Care Act in 2010 is evidence that <strong>the</strong>U.S. political system does not always ignore <strong>the</strong> interests <strong>of</strong> low-incomeAmericans, and <strong>the</strong>re are o<strong>the</strong>r examples <strong>of</strong> elected leaders beingresponsive to <strong>the</strong> needs <strong>of</strong> this group, such as expansion <strong>of</strong> <strong>the</strong> EarnedIncome Tax Credit. More commonly, though, as documented <strong>by</strong> <strong>the</strong>11
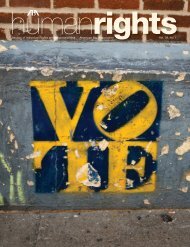
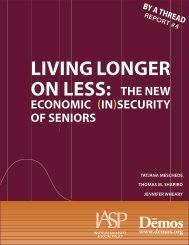
esearch <strong>of</strong> <strong>the</strong> political scientists Martin Gilens and Larry Bartels, <strong>the</strong>priorities <strong>of</strong> low-income Americans tend to be ignored <strong>by</strong> elected leaders—evenwhen those priorities enjoy strong public backing.The minimum wage is a case in point. Despite <strong>the</strong> important role <strong>the</strong>minimum wage plays in economic mobility, Congress has allowed <strong>the</strong>wage to decline steadily in real terms over <strong>the</strong> past four decades.In 2011, 1.7 million workers received <strong>the</strong> minimum wage and roughly2.2 million received below minimum wage. 38 The federal minimumwage was increased to $5.15 per hour in 1997 and stayed at that ratefor 10 years before Congress finally enacted a plan in 2007 to graduallystep up <strong>the</strong> wage <strong>by</strong> about 70 cents a year until it reached $7.25 perhour in 2009. 39 Even with <strong>the</strong> increase, receiving <strong>the</strong> minimum wageand working 40 hours a week for 52 weeks equals gross annual wages<strong>of</strong> only $15,080, which is below <strong>the</strong> poverty line for a 2-person household.40 For tipped workers, <strong>the</strong> minimum wage is even lower. Workersthat regularly receive just $30 per month in tips can be paid a directwage <strong>of</strong> $2.13 per hour. 41 The minimum wage for tipped workers hasnot increased since 1991. 42“...<strong>the</strong> priorities <strong>of</strong> low income Americans tend to be ignored <strong>by</strong> electedleaders—even when those priorities enjoy strong public backing.”Even with <strong>the</strong> series <strong>of</strong> minimum wage increases, adjusting for inflationshows that <strong>the</strong> real value <strong>of</strong> <strong>the</strong> federal minimum wage fellroughly 30 percent since 1968, as shown below in Figure 1. 43 If minimumwage increased at <strong>the</strong> same rate as inflation, it would be equal to$10.55 per hour, far above <strong>the</strong> current $7.25. If <strong>the</strong> minimum wageincreased even just at <strong>the</strong> rate that average wages have increased, itwould be $8.40 per hour. 4412
Figure 1: Real Value <strong>of</strong> <strong>the</strong> Federal Minimum Wage,1968–2012 (in 2012 dollars)$12.00$10.00$8.00$6.00$4.00$2.00$0.00Source: U.S. Department <strong>of</strong> Labor- Wage and Hour Division, Adjusted for inflation with<strong>the</strong> Consumer Price Index19681970197219741976197819801982198419861988199019921994199619982000200220042006200820102012Public support for raising <strong>the</strong> minimum wage is striking. A recent pollfound that nearly three-quarters <strong>of</strong> likely voters (73 percent) support notjust increasing <strong>the</strong> minimum wage to $10 in 2014 but also indexing it toinflation, which would result in automatic increases even absent congressionalaction. 45 Ano<strong>the</strong>r poll found seventy percent <strong>of</strong> likely voters supportedraising <strong>the</strong> minimum wage to $10.38. 46 In fact, a large majority <strong>of</strong><strong>the</strong> general public (78 percent) believes that <strong>the</strong> minimum wage shouldbe high enough so that no family with a full-time worker falls below <strong>the</strong><strong>of</strong>ficial poverty line. 47 In contrast, only 40 percent <strong>of</strong> <strong>the</strong> wealthy supporta minimum wage that keeps a family above <strong>the</strong> poverty line.13
While raising <strong>the</strong> minimum wage is very popular with <strong>the</strong> public andwould confer major benefits on low-income households, it wouldimpose costs on business owners and corporations—groups that arefar better represented in <strong>the</strong> political process. These businesses, orindividuals associated with <strong>the</strong>m, spend significant amounts <strong>of</strong> moneyon elections, whereas minimum wage households rarely make politicalcontributions and certainly do not make large ones.For example, <strong>the</strong> U.S. Chamber <strong>of</strong> Commerce, which strongly opposesraising <strong>the</strong> minimum wage, spent at least $36.1 million directly on electionactivities in <strong>the</strong> 2012 cycle 48 —a fraction <strong>of</strong> <strong>the</strong> money spent <strong>by</strong> <strong>the</strong>corporations associated with <strong>the</strong> Chamber and individuals who workfor <strong>the</strong>m. Candidates, who understand that fundraising is essential to asuccessful campaign, have a significant incentive to oppose raising <strong>the</strong>minimum wage and little or no financial incentive to support it. Thisexample shows how our current campaign finance system allows <strong>the</strong>donor class to set <strong>the</strong> agenda, or, in this case, keep items <strong>of</strong>f <strong>the</strong> agenda.Organizations that oppose raising <strong>the</strong> minimum wage also spent significantlymore money lob<strong>by</strong>ing Congress than did those in support.For example, <strong>the</strong> Chamber spent more than $53 million on lob<strong>by</strong>ing in2007, 49 when <strong>the</strong> minimum wage was last debated in Congress, and $66million in 2011. 50 A number <strong>of</strong> o<strong>the</strong>r business associations – such as<strong>the</strong> Business Roundtable and <strong>the</strong> National Federation <strong>of</strong> IndependentBusinesses—also spend significant sums, as do individual corporationsthat are strongly affected <strong>by</strong> <strong>the</strong> minimum wage law. CVS, a majoremployer <strong>of</strong> low-wage workers with over 7,000 stores nationwide,spent nearly $10 million on lob<strong>by</strong>ing in 2011. Wal-Mart spent $7.8million. 51 All told, “miscellaneous business”—a category that includesbusiness associations, retailers, and manufacturers, but not healthcare,construction, and o<strong>the</strong>r sectors—spent nearly a half billion dollars onlob<strong>by</strong>ing in 2011. That is roughly ten times what all labor unions spenton lob<strong>by</strong>ing that same year. 5214
A close look at <strong>the</strong> data on lob<strong>by</strong>ing expenditures suggests that low-wageworkers, who constitute as much as a fifth <strong>of</strong> <strong>the</strong> U.S. labor force, havevery few paid advocates in <strong>the</strong> corridors <strong>of</strong> Washington. Labor unions<strong>of</strong>ten speak up for <strong>the</strong>se Americans, but o<strong>the</strong>rwise, lob<strong>by</strong>ing <strong>by</strong> groupsthat explicitly advocate for low-wage workers or non-elderly low-incomepeople is so small that it doesn’t even merit its own category in recordscompiled <strong>by</strong> <strong>the</strong> Center for Responsive <strong>Politics</strong>.Data presented in Unheavenly Chorus, a major 2012 study <strong>of</strong> politicalinequality <strong>by</strong> a team <strong>of</strong> political scientists—Kay Schlozman, SidneyVerba, and Henry E. Brady 53 —suggests <strong>the</strong>re is significant organizedinterest activity in Washington on <strong>the</strong> part <strong>of</strong> <strong>the</strong> poor and historicallymarginalized groups. But that activity is negligible in relative terms.Indeed, after analyzing a massive volume <strong>of</strong> organized activity—including $3 billion in spending on lob<strong>by</strong>ing and 12,000 congressionaltestimonies—<strong>the</strong> authors find that “social welfare” and labor organizationaccounted for just 2 percent <strong>of</strong> all activity aimed at influencingpolicymaking. Corporations, along with trade associations and businessgroups, accounted for 48 percent. 54This lob<strong>by</strong>ing imbalance exacerbates <strong>the</strong> problem <strong>of</strong> elected <strong>of</strong>ficialsbeing accountable to wealthy campaign contributors <strong>by</strong> ensuring thatonce in <strong>of</strong>fice, <strong>the</strong>se <strong>of</strong>ficials are exposed to a constant flow <strong>of</strong> informationsupporting <strong>the</strong> donor class’ views and positions.15
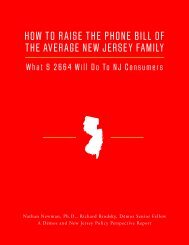
The Affluent Participate More in <strong>Politics</strong>and Civic LifeIt has long been established that affluent Americans participate morein civic life than o<strong>the</strong>r groups. While this gap has narrowed in someareas—most notably voting, with more low-income citizens participating—ithas grown in important ways thanks to changes in campaignfinance law that have enabled <strong>the</strong> affluent to contribute more money tosway elections.In terms <strong>of</strong> participation, surveys show that affluent Americans aremore likely to engage in nearly every kind <strong>of</strong> political activity: <strong>the</strong>yvote at higher rates, contribute more to campaigns, are more likely tocontact an elected representative, join an organized interest group,work for a political candidate, discuss politics with friends, and so on. 55These gaps are documented in The Unheavenly Chorus, which updatessimilar findings in a landmark 1995 study, noting that “unequal politicalvoice is a persistent feature <strong>of</strong> American politics.” 56The scholars explain major differences in civic participation <strong>by</strong> socioeconomicstatus <strong>by</strong> pointing to <strong>the</strong> greater resources that affluentAmericans bring to this sphere, including: knowledge and skills <strong>of</strong>how politics works; money to contribute to campaigns and location insocial networks that can facilitate participation. The affluent also have agreater sense <strong>of</strong> efficacy and are more likely to believe that <strong>the</strong>ir voiceswill be heard in civic life.All forms <strong>of</strong> political participation matter, but voting is among <strong>the</strong>most concrete ways that citizens influence public policy—and <strong>the</strong>wealthier are far more likely to vote. According to <strong>the</strong> Census Bureau,81.6 percent <strong>of</strong> Americans making over $150,000 reported that <strong>the</strong>yvoted in <strong>the</strong> 2008 presidential election. 57 In contrast, roughly half <strong>of</strong>citizens making under $30,000 reported voting. The gap in voter turnoutin 2010 was slightly larger, with affluent citizens voting at rates ashigh as 35 percentage points more than low-income citizens. 58 (Thegap between affluent voters and those making under $50,000 was alsosignificant—roughly 16 percentage points in <strong>the</strong> 2008 election.)16
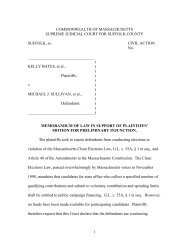
Turnout rates among low-income Americans have increased in recentyears, with <strong>the</strong>se citizens voting at higher levels in recent elections thanat any since <strong>the</strong> mid-1960s, as shown in Figure 2. 59 As a result, <strong>the</strong> ratio<strong>of</strong> affluent voters to low-income voters—has narrowed. The ratio foro<strong>the</strong>r forums <strong>of</strong> political activity has also narrowed in recent years.Still, political participation rates <strong>by</strong> low-income Americans are alarminglylow, and our antiquated voting system contributes to this problem.The system is overly bureaucratic with unnecessarily restrictiveFigure 2:VOTER TURNOUT BY INCOME,2008 US PRESIDENTIAL ELECTION.80.070.072.674.978.160.050.040.059.741.3 41.244.348.054.458.265.930.020.010.00.0TOTALLESS THAN $10,000$10,000 TO $14,999$15,000 TO $19,999$20,000 TO $29,999$30,000 TO $39,999$40,000 TO $49,999$50,000 TO $74,999$75,000 TO $99,999$100,000 TO $149,999$150,000 & OVERSource: US Census Bureau17
egistration procedures, which work to dissuade people from voting. 60Something as simple and common as moving within <strong>the</strong> same statejeopardizes voter eligibility due to registration requirements. Studiesshow that people <strong>of</strong> color, young people, and lower-income peoplemove more <strong>of</strong>ten, leaving <strong>the</strong>m more vulnerable to not being properlyregistered to vote. 61The imbalance in campaign contributions is even more skewed. Just0.07 percent <strong>of</strong> <strong>the</strong> U.S. population made campaign donations <strong>of</strong>$2,500 or more in 2012 (as <strong>of</strong> December 1), yet this group had contributeda total <strong>of</strong> $1.4 billion to both presidential candidates. 62 Incontrast, <strong>the</strong> total haul from a much larger pool <strong>of</strong> donors contributingbetween $200-$2,500 was just $485.7 million. 63 And, contributionsfrom at least 3.7 million small donors who gave less than $200 toPresident Obama and Mitt Romney added up to just $313 million. 64Most donations also come from majority white, wealthy neighborhoods.Over 90 percent <strong>of</strong> donations come from majority white neighborhoodswhile only four, three and less than one percent came fromLatino, African American and Asian neighborhoods respectively. 65“The Adelsons gave more to shape <strong>the</strong>2012 federal elections than all <strong>the</strong> combinedcontributions from residents in 12 states...”The imbalance is even more pronounced when accounting for contributionsto Super PACs. 66 During <strong>the</strong> 2012 election cycle, Sheldonand Miriam Adelson gave a combined $91.8 million to Super PACs. Itwould take more than 322,000 average American families donating anequivalent share <strong>of</strong> <strong>the</strong>ir wealth to match <strong>the</strong> Adelsons’ giving. TheAdelsons gave more to shape <strong>the</strong> 2012 federal elections than all <strong>the</strong>combined contributions from residents in 12 states: Alaska, Delaware,18
Idaho, Maine, Mississippi, Montana, New Hampshire, North Dakota,Rhode Island, South Dakota, Vermont, and West Virginia. 67 AlthoughSuper PACs funded <strong>by</strong> conservatives were widely seen as having limitedimpact in 2012, many <strong>of</strong> <strong>the</strong>se same donors did have a major impactin <strong>the</strong> 2010 election, just two years earlier, which helped secure GOPcontrol <strong>of</strong> <strong>the</strong> House <strong>of</strong> Representatives, as well as state-level victoriesthat enabled Republicans to engage in extensive gerrymandering after<strong>the</strong> 2010 Census.19
The Affluent Have More Influence OverPolicy OutcomesThe affluent don’t just participate more in civic life; <strong>the</strong>y also havegreater influence over public policy. While that fact has long seemedobvious to many Americans, and is indicated in <strong>the</strong> examples discussedin this paper, it is only recently that political scientists have empiricallydocumented <strong>the</strong> extent to which <strong>the</strong> affluent have more say over policyoutcomes.The most important study in this area is <strong>by</strong> <strong>the</strong> political scientist MartinGilens, Affluence and Influence: Economic Inequality and Political Power inAmerica. Gilens looked at public opinion on numerous proposed policiesover <strong>the</strong> past few decades including economic, social, and foreignpolicy issues. By comparing <strong>the</strong> policy preferences <strong>of</strong> different incomegroups with actual policy outcomes, he was able to determine howmuch influence different groups have had over policy. Gilens writes <strong>of</strong>his findings: “The American government does respond to <strong>the</strong> public’spreferences, but that responsiveness is strongly tilted toward <strong>the</strong> mostaffluent citizens. Indeed, under most circumstances, “<strong>the</strong> preferences <strong>of</strong><strong>the</strong> vast majority <strong>of</strong> Americans appear to have essentially no impact onwhich policies <strong>the</strong> government does or doesn’t adopt.” 68 Gilens showsthat, in many cases, public policy outcomes would have been quite differentif Congress and <strong>the</strong> president had been equally responsive to allincome groups.The affluent don’t diverge from ordinary Americans on all issues. Butnotably, Gilens found that “<strong>the</strong> starkest difference in responsiveness to<strong>the</strong> affluent and <strong>the</strong> middle class occurs on economic policy, a consequence<strong>of</strong> high-income Americans’ stronger opposition to taxes andcorporate regulation. . .” 69 In o<strong>the</strong>r words, on core issues <strong>of</strong> how <strong>the</strong>economy works and how fair it is, <strong>the</strong> affluent wield <strong>the</strong> greatest influence.Research <strong>by</strong> <strong>the</strong> political scientist Larry Bartels finds that, in contrastto <strong>the</strong> affluent, low-income Americans have little or any influenceover policy outcomes. As he writes in his 2008 study Unequal Democracy“<strong>the</strong> preferences <strong>of</strong> people in <strong>the</strong> bottom third <strong>of</strong> <strong>the</strong> income distributionhave no apparent impact on <strong>the</strong> behavior <strong>of</strong> <strong>the</strong>ir elected <strong>of</strong>ficials.” 7020
The tilted scales <strong>of</strong> influence are especially significant given <strong>the</strong> impact<strong>of</strong> economic policy in <strong>the</strong> lives <strong>of</strong> different income groups and people<strong>of</strong> color. As <strong>the</strong> graph below shows, <strong>the</strong> majority <strong>of</strong> African Americansand nearly half <strong>of</strong> Latino Americans earn too little to impact <strong>the</strong>irelected representatives.Figure 3: Share <strong>of</strong> U.S. Households in <strong>the</strong> Lowest Third <strong>of</strong> Income Distribution53% <strong>of</strong> African Americans45% <strong>of</strong> Latino Americans32% <strong>of</strong> White Americans30% <strong>of</strong> Asian AmericansSource: Dēmos calculations <strong>of</strong> Current Population SurveyPoorer Americans have <strong>the</strong> least influence over elected <strong>of</strong>ficials eventhough <strong>the</strong>ir basic financial security and opportunities for advancementare highly contingent on government policies, such as <strong>the</strong> quality <strong>of</strong>public education and availability <strong>of</strong> college grants, rules on collectivebargaining, minimum wage and overtime, options for public transportationand affordable housing, not to mention healthcare, tax credits tosupplement low-wage work, and more. Affluent Americans’ economicsuccess is also contingent on government policies in ways that are lessvisible but can powerfully reinforce advantage, especially through taxexpenditures, bankruptcy laws, trade regimes, monetary policy andfinancial regulation.21
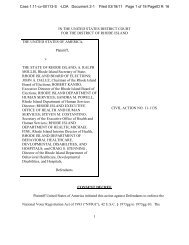
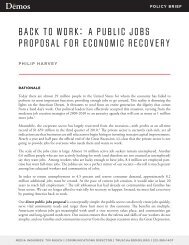
Thanks to <strong>the</strong>ir outsized clout, affluent Americans have <strong>of</strong>ten securedpreferential public policy changes that are not popular with <strong>the</strong> generalpublic. A prime example is <strong>the</strong> successful campaign over <strong>the</strong> past twodecades to lower taxes on capital gains and dividends, and keep <strong>the</strong>rates low. Income from capital gains and dividends are highly concentratedamong <strong>the</strong> affluent. The Center on Budget and Policy Prioritieshas estimated that in 2012, <strong>the</strong> top 1 percent <strong>of</strong> households received 71percent <strong>of</strong> all capital gains. 71Polls have long shown that a majority <strong>of</strong> Americans think that capitalgains should be taxed at <strong>the</strong> same rate as income. 72 More broadly, mostpeople think <strong>the</strong> rich should generally pay more in taxes. 73 The BuffettRule, President Obama’s proposal to raise taxes on wealthy individualswho receive much <strong>of</strong> <strong>the</strong>ir income from investments, is strongly supported<strong>by</strong> <strong>the</strong> public. 74Figure 4: MAXIMUM TAX RATES ON CAPITAL GAINS & ORDINARYINCOME, 1954–2013100%90%80%70%60%50%40%30%20%10%0%Ordinary Income Tax Rate1954195819621966197019741978198219861990199419982002200620102013Source: Department <strong>of</strong> <strong>the</strong> Treasury and Joint Committee on Taxation22
Yet, despite broad citizen opposition to <strong>the</strong> idea <strong>of</strong> lowering taxes on <strong>the</strong> wealthy,Congress has taken repeated action to lower <strong>the</strong> capital gains tax rate. It loweredtaxes on capital gains in 1997, again in 2001, and once more in 2003. (Congress alsosharply cut <strong>the</strong> top rate on dividend income in 2003.) As a result <strong>of</strong> <strong>the</strong>se changes,<strong>the</strong> tax rate on capital gains reached a near-record low during <strong>the</strong> late 1990s upthrough 2012. The top tax rate for capital gains was increased at <strong>the</strong> end <strong>of</strong> 2012to 20 percent, as part <strong>of</strong> <strong>the</strong> “fiscal cliff ” deal. 75 Figure 4 plots <strong>the</strong> increases anddecreases in <strong>the</strong> capital gains tax rate, concluding with <strong>the</strong> current rate <strong>of</strong> 20 percent.The small percentage <strong>of</strong> households that benefit from a low capital gains tax ratehappens to overlap almost perfectly with <strong>the</strong> “donor class,” <strong>the</strong> wealthy individualswho comprise a tiny percentage <strong>of</strong> <strong>the</strong> public and yet account for <strong>the</strong> majority <strong>of</strong>campaign donations. 76 Of those who contribute more than $200 to a campaign, 85percent have annual household incomes <strong>of</strong> $100,000 or more. An annual income <strong>of</strong>$100,000 puts a household in <strong>the</strong> top 20 percent <strong>of</strong> income earners—<strong>the</strong> same class“The small percentage <strong>of</strong> householdsthat benefit from a low capital gains taxrate happens to overlap almost perfectlywith <strong>the</strong> ‘donor class’...”that receives 94 percent <strong>of</strong> capital gains. 77 Keeping <strong>the</strong> capital gains rate low is also<strong>the</strong> top tax priority for <strong>the</strong> U.S. Chamber <strong>of</strong> Commerce and o<strong>the</strong>r business groups. 78In 2011 and 2012, in addition to <strong>the</strong> Chamber, over 80 interests lobbied on <strong>the</strong>House bill to make <strong>the</strong> preferential capital gains tax rate permanent. 79Affluent Americans with taxable capital gains are not just better represented <strong>by</strong> lob<strong>by</strong>istsin Washington; <strong>the</strong>y also are disproportionately represented in today’s electoratebecause <strong>the</strong>y vote at much higher rates, as we discuss above. In 2009, householdsmaking over $100,000 constituted 20 percent <strong>of</strong> all households in <strong>the</strong> U.S.—yetvoters from such households made up 26 percent <strong>of</strong> <strong>the</strong> electorate in 2008. 8023
The Wealthy Have More Ways toShape <strong>Politics</strong>The affluent have always participated more politically and corporationshave always sought to shape public policy, but one difference today isthat wealthy interests have more ways to amplify <strong>the</strong>ir voices in civiclife. In particular, <strong>the</strong> breakdown <strong>of</strong> <strong>the</strong> U.S. campaign finance system,especially since <strong>the</strong> Citizens United ruling, has allowed <strong>the</strong>se interests notjust to contribute greater sums <strong>of</strong> money to sway elections, but alsoto do so anonymously—which is appealing to many corporate donors.Even before Citizens United and <strong>the</strong> rise <strong>of</strong> Super PACs, money wasfinding new ways into <strong>the</strong> electoral process thanks to creatively structured527 and 501(c)4 groups.“Corporations and business groups spendvastly more on lob<strong>by</strong>ing than organizationsthat represent large constituencies <strong>of</strong>ordinary Americans.”One <strong>of</strong> <strong>the</strong> most successful and adaptive <strong>of</strong> such groups in recenttimes is <strong>the</strong> Club for Growth, which has sought to move <strong>the</strong> RepublicanParty rightward on economic and fiscal policy with funding fromwealthy individuals and businesses. The Club has operated throughseveral different legal structures since its founding in 1999, including a501(c)4, a regular Political Action Committee, a 527, and most recentlyas a Super PAC. In 2012, <strong>the</strong> Club spent $20.3 million influencingelectoral races. 81In addition, <strong>the</strong> wealthy and business interests exercise outsized influenceover policy making through lob<strong>by</strong>ing. Corporations and businessgroups spend vastly more on lob<strong>by</strong>ing than organizations that representlarge constituencies <strong>of</strong> ordinary Americans. For example, <strong>the</strong> U.S.Chamber <strong>of</strong> Commerce has spent $886 million on lob<strong>by</strong>ing <strong>the</strong> federalgovernment between 1998 and 2012—compared to $518 million <strong>by</strong>24
all labor unions. The top three healthcare industry groups in Washington—representingdoctors, hospitals, and drugmakers—spent threetimes as much on lob<strong>by</strong>ing during this period as AARP. 82The lob<strong>by</strong>ing <strong>of</strong> elected <strong>of</strong>ficials and policymakers, while hardly newto Washington, is now bankrolled at a much higher level and lob<strong>by</strong>istshave become more sophisticated at pulling different levers <strong>of</strong> power toinfluence policy outcomes. For example, to block full implementation<strong>of</strong> <strong>the</strong> Dodd-Frank law reforming Wall Street, <strong>the</strong> financial industryhas increasingly turned to <strong>the</strong> courts to challenge <strong>the</strong> cost-benefitanalyses <strong>of</strong> proposed rules. 83 A well-financed and novel legal challengewas also mounted against <strong>the</strong> Affordable Care Act, and even though<strong>the</strong> Supreme Court upheld <strong>the</strong> law, industry groups have continued tobankroll efforts to block implementation <strong>of</strong> <strong>the</strong> law at <strong>the</strong> state level. 84In addition, wealthy interests have become more adept at influencingelections and <strong>the</strong> policy process through spending on legal groups,think tanks, and “Astroturf ” advocacy organizations—an investment<strong>the</strong>y have made for decades, far before progressive interests beganto do so. 85 Seemingly neutral public policy organizations, such as <strong>the</strong>Competitive Enterprise Institute and <strong>the</strong> Employment Policies Institute,provide wealthy individuals and corporations with a vehicle forproducing scholarship and publications that bolsters <strong>the</strong>ir viewpoints.Many <strong>of</strong> <strong>the</strong>se same interests also fund organizations like Freedom-Works and <strong>the</strong> Consumer Rights League that work to create grassrootssupport for policy change—or, in some cases, <strong>the</strong> illusion <strong>of</strong> suchsupport. A single public relations firm led <strong>by</strong> Rick Berman has creatednumerous Astroturf groups and initiatives recent years on behalf <strong>of</strong>wealthy interests. 8625
26Finally, wealthy interests have mastered new strategies for influencingpublic policy at <strong>the</strong> state level. These include introducing and financingballot initiatives, pumping unprecedented sums <strong>of</strong> money into judicialelections, financing state think tanks and Astroturf groups, and choreographinglegislative victories through <strong>the</strong> American Legislative ExchangeCouncil (ALEC). State-based efforts to shape <strong>the</strong> make-up <strong>of</strong> <strong>the</strong> votingelectorate, <strong>by</strong> financing voter suppression groups like True <strong>the</strong> Vote, caninfluence outcomes at <strong>the</strong> national, state, and local level. Such effortshave become more widespread and sophisticated in recent years, withfunding from various wealthy interests. In North Carolina, <strong>the</strong> conservativemultimillionaire Art Pope has employed a variety <strong>of</strong> different fundingstrategies to become one <strong>of</strong> <strong>the</strong> influential individuals in that state. 87
Political and Economic Inequality AreMutually ReinforcingGrowing economic inequality is typically blamed on structural changesin <strong>the</strong> economy, such as globalization. But it is becoming ever clearerthat <strong>the</strong> tilted playing field <strong>of</strong> U.S. politics, with affluent voices speakingmost loudly, is itself a driver <strong>of</strong> inequality. Most notably, successfullob<strong>by</strong>ing efforts <strong>by</strong> wealthy interests to lower taxes on capital gainsand dividends since <strong>the</strong> mid-1990s—and <strong>the</strong>n keep <strong>the</strong>m low—hasexacerbated income inequality. Indeed, as a study <strong>by</strong> <strong>the</strong> CongressionalResearch Service found, looking at <strong>the</strong> period between 1996 and 2006,“Changes in capital gains and dividends were <strong>the</strong> largest contributor to<strong>the</strong> increase in <strong>the</strong> overall income inequality” between 1996 and 2006. 88Likewise, a rolling back <strong>of</strong> regulations in ways favored <strong>by</strong> influentialbusiness interests has stripped away key protections for <strong>the</strong> middleclass and made it harder for lower income groups to get ahead—withan explosion <strong>of</strong> usurious or predatory lending as a prime example. And<strong>the</strong> deeply negative effects <strong>of</strong> globalization on non-college workers, so<strong>of</strong>ten seen as an inevitable tectonic shift, has been greatly exacerbated<strong>by</strong> <strong>the</strong> preferences <strong>of</strong> an affluent elite which has promoted and benefittedfrom trade arrangements—even as o<strong>the</strong>r groups <strong>of</strong> Americanshave suffered economic harm. In <strong>the</strong>ir book Winner-Take-All <strong>Politics</strong>,<strong>the</strong> political scientists Jacob Hacker and Paul Pierson broadly arguethat inequality is largely <strong>the</strong> result <strong>of</strong> public policy decisions that reflectundue influence <strong>by</strong> <strong>the</strong> wealthy over <strong>the</strong> U.S. political system.“Over recent decades, <strong>the</strong> wealthy havetranslated <strong>the</strong>ir wealth into political cloutand used that clout to increase <strong>the</strong>ir wealth.”Economic and political inequality work to reinforce each o<strong>the</strong>r. Overrecent decades, <strong>the</strong> wealthy have translated <strong>the</strong>ir wealth into politicalclout, and used that clout to increase <strong>the</strong>ir wealth—which in turnhas fur<strong>the</strong>r increased <strong>the</strong>ir ability to secure yet more special treatment27
through public policy. Among o<strong>the</strong>r things, rising economic inequalityhas both expanded <strong>the</strong> assets in <strong>the</strong> hands <strong>of</strong> <strong>the</strong> wealthy and increased<strong>the</strong> overall number <strong>of</strong> wealthy people in <strong>the</strong> U.S. who have <strong>the</strong> capacityto sway politics at ei<strong>the</strong>r <strong>the</strong> national, state, or local level—financingcandidates, ballot initiatives, or <strong>the</strong>ir own political careers. In 1982,<strong>the</strong> first Forbes 400 list <strong>of</strong> <strong>the</strong> 400 richest Americans included just 13billionaires and individuals with less than $100 million made <strong>the</strong> list. In2012, that list was exclusively made up <strong>of</strong> billionaires. The combinednet worth <strong>of</strong> <strong>the</strong> Forbes 400 in 2012 was equal to 11 percent <strong>of</strong> GDP,up from 2.8 percent in 1982. 89At <strong>the</strong> same time, <strong>the</strong> upward shift in income has led to a hugeexpansion <strong>of</strong> those Americans earning above $200,000. This massaffluence at <strong>the</strong> top <strong>of</strong> <strong>the</strong> income ladder, even as <strong>the</strong> middle classhas hollowed out and poverty has risen, has also—in conjunctionwith higher turnout voter rates among <strong>the</strong> affluent—created a muchlarger block <strong>of</strong> campaign donors and well-to-do voters. In <strong>the</strong> 1992election, for example, 6,341Americans contributed over $10,000 topolitical candidates and parties according <strong>the</strong> Center for Responsive<strong>Politics</strong>. In 2008, <strong>the</strong>re were 36,299 people who could afford to, anddid, give at that same level. 90Perhaps most troubling is <strong>the</strong> way that wealthy interests have used <strong>the</strong>irresources to block reforms aimed at reducing political inequality—orbankrolled efforts to suppress voting <strong>by</strong> low-income Americans. Forexample, <strong>the</strong> U.S. Chamber <strong>of</strong> Commerce has repeatedly deployed itslob<strong>by</strong>ing muscle to oppose campaign finance reform measures. Mostrecently, <strong>the</strong> Chamber helped defeat legislation that would require independentgroups engaged in political activity to reveal <strong>the</strong>ir donors. 91The American Legislative Exchange Council, largely funded <strong>by</strong> business,played a significant role in helping pass voter ID laws in numerousstates in 2011—laws that undermine participation <strong>by</strong> low-incomecitizens without photo ID. 9228
CONCLUSIONThere are three obvious remedies to political inequality: One, reduce<strong>the</strong> economic inequality that fuels such a large concentration <strong>of</strong> civicpower in <strong>the</strong> hands <strong>of</strong> <strong>the</strong> wealthy; two, reduce <strong>the</strong> influence <strong>of</strong> bigmoney in politics; and three draw more ordinary people into civic lifeas a counterbalance to concentrated wealth.The first remedy is largely contingent on <strong>the</strong> o<strong>the</strong>r two, and vice versa.It is hard for <strong>the</strong> political system to reduce inequality as long as thatsystem is dominated <strong>by</strong> wealthy interests. Yet reducing political inequalityis difficult—particularly, getting money out <strong>of</strong> politics—when thosewho benefit from inequality have <strong>the</strong> clout to block such reforms andthose on <strong>the</strong> losing end feel hopeless or are preoccupied with trying toget <strong>by</strong>.Moreover, some recent trends have made <strong>the</strong> situation worse. Economicinequality rose in <strong>the</strong> aftermath <strong>of</strong> <strong>the</strong> financial crisis as <strong>the</strong>wealthy benefitted from a resurgent stock market and record corporatepr<strong>of</strong>its even as most Americans experienced declining wealthand stagnant incomes. At <strong>the</strong> same time, political inequality has beenexacerbated <strong>by</strong> <strong>the</strong> Citizens United ruling that has allowed corporationsand wealthy individuals to pump even larger sums <strong>of</strong> money into elections.While many restrictive voter ID laws and o<strong>the</strong>r vote suppressionefforts were blocked <strong>by</strong> <strong>the</strong> courts or <strong>the</strong> Department <strong>of</strong> Justice in2012 93 , existing and future efforts at voter suppression pose obstaclesto expanding participation <strong>by</strong> low-income citizens.Any comprehensive effort to create a more balanced society, one where<strong>the</strong> deck isn’t stacked in favor <strong>of</strong> <strong>the</strong> wealthy, must achieve progress infour main areas: restricting <strong>the</strong> influence <strong>of</strong> money in politics; increasingcivic participation; making corporations accountable to a broaderarray <strong>of</strong> stakeholders and promoting a stronger and more diversemiddle class.29
Limit Money in <strong>Politics</strong>One critical way to reduce <strong>the</strong> disproportionate influence <strong>of</strong> <strong>the</strong>wealthy on public policy is to create a system for financing electioncampaigns that lives up to <strong>the</strong> idea <strong>of</strong> one-person, one-vote <strong>by</strong> leveling<strong>the</strong> playing field between rich and poor and giving every American astrong voice. Such a system requires several key reforms:• Amend <strong>the</strong> U.S. Constitution to restore <strong>the</strong> ability <strong>of</strong> <strong>the</strong> peopleto enact common-sense, content-neutral restrictions on politicalcontributions and spending to promote political equality. Congressshould propose an amendment or package <strong>of</strong> amendments to <strong>the</strong>U.S. Constitution to clarify that <strong>the</strong> First Amendment was neverintended as a tool for use <strong>by</strong> corporations and <strong>the</strong> wealthy to dominate<strong>the</strong> political arena.• Enact strict limits on <strong>the</strong> amount that wealthy individuals andinterests can contribute and spend on U.S. politics. Millionaires,billionaires, and large corporations have no inherent right to drownout <strong>the</strong> voices <strong>of</strong> <strong>the</strong> rest <strong>of</strong> <strong>the</strong> population. After amending <strong>the</strong>Constitution or educating <strong>the</strong> next generation <strong>of</strong> Justices, Congressand states should sharply limit contributions and spending to level<strong>the</strong> playing field for all Americans.• Match small contributions with public resources to empower smalldonors and help grassroots candidates run viable campaigns. Lowdollarcontributions from constituents should be matched withpublic funds, and candidates who demonstrate <strong>the</strong>ir ability to mobilizesupport in <strong>the</strong>ir districts should receive a public grant to kickstart<strong>the</strong>ir campaigns. These measures would amplify <strong>the</strong> voices <strong>of</strong>non-wealthy citizens, encourage average Americans to participate incampaigns, change candidate incentives, and enable aspiring publicservants without access to big-money networks to run viable campaignsfor federal <strong>of</strong>fice.• Encourage small political contributions <strong>by</strong> providing vouchers ortax credits. Encouraging millions <strong>of</strong> average-earning Americansto make small contributions can help counterbalance <strong>the</strong> influence30
<strong>of</strong> <strong>the</strong> wealthy few. Several states provide refunds or tax creditsfor small political contributions, and <strong>the</strong> federal tax code did <strong>the</strong>same between 1972 and 1986. Past experience suggests that a welldesignedprogram can motivate more small donors to participate.An ideal program would provide vouchers to citizens up front,eliminating disposable income as a factor in political giving.• Require greater transparency around political spending. Congressshould close existing loopholes in disclosure laws so that all moneyspent to influence U.S. elections (above a reasonable threshold) canbe traced back to its original source. Allowing citizens to “follow<strong>the</strong> money” would help voters make informed choices and preventwealthy interests from sponsoring nasty or misleading adds whileinsulated from public accountability.• Streng<strong>the</strong>n rules governing lob<strong>by</strong>ing to reduce <strong>the</strong> influence <strong>of</strong>well-heeled special interests. Congress should streng<strong>the</strong>n disclosurearound lob<strong>by</strong>ing and implement stronger revolving door limits thatprevent former elected <strong>of</strong>ficials from approaching former colleaguesfor several years.Protect and Expand <strong>the</strong> Freedom to VoteA legitimate government “<strong>of</strong> <strong>the</strong> people, <strong>by</strong> <strong>the</strong> people, and for <strong>the</strong>people” 94 must vigorously promote and protect <strong>the</strong> freedom to vote sothat all eligible persons can participate in self-government. But today,too many bureaucratic barriers still block <strong>the</strong> ability <strong>of</strong> millions <strong>of</strong> eligiblepersons to register and vote, and too many politicians are activelyseeking to shrink <strong>the</strong> electorate with unnecessary and discriminatoryrestrictions on political participation. Reversing this trend entails:• Remove Barriers to Registration and VotingVoter registration is a particularly important target for reform,given that almost one <strong>of</strong> four eligible Americans was not registeredto vote in <strong>the</strong> period leading up to <strong>the</strong> 2012 elections. In particular,<strong>the</strong> following should be adopted:31
• Same-Day Registration:Implementing Same Day Voter Registration, which allows eligibleindividuals to register and vote at <strong>the</strong> same time, is a provenmethod to increase participation and turnout among eligiblevoters. 95 States with Same Day Registration record consistentlyhigher voter turnout and participation than states without it. 96• Expand Agency Registration and Automate <strong>the</strong> Registration Process:States should modernize <strong>the</strong> voter registration system to removeadministrative burdens and costs <strong>by</strong> taking <strong>the</strong> initiative to placeeligible voters on <strong>the</strong> registration rolls ra<strong>the</strong>r than leaving <strong>the</strong>burden on individual citizens to navigate <strong>the</strong> voter registrationprocess.• Making Registration Permanent and Portable: Almost 36.5 million USresidents moved between 2011 and 2012. Low-income individualsare twice as likely to move as those above <strong>the</strong> poverty line.Voter registration should become portable and permanent forpersons who move within a state, <strong>by</strong> automatic updates to registrationrecords as citizens change <strong>the</strong>ir address.• Protect Against Intimidation and Wrongful ChallengesStates should put measures in place to protect voters fromintimidation tactics, including clear rules and procedures toprotect voters from improper removal from voting rolls, intimidatingbehavior at polls, and deceptive practices that discouragevoting. 97Make Corporations More Responsive to <strong>the</strong> Public InterestCorporations now define <strong>the</strong>ir goals very narrowly, with nearly anexclusive focus on <strong>the</strong> financial returns to shareholders. This focushelps foster greater inequality as corporations ignore <strong>the</strong> interests <strong>of</strong>workers in pursuit <strong>of</strong> maximum pr<strong>of</strong>its, and also leads business to exertundue influence within <strong>the</strong> political system. Several reforms are neededto create a more responsible private sector.32
• Develop a more reasonable approach to corporate personhood. Corporationsneed to be understood as creations <strong>of</strong> public laws, and not as naturalentities with uncontestable First Amendment rights. Conferringconstitutional rights on corporations makes <strong>the</strong>m less accountableto <strong>the</strong> democracy and <strong>the</strong>ir stakeholders. As long as all <strong>the</strong> rights <strong>of</strong><strong>the</strong> people in corporations are protected, corporations should notbe spending <strong>the</strong>ir commercial winnings to influence <strong>the</strong> politicalprocess.• Corporations should be accountable to a wider array <strong>of</strong> stakeholders.Changes in charter laws could require corporations to be accountableto actors o<strong>the</strong>r than shareholders. Corporations couldbe reformed to adopt <strong>the</strong> model <strong>of</strong> Benefit Corporations (orB-Corps), for example, which are required <strong>by</strong> law to benefit bothsociety and shareholders and to consider how <strong>the</strong>ir decisions affect<strong>the</strong>ir employees, community, and <strong>the</strong> environment. Alternatively,corporate governance could be changed to require greater inputfrom employees and o<strong>the</strong>r affected constituencies. In <strong>the</strong> moreinclusive German system, employees are given seats on corporateboards.• Corporations could be defined in a manner that is more compatible withdemocratic governance. Nonpr<strong>of</strong>it corporations, in exchange for <strong>the</strong>benefits <strong>the</strong>y receive from <strong>the</strong> state, are limited as to <strong>the</strong> types <strong>of</strong>political activity <strong>the</strong>y can engage in. Similar standards could applyto business corporations. At <strong>the</strong> very least, <strong>the</strong>re should be moretransparency around corporate political spending and shareholders,along with o<strong>the</strong>r stakeholders, should have a greater say in howcorporations engage in <strong>the</strong> political process.Reduce Economic InequalityWidely shared prosperity has long been recognized as critical for astrong democracy. When all citizens have a stake in society, <strong>the</strong>y havean incentive to resolve political conflicts through peaceful, democraticmeans. Conversely, when <strong>the</strong> middle class erodes and <strong>the</strong> gulf between33
<strong>the</strong> wealthy and <strong>the</strong> poor widens, politics become more polarized. Thuswhile an inclusive economy can be <strong>the</strong> product <strong>of</strong> democratic politics,it also helps to reinforce democracy. Building a stronger middle classthat fully reflects America’s diversity will require policies that:• Invest in human capital and education. Investing in education andhuman development, ensuring that future generations are wellcared for and well educated, and that working people have <strong>the</strong> time<strong>the</strong>y need to be caregivers to <strong>the</strong> people <strong>the</strong>y love is a key startingpoint for moving millions <strong>of</strong> Americans into <strong>the</strong> middle class. Forexample, employees who need flexibility in <strong>the</strong>ir work lives to carefor a child or o<strong>the</strong>r family member <strong>of</strong>ten face economic hardship.A system <strong>of</strong> family leave insurance – like <strong>the</strong> successful model inCalifornia – would help insure that <strong>the</strong> birth <strong>of</strong> a child no longerleads to poverty. Investing in affordable, high-quality child care andearly education would reduce educational gaps and set <strong>the</strong> groundworkfor success long after school. Finally, <strong>the</strong> nation’s financial aidsystem should be revamped to ensure that every college-qualifiedstudent has access to higher education without taking on ruinousdebt.• Increase employees’ power in <strong>the</strong> workplace. Since <strong>the</strong> 1970s, a growingshare <strong>of</strong> share <strong>of</strong> national income has gone to corporate pr<strong>of</strong>itswhile <strong>the</strong> proportion going to labor compensation has decreased.This shift has greatly accelerated in <strong>the</strong> last decade. To reverse <strong>the</strong>trend, employees need more power in <strong>the</strong> workplace. The bottom<strong>of</strong> <strong>the</strong> labor market should be bolstered <strong>by</strong> raising <strong>the</strong> minimumwage, guaranteeing paid sick days to working people, and ensuringthat worker protections are effective and apply to everyone. At <strong>the</strong>same time, weakened labor laws should be reconstituted so thatAmericans can exercise <strong>the</strong>ir right to organize unions and negotiatefor pay and benefits that will allow <strong>the</strong>m to enter <strong>the</strong> middle class.Finally, <strong>the</strong> U.S. should create a short-term public jobs program andlong-term public investment plan to promote full employment.34
• Use tax policy to streng<strong>the</strong>n and expand <strong>the</strong> middle class. Too <strong>of</strong>ten, <strong>the</strong>nation’s tax policy bolsters <strong>the</strong> already wealthy ra<strong>the</strong>r than supportingAmericans trying to work <strong>the</strong>ir way into <strong>the</strong> middle class. Amore progressive tax system could increase economic mobility andreduce inequality. The Earned Income Tax Credit and <strong>the</strong> ChildTax Credit, which benefit low-income workers and <strong>the</strong>ir families,should be expanded. To ensure that <strong>the</strong> home mortgage tax credi<strong>the</strong>lps middle-class families ra<strong>the</strong>r than subsidizing <strong>the</strong> superwealthy,its value should be capped. Meanwhile taxes on capitalgains and dividends – income which disproportionately flows to<strong>the</strong> wealthiest Americans – should be increased, and corporate taxloopholes should be eliminated. To reduce <strong>the</strong> transfer <strong>of</strong> tremendouswealth from one generation to <strong>the</strong> next, estate taxes should beincreased.• Enable Americans to build assets. Owning assets – from a retirementaccount, to a home, to an emergency savings fund – is crucial tomiddle-class security. Yet American families have lost trillions <strong>of</strong>dollars in home equity as a result <strong>of</strong> <strong>the</strong> housing crash, and one inthree say that if <strong>the</strong>y lost <strong>the</strong>ir jobs, <strong>the</strong>y could not make housingpayments for more than a month. To help distressed homeowners,a new public agency should be established to acquire and refinanceunder-water mortgages. To increase retirement security, SocialSecurity should be safeguarded and supplemented with a system<strong>of</strong> voluntary annuitized pensions that guarantee a minimum rate<strong>of</strong> return. And to ensure that <strong>the</strong> predatory lending that drainspocketbooks is halted, federal usury limits should be established forall forms <strong>of</strong> lending and bankruptcy laws should be rewritten toprovide greater relief to student borrowers and homeowners.35
NOTES1On struggling middle class, see <strong>the</strong> Pew Research Center’s work: http://www.pewsocialtrends.org/2012/08/22/<strong>the</strong>-lost-decade<strong>of</strong>-<strong>the</strong>-middle-class/Onmobility, see research <strong>by</strong> Pew Economic Mobility Project. http://www.pewtrusts.org/uploadedFiles/wwwpewtrustsorg/Reports/Economic_Mobility/Pursuing_American_Dream.pdf2See Citizens Actually United, at http://www.Dēmos.org/publication/citizens-actually-united-bi-partisan-opposition-corporatepolitical-spending-and-support3This body <strong>of</strong> research includes <strong>the</strong> following books: Larry Bartels, Unequal Democracy: The Political Economy <strong>of</strong> <strong>the</strong> New GildedAge (Princeton, NJ: Princeton University Press, 2008); Jacob Hacker and Paul Pierson, Winner-Take-All <strong>Politics</strong>: <strong>How</strong> WashingtonMade <strong>the</strong> Rich Richer—and Turned Its Back on <strong>the</strong> Middle Class (New York: Simon and Schuster, 2010); Martin Gilens,Affluence and Influence: Economic Inequality and Political Power in America (Princeton, NJ: Princeton University Press, 2012); KayLehman Schlozman, Sidney Verba, and Henry E. Brady, The Unheavenly Chorus: Unequal Political Voice and <strong>the</strong> Broken Promise <strong>of</strong>American Democracy (Princeton, NJ: Princeton University Press, 2012);4Benjamin I. Page, Larry M. Bartels, and Jason Seawright, “Democracy and <strong>the</strong> Policy Preferences <strong>of</strong> Wealthy Americans,” Perspectiveson <strong>Politics</strong> 11:1, pp. 51-73.5See, for example, <strong>the</strong> research studies on <strong>the</strong> benefits <strong>of</strong> unions <strong>by</strong> <strong>the</strong> Center for Economic and Policy Research. http://www.cepr.net/index.php/<strong>the</strong>-benefits-<strong>of</strong>-unionization/6See State <strong>of</strong> American Political Ideology, 2009, at http://www.americanprogress.org/wp-content/uploads/issues/2009/03/pdf/political_ideology.pdf7See Americans Want Next President to Prioritize Jobs, Corruption, at http://www.gallup.com/poll/156347/americans-next-president-prioritize-jobs-corruption.aspx8See Presidential: Full Race, at http://www.cnn.com/election/2012/results/race/president#exit-polls9See The Economist/YouGov Poll September 29 – October 1, 2012 at http://cdn.yougov.com/cumulus_uploads/document/xbqkxc7r1n/econTabReport.pdf10See Bureau <strong>of</strong> Labor Statistics, Table A-4. Employment status <strong>of</strong> <strong>the</strong> civilian population 25 years and over <strong>by</strong> educational attainment,at http://www.bls.gov/news.release/empsit.t04.htm11See Gilens, p. 120.12See Exit Polls, at http://www.cnn.com/ELECTION/2010/results/polls/#val=FLG00p113See In Tallahassee, Breaks for Business. Families? Not So Much, at http://fcir.org/2012/03/12/in-tallahassee-breaks-for-businessfamilies-not-so-much/14See Florida’s Great Cost Shift: <strong>How</strong> Higher Education Cuts Undermine Its Future Middle Class, at http://www.Dēmos.org/publication/florida%E2%80%99s-great-cost-shift-how-higher-education-cuts-undermine-its-future-middle-class15See id.16See Lob<strong>by</strong>ing pays <strong>of</strong>f big for business in Florida's 2012 session, at http://www.tampabay.com/news/business/lob<strong>by</strong>ing-pays-<strong>of</strong>f-bigfor-business-in-floridas-2012-session/121953617See Rick Scott Net Worth, at http://www.<strong>the</strong>richest.org/celebnetworth/business/ceo/rick-scott-net-worth/18See 2010 Florida governor candidates’ campaign contributions, at http://www.bizjournals.com/southflorida/datacenter/2010-florida-governor-candidates.html?appSession=760217951602170&RecordID=&PageID=2&PrevPageID=2&cpipage=1&CPISortType=asc&CPIorderBy=Contribution_amount19See Florida Republican Scott Elected Governor After Record Spending, at http://www.bloomberg.com/news/2010-11-03/floridarepublican-scott-elected-governor-after-record-spending.html20See Tallahassee corporate interests pick up much <strong>of</strong> $3 million inaugural tab, at http://www.tampabay.com/news/business/corporate/article1143352.ece21See Scott Campaign Pulls in Big Money, at http://www.<strong>the</strong>ledger.com/article/20120429/COLUMNISTS0302/120429242?p=all&tc=pgall22See Let’s Get to Work, Contributions, at http://www.letsgettowork.net/?page_id=336
23See CNN EXIT POLLS – NEW JERSEY GOVERNOR, at http://i2.cdn.turner.com/cnn/2009/images/11/04/2009.exit.polls.-.nj.gov.pdf24See Contributions to CHRISTIE CHRIS & GUADAGNO, KIM, at http://follow<strong>the</strong>money.org/database/StateGlance/contributor_details.phtml?&c=113414&s=NJ&y=2009&summary=0&so=a&p=1#sorttable25See New Jersey gives $347M in business tax cuts bipartisan support, at http://www.northjersey.com/news/State_give_business_tax_cuts_bipartisan_support.html?page=all and The Governor’s FY 2013 Budget Budget Summary, at http://www.state.nj.us/treasury/omb/publications/13bib/BIB.pdf26See Gov. Christie Hands Out Record Amount Of Corporate Tax Giveaways, Gets Few Jobs In Return, at http://thinkprogress.org/economy/2012/04/05/459296/christie-corporate-tax-giveaways/27See Christie By The Numbers, at http://www.onenewjersey.org/christie-<strong>by</strong>-<strong>the</strong>-numbers/#program28See N.J. judge finds Christie's cuts to school aid unconstitutional, at http://www.northjersey.com/news/032211_Judge_Christie_budget_cuts_.html?page=all29See Poll: Majority <strong>of</strong> N.J. voters oppose Gov. Christie's education cuts, teacher merit pay, at http://www.nj.com/news/index.ssf/2010/11/poll_majority_<strong>of</strong>_nj_voters_opp.html30See Pennsylvania state budget, at http://sunshinereview.org/index.php/Pennsylvania_state_budget31See $2 Billion in Business Tax Breaks Come at Expense <strong>of</strong> Schools, Communities, at http://pennbpc.org/2-billion-business-taxbreaks-come-expense-schools-communities32See Corbett signs $27.65 billion budget with minutes to spare, at http://articles.philly.com/2012-07-03/news/32509089_1_corbett-signs-school-vouchers-state-budget33See Exit Polls, at http://www.cnn.com/ELECTION/2010/results/polls/#val=PAG00p134See CORBETT, TOM & CAWLEY, JIM, at http://follow<strong>the</strong>money.org/database/StateGlance/candidate.phtml?c=12388335See id.36See Voting and Registration in <strong>the</strong> Election <strong>of</strong> November 2008 – Detailed Tables, at http://www.census.gov/hhes/www/socdemo/voting/publications/p20/2008/tables.html37See The Unheavenly Chorus, 127-28.38See Characteristics <strong>of</strong> Minimum Wage Workers: 2011, at http://www.bls.gov/cps/minwage2011.htm39See Federal Minimum Wage Increase for 2007, 2008, & 2009, at http://www.laborlawcenter.com/t-federal-minimum-wage.aspx40See 200 Tax Table, at http://www.irs.gov/pub/irs-pdf/i1040tt.pdf41See United States Department <strong>of</strong> Labor, Wages, at http://www.dol.gov/dol/topic/wages/wagestips.htm#.UIBwRa6s3jg42See Restoring <strong>the</strong> Minimum Wage for America’s Tipped Workers, at http://nelp.3cdn.net/bff44d5fafbd9d2175_vem6ivjjb.pdf43See Restore <strong>the</strong> Minimum Wage, at http://www.raise<strong>the</strong>minimumwage.com/facts/entry/amount-with-inflation/44See Securing <strong>the</strong> wage floor, at http://www.epi.org/publication/bp177/45See Public Support for Raising <strong>the</strong> Minimum Wage, at http://nelp.3cdn.net/0be1c6315f2430afa6_arm6bq9wu.pdf46See New Poll <strong>by</strong> John Zog<strong>by</strong> Finds 70% <strong>of</strong> Likely Voters Would Support Legislation to Raise <strong>the</strong> Minimum Wage, at http://www.timeforaraise.org/2012/06/22/new-poll-<strong>by</strong>-john-zog<strong>by</strong>-finds-70-<strong>of</strong>-likely-voters-would-support-legislation-to-raise-<strong>the</strong>-minimumwage/47See Bartels, et.al, supra note 4, p. 4248See Open Secrets, US Chamber <strong>of</strong> Commerce, at http://www.opensecrets.org/outsidespending/detail.php?cmte=US+Chamber+<strong>of</strong>+Commerce&cycle=201249See Open Secrets, US Chamber <strong>of</strong> Commerce Lob<strong>by</strong>ing 2007, at http://www.opensecrets.org/lob<strong>by</strong>/clientsum.php?id=D000019798&year=200737
50See Open Secrets, Lob<strong>by</strong>ing: Top Spenders 2011, at http://www.opensecrets.org/lob<strong>by</strong>/top.php?showYear=2011&indexType=s51See Open Secrets, Lob<strong>by</strong>ing: Retail sales, at http://www.opensecrets.org/lob<strong>by</strong>/indusclient.php?id=N03&year=201152See Open Secrets, Lob<strong>by</strong>ing: Ranked Sectors, at http://www.opensecrets.org/lob<strong>by</strong>/top.php?showYear=2011&indexType=c53See The Unheavenly Chorus, p. 6.54The Unheavenly Chorus, p. 431.55See Kay Lehman Schlozman, Sidney Verba, and Henry E. Brady, The Unheavenly Chorus: Unequal Political Voice and <strong>the</strong> BrokenPromise <strong>of</strong> American Democracy (Princeton, NJ: Princeton University Press, 2012), p. 136.56See The Unheavenly Chorus, p. 6.57See Voting and Registration in <strong>the</strong> Election <strong>of</strong> November 2008 – Detailed Tables, at http://www.census.gov/hhes/www/socdemo/voting/publications/p20/2008/tables.html58See Voting and Registration in <strong>the</strong> Election <strong>of</strong> November 2010 – Detailed Tables, at http://www.census.gov/hhes/www/socdemo/voting/publications/p20/2010/tables.html59See The Unheavenly Chorus, p. 153-155, 164.60See Protecting <strong>the</strong> Freedom to Vote: The Voter Empowerment Act <strong>of</strong> 2012, at http://www.Dēmos.org/publication/protecting-freedom-vote-voter-empowerment-act-201261See Democracy In A Mobile America, at http://www.Dēmos.org/publication/democracy-mobile-america-062See Open Secrets, 2012 Overview—Donor Demographics, at http://www.opensecrets.org/overview/donordemographics.php63See id.64See Election Spending 2012: Post-Election Analysis <strong>of</strong> Federal Election Commission Data , at http://www.Dēmos.org/publication/election-spending-2012-post-election-analysis-federal-election-commission-data65See Communities <strong>of</strong> Color Donate Far Less to Presidential Campaign, at http://www.policyshop.net/home/2012/11/5/communities<strong>of</strong>-color-donate-far-less-to-presidential-campaig.html66See Election Spending 2012: Post-Election Analysis <strong>of</strong> Federal Election Commission Data, at http://www.Dēmos.org/publication/election-spending-2012-post-election-analysis-federal-election-commission-data67See Open Secrets, Contributions <strong>by</strong> State, at http://www.opensecrets.org/overview/statetotals.php68See Gilens, p. 1.69See Gilens, p. 101.70See Bartels, Unequal Democracy, p. 285.71See Raising Today’s Low Capital Gains Tax Rates Could Promote Economic Efficiency and Fairness, While Helping Reduce Deficits, athttp://www.cbpp.org/cms/index.cfm?fa=view&id=383772See Poll: Partisan Split Over Tax Policies, at http://<strong>the</strong>caucus.blogs.nytimes.com/2012/01/24/poll-partisan-split-over-taxpolicies/?partner=rssnyt&emc=rss73See Public Opinion on Taxes: 1937 to Today, at http://www.aei.org/files/2012/04/09/-aei-public-opinion-study-on-taxes-2012_082833686158.pdf74See CNN/ORC Poll- April 2012, at http://i2.cdn.turner.com/cnn/2012/images/04/16/rel4c.pdf75See Capital Gains and Dividends: <strong>How</strong> are capital gains taxed?, at http://www.taxpolicycenter.org/briefing-book/key-elements/capital-gains/how-taxed.cfm, http://www.taxpolicycenter.org/UploadedPDF/412730-Tax-Provisions-in-ATRA.pdf76See The Donor Class: Campaign Finance, Democracy, and Participation, at http://papers.ssrn.com/sol3/Delivery.cfm/SSRN_ID663562_code283370.pdf?abstractid=569021&mirid=177See Tax Policy Center, Income Breaks, at http://taxpolicycenter.org/numbers/displayatab.cfm?DocID=297078See U.S. Chamber <strong>of</strong> Commerce, Policy Priorities for 2012, at http://www.uschamber.com/issues/priorities/taxes38
79See Open Secrets, Clients lob<strong>by</strong>ing on H.R.3091: To make permanent <strong>the</strong> individual income tax rates for capital gains and dividends, athttp://www.opensecrets.org/lob<strong>by</strong>/billsum.php?id=12847880See Table 690. Money Income <strong>of</strong> Households—Percent Distribution <strong>by</strong> Income Level, Race, and Hispanic Origin, in Constant (2009)Dollars: 1990 to 2009, at http://www.census.gov/compendia/statab/2012/tables/12s0690.pdf; See also, Exit Polls, at http://www.cnn.com/ELECTION/2008/results/polls/#USP00p181See Open Secrets, Club for Growth, at http://www.opensecrets.org/outsidespending/detail.php?cmte=Club+for+Growth&cycle=201282See Open Secrets, Lob<strong>by</strong>ing: Top Spenders 1998-2012, at http://www.opensecrets.org/lob<strong>by</strong>/top.php?indexType=s83See Judge Strikes Down a Dodd-Frank Trading Rule, at http://dealbook.nytimes.com/2012/09/28/judge-strikes-down-doddfrank-trading-rule/84See Health care lob<strong>by</strong>ing groups head to <strong>the</strong> Supreme Court, at http://reporting.sunlightfoundation.com/2012/health-care-lob<strong>by</strong>ing-groups-take-supreme-court/85See History <strong>of</strong> <strong>the</strong> Conservative Movement, at http://agendaproject.org/History_<strong>of</strong>_<strong>the</strong>_Conservative_Movement.pdf86See Meet Rick Berman, A.K.A. "Dr. Evil", at http://www.cbsnews.com/stories/2007/04/05/60minutes/main2653020.stml87See State for Sale: A conservative multimillionaire has taken control in North Carolina, one <strong>of</strong> 2012’s top battlegrounds, at http://www.newyorker.com/reporting/2011/10/10/111010fa_fact_mayer88See Changes in <strong>the</strong> Distribution <strong>of</strong> Income Among Tax Filers Between 1996 and 2006: The Role <strong>of</strong> Labor Income, Capital Income, andTax Policy, at http://www.fas.org/sgp/crs/misc/R42131.pdf89See The Forbes 400, The Richest People in America, at http://www.forbes.com/forbes-400/list/90See Donor Demographics, at http://www.opensecrets.org/bigpicture/donordemographics.php?cycle=1992&filter=A91See Senate Dems push ‘Disclose Act 2.0’, at http://<strong>the</strong>hill.com/homenews/campaign/217329-senate-dems-push-disclose-act-2092See Flurry <strong>of</strong> Voter ID laws tied to conservative group ALEC, at http://openchannel.nbcnews.com/_news/2012/08/21/13392560-flurry-<strong>of</strong>-voter-id-laws-tied-to-conservative-group-alec?lite93See 2012 Election Lessons Learned: <strong>How</strong> Voters Stood Up Against Suppression, ID, and Intimidation, at http://www.Dēmos.org/publication/2012-election-lessons-learned-how-voters-stood-against-suppression-id-and-intimidation94Abraham Lincoln, “The Gettysburg Address” (Nov. 19, 1863), available at http://showcase.netins.net/web/creative/lincoln.html.95See Brenda Wright, Free <strong>the</strong> Vote: Cutting Red Tape from <strong>the</strong> Voting Process, at 1; available at http://www.Dēmos.org/sites/default/files/publications/FreeTheVote-Brief.pdf.96See Id.97See Liz Kennedy, et al., Bullies at <strong>the</strong> Ballot Box: Protecting <strong>the</strong> Freedom to Vote Against Wrongful Challenges and Intimidation, September10, 2012, available at http://www.Dēmos.org/publication/bullies-ballot-box-protecting-freedom-vote-against-wrongfulchallenges-and-intimidation.39
DEMOS.org220 Fifth Avenue, 2nd FloorNew York, NY 10001p: (212) 633–1405f: (212) 633–2105info@Dēmos.orgMedia ContactLauren StrayerAssociate Director <strong>of</strong> Communicationsp: (212) 389–1413Istrayer@Dēmos.org40