Renewable EnergyThis evaluation devotes special attention to energy because it is by far the largestpart <strong>of</strong> the mitigation-relevant WBG portfolio, is the focus <strong>of</strong> most existing mitigationorientedprojects and funds, and will play the dominant role in long-term mitigationefforts. As an introduction to both chapters on energy, this section begins by reviewingthe outcomes <strong>of</strong> evaluated renewable energy and energy efficiency projects and thencomprehensively describes the recent pattern <strong>of</strong> low-carbon energy investments.<strong>The</strong> chapter goes on to discuss the impact <strong>of</strong> interventions to overcome barriersto on-grid renewable energy investment. It then discusses the experience withhydropower and with solar photovoltaics, the on-grid and <strong>of</strong>f-grid renewable energytechnologies, respectively, with the longest evaluable record at the WBG.<strong>Low</strong>-<strong>Carbon</strong> Energy Projects and <strong>The</strong>irPerformanceAs a backdrop it is useful to consider the International EnergyAgency’s projections <strong>of</strong> how future power needs willbe met over the coming two decades, in two scenarios:reference and ambitious mitigation (450 parts per million;table 2.1). While some energy efficiency is includedin the reference scenario, additional efficiency is the mainway to satisfy demand while reducing emissions. In bothscenarios, increases in hydropower far outpace growth inother types <strong>of</strong> renewable energy outside the Organisationfor Economic Co-operation and <strong>Development</strong> (OECD).Performance <strong>of</strong> closed <strong>World</strong> <strong>Bank</strong> projectsInvestments in low-carbon energy have increased considerablyover the past five years, so most are still ongoing andunevaluated. 1 Of <strong>World</strong> <strong>Bank</strong> renewable energy and energyefficiency projects 2 initiated between 1990 and 2007, 91 hadclosed and been evaluated by 2009. Table 2.2 shows the outcome<strong>of</strong> these projects as rated by IEG.Two-thirds <strong>of</strong> evaluated renewable energyand energy efficiency projects since1990 had outcome ratings <strong>of</strong> moderatelysatisfactory or better.Table 2.1 International Energy Agency Projections <strong>of</strong> Power Production, 2007–30Increase in electricity generation 2007–30: baseline versus 450 ppm CO2 scenarios (terawatt hours per year)2007–30 increase under baseline 2007–30 increase under 450 ppmPower source OECD+ Rest <strong>of</strong> world OECD+ Rest <strong>of</strong> worldHydro 164 1,437 384 2,196Wind 918 443 1,425 1,180Solar 215 182 376 554Other renewable energy 330 414 536 957Fossil and nuclear power 790 9,644 –1,175 3,751Total electricity generation 2,417 12,120 1,546 8,638Incremental energy efficiency 871 3,482Source: OECD/IEA 2009.Note: Energy efficiency includes price-induced demand reduction. OECD+ = Organisation for EconomicCo-operation and <strong>Development</strong> + non-OECD European Union members; ppm = parts per million.12 | Climate Change and the <strong>World</strong> <strong>Bank</strong> Group
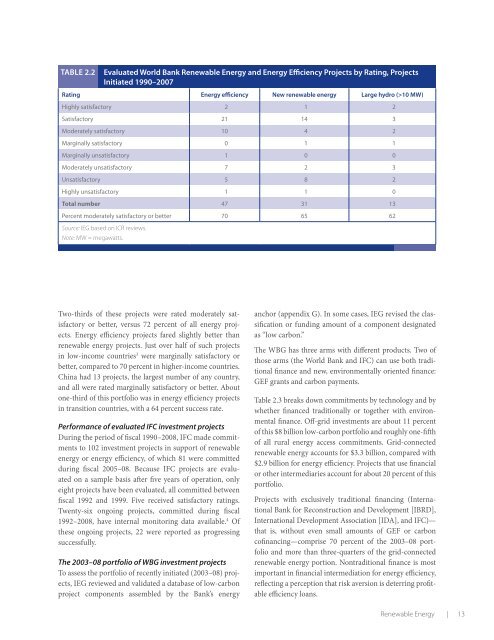
Table 2.2Evaluated <strong>World</strong> <strong>Bank</strong> Renewable Energy and Energy Efficiency Projects by Rating, ProjectsInitiated 1990–2007Rating Energy efficiency New renewable energy Large hydro (>10 MW)Highly satisfactory 2 1 2Satisfactory 21 14 3Moderately satisfactory 10 4 2Marginally satisfactory 0 1 1Marginally unsatisfactory 1 0 0Moderately unsatisfactory 7 2 3Unsatisfactory 5 8 2Highly unsatisfactory 1 1 0Total number 47 31 13Percent moderately satisfactory or better 70 65 62Source: IEG based on ICR reviews.Note: MW = megawatts.Two-thirds <strong>of</strong> these projects were rated moderately satisfactoryor better, versus 72 percent <strong>of</strong> all energy projects.Energy efficiency projects fared slightly better thanrenewable energy projects. Just over half <strong>of</strong> such projectsin low-income countries 3 were marginally satisfactory orbetter, compared to 70 percent in higher-income countries.China had 13 projects, the largest number <strong>of</strong> any country,and all were rated marginally satisfactory or better. Aboutone-third <strong>of</strong> this portfolio was in energy efficiency projectsin transition countries, with a 64 percent success rate.Performance <strong>of</strong> evaluated IFC investment projectsDuring the period <strong>of</strong> fiscal 1990–2008, IFC made commitmentsto 102 investment projects in support <strong>of</strong> renewableenergy or energy efficiency, <strong>of</strong> which 81 were committedduring fiscal 2005–08. Because IFC projects are evaluatedon a sample basis after five years <strong>of</strong> operation, onlyeight projects have been evaluated, all committed betweenfiscal 1992 and 1999. Five received satisfactory ratings.Twenty-six ongoing projects, committed during fiscal1992–2008, have internal monitoring data available. 4 Ofthese ongoing projects, 22 were reported as progressingsuccessfully.<strong>The</strong> 2003–08 portfolio <strong>of</strong> WBG investment projectsTo assess the portfolio <strong>of</strong> recently initiated (2003–08) projects,IEG reviewed and validated a database <strong>of</strong> low- carbonproject components assembled by the <strong>Bank</strong>’s energyanchor (appendix G). In some cases, IEG revised the classificationor funding amount <strong>of</strong> a component designatedas “low carbon.”<strong>The</strong> WBG has three arms with different products. Two <strong>of</strong>those arms (the <strong>World</strong> <strong>Bank</strong> and IFC) can use both traditionalfinance and new, environmentally oriented finance:GEF grants and carbon payments.Table 2.3 breaks down commitments by technology and bywhether financed traditionally or together with environmentalfinance. Off-grid investments are about 11 percent<strong>of</strong> this $8 billion low-carbon portfolio and roughly one-fifth<strong>of</strong> all rural energy access commitments. Grid-connectedrenewable energy accounts for $3.3 billion, compared with$2.9 billion for energy efficiency. Projects that use financialor other intermediaries account for about 20 percent <strong>of</strong> thisportfolio.Projects with exclusively traditional financing (International<strong>Bank</strong> for Reconstruction and <strong>Development</strong> [IBRD],International <strong>Development</strong> Association [IDA], and IFC)—that is, without even small amounts <strong>of</strong> GEF or carbonc<strong>of</strong>inancing—comprise 70 percent <strong>of</strong> the 2003–08 portfolioand more than three-quarters <strong>of</strong> the grid-connectedrenewable energy portion. Nontraditional finance is mostimportant in financial intermediation for energy efficiency,reflecting a perception that risk aversion is deterring pr<strong>of</strong>itableefficiency loans.Renewable Energy | 13
- Page 1 and 2: Phase II: The Challenge of Low-Carb
- Page 3 and 4: CLIMATE CHANGE AND THE WORLD BANK G
- Page 5 and 6: Table of ContentsAbbreviations . .
- Page 7 and 8: Figures1.1 GHG Emissions by Sector
- Page 9 and 10: AcknowledgmentsThe report was prepa
- Page 11 and 12: Executive SummaryUnabated, climate
- Page 13 and 14: esettlement plans has been ineffect
- Page 15 and 16: of some technologies, such as landf
- Page 17 and 18: Scale up high-impact investmentsEne
- Page 19 and 20: should have been strengthened in th
- Page 21 and 22: Major monitorable IEGrecommendation
- Page 23 and 24: Major monitorable IEGrecommendation
- Page 25 and 26: Chairman’s Summary: Committee onD
- Page 27 and 28: most places. Before we get there, w
- Page 29 and 30: non-Annex I countries. The World Ba
- Page 31 and 32: attention. In a couple of decades,
- Page 33 and 34: GlossaryAdditionalityBankabilityBas
- Page 35 and 36: Joint ImplementationA mechanism und
- Page 37 and 38: Chapter 1evALuAtiOn HiGHLiGHts• T
- Page 39 and 40: of interventions, from technical as
- Page 41 and 42: would allow industrialized countrie
- Page 43 and 44: growth, poverty reduction (includin
- Page 45 and 46: Table 1.1 Map of the EvaluationSect
- Page 47: Chapter 2eValuaTION HIGHlIGHTS• W
- Page 51 and 52: Figure 2.2Breakdown of 2003-08 Low-
- Page 53 and 54: Table 2.4 Commitments to Grid-Conne
- Page 55 and 56: Box 2.1The Economics of Grid-Connec
- Page 57 and 58: on average (Iyadomi 2010). (Reducti
- Page 59 and 60: and industrial policy. An increasin
- Page 61 and 62: Table 2.6Hydropower Investments by
- Page 63 and 64: costs for remaining unelectrified a
- Page 65 and 66: World Bank experienceTwo factors ac
- Page 67: Box 2.5On-Grid and Off-Grid Renewab
- Page 70 and 71: Energy EfficiencyThe first phase in
- Page 72 and 73: Box 3.1ESCOs and Energy Performance
- Page 74 and 75: have had limited causal impact on t
- Page 76 and 77: measurement of achieved economic re
- Page 78 and 79: Since the early 1990s, public entit
- Page 80 and 81: part with a $198 million IDA credit
- Page 83 and 84: Chapter 4eVAluATioN HigHligHTS• B
- Page 85 and 86: The WBG urban transport portfolio (
- Page 87 and 88: y conventional transport systems, i
- Page 89 and 90: include the forest carbon projects
- Page 91 and 92: for Costa Rica for the period 2000-
- Page 93 and 94: After 20 years of effort, systemati
- Page 95 and 96: orrowers have demonstrated the abil
- Page 97 and 98: Chapter 5EVALuATioN HigHLigHTS• O
- Page 99 and 100:
Consequently, the efficiency with w
- Page 101 and 102:
technologies could accelerate diffu
- Page 103 and 104:
A second issue, inherent to any adv
- Page 105 and 106:
goal of promoting wind turbine impr
- Page 107 and 108:
ConclusionsThe WBG’s efforts to p
- Page 109 and 110:
Table 5.1Carbon Funds at the World
- Page 111 and 112:
demonstration initiative. The Commu
- Page 113 and 114:
Impacts on technology transferThe 2
- Page 115 and 116:
Chapter 6Photo by Martin Wright/Ash
- Page 117 and 118:
Figure 6.1800Economic and Carbon Re
- Page 119 and 120:
Specifically, the WBG could:• Pla
- Page 121 and 122:
Table 6.1Summary of Sectoral Findin
- Page 123 and 124:
Table 6.1Sector Intervention Direct
- Page 125 and 126:
Appendix ARenewable Energy Tables a
- Page 127 and 128:
Table A.4Grid-Based Biomass/Biogass
- Page 129 and 130:
Table A.5 (continued)Negative examp
- Page 131 and 132:
Figure A.4A. Hydro/biomass capacity
- Page 133 and 134:
Appendix bWorld Bank Experience wit
- Page 135 and 136:
Table C.2Completed Low-Carbon Energ
- Page 137 and 138:
TAble C.4Reviewed energy efficiency
- Page 139 and 140:
the new capacity. Transmission syst
- Page 141 and 142:
Table E.2Climate obligationsCoal Pl
- Page 143 and 144:
Table F.2GHG objectiveModeNumber of
- Page 145 and 146:
IEG eliminated a few cases of doubl
- Page 147 and 148:
Table H.1Project andlocationBioener
- Page 149 and 150:
Appendix ICarbon and Economic Retur
- Page 151 and 152:
Appendix JRecent WBG Developments i
- Page 153 and 154:
y providing value to standing fores
- Page 155 and 156:
never had an explicit corporate str
- Page 157 and 158:
overnight. The Bank can provide ass
- Page 159 and 160:
Chapter 51. From the chief economis
- Page 161 and 162:
Hartshorn, G., P. Ferraro, and B. S
- Page 163 and 164:
______. 2007. World Development Ind
- Page 165 and 166:
IEG PublicationsAnalyzing the Effec