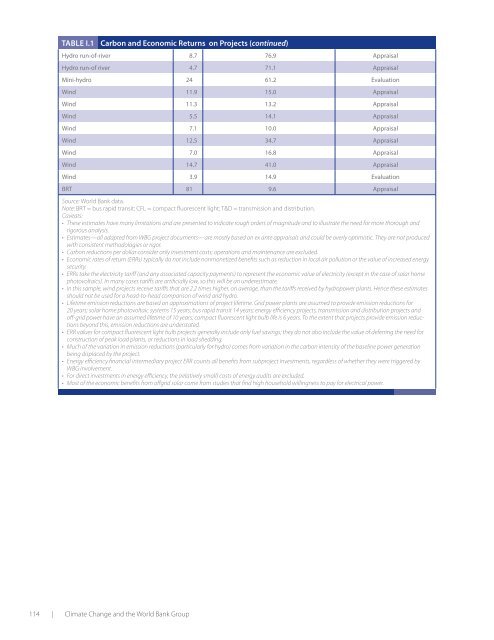
Table I.1<strong>Carbon</strong> and Economic Returns on Projects (continued)Hydro run-<strong>of</strong>-river 8.7 76.9 AppraisalHydro run-<strong>of</strong> river 4.7 71.1 AppraisalMini-hydro 24 61.2 EvaluationWind 11.9 15.0 AppraisalWind 11.3 13.2 AppraisalWind 5.5 14.1 AppraisalWind 7.1 10.0 AppraisalWind 12.5 34.7 AppraisalWind 7.0 16.8 AppraisalWind 14.7 41.0 AppraisalWind 3.9 14.9 EvaluationBRT 81 9.6 AppraisalSource: <strong>World</strong> <strong>Bank</strong> data.Note: BRT = bus rapid transit; CFL = compact fluorescent light; T&D = transmission and distribution.Caveats:• <strong>The</strong>se estimates have many limitations and are presented to indicate rough orders <strong>of</strong> magnitude and to illustrate the need for more thorough andrigorous analysis.• Estimates—all adapted from WBG project documents—are mostly based on ex ante appraisals and could be overly optimistic. <strong>The</strong>y are not producedwith consistent methodologies or rigor.• <strong>Carbon</strong> reductions per dollar consider only investment costs; operations and maintenance are excluded.• Economic rates <strong>of</strong> return (ERRs) typically do not include nonmonetized benefits such as reduction in local air pollution or the value <strong>of</strong> increased energysecurity.• ERRs take the electricity tariff (and any associated capacity payments) to represent the economic value <strong>of</strong> electricity (except in the case <strong>of</strong> solar homephotovoltaics). In many cases tariffs are artificially low, so this will be an underestimate.• In this sample, wind projects receive tariffs that are 2.2 times higher, on average, than the tariffs received by hydropower plants. Hence these estimatesshould not be used for a head-to-head comparison <strong>of</strong> wind and hydro.• Lifetime emission reductions are based on approximations <strong>of</strong> project lifetime. Grid power plants are assumed to provide emission reductions for20 years; solar home photovoltaic systems 15 years; bus rapid transit 14 years; energy efficiency projects, transmission and distribution projects and<strong>of</strong>f-grid power have an assumed lifetime <strong>of</strong> 10 years; compact fluorescent light bulb life is 6 years. To the extent that projects provide emission reductionsbeyond this, emission reductions are understated.• ERR values for compact fluorescent light bulb projects generally include only fuel savings; they do not also include the value <strong>of</strong> deferring the need forconstruction <strong>of</strong> peak load plants, or reductions in load shedding.• Much <strong>of</strong> the variation in emission reductions (particularly for hydro) comes from variation in the carbon intensity <strong>of</strong> the baseline power generationbeing displaced by the project.• Energy efficiency financial intermediary project ERR counts all benefits from subproject investments, regardless <strong>of</strong> whether they were triggered byWBG involvement.• For direct investments in energy efficiency, the (relatively small) costs <strong>of</strong> energy audits are excluded.• Most <strong>of</strong> the economic benefits from <strong>of</strong>fgrid solar come from studies that find high household willingness to pay for electrical power.114 | Climate Change and the <strong>World</strong> <strong>Bank</strong> Group
Appendix JRecent WBG <strong>Development</strong>s in Emission Mitigation Activities<strong>The</strong> main body <strong>of</strong> this paper and portfolio analysis has focusedon the 2003–08 period. As noted, there has been anincrease in climate-related activity since the 2008 adoption<strong>of</strong> the Strategic Framework on <strong>Development</strong> and ClimateChange. This appendix provides a descriptive review <strong>of</strong>key developments since 2008, including the 2009 energyportfolio, the Climate Investment Funds, the <strong>Carbon</strong> PartnershipFacility, the Forest <strong>Carbon</strong> Partnership Facility,and the <strong>Low</strong> <strong>Carbon</strong> Growth Studies program <strong>of</strong> the EnergySector Management Assistance Program. <strong>The</strong>se areashave not been evaluated in detail or fully validated by IEGanalysis.2008–09 Energy Portfolio <strong>Development</strong>s<strong>The</strong> growth in support for low carbon energy activitiescontinued in fiscal 2009, reaching annual commitments <strong>of</strong>more than $3.3 billion. <strong>Low</strong> carbon financing constitutesroughly 40 percent <strong>of</strong> the energy portfolio. Although IEGhas not formally validated the CEIF 2009 low carbon portfolioclassification, the CEIF definitions have been verysimilar to IEG’s reckoning <strong>of</strong> low carbon support in the past(see figure J.1).Most financing continues to come from traditional (IDA,IBRD, and International Finance Corporation) fundingsources, with the proportion coming from traditional financingincreasing in 2009.For the first time, more than half <strong>of</strong> the low carbon portfoliois for energy efficiency, though support for new renewableshas also increased markedly.<strong>The</strong> increase in financing for low carbon projects in fiscal2008 and 2009 comes primarily from a few large investments.In fiscal 2008, most financing for energy efficiencyand large hydropower was provided by stand-alone projects;26 percent came from just three IBRD projects: IndiaRampur Hydropower Project ($395 million), ChinaEnergy Efficiency Financing ($200 million), and ChinaLiaoning Med. Cities III (an energy efficiency project,$185 million).<strong>The</strong> following year, the portfolio was dominated by largeenergy efficiency investments; 40 percent <strong>of</strong> financing camefrom 5 <strong>World</strong> <strong>Bank</strong> projects: Turkey Private Sector RenewableEnergy and Energy Efficiency Project ( $500 millionFigure J.1Commitment ($ millions)6,0005,0004,0003,0002,0001,0000Financing for <strong>Low</strong> and Non-<strong>Low</strong><strong>Carbon</strong> Energy, 2003–092003 2004 2005 2006Year2007 2008 2009Non-low-carbon energy, CEIF<strong>Low</strong>-carbon energy, CEIF<strong>Low</strong>-carbon energy, IEGSource: IEG and CEIF.Note: CEIF = Clean energy Investment Framework.IBRD), India Coal-Fired Generation Rehabilitation($225 million), Turkey Programmatic Electricity Sector<strong>Development</strong> Policy Loan ($200 million), Vietnam RenewableEnergy <strong>Development</strong> Project ($199 million), andNigeria Electricity and Gas Improvement ($182 million).Recent Activities: Climate Investment FundsIn 2008 the WBG and other multilateral developmentbanks jointly established the $6.2 billion Climate InvestmentFunds. <strong>The</strong> core <strong>of</strong> the Climate Investment Fund isthe $5.1 billion Clean Technology Fund (CTF), aimed atfinancing demonstration, large-scale deployment andtransfer <strong>of</strong> low-carbon technologies in large or middle-incomecountries.CTF financing eligibility requires the creation <strong>of</strong> countryor sector investment plans, and then selects projectsfor financing on the basis <strong>of</strong> potential for greenhouse gassavings, cost-effectiveness, demonstration potential atscale, development impact, implementation potential, andadditional costs and risk premium. Eligible technologiesinclude the power sector, transportation, and energy efficiencyin buildings, industry, or agriculture.Appendix J: Recent WBG <strong>Development</strong>s in Emission Mitigation Activities | 115
- Page 1 and 2:
Phase II: The Challenge of Low-Carb
- Page 3 and 4:
CLIMATE CHANGE AND THE WORLD BANK G
- Page 5 and 6:
Table of ContentsAbbreviations . .
- Page 7 and 8:
Figures1.1 GHG Emissions by Sector
- Page 9 and 10:
AcknowledgmentsThe report was prepa
- Page 11 and 12:
Executive SummaryUnabated, climate
- Page 13 and 14:
esettlement plans has been ineffect
- Page 15 and 16:
of some technologies, such as landf
- Page 17 and 18:
Scale up high-impact investmentsEne
- Page 19 and 20:
should have been strengthened in th
- Page 21 and 22:
Major monitorable IEGrecommendation
- Page 23 and 24:
Major monitorable IEGrecommendation
- Page 25 and 26:
Chairman’s Summary: Committee onD
- Page 27 and 28:
most places. Before we get there, w
- Page 29 and 30:
non-Annex I countries. The World Ba
- Page 31 and 32:
attention. In a couple of decades,
- Page 33 and 34:
GlossaryAdditionalityBankabilityBas
- Page 35 and 36:
Joint ImplementationA mechanism und
- Page 37 and 38:
Chapter 1evALuAtiOn HiGHLiGHts• T
- Page 39 and 40:
of interventions, from technical as
- Page 41 and 42:
would allow industrialized countrie
- Page 43 and 44:
growth, poverty reduction (includin
- Page 45 and 46:
Table 1.1 Map of the EvaluationSect
- Page 47 and 48:
Chapter 2eValuaTION HIGHlIGHTS• W
- Page 49 and 50:
Table 2.2Evaluated World Bank Renew
- Page 51 and 52:
Figure 2.2Breakdown of 2003-08 Low-
- Page 53 and 54:
Table 2.4 Commitments to Grid-Conne
- Page 55 and 56:
Box 2.1The Economics of Grid-Connec
- Page 57 and 58:
on average (Iyadomi 2010). (Reducti
- Page 59 and 60:
and industrial policy. An increasin
- Page 61 and 62:
Table 2.6Hydropower Investments by
- Page 63 and 64:
costs for remaining unelectrified a
- Page 65 and 66:
World Bank experienceTwo factors ac
- Page 67:
Box 2.5On-Grid and Off-Grid Renewab
- Page 70 and 71:
Energy EfficiencyThe first phase in
- Page 72 and 73:
Box 3.1ESCOs and Energy Performance
- Page 74 and 75:
have had limited causal impact on t
- Page 76 and 77:
measurement of achieved economic re
- Page 78 and 79:
Since the early 1990s, public entit
- Page 80 and 81:
part with a $198 million IDA credit
- Page 83 and 84:
Chapter 4eVAluATioN HigHligHTS• B
- Page 85 and 86:
The WBG urban transport portfolio (
- Page 87 and 88:
y conventional transport systems, i
- Page 89 and 90:
include the forest carbon projects
- Page 91 and 92:
for Costa Rica for the period 2000-
- Page 93 and 94:
After 20 years of effort, systemati
- Page 95 and 96:
orrowers have demonstrated the abil
- Page 97 and 98:
Chapter 5EVALuATioN HigHLigHTS• O
- Page 99 and 100: Consequently, the efficiency with w
- Page 101 and 102: technologies could accelerate diffu
- Page 103 and 104: A second issue, inherent to any adv
- Page 105 and 106: goal of promoting wind turbine impr
- Page 107 and 108: ConclusionsThe WBG’s efforts to p
- Page 109 and 110: Table 5.1Carbon Funds at the World
- Page 111 and 112: demonstration initiative. The Commu
- Page 113 and 114: Impacts on technology transferThe 2
- Page 115 and 116: Chapter 6Photo by Martin Wright/Ash
- Page 117 and 118: Figure 6.1800Economic and Carbon Re
- Page 119 and 120: Specifically, the WBG could:• Pla
- Page 121 and 122: Table 6.1Summary of Sectoral Findin
- Page 123 and 124: Table 6.1Sector Intervention Direct
- Page 125 and 126: Appendix ARenewable Energy Tables a
- Page 127 and 128: Table A.4Grid-Based Biomass/Biogass
- Page 129 and 130: Table A.5 (continued)Negative examp
- Page 131 and 132: Figure A.4A. Hydro/biomass capacity
- Page 133 and 134: Appendix bWorld Bank Experience wit
- Page 135 and 136: Table C.2Completed Low-Carbon Energ
- Page 137 and 138: TAble C.4Reviewed energy efficiency
- Page 139 and 140: the new capacity. Transmission syst
- Page 141 and 142: Table E.2Climate obligationsCoal Pl
- Page 143 and 144: Table F.2GHG objectiveModeNumber of
- Page 145 and 146: IEG eliminated a few cases of doubl
- Page 147 and 148: Table H.1Project andlocationBioener
- Page 149: Appendix ICarbon and Economic Retur
- Page 153 and 154: y providing value to standing fores
- Page 155 and 156: never had an explicit corporate str
- Page 157 and 158: overnight. The Bank can provide ass
- Page 159 and 160: Chapter 51. From the chief economis
- Page 161 and 162: Hartshorn, G., P. Ferraro, and B. S
- Page 163 and 164: ______. 2007. World Development Ind
- Page 165 and 166: IEG PublicationsAnalyzing the Effec