Spatial distribution and seasonal variation in Undaria pinnatifida ...
Spatial distribution and seasonal variation in Undaria pinnatifida ...
Spatial distribution and seasonal variation in Undaria pinnatifida ...

Create successful ePaper yourself
Turn your PDF publications into a flip-book with our unique Google optimized e-Paper software.
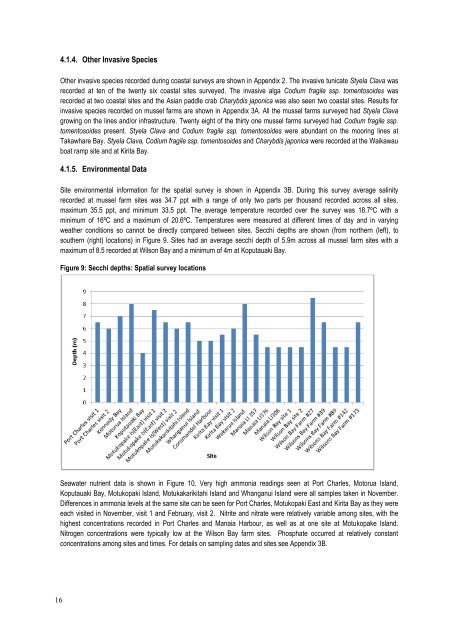
4.1.4. Other Invasive SpeciesOther <strong>in</strong>vasive species recorded dur<strong>in</strong>g coastal surveys are shown <strong>in</strong> Appendix 2. The <strong>in</strong>vasive tunicate Styela Clava wasrecorded at ten of the twenty six coastal sites surveyed. The <strong>in</strong>vasive alga Codium fragile ssp. tomentosoides wasrecorded at two coastal sites <strong>and</strong> the Asian paddle crab Charybdis japonica was also seen two coastal sites. Results for<strong>in</strong>vasive species recorded on mussel farms are shown <strong>in</strong> Appendix 3A. All the mussel farms surveyed had Styela Clavagrow<strong>in</strong>g on the l<strong>in</strong>es <strong>and</strong>/or <strong>in</strong>frastructure. Twenty eight of the thirty one mussel farms surveyed had Codium fragile ssp.tomentosoides present. Styela Clava <strong>and</strong> Codium fragile ssp. tomentosoides were abundant on the moor<strong>in</strong>g l<strong>in</strong>es atTakawhare Bay. Styela Clava, Codium fragile ssp. tomentosoides <strong>and</strong> Charybdis japonica were recorded at the Waikawauboat ramp site <strong>and</strong> at Kirita Bay.4.1.5. Environmental DataSite environmental <strong>in</strong>formation for the spatial survey is shown <strong>in</strong> Appendix 3B. Dur<strong>in</strong>g this survey average sal<strong>in</strong>ityrecorded at mussel farm sites was 34.7 ppt with a range of only two parts per thous<strong>and</strong> recorded across all sites,maximum 35.5 ppt, <strong>and</strong> m<strong>in</strong>imum 33.5 ppt. The average temperature recorded over the survey was 18.7ºC with am<strong>in</strong>imum of 16ºC <strong>and</strong> a maximum of 20.6ºC. Temperatures were measured at different times of day <strong>and</strong> <strong>in</strong> vary<strong>in</strong>gweather conditions so cannot be directly compared between sites. Secchi depths are shown (from northern (left), tosouthern (right) locations) <strong>in</strong> Figure 9. Sites had an average secchi depth of 5.9m across all mussel farm sites with amaximum of 8.5 recorded at Wilson Bay <strong>and</strong> a m<strong>in</strong>imum of 4m at Koputauaki Bay.Figure 9: Secchi depths: <strong>Spatial</strong> survey locationsSeawater nutrient data is shown <strong>in</strong> Figure 10. Very high ammonia read<strong>in</strong>gs seen at Port Charles, Motorua Isl<strong>and</strong>,Koputauaki Bay, Motukopaki Isl<strong>and</strong>, Motukakarikitahi Isl<strong>and</strong> <strong>and</strong> Whanganui Isl<strong>and</strong> were all samples taken <strong>in</strong> November.Differences <strong>in</strong> ammonia levels at the same site can be seen for Port Charles, Motukopaki East <strong>and</strong> Kirita Bay as they wereeach visited <strong>in</strong> November, visit 1 <strong>and</strong> February, visit 2. Nitrite <strong>and</strong> nitrate were relatively variable among sites, with thehighest concentrations recorded <strong>in</strong> Port Charles <strong>and</strong> Manaia Harbour, as well as at one site at Motukopake Isl<strong>and</strong>.Nitrogen concentrations were typically low at the Wilson Bay farm sites. Phosphate occurred at relatively constantconcentrations among sites <strong>and</strong> times. For details on sampl<strong>in</strong>g dates <strong>and</strong> sites see Appendix 3B.16