

Y20859 310404 GE GreatLink ins.indd - Great Eastern Life
Y20859 310404 GE GreatLink ins.indd - Great Eastern Life
Y20859 310404 GE GreatLink ins.indd - Great Eastern Life
- No tags were found...

Create successful ePaper yourself
Turn your PDF publications into a flip-book with our unique Google optimized e-Paper software.
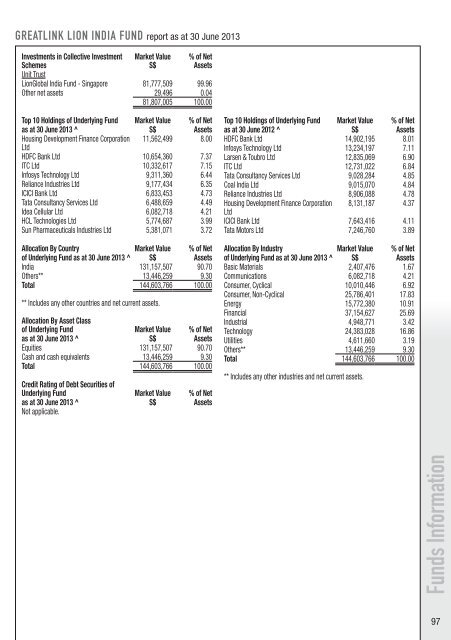
Funds InformationGREATLINK LION INDIA FUND report as at 30 June 2013Investments in Collective InvestmentSchemesMarket ValueS$% of NetAssetsUnit TrustLionGlobal India Fund - Singapore 81,777,509 99.96Other net assets 29,496 0.0481,807,005 100.00Top 10 Holdings of Underlying Fund Market Value % of Netas at 30 June 2013 ^ S$ AssetsHousing Development Finance Corporation 11,562,499 8.00LtdHDFC Bank Ltd 10,654,360 7.37ITC Ltd 10,332,617 7.15Infosys Technology Ltd 9,311,360 6.44Reliance Industries Ltd 9,177,434 6.35ICICI Bank Ltd 6,833,453 4.73Tata Consultancy Services Ltd 6,488,659 4.49Idea Cellular Ltd 6,082,718 4.21HCL Technologies Ltd 5,774,687 3.99Sun Pharmaceuticals Industries Ltd 5,381,071 3.72Allocation By Country Market Value % of Netof Underlying Fund as at 30 June 2013 ^ S$ AssetsIndia 131,157,507 90.70Others** 13,446,259 9.30Total 144,603,766 100.00** Includes any other countries and net current assets.Allocation By Asset Classof Underlying Fund Market Value % of Netas at 30 June 2013 ^ S$ AssetsEquities 131,157,507 90.70Cash and cash equivalents 13,446,259 9.30Total 144,603,766 100.00Credit Rating of Debt Securities ofUnderlying Fund Market Value % of Netas at 30 June 2013 ^ S$ AssetsNot applicable.Top 10 Holdings of Underlying Fund Market Value % of Netas at 30 June 2012 ^ S$ AssetsHDFC Bank Ltd 14,902,195 8.01Infosys Technology Ltd 13,234,197 7.11Larsen & Toubro Ltd 12,835,069 6.90ITC Ltd 12,731,022 6.84Tata Consultancy Services Ltd 9,028,284 4.85Coal India Ltd 9,015,070 4.84Reliance Industries Ltd 8,906,088 4.78Housing Development Finance Corporation 8,131,187 4.37LtdICICI Bank Ltd 7,643,416 4.11Tata Motors Ltd 7,246,760 3.89Allocation By Industry Market Value % of Netof Underlying Fund as at 30 June 2013 ^ S$ AssetsBasic Materials 2,407,476 1.67Communications 6,082,718 4.21Consumer, Cyclical 10,010,446 6.92Consumer, Non-Cyclical 25,786,401 17.83Energy 15,772,380 10.91Financial 37,154,627 25.69Industrial 4,948,771 3.42Technology 24,383,028 16.86Utilities 4,611,660 3.19Others** 13,446,259 9.30Total 144,603,766 100.00** Includes any other industries and net current assets.97


