

Y20859 310404 GE GreatLink ins.indd - Great Eastern Life
Y20859 310404 GE GreatLink ins.indd - Great Eastern Life
Y20859 310404 GE GreatLink ins.indd - Great Eastern Life
- No tags were found...

You also want an ePaper? Increase the reach of your titles
YUMPU automatically turns print PDFs into web optimized ePapers that Google loves.
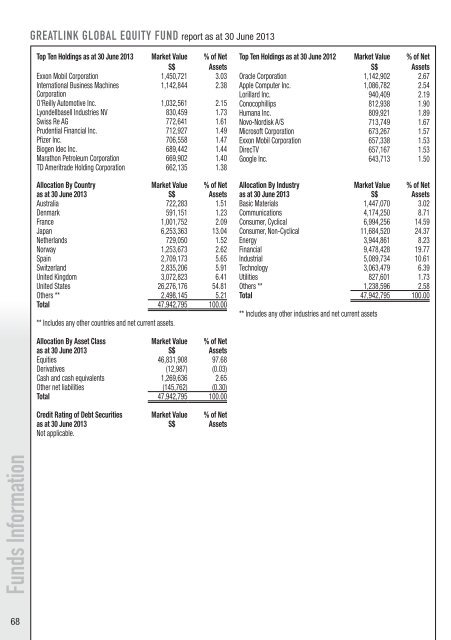
Funds InformationGREATLINK GLOBAL EQUITY FUND report as at 30 June 2013Top Ten Holdings as at 30 June 2013 Market ValueS$% of NetAssetsExxon Mobil Corporation 1,450,721 3.03International Business Machines1,142,844 2.38CorporationO'Reilly Automotive Inc. 1,032,561 2.15Lyondellbasell Industries NV 830,459 1.73Swiss Re AG 772,641 1.61Prudential Financial Inc. 712,927 1.49Pfi zer Inc. 706,558 1.47Biogen Idec Inc. 689,442 1.44Marathon Petroleum Corporation 669,902 1.40TD Ameritrade Holding Corporation 662,135 1.38Allocation By Country Market Value % of Netas at 30 June 2013 S$ AssetsAustralia 722,283 1.51Denmark 591,151 1.23France 1,001,752 2.09Japan 6,253,363 13.04Netherlands 729,050 1.52Norway 1,253,673 2.62Spain 2,709,173 5.65Switzerland 2,835,206 5.91United Kingdom 3,072,823 6.41United States 26,276,176 54.81Others ** 2,498,145 5.21Total 47,942,795 100.00** Includes any other countries and net current assets.Top Ten Holdings as at 30 June 2012 Market ValueS$% of NetAssetsOracle Corporation 1,142,902 2.67Apple Computer Inc. 1,086,782 2.54Lorillard Inc. 940,409 2.19Conocophillips 812,938 1.90Humana Inc. 809,921 1.89Novo-Nordisk A/S 713,749 1.67Microsoft Corporation 673,267 1.57Exxon Mobil Corporation 657,338 1.53DirecTV 657,167 1.53Google Inc. 643,713 1.50Allocation By Industry Market Value % of Netas at 30 June 2013 S$ AssetsBasic Materials 1,447,070 3.02Communications 4,174,250 8.71Consumer, Cyclical 6,994,256 14.59Consumer, Non-Cyclical 11,684,520 24.37Energy 3,944,861 8.23Financial 9,478,428 19.77Industrial 5,089,734 10.61Technology 3,063,479 6.39Utilities 827,601 1.73Others ** 1,238,596 2.58Total 47,942,795 100.00** Includes any other industries and net current assetsAllocation By Asset Class Market Value % of Netas at 30 June 2013 S$ AssetsEquities 46,831,908 97.68Derivatives (12,987) (0.03)Cash and cash equivalents 1,269,636 2.65Other net liabilities (145,762) (0.30)Total 47,942,795 100.00Credit Rating of Debt Securities Market Value % of Netas at 30 June 2013 S$ AssetsNot applicable.68


