Geological Survey of Ireland Landslide Susceptibility Mapping Project
Geological Survey of Ireland Landslide Susceptibility Mapping Project
Geological Survey of Ireland Landslide Susceptibility Mapping Project
You also want an ePaper? Increase the reach of your titles
YUMPU automatically turns print PDFs into web optimized ePapers that Google loves.
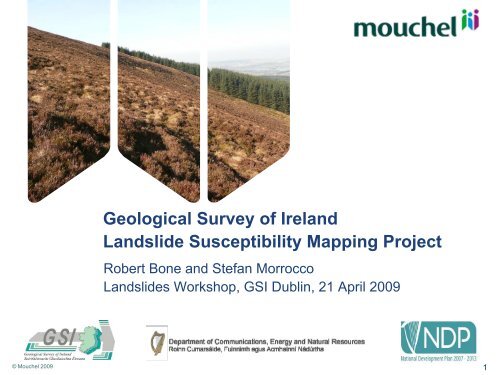
<strong>Geological</strong> <strong>Survey</strong> <strong>of</strong> <strong>Ireland</strong><strong>Landslide</strong> <strong>Susceptibility</strong> <strong>Mapping</strong> <strong>Project</strong>Robert Bone and Stefan Morrocco<strong>Landslide</strong>s Workshop, GSI Dublin, 21 April 2009© Mouchel 20091
Presentation Outline• <strong>Project</strong> Background– Appointment– Objectives• Implementation– <strong>Landslide</strong> InventoryExisting GSI inventory for <strong>Ireland</strong>Extending the inventory through aerial photography and fieldwork– Literature StudyMethodology ReviewRecommending an approach in the context <strong>of</strong> existing datasets– <strong>Landslide</strong> <strong>Susceptibility</strong> <strong>Mapping</strong>© Mouchel 20092
<strong>Project</strong> Outline• Appointment– Awarded to Mouchel: commenced June 2008, 5 years potentially– Competitive tender: experience, approach, client orientated– Context: Geo-hazards– Defined study areas: ‘Dublin’ and ‘Cork’• Objectives– Extend the existing landslide inventoryConsider Peat slides, debris slides and rock fallsIrish context in relation to the ‘classical’ classification <strong>of</strong> landslides– Review / develop susceptibility mapping methodologiesWhat has been done, where and how (Literature study)Document outputs: Methods, <strong>Mapping</strong>– Dissemination to planners, local authorities, public© Mouchel 20093
Peat slide susceptibility mapping© Mouchel 20094
Study Areas and Existing <strong>Landslide</strong> InventoryKey Key Facts FactsDublin Dublin and and Cork Cork study study areas areas cover coverabout about 6,700 6,700 km km 2 2GSI GSI inventory has has 148 148 landslides,but but under-representation is is likely. likely.‘Cork’ StudyArea‘Dublin’ StudyArea© Mouchel 20095
Contents<strong>Landslide</strong> Classification and <strong>Landslide</strong>s in <strong>Ireland</strong><strong>Landslide</strong> Prone TerrainIrish <strong>Landslide</strong> Inventory and Development NeedsAerial Photography Interpretation MethodologyTrainingInterpretationRecordingProblemsResults to DateProgressField ValidationFuture Work and Conclusions6
<strong>Landslide</strong> Classification and <strong>Landslide</strong>s in <strong>Ireland</strong>RockfallTopples, falls, slides, sturzstroms, rebound andsagging.PeatBog, peat and peaty-debris slides, bog bursts, bog andpeat flows.MinerogenicTranslational - Sheet, slab, flake, debris and spreadingfailures.Rotational and compound slidesFlows - Mudslides, flow slides, debris flows.7
<strong>Landslide</strong> Prone TerrainExposed BedrockSlopes (typically 15-40 degree)River TerracesGulliesPeat (slopes as low as 4 degrees)Earthworks8
Irish <strong>Landslide</strong> Inventory and Development Needs9
Aerial Photography Interpretation Methodologyc. 2,700 aerial photographsStudent interpreters – trainingDivision <strong>of</strong> photos between studentsDuplicationQuality ControlAccess to 2000 and 2004 colour and B&W photosEnhancementszoom and contour overlayRecordingValidation3-D PhotogrammetryField ValidationCreation <strong>of</strong> updated landslide inventory map10
Aerial Photography Interpretation - ProblemsPhotograph LimitationsPhotograph resolution – 1 m 2 pixelsTime gaps – most recent photos 2004Shadows<strong>Landslide</strong>s lost through timeInterpreter LimitationsExperience and trainingLandform misinterpretationConcentration/boredomEye strain11
Results to Date – Interpretation ProgressOf the c. 3000 aerial photos, only 300 are left to interpret.c. 700 candidate landslides identified to date, some <strong>of</strong> whichrepresent groups <strong>of</strong> landslides.1/3 <strong>of</strong> these have to be reviewed by myself.Field validation <strong>of</strong> candidate landslides.12
Results to Date – Field Validation13
Results to Date – Field Validation14
Future Work and ConclusionsComplete photo interpretationField validationCreation <strong>of</strong> landslide inventory for two study areas<strong>Landslide</strong>s <strong>of</strong> various types are common across <strong>Ireland</strong>, more soin the mountainous regions.Aerial photo interpretation with field validation is the most costeffectivemethod <strong>of</strong> identifying past landslides.The landslide inventory is important for identifying the variablesassociated with past slides to identify other areas with similarcharacteristics that are likely to be susceptible.A detailed landslide inventory map is crucial to the development<strong>of</strong> the next stage <strong>of</strong> the project, the GIS and statisticalanalysis <strong>of</strong> landslide susceptibility.15
<strong>Landslide</strong> <strong>Susceptibility</strong> Route MapAvailableData<strong>Landslide</strong><strong>Susceptibility</strong>MethodsLiteratureReview© Mouchel 2009Geology& SoilsDigitalTopographyContoursSlopeClassesSoilClassesAerialPhotosTopoWetnessIndex<strong>Landslide</strong>InventoryFieldworkValidationUniqueConditionUnits<strong>Landslide</strong><strong>Susceptibility</strong>Maps16
Concluding Remarks• <strong>Landslide</strong> Inventory– Virtually all 3000 aerial photos <strong>of</strong> study area examined– About 700 candidate locations identified and field validation ongoing– Significant increase in the landslide inventory anticipated– GSI database to be updated– Inventory crucial to the susceptibility mapping stage <strong>of</strong> the project• Methodology Development (Debris / Peat Slides)– Unique Condition Unit approach appears viable– Soil, Slope and Topographic Wetness Index components tested– Detailed classification <strong>of</strong> above components to be reviewed againstlandslide inventory• Methodology Extension (Rock fall)– Classification <strong>of</strong> exposed rock to be reviewed– Topography and dip orientations to be considered– Coastal environment additional components possible© Mouchel 200917
Thanks• Mouchel (Photo Interpreters): Aisling Connolly, Amy Holden, Kara Doig,Mohammed Haq, Pauline Pirrie, Rhys Johnstone• Mouchel (Land Aspects): Paeder Kelly• <strong>Geological</strong> <strong>Survey</strong> <strong>of</strong> <strong>Ireland</strong>: Ronnie Creighton, Koen Verbruggen,Xavier Pellicer, Michael Sheehy, Ray Scanlon, Charise McKeon© Mouchel 200918
QuestionsandDiscussion© Mouchel 200919
SM hyperlinked slides start here20
Rockfall21
Peat22
Minerogenic23
Exposed Bedrock24
River Terraces25
Gullies26
Peat27
Earthworks: Road Cuttings28
Training – Colour and Tone29
Training – Vegetation Changes30
Training – Topographic Anomalies31
Visual Enhancements - Contours32
Photograph Limitations - Shadows33
Photograph Limitations – Lost <strong>Landslide</strong>s2004200034
Landform Misinterpretation – Erosion Scars35
<strong>Landslide</strong> Misinterpretation – Peat Hags36
<strong>Landslide</strong> Misinterpretation - Quarries37
RB hyperlinked slides start here38
Literature Review• Review– About 100 published technical papers– Other material: project specific, reports, guidelines– Many from Hong Kong, Korea, Turkey, Italy, US and some European• Types <strong>of</strong> landslide– Translational and shallow rotational most common types– Some rockfall studies both inland and coastal– Relatively little on peat slides• Trends in methodology– 1980-1995 geomorphological and heuristic– 1995-2008 introduction / development <strong>of</strong> statistical• Key findings– no susceptibility mapping method is universally applicable– no method provides 100% guarantee <strong>of</strong> predictability© Mouchel 200939
Methodologies• Geomorphological– <strong>Mapping</strong> and field observation using expert opinion• Heuristic– Subjective weighting and scoring <strong>of</strong> likely causative factors– Possible hybridisation <strong>of</strong> other methodologies• Physical– Factor <strong>of</strong> Safety calculation based on geotechnical model• Statistical– Regression– Sets– Neural NetworksWithin Within particular particular approaches approaches eg egLogisticRegression Regression there there are are many many variations variations on onhow how data data is is selected, selected, grouped, grouped, normalised normalisedetc. etc. This This can can have have a a significant significant influence influenceon on the the outcome outcome and and prediction prediction accuracy. accuracy.© Mouchel 200940
Methodology CategorisationGeomorphologicalHeuristicPhysicalStatisticalQuantitativeAttributeScoringSchemesGeo-technicalFactor <strong>of</strong>SafetyRegressionsNeuralNetworksQualitative<strong>Mapping</strong>ObservationLogiclookuptables•Example <strong>of</strong> Heuristic / Lookup approach•Unique Condition Unit more complex but <strong>of</strong>fers flexibility© Mouchel 200941
Unique Condition UnitsSlopeCategories123456ABCDESoilTypesPolygon Intersections© Mouchel 200943
Resultant Polygon CombinationsE4A4A3A4C3C4D1D3E4D4E1E3B3B1B4A1C3E4B6C4D3C6D4C2D2C4D2E2C5E6C2C5E5E2E4Soil TypeSlope Category1 2 3 4 5 6A 1 1 2B 1 1 1 1C 2 2 3 2 1D 1 2 2 2E 1 2 1 4 1 1Layer 1 had 8 polygonsLayer 2 had 8 polygonsIntersection = 35 35 UCU30 30 possible permutations22 22 actual permutations© Mouchel 200944
UCU (Soil-Slope) Lowland AreaSampleSampleareaarea<strong>of</strong><strong>of</strong>UniqueUniqueConditionConditionUnitsUnitsformedformedfromfromintersectionintersection<strong>of</strong><strong>of</strong>1212SlopeSlopecategoriescategoriesandand88SoilSoilgroupings.groupings.OnlyOnlysomesome<strong>of</strong><strong>of</strong>thethe9696possiblepossiblecombinationscombinationsareareshownshownininthisthisexample.example.© Mouchel 200945
UCU (Soil-Slope) Mountainous AreaSampleSampleareaarea<strong>of</strong><strong>of</strong>UniqueUniqueConditionConditionUnitsUnitsformedformedfromfromintersectionintersection<strong>of</strong><strong>of</strong>1212SlopeSlopecategoriescategoriesandand88SoilSoilgroupings.groupings.OnlyOnlysomesome<strong>of</strong><strong>of</strong>thethe9696possiblepossiblecombinationscombinationsareareshownshownininthisthisexample.example.© Mouchel 200946
UCU Soil-Slope Anomalies (OSi 10m DTM data)25Ro8Ro50Ro60Ro16Ro40Ro12Ro40Ro4Ro8Ro16Ro© Mouchel 200947
GSI Datasets• Solid Geology– Bedrock geology– Bedrock Outcrop dataset• Drift, Soils, Vegetation– Quaternary geology– Irish Forest Soils Parent Material map• Digital Elevation Data– OSi 10m XY resolution– EPA (cleaned) 20m XY resolution• Imagery– 2000 colour digital ortho-photography (1:40,000)– DCMNR coastal digital photography© Mouchel 200948
‘Soil’ (Quaternary) generalisation options• Reviewed legends from four maps for numbers <strong>of</strong> ‘soil’ types– about 100 ‘soil’ types but only 42 types in Dublin SA and 22 in Cork SA– large variation in occurrence frequencies <strong>of</strong> different material types• Considered three approaches to grouping– Option 1: texture, nomenclature and depositional processes (12 groups)– Option 2: primarily on material texture (9 groups)– Option 3: primarily on depositional processes (10 groups)In all cases be aware <strong>of</strong> over dominant representation• Processed Quaternary mapping dataset– Used Option 2 groupings– Applied to the 40km x 70km trial area– Proved to be a viable approach but some issues <strong>of</strong> definition…Rock at surface / Sloping water / Steep peat© Mouchel 200949
Slope categorisation options• The rationale– Finer slope resolution at lower slope angles– Possible linkage to slope angle forces– Manageable number <strong>of</strong> categories• Considered three options– Option 1: 4, 5, 10 and 15 degree steps giving 12 categories– Option 2: All 5 degree steps giving 18 categories– Option 3: 3, 4, 5, 10 and 15 degree steps giving 13 categories• Processed Digital Elevation Data– Used Option 1 slope categories (…but considering initial 2 degree intervals)– Applied to the 40km x 70km trial area– Proved to be a viable approach, but some DTM issues to resolve…10m DTM artefacts: sheet edges / granularity / holes© Mouchel 200950
Hydrological factors• Many landslide events triggered by intense rainfall, but…– Statistically, a particular location will have experienced many previousextreme events without failure– Not all extreme events result in landslides• Various potential causative mechanisms– Overland flow and progressive erosion– Pore pressure increases– Changes in material / strength properties• Topographic Wetness Index– Also known as catchment wetness index– A function <strong>of</strong> slope and contributing area– Developed as an explanatory variable for habitat– Various mathematical formulations© Mouchel 200951
Topographic Wetness Index (TWI)• A theoretical hydrological impact variable may include:– Slope <strong>of</strong> the terrain– Contributing area– Velocity <strong>of</strong> overland flow (time <strong>of</strong> concentration)– Permeability <strong>of</strong> the soils– Time variable antecedent conditions• Current practice and implementations limited– TWI = ln(∑Area / Tan(slope)) (the most common approach)– TWI = Tan(slope) / ∑Area (alternatives eg.Tarboton)– Possible to conceive <strong>of</strong> variations even within these• Classifying TWI– Continuous variable, so how many classes?– What, if any bias to introduce?– Examples© Mouchel 200952
Wicklow Mountains: TWI ‘wet’ biasRecl_hz103Cell CountCell Count© Mouchel 20093000000300000025000002500000200000020000001500000150000010000001000000500000500000001 (Wet) 2 3 4 5 (Dry)1 (Wet) 2 3 4 5 (Dry)Generated from 20m DTM53
Wicklow Mountains: TWI ‘dry’ biasRecl_hz101Cell CountCell Count300000030000002500000250000020000002000000150000015000001000000100000050000050000000© Mouchel 20091 (Wet) 2 3 4 5 (Dry)1 (Wet) 2 3 4 5 (Dry)Generated from 20m DTM54
Wicklow Mountains: TWI ‘normal’ distributionRecl_hz102Cell CountCell Count© Mouchel 20093000000300000025000002500000200000020000001500000150000010000001000000500000500000001 (Wet) 2 3 4 5 (Dry)1 (Wet) 2 3 4 5 (Dry)Generated from 20m DTM55
Miscellaneous SlidesSpare SlidesMay address somequestions© Mouchel 200956
‘Soil’ generalisation optionsType Description Opt 1 (12) Opt 2 (9) Opt 3 (10)Ao wind blown sand 0.02Cl clayey soils 0.09 25.45Co coastal deposits 0.35Fl soils derived in a fluvial environment 4.34 4.35Gr gravely soils / sands and gravels 6.47 6.47 6.47Ma made ground 2.97 2.97 2.97Ms soils derived in a marine environment 0.16Pe peaty soils 6.31 6.31 6.30Ro bedrock and scree 10.07 10.07 9.91Sa sandy soils 26.10 26.10Sc scree 0.16St stoney soil 0.06Ti till 69.07Tl limestone till and till derived from the Irish Sea Basin 18.39Tss sandstone and shale till 24.07Tv till <strong>of</strong> variable composition 0.63Va material <strong>of</strong> variable composition 22.19Wa water 0.39 0.39 0.39© Mouchel 200957
UCU (Soil-Slope) Polygon StatisticsSize Class 10^n metresSlope 0 1 2 3 4 5 6 Total00-04 20 180 285 351 224 25 108504-08 453 3635 10768 4402 1218 197 36 2070908-12 1539 9408 16204 8761 1800 323 61 3809612-16 1503 7407 16694 6615 1214 260 20 3371316-20 1067 5260 24461 4596 855 136 9 3638420-25 773 3711 18786 3414 554 60 2729825-30 376 1828 11090 2210 285 25 1581430-40 179 1072 6540 1116 155 3 906540-50 45 355 1627 407 68 12 251450-60 6 133 443 123 29 1 73560-75 3 35 122 36 7 20375-90 9 24 15 48Total 5964 33033 107044 32046 6409 1042 126 185664© Mouchel 2009• Modal polygon size 10^2 or 100s <strong>of</strong> square metres• Vast majority in the 8-25 degree slope range• Significant number <strong>of</strong> very small polygons < 10m 258
Geotechnical Equation - Infinite Slope ModelDriving ForceØWater table levelResisting ForceFactor <strong>of</strong> Safety = Resisting Force / Driving ForceResisting Force = (c' + (γ -mγw) z cos2β tanǿ)Driving Force = (γ z sinβ cosβ)WeightWhere:c’ (cohesive) shear strength [kN/m2]γ bulk density <strong>of</strong> peat [kg/m3]γw bulk density <strong>of</strong> water [kg/m3]m water table elevation as a ratio <strong>of</strong> peat depth [m]z peat depth perpendicular to slope [m]β slope angle [Degrees]ǿ angle <strong>of</strong> internal friction [Degrees]© Mouchel 200959
Mathematical Function - Factor Scoring SchemesAttribute Values RangePeat Depth (first instance) 4 0 - 2Relief 3 1 - 2Exposure 4 1 - 3Slope 5 0.05 - 2Grade 4 1 - 2Surface Loading 1 1Peat strength 1 1Peat stratification 1 1Rainfall 1 1Drainage 4 0.5 - 3Subsurface hydrology 1 1• 12 attributes or factors but 5 greyed out• Greyed out factors recognised, but donothing in assessment• Each factor assigned a range <strong>of</strong> values• Attributes combined through multiplicationand ‘score’ can range from 0 – 288• About 46,000 permutations, but hundredsgive same score eg 6 = fn(240 permutations)• Are all like scoring permutations really thesame?Peat Depth (second instance) 4 0 - 2Evidence <strong>of</strong> instability 3 1 - 5© Mouchel 200960
Scottish Government ‘Guideline’ MethodThe Process (note terminology!)Exposure over LifetimeHazard over Lifetime1 Negligible < 1:10 75 Almost certain > 1:34 Probable 1:10 – 1:33 Likely 1:10 2 –1:10 X2 Unlikely 1:10 7 –1:10 2Scale Likelihood ProbabilityScale Exposure Impact as % <strong>of</strong> totalproject cost or time5 Extremely high impact > 100% <strong>of</strong> project4 Very high impact 10% - 100%3 High impact 4% - 10%2 Low impact 1% - 4%1 Very low impact < 1% <strong>of</strong> project1 2 3 4 5 6 7 8 9 10 11 12 13 14 15 16 17 18 19 20 21 22 23 24 25InsignificantSignificantSubstantialSerious© Mouchel 2009Hazard Ranking61


