AGRONOMIJAS VÄSTIS - Latvijas LauksaimniecÄ«bas universitÄte
AGRONOMIJAS VÄSTIS - Latvijas LauksaimniecÄ«bas universitÄte
AGRONOMIJAS VÄSTIS - Latvijas LauksaimniecÄ«bas universitÄte
- No tags were found...

Create successful ePaper yourself
Turn your PDF publications into a flip-book with our unique Google optimized e-Paper software.
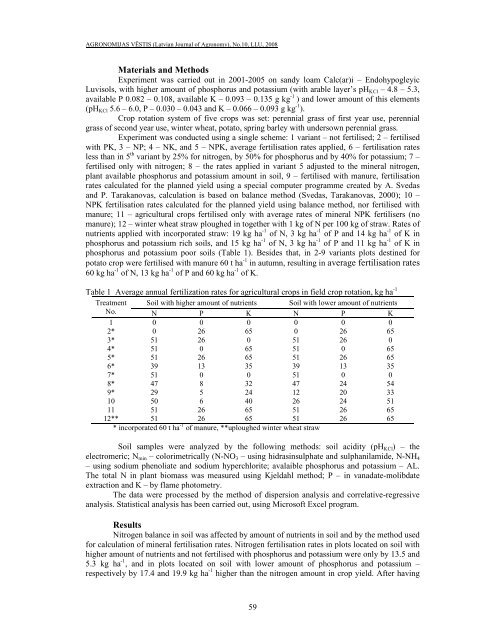
<strong>AGRONOMIJAS</strong> VĒSTIS (Latvian Journal of Agronomy), No.10, LLU, 2008Materials and MethodsExperiment was carried out in 2001-2005 on sandy loam Calc(ar)i – EndohypogleyicLuvisols, with higher amount of phosphorus and potassium (with arable layer’s pH KCl – 4.8 – 5.3,available P 0.082 – 0.108, available K – 0.093 – 0.135 g kg -1 ) and lower amount of this elements(pH KCl 5.6 – 6.0, P – 0.030 – 0.043 and K – 0.066 – 0.093 g kg -1 ).Crop rotation system of five crops was set: perennial grass of first year use, perennialgrass of second year use, winter wheat, potato, spring barley with undersown perennial grass.Experiment was conducted using a single scheme: 1 variant – not fertilised; 2 – fertilisedwith PK, 3 – NP; 4 – NK, and 5 – NPK, average fertilisation rates applied, 6 – fertilisation ratesless than in 5 th variant by 25% for nitrogen, by 50% for phosphorus and by 40% for potassium; 7 –fertilised only with nitrogen; 8 – the rates applied in variant 5 adjusted to the mineral nitrogen,plant available phosphorus and potassium amount in soil, 9 – fertilised with manure, fertilisationrates calculated for the planned yield using a special computer programme created by A. Svedasand P. Tarakanovas, calculation is based on balance method (Svedas, Tarakanovas, 2000); 10 –NPK fertilisation rates calculated for the planned yield using balance method, nor fertilised withmanure; 11 – agricultural crops fertilised only with average rates of mineral NPK fertilisers (nomanure); 12 – winter wheat straw ploughed in together with 1 kg of N per 100 kg of straw. Rates ofnutrients applied with incorporated straw: 19 kg ha -1 of N, 3 kg ha -1 of P and 14 kg ha -1 of K inphosphorus and potassium rich soils, and 15 kg ha -1 of N, 3 kg ha -1 of P and 11 kg ha -1 of K inphosphorus and potassium poor soils (Table 1). Besides that, in 2-9 variants plots destined forpotato crop were fertilised with manure 60 t ha -1 in autumn, resulting in average fertilisation rates60 kg ha -1 of N, 13 kg ha -1 of P and 60 kg ha -1 of K.Table 1 Average annual fertilization rates for agricultural crops in field crop rotation, kg ha -1Treatment Soil with higher amount of nutrients Soil with lower amount of nutrientsNo. N P K N P K1 0 0 0 0 0 02* 0 26 65 0 26 653* 51 26 0 51 26 04* 51 0 65 51 0 655* 51 26 65 51 26 656* 39 13 35 39 13 357* 51 0 0 51 0 08* 47 8 32 47 24 549* 29 5 24 12 20 3310 50 6 40 26 24 5111 51 26 65 51 26 6512** 51 26 65 51 26 65* incorporated 60 t ha -1 of manure, **uploughed winter wheat strawSoil samples were analyzed by the following methods: soil acidity (pH KCl ) – theelectromeric; N min – colorimetrically (N-NO 3 – using hidrasinsulphate and sulphanilamide, N-NH 4– using sodium phenoliate and sodium hyperchlorite; avalaible phosphorus and potassium – AL.The total N in plant biomass was measured using Kjeldahl method; P – in vanadate-molibdateextraction and K – by flame photometry.The data were processed by the method of dispersion analysis and correlative-regressiveanalysis. Statistical analysis has been carried out, using Microsoft Excel program.ResultsNitrogen balance in soil was affected by amount of nutrients in soil and by the method usedfor calculation of mineral fertilisation rates. Nitrogen fertilisation rates in plots located on soil withhigher amount of nutrients and not fertilised with phosphorus and potassium were only by 13.5 and5.3 kg ha -1 , and in plots located on soil with lower amount of phosphorus and potassium –respectively by 17.4 and 19.9 kg ha -1 higher than the nitrogen amount in crop yield. After having59