AGRONOMIJAS VÄSTIS - Latvijas LauksaimniecÄ«bas universitÄte
AGRONOMIJAS VÄSTIS - Latvijas LauksaimniecÄ«bas universitÄte
AGRONOMIJAS VÄSTIS - Latvijas LauksaimniecÄ«bas universitÄte
- No tags were found...
Create successful ePaper yourself
Turn your PDF publications into a flip-book with our unique Google optimized e-Paper software.
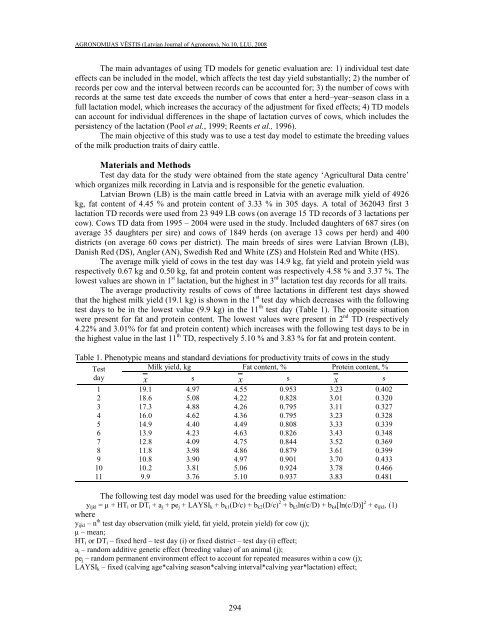
<strong>AGRONOMIJAS</strong> VĒSTIS (Latvian Journal of Agronomy), No.10, LLU, 2008The main advantages of using TD models for genetic evaluation are: 1) individual test dateeffects can be included in the model, which affects the test day yield substantially; 2) the number ofrecords per cow and the interval between records can be accounted for; 3) the number of cows withrecords at the same test date exceeds the number of cows that enter a herd–year–season class in afull lactation model, which increases the accuracy of the adjustment for fixed effects; 4) TD modelscan account for individual differences in the shape of lactation curves of cows, which includes thepersistency of the lactation (Pool et al., 1999; Reents et al., 1996).The main objective of this study was to use a test day model to estimate the breeding valuesof the milk production traits of dairy cattle.Materials and MethodsTest day data for the study were obtained from the state agency ‘Agricultural Data centre’which organizes milk recording in Latvia and is responsible for the genetic evaluation.Latvian Brown (LB) is the main cattle breed in Latvia with an average milk yield of 4926kg, fat content of 4.45 % and protein content of 3.33 % in 305 days. A total of 362043 first 3lactation TD records were used from 23 949 LB cows (on average 15 TD records of 3 lactations percow). Cows TD data from 1995 – 2004 were used in the study. Included daughters of 687 sires (onaverage 35 daughters per sire) and cows of 1849 herds (on average 13 cows per herd) and 400districts (on average 60 cows per district). The main breeds of sires were Latvian Brown (LB),Danish Red (DS), Angler (AN), Swedish Red and White (ZS) and Holstein Red and White (HS).The average milk yield of cows in the test day was 14.9 kg, fat yield and protein yield wasrespectively 0.67 kg and 0.50 kg, fat and protein content was respectively 4.58 % and 3.37 %. Thelowest values are shown in 1 st lactation, but the highest in 3 rd lactation test day records for all traits.The average productivity results of cows of three lactations in different test days showedthat the highest milk yield (19.1 kg) is shown in the 1 st test day which decreases with the followingtest days to be in the lowest value (9.9 kg) in the 11 th test day (Table 1). The opposite situationwere present for fat and protein content. The lowest values were present in 2 nd TD (respectively4.22% and 3.01% for fat and protein content) which increases with the following test days to be inthe highest value in the last 11 th TD, respectively 5.10 % and 3.83 % for fat and protein content.Table 1. Phenotypic means and standard deviations for productivity traits of cows in the studyMilk yield, kg Fat content, % Protein content, %Testday x s x s x s1 19.1 4.97 4.55 0.953 3.23 0.4022 18.6 5.08 4.22 0.828 3.01 0.3203 17.3 4.88 4.26 0.795 3.11 0.3274 16.0 4.62 4.36 0.795 3.23 0.3285 14.9 4.40 4.49 0.808 3.33 0.3396 13.9 4.23 4.63 0.826 3.43 0.3487 12.8 4.09 4.75 0.844 3.52 0.3698 11.8 3.98 4.86 0.879 3.61 0.3999 10.8 3.90 4.97 0.901 3.70 0.43310 10.2 3.81 5.06 0.924 3.78 0.46611 9.9 3.76 5.10 0.937 3.83 0.481The following test day model was used for the breeding value estimation:y ijkl = µ + HT i or DT i + a j + pe j + LAYSI k + b k1 (D/c) + b k2 (D/c) 2 + b k3 ln(c/D) + b k4 [ln(c/D)] 2 + e ijkl , (1)wherey ijkl – n th test day observation (milk yield, fat yield, protein yield) for cow (j);µ – mean;HT i or DT i – fixed herd – test day (i) or fixed district – test day (i) effect;a j – random additive genetic effect (breeding value) of an animal (j);pe j – random permanent environment effect to account for repeated measures within a cow (j);LAYSI k – fixed (calving age*calving season*calving interval*calving year*lactation) effect;294


