Wireless Ad Hoc and Sensor Networks
Wireless Ad Hoc and Sensor Networks Wireless Ad Hoc and Sensor Networks
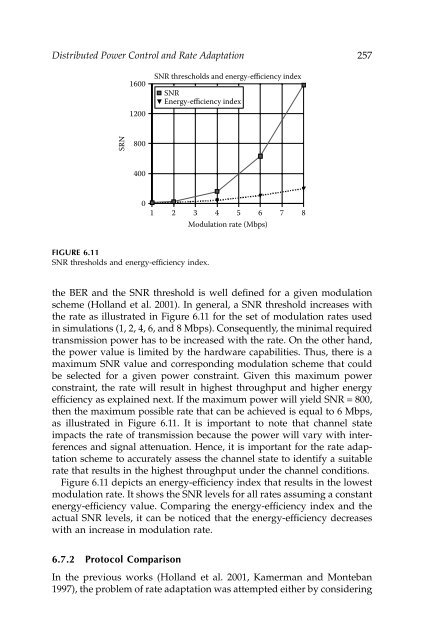
Distributed Power Control and Rate Adaptation 25716001200SNR threscholds and energy-efficiency indexSNREnergy-efficiency indexSRN80040001 2 3 4 5 6 7 8Modulation rate (Mbps)FIGURE 6.11SNR thresholds and energy-efficiency index.the BER and the SNR threshold is well defined for a given modulationscheme (Holland et al. 2001). In general, a SNR threshold increases withthe rate as illustrated in Figure 6.11 for the set of modulation rates usedin simulations (1, 2, 4, 6, and 8 Mbps). Consequently, the minimal requiredtransmission power has to be increased with the rate. On the other hand,the power value is limited by the hardware capabilities. Thus, there is amaximum SNR value and corresponding modulation scheme that couldbe selected for a given power constraint. Given this maximum powerconstraint, the rate will result in highest throughput and higher energyefficiency as explained next. If the maximum power will yield SNR = 800,then the maximum possible rate that can be achieved is equal to 6 Mbps,as illustrated in Figure 6.11. It is important to note that channel stateimpacts the rate of transmission because the power will vary with interferencesand signal attenuation. Hence, it is important for the rate adaptationscheme to accurately assess the channel state to identify a suitablerate that results in the highest throughput under the channel conditions.Figure 6.11 depicts an energy-efficiency index that results in the lowestmodulation rate. It shows the SNR levels for all rates assuming a constantenergy-efficiency value. Comparing the energy-efficiency index and theactual SNR levels, it can be noticed that the energy-efficiency decreaseswith an increase in modulation rate.6.7.2 Protocol ComparisonIn the previous works (Holland et al. 2001, Kamerman and Monteban1997), the problem of rate adaptation was attempted either by considering
258 Wireless Ad Hoc and Sensor Networksthe past transmission history, as in ARF protocol, or assuming that thechannel state does not change significantly between consecutive transmissions,as in the case of RBAR. Hence, the selected rate was often notoptimal. Additionally, these protocols neither take energy-efficiency intoconsideration nor modify the transmission power to save energy duringrate adaptation.The operation of the ARF protocol (Kamerman and Monteban 1997) ispresented in Figure 6.12. The four rates (R1, R2, R3, and R4) are consideredwith corresponding SNR thresholds. In this example, the first packet is sentwith the maximum rate allowed for the channel state. The following packetsare sent using the same rate, though the SNR could have increased thuslowering the throughput for the current channel state. After three consecutive,successfully received packets, the rate is then increased even though thechannel state could have changed significantly during this time. The newrate (R2) used for the fourth packet could be still lower than the maximumpossible rate. On the other hand, when the SNR decreases, the selected ratewill always be higher than the acceptable throughput possible, resulting inproblems of decoding of packets at the receiver.In short, the problems observed in the ARF protocol are the result of thelack of information about the radio channel state, because, no measurementsof signal reception are considered. In consequence, the throughputachieved by ARF is lower than possible for a given channel state. Furthermore,the energy is consumed inefficiently.SNR(t)Packet OK with optimal ratePacket OK but with sub-optimal ratePacket LOST because min. SNR not metR4R3R2R1R1 R1 R1 R2 R2 R2 R3 R3 R3 R4 R4 R4 R33 successful = > 3 successful = > 3 successful = > 3 failures = >increase rate increase rate increase rate decrease rateFIGURE 6.12ARF rate selection.
- Page 229 and 230: 206 Wireless Ad Hoc and Sensor Netw
- Page 231 and 232: 208 Wireless Ad Hoc and Sensor Netw
- Page 233 and 234: 210 Wireless Ad Hoc and Sensor Netw
- Page 235 and 236: 212 Wireless Ad Hoc and Sensor Netw
- Page 237 and 238: 214 Wireless Ad Hoc and Sensor Netw
- Page 239 and 240: 216 Wireless Ad Hoc and Sensor Netw
- Page 241 and 242: 218 Wireless Ad Hoc and Sensor Netw
- Page 243 and 244: 220 Wireless Ad Hoc and Sensor Netw
- Page 245 and 246: 222 Wireless Ad Hoc and Sensor Netw
- Page 247 and 248: 224 Wireless Ad Hoc and Sensor Netw
- Page 249 and 250: 226 Wireless Ad Hoc and Sensor Netw
- Page 251 and 252: 228 Wireless Ad Hoc and Sensor Netw
- Page 253 and 254: 230 Wireless Ad Hoc and Sensor Netw
- Page 255 and 256: 232 Wireless Ad Hoc and Sensor Netw
- Page 257 and 258: 234 Wireless Ad Hoc and Sensor Netw
- Page 259 and 260: 236 Wireless Ad Hoc and Sensor Netw
- Page 261 and 262: 238 Wireless Ad Hoc and Sensor Netw
- Page 263 and 264: 240 Wireless Ad Hoc and Sensor Netw
- Page 265 and 266: 242 Wireless Ad Hoc and Sensor Netw
- Page 267 and 268: 244 Wireless Ad Hoc and Sensor Netw
- Page 269 and 270: 246 Wireless Ad Hoc and Sensor Netw
- Page 271 and 272: 248 Wireless Ad Hoc and Sensor Netw
- Page 273 and 274: 250 Wireless Ad Hoc and Sensor Netw
- Page 275 and 276: 252 Wireless Ad Hoc and Sensor Netw
- Page 277 and 278: 254 Wireless Ad Hoc and Sensor Netw
- Page 279: 256 Wireless Ad Hoc and Sensor Netw
- Page 283 and 284: 260 Wireless Ad Hoc and Sensor Netw
- Page 285 and 286: 262 Wireless Ad Hoc and Sensor Netw
- Page 287 and 288: 264 Wireless Ad Hoc and Sensor Netw
- Page 289 and 290: 266 Wireless Ad Hoc and Sensor Netw
- Page 291 and 292: 268 Wireless Ad Hoc and Sensor Netw
- Page 293 and 294: 270 Wireless Ad Hoc and Sensor Netw
- Page 295 and 296: 272 Wireless Ad Hoc and Sensor Netw
- Page 297 and 298: 274 Wireless Ad Hoc and Sensor Netw
- Page 299 and 300: 276 Wireless Ad Hoc and Sensor Netw
- Page 301 and 302: 278 Wireless Ad Hoc and Sensor Netw
- Page 303 and 304: 280 Wireless Ad Hoc and Sensor Netw
- Page 305 and 306: 282 Wireless Ad Hoc and Sensor Netw
- Page 307 and 308: 284 Wireless Ad Hoc and Sensor Netw
- Page 309 and 310: 286 Wireless Ad Hoc and Sensor Netw
- Page 311 and 312: 288 Wireless Ad Hoc and Sensor Netw
- Page 313 and 314: 290 Wireless Ad Hoc and Sensor Netw
- Page 315 and 316: 292 Wireless Ad Hoc and Sensor Netw
- Page 317 and 318: 294 Wireless Ad Hoc and Sensor Netw
- Page 319 and 320: 296 Wireless Ad Hoc and Sensor Netw
- Page 321 and 322: 298 Wireless Ad Hoc and Sensor Netw
- Page 323 and 324: 300 Wireless Ad Hoc and Sensor Netw
- Page 326 and 327: 7Distributed Fair Scheduling in Wir
- Page 328 and 329: Distributed Fair Scheduling in Wire
Distributed Power Control <strong>and</strong> Rate <strong>Ad</strong>aptation 25716001200SNR threscholds <strong>and</strong> energy-efficiency indexSNREnergy-efficiency indexSRN80040001 2 3 4 5 6 7 8Modulation rate (Mbps)FIGURE 6.11SNR thresholds <strong>and</strong> energy-efficiency index.the BER <strong>and</strong> the SNR threshold is well defined for a given modulationscheme (Holl<strong>and</strong> et al. 2001). In general, a SNR threshold increases withthe rate as illustrated in Figure 6.11 for the set of modulation rates usedin simulations (1, 2, 4, 6, <strong>and</strong> 8 Mbps). Consequently, the minimal requiredtransmission power has to be increased with the rate. On the other h<strong>and</strong>,the power value is limited by the hardware capabilities. Thus, there is amaximum SNR value <strong>and</strong> corresponding modulation scheme that couldbe selected for a given power constraint. Given this maximum powerconstraint, the rate will result in highest throughput <strong>and</strong> higher energyefficiency as explained next. If the maximum power will yield SNR = 800,then the maximum possible rate that can be achieved is equal to 6 Mbps,as illustrated in Figure 6.11. It is important to note that channel stateimpacts the rate of transmission because the power will vary with interferences<strong>and</strong> signal attenuation. Hence, it is important for the rate adaptationscheme to accurately assess the channel state to identify a suitablerate that results in the highest throughput under the channel conditions.Figure 6.11 depicts an energy-efficiency index that results in the lowestmodulation rate. It shows the SNR levels for all rates assuming a constantenergy-efficiency value. Comparing the energy-efficiency index <strong>and</strong> theactual SNR levels, it can be noticed that the energy-efficiency decreaseswith an increase in modulation rate.6.7.2 Protocol ComparisonIn the previous works (Holl<strong>and</strong> et al. 2001, Kamerman <strong>and</strong> Monteban1997), the problem of rate adaptation was attempted either by considering


