205 questions - Earth Science Regents Review
205 questions - Earth Science Regents Review
205 questions - Earth Science Regents Review
- No tags were found...

Create successful ePaper yourself
Turn your PDF publications into a flip-book with our unique Google optimized e-Paper software.
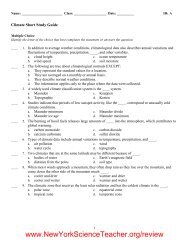
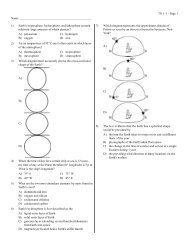
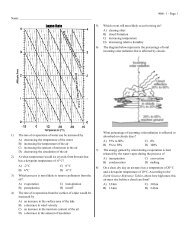
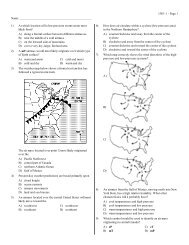
54) The map below shows the crustal plateboundaries located along the Pacificcoastline of the United States. The arrowsshow the general directions in which someof the plates appear to be moving slowly.1242 - 1 - Page 855) The diagram below illustrates Eratosthenes'method of finding the circumference of aplanet. At noon, when a vertical stick at theEquator casts no shadow, a vertical stick2,500 kilometers away casts a shadow andmakes an angle of 40D with the rays of theSun as shown.What is the circumference of this planet?A) 2,500 kmB) 22,500 kmC) 45,000 kmD) 20,000 kmQuestions 56 through 58 refer to the following:Which feature is located at 20D Northlatitude and 109D West longitude?A) East Pacific riseB) San Andreas faultC) Juan de Fuca RidgeD) Baja CaliforniaThe diagram below represents the <strong>Earth</strong>. Someof the latitude and longitude lines have beenlabeled. Points A through E represent locationson the <strong>Earth</strong>'s surface.56) As a traveler goes from location A tolocation B, the altitude of Polaris willA) remain the sameB) decreaseC) increase
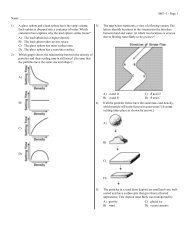
66) Based on the data collected, which graphbest represents the relationship betweenelevation above sea level and air pressure?A)1242 - 1 - Page 10Questions 68 and 69 refer to the following:The latitude and longitude system shownrepresents a part of the <strong>Earth</strong>'s surface and itslatitude-longitude coordinates. Points A throughF represent locations in this area.B)C)D)67) Isolines on the topographic map belowshow elevations above sea level, measuredin meters.68) As a person travels from location B tolocation E, the observed altitude of PolariswillA) increaseB) decreaseC) remain the same69) What is the compass direction from point Dtoward point E?A) southwestC) northeastB) southeastD) northwest70) The graph below represents percentage ofelements by volume.What could be the highest possibleelevation represented on this map?A) 41 mC) 39 mB) 45 mD) 49 mAccording to the <strong>Earth</strong> <strong>Science</strong> ReferenceTables, this graph best represents theelements of the <strong>Earth</strong>'sA) stratosphere C) lithosphereB) troposphereD) hydrosphere
Questions 77 and 78 refer to the following:1242 - 1 - Page 12Questions 79 and 80 refer to the following:The data table below contains data taken atlocations A through E in a stream. The volume ofthe stream is the same at all locations.77) Which diagram best represents the streamprofile from location A to location E?A)79) In which direction does Jennifer Brookflow?A) northwestC) southwestB) southeastD) northeast80) What is the approximate gradient, in metersper kilometer, of Jennifer Brook betweenpoints A and B?A) 80 m/kmB) 220 m/kmC) 40 m/kmD) 20 m/kmB)C)81) Measurements of the Sun's altitude at thesame time from two different <strong>Earth</strong>locations a known distance apart are oftenused to determine theA) length of the major axis of the <strong>Earth</strong>'sorbitB) period of the <strong>Earth</strong>'s revolutionC) eccentricity of the <strong>Earth</strong>'s orbitD) circumference of the <strong>Earth</strong>D)78) What is the gradient of the stream betweenlocations C and D?A) 1.1 m/kmB) 3.0 m/kmC) 2.0 m/kmD) 0.5 m/km
101) According to the <strong>Earth</strong> <strong>Science</strong> ReferenceTables, what is the diameter of the Moon?1242 - 1 - Page 16104) The isoline diagram below represents anelevation field.A) 6.37 x 10³ kmB) 7.35 x 10²² kmC) 1.74 x 10³ kmD) 3.48 x 10³ km102) The total amount of water vapor per cubicmeter in the atmosphere at sea level isapproximatelyA) 15 g/m3B) 30 g/m3C) 8 g/m3D) 1 g/m3103) According to the <strong>Earth</strong> <strong>Science</strong> ReferenceTables, the temperature in thestratosphere ranges from approximatelyA) -55DF to 0DFB) 10DC to 50DCC) -55DC to 0DCD) 10DF to 35DFWhich profile best represents thetopography along line AB?A)B)C)D)105) According to the <strong>Earth</strong> <strong>Science</strong> ReferenceTables, the most abundant gas in thetroposphere isA) nitrogenB) oxygenC) carbon dioxideD) water vapor
106) Which diagram best shows the altitude anddirection of Polaris for an observer in NewYork City? [Refer to the <strong>Earth</strong> <strong>Science</strong>Reference Tables.]A)B)1242 - 1 - Page 17110) Which object best represents a true scalemodel of the shape of the <strong>Earth</strong>?A) a footballB) a Ping-Pong ballC) a pearD) an egg111) Oxygen is the most abundant element byvolume in the <strong>Earth</strong>'sA) hydrosphere C) troposphereB) crustD) inner core112) According to the <strong>Earth</strong> <strong>Science</strong> ReferenceTables, what is the temperature of theatmosphere at the stratopause?A) -55DCC) -90DCB) 15DCD) 0DC113) In which atmospheric layer is most watervapor found?C)D)107) A stream in New York State begins at alocation 350 meters above sea level andflows into a swamp 225 meters above sealevel. The length of the stream is25 kilometers. What is the gradient of thestream?A) 12 m/kmC) 9 m/kmB) 5 m/kmD) 17 m/kmA) troposphereB) mesosphereC) stratosphereD) thermosphere114) From which set of polar and equatorialdiameters can the actual shape of the<strong>Earth</strong> be inferred?A) polar diameter = 12,714 km,equatorial diameter = 12,714 kmB) polar diameter = 12,714 km,equatorial diameter = 12,756 kmC) polar diameter = 12,756 km,equatorial diameter = 12,714 kmD) polar diameter = 12,756 km,equatorial diameter = 12,756 km108) The angle of the star Polaris above thenorthern horizon can be used to determinean observer'sA) latitudeB) solar timeC) longitudeD) local time109) Measurements taken from space show the<strong>Earth</strong> to beA) greatest in diameter at the polesB) pear shapedC) a perfect sphereD) greatest in diameter at the Equator
115) The diagram below represents contourlines on a topographic map with crosssectionline AB.1242 - 1 - Page 18116) Which graph best represents thepercentage by volume of the elementsmaking up the <strong>Earth</strong>'s hydrosphere?A)Which diagram best represents thetopographic profile along line AB?A)B)B)C)D)C)D)
Questions 123 through 125 refer to the following:1242 - 1 - Page 20The diagrams below represent four solid objects made of the same uniform material. The acceptedvalues for the volume and mass of each object are given, except for the volume of object A.123) A sample having a volume of 1 cubiccentimeter was cut from each object.Which is an accurate statement about thesamples?A) Each sample has the same shape.B) The sample from object B has thegreatest volume.C) Each sample has the same mass.D) The sample from object D has thegreatest density.124) What is the volume of object A?A) 8.00 cm3C) 1.00 cm3B) 4.00 cm3D) 2.00 cm3125) Which diagram best shows what wouldhappen if the four objects were placed in alarge beaker of water at roomtemperature?A)B)C)D)
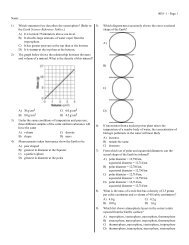
1242 - 1 - Page 21126) The field map below shows the average size of particles deposited by streams that drained anarea of Maryland during the Pleistocene Epoch. The field values represent particle diametersin centimeters.Which particle size would be most common at location X? [Particles are drawn actual size.]A) B) C) D)127) The diagrams below represent 100-gram samples of four different <strong>Earth</strong> materials at roomtemperature. Each material has an initial temperature of 20DC.What happens when the four substances are heated?A) Their volume increases but their mass remains constant.B) Their volume decreases but their mass remains constant.C) Their volume and mass both increase.D) Their volume and mass both decrease.
Questions 128 through 132 refer to the following:1242 - 1 - Page 22The table below shows data for a student's collection of rock samples A through I, which areclassified into groups X, Y, and Z. For each rock sample, the student recorded mass, volume,density, and a brief description. The density for rock D has been left blank.128) The student's classification system isbased onA) densityC) colorB) massD) shape129) To obtain the data recorded in the columnlabeled "Description," the student usedA) a triple-beam balanceB) a calculatorC) her sensesD) an overflow can130) The approximate density of rock sample DisA) 3.32 g/cm3C) 2.75 g/cm3B) 2.67 g/cm3D) 3.75 g/cm3131) Which statement is an inference ratherthan an observation?A) Rock E has a volume of 33.1 cm3.B) Rock B has been rounded by streamaction.C) Rock G is the same color as rock I.D) Rock H is flat.132) The student broke rock G into two pieces.Compared to the density of the originalrock, the density of one piece would mostlikely beA) lessB) the sameC) greater
1242 - 1 - Page 23133) The diagrams below represent four solid objects made of the same uniform material. Theaccepted values for the volume and mass of each object are given, except for the volume ofobject A.A student made four statements about the objects. Which statement was an observation?A) Object C is made of silicon and oxygen.B) Object B is a sphere.C) Object A is a piece of the mineral halite.D) Object D may be able to float due to its shape.134) The diagrams below represent four solid objects made of the same uniform material. Theaccepted values for the volume and mass of each object are given, except for the volume ofobject A.A student incorrectly determines the volume of object C to be 1.90 cubic centimeters. What isthe student's percentage of error?A) 2% B) 5% C) 1% D) 10%
135) The diagrams below represent fossils found at different locations.1242 - 1 - Page 24When classified by similarity of structure, which three fossils should be grouped together?A) A, F, and H B) B, D, and I C) C, F, and J D) E, G, and H136) The graph below shows the changes in height of ocean water over the course of 2 days atone <strong>Earth</strong> location.Which statement concerning these changes is best supported by the graph?A) The changes are noncyclic and occur at sunrise and sunset.B) The changes are cyclic and occur at the same time every day.C) The changes are noncyclic and may occur at any time.D) The changes are cyclic and occur at predictable time intervalQuestions 137 through 139 refer to the following:The Bay of Fundy, located on the east coast of Canada, has the highest ocean tides in the world.The St. John River enters the Bay of Fundy at the city of St. John, where the river actually reversesdirection twice a day at high tides. Data for the famous Reversing Falls of the St. John River aregiven below for high and low tides on June 26 through 28, 1994.
137) Which graph best represents the tidesrecorded on June 28?A)B)138) Tides in the Bay of Fundy are bestdescribed asA) predictable and cyclicB) unpredictable and cyclicC) unpredictable and noncyclicD) predictable and noncyclic1242 - 1 - Page 25139) Compared to the first high tide on June 26,how much later in the day did the first hightide occur on June 27?A) 1 h 10 minC) 50 minB) 10 minD) 5 h 40 minC)D)Questions 140 through 144 refer to the following:The diagram below represents a contour map below. Letters A through K represent locations in thearea. Hachure lines show depressions.
140) Which equation would be used todetermine the stream gradient alongMoose Creek between points J and K?A) gradient = (1,040 m - 960 m) x 20 m1242 - 1 - Page 26142) Which graph best represents the mapprofile along a straight line from point Cthrough point A to point K?B) gradient = x 100C) gradient =A)D) gradient =141) Which hilltop could have an elevation of1,145 meters?A) FB) GC) HD) DB)C)D)143) Toward which direction does Moose Creekflow?A) southwestB) northeastC) southeastD) northwest144) What is the lowest possible elevation ofpoint B?A) 981 mB) 961 mC) 941 mD) 971 m
Questions 145 through 148 refer to the following:1242 - 1 - Page 27Letters A through K are reference points on the contour map below.145) The diagram below represents atopographic profile between two points onthe map.146) What is the latitude and longitude oflocation B?A) 42D191 N 74D331 WB) 42D191 N 74D341 WC) 42D201 N 74D331 WD) 42D201 N 74D341 W147) Which points are located at the sameelevation above sea level?A) I and KB) C and BC) H and ED) A and F148) In which direction is Green River flowing?A) southwestB) northwestC) northeastD) southeastWhich two locations are represented onthe diagram by X and Y, respectively?A) B and HB) A and IC) K and CD) H and E
Questions 149 through 151 refer to the following:1242 - 1 - Page 28The map below shows the southernmost advance of four major stages of continental glaciation inthe central United States. White areas represent land once covered by glacial ice. The generaldirection of ice movement was from north to south.149) Which state was partly or completelycovered by glacial ice during all fourstages of ice advance?A) MissouriB) KentuckyC) IowaD) Kansas150) In the state of Kansas, the averagedistance between the Nebraskan Stage iceboundary and the Kansan Stage iceboundary is approximatelyA) 180 kmB) 90 kmC) 300 kmD) 40 km
151) Which map best represents thesouthernmost advance of the continentalice sheet during the Wisconsinan Stage?1242 - 1 - Page 29A)B)C)D)
1242 - 1 - Page 30Questions 152 through 154 refer to the following:The map below represents a view of the <strong>Earth</strong> looking down from above the North Pole (N.P.),showing the <strong>Earth</strong>'s 24 standard time zones. The Sun's rays are striking the <strong>Earth</strong> from the right.Points A, B, C, and D are locations on the <strong>Earth</strong>'s surface.152) Which two points have the samelongitude?A) B and CC) A and CB) A and DD) B and D153) At which position would the altitude of theNorth Star (Polaris) be greatest?154) Areas within a time zone generally keepthe same standard clock time. In degreesof longitude, approximately how wide isone standard time zone?A) 23\DC) 7\DB) 15DD) 30DA) AB) BC) CD) D
1242 - 1 - Page 31155) The diagram below shows air movements associated with cumulus cloud formation over alake during a summer day. A, B, C, and D are reference points.Point D is 10 kilometers above the <strong>Earth</strong>'s surface. In which layer of the atmosphere is point Dlocated?A) lower mesosphereC) lower stratosphereB) upper troposphereD) upper stratosphereQuestions 156 and 157 refer to the following:The topographic map below represents Keuka Lake, one of the Finger Lakes in New York State.Branchport, Hammondsport, and Penn Yan are towns near the lake.156) According to the map, about how manymiles long is Keuka Lake?A) 24C) 29B) 15D) 19157) If the lake level were to rise to 1,000 feetabove sea level, the area at A wouldA) be under waterB) remain attached to the mainland to thenorthC) become an islandD) become attached to the mainland tothe south
Questions 158 through 161 refer to the following:1242 - 1 - Page 32The map below shows the average date of the last freezing temperatures in the spring at locationsin New York State.158) Which graph best represents the pattern inthe date of the last spring freeze along aline from Buffalo to Rochester?A)159) In which location is the average date ofthe last spring freeze earliest in the year?A) BuffaloB) CooperstownC) MineolaD) Plattsburgh160) Why do the Adirondacks tend to have thelatest date of freezing temperatures inNew York State?B)C)A) They receive more insolation and haveless cloud cover.B) They are surrounded by the AtlanticOcean.C) They receive moist air from theprevailing westerlies from the GreatLakes.D) They are at high latitudes and altitudes.161) The isoline shown as dashed line X in thediagram representsA) May 31C) May 20B) 32D FD) 0D CD)
Questions 162 through 165 refer to the following:1242 - 1 - Page 33The heavy dashed lines on the topographic map below represent four hiking paths, A, B, C, and D.Point P is a location on the map.162) What is the contour interval for this map?A) 20 ftC) 10 ftB) 100 ftD) 25 ft163) On this map, 1 centimeter represents howmany centimeters on the surface of the<strong>Earth</strong>?A) 1,900C) 17,000B) 1,600D) 14,700164) What is the approximate length of theportion of the Erie-Lackawanna railroadtracks shown on the map?A) 2.0 kmC) 2.5 kmB) 3.5 kmD) 3.0 km165) Which path climbs the steepest part of thehill from the railroad tracks to point P?A) AB) BC) CD) D
Questions 166 through 170 refer to the following:1242 - 1 - Page 34Points A through D represent locations in the region.166) What is the approximate change inelevation from point C to point D?169) What is the approximate latitude ofpoint B?A) 280 mC) 300 mA) 74D221 WC) 74D151 WB) 500 mD) 100 mB) 42D161 ND) 42D191 N167) Compared to Mill River, Fern River appearstoA) flow toward the same lakeB) have fewer tributariesC) flow in the opposite directionD) drain a smaller region170) What is the approximate distance betweenpoint A and point B measured along FernRoad?A) 9.0 kmC) 8.0 kmB) 5.0 kmD) 10.0 km168) The top of Fern Mountain could have anelevation ofA) 351 mB) 500 mC) 362 mD) 301 m
171) The diagrams below show the altitude of Polaris at two different <strong>Earth</strong> locations.1242 - 1 - Page 35Which statement is best supported by the diagram?A) The altitude of Polaris varies with the season of the year.B) Polaris is clearly visible only at the North Pole.C) Polaris appears directly overhead at all locations in the Northern Hemisphere.D) The altitude of Polaris is 41D at New York City.172) The diagrams below compare the shapes of the <strong>Earth</strong> and three other planets. (Note: Thediagrams are not drawn to scale.)(Roundness ratio = .)How does the shape of the <strong>Earth</strong> compare to the shape of planets A, B, and C?A) The <strong>Earth</strong> is less round than planets A, B, and C.B) The <strong>Earth</strong> is more round than planets A, B, and C.C) The <strong>Earth</strong> is more round than planets A and B, but less round than planet C.D) The <strong>Earth</strong> is more round than planet A, but less round than planets B and C.
1242 - 1 - Page 36Questions 173 and 174 refer to the following:173) The dashed boundaries between timezones are how many degrees of longitudeapart?A) 10DC) 15DB) 23\DD) 24D174) What is the time in San Francisco when itis 6 a.m. in Dallas?A) 3 a.m.C) 7 a.m.B) 5 a.m.D) 4 a.m.Questions 175 and 176 refer to the following:The isolines on the isoseismal map below connect points of equal earthquake intensity. Letters Athrough H represent locations near an earthquake epicenter. The Modified Mercalli Intensity Scalebelow measures the strength of an earthquake in terms of the effects it produces.
175) What is the approximate latitude andlongitude of the epicenter?A) 43D301 N 106D101 WB) 42D301 N 105D451 WC) 107D101 N 43D301 WD) 106D451 N 42D301 W1242 - 1 - Page 37176) Between which two locations did thegreatest change in earthquake intensityoccur?A) G and HC) C and DB) A and BD) E and F177) The map below shows many of the major faults and fractures in the surface bedrock of NewYork State.A large earthquake associated with one of these faults occurred at 45DN 75DW onSeptember 5, 1994. Which location in New York State was closest to the epicenter of theearthquake?A) BuffaloC) MassenaB) AlbanyD) New York City
1242 - 1 - Page 38Questions 178 and 179 refer to the following:The diagram below shows the latitude zones of the <strong>Earth</strong>.178) What is the total number of degrees oflatitude covered by the Equatorial zone?179) In which latitude zone is New York Statelocated?A) 10DB) 20DC) 0DD) 17DA) North SubtropicalB) North Middle-LatitudeC) North TropicalD) North Polar
180) Letters A through K are reference points on the contour map below.1242 - 1 - Page 39What is the approximate distance along Green River from point A to point F?A) 10 km B) 9 km C) 7 km D) 5 kmQuestions 181 through 185 refer to the following:Points A through C are locations on the contour map below. Elevations are in meters.181) Which side of Lookout Hill has the steepestslope?A) westC) northB) eastD) south
182) Which diagram best represents the profilebetween point B and point C?A)1242 - 1 - Page 40183) The elevation at point A isA) 300 mC) 60 mB) 140 mD) 100 m184) What is the approximate length of thestream between point A and point B?A) 5 kmB) 10 kmC) 7 kmD) 9 kmB)185) In which direction is the stream flowing?A) southwestC) northeastB) southeastD) northwestC)D)
1242 - 1 - Page 41186) The map below shows the location of major islands and coral reefs in the Hawaiian Islandchain. Their ages are given in millions of years.The islands of the Hawaiian chain formed from the same source of molten rock, called a hotplume. The movement of the Pacific Plate over the Hawaiian hot plume created a trail ofextinct volcanoes that make up the Hawaiian Islands. The island of Hawaii (lower right) is themost recent island formed. Kilauea is an active volcano located over the plume on the islandof Hawaii.What is the location of Lisianski Island?A) 26DS 174DW B) 26DS 174DE C) 26DN 174DW D) 26DN 174DE
1242 - 1 - Page 42187) The weather map below shows part of the southern United States and northern Mexico.The isolines on this map connect locations that have the sameA) dewpoint temperatureB) relative humidityC) barometric pressureD) air temperature188) The world map below shows latitude and longitude. Letters A, B, C, and D represent locationson the map.For which location are the correct latitude and longitude given?A) A: 45DS 30DWB) B: 40DN 60DWC) C: 60DN 120DED) D: 30DS 30DW
Questions 189 and 190 refer to the following:1242 - 1 - Page 43Diagram I below represents a stream's profile before an earthquake. Diagram II represents thesame stream's profile after an earthquake elevated a portion of the land and produced a waterfall.189) What was the approximate averagegradient of the stream before theearthquake?A) 0.5 m/kmC) 2 m/kmB) 10 m/kmD) 20 m/km190) Compared to the stream's averagegradient before the earthquake, thestream's average gradient after theearthquake isA) greaterB) lessC) the same191) The diagram below shows an instrument made from a drinking straw, protractor, string, androck.This instrument was most likely used to measure theA) altitude of a starB) mass of the <strong>Earth</strong>C) mass of the suspended weightD) distance to a star
1242 - 1 - Page 44192) The field map below shows the average size of particles deposited by streams that drained anarea of Maryland during the Pleistocene Epoch. The field values represent particle diametersin centimeters.At which location would the sediment particles have an average diameter of 0.33 centimeter?A) A B) B C) C D) D193) The map below shows the average yearly number of thunderstorms in the United States.Approximately how many thunderstorms occur yearly in Albany, New York?A) 32 B) 25 C) 19 D) 41
Questions 194 through 196 refer to the following:1242 - 1 - Page 45The map below shows average annual amounts of precipitation in centimeters for several selectedlocations within New York State.
194) Which map best represents the position ofthe 90-centimeter precipitation isoline?A)B)1242 - 1 - Page 46195) In an eastward direction across New YorkState from Jamestown to Kingston, theaverage annual precipitation generallyA) increases, then decreasesB) decreases, onlyC) decreases, then increasesD) increases, only196) Between which two locations is thechange in precipitation greatest per100 kilometers?A) Albany and KingstonB) Massena and PlattsburghC) Rochester and OswegoD) Buffalo and JamestownC)D)
1242 - 1 - Page 47197) The map below shows geologic features of Cape Cod, Massachusetts. The locations ofseveral towns are shown as small circles.What is the approximate straight-line distance in kilometers from Hyannis to Chatham?A) 25 km B) 15 km C) 21 km D) 5 kmQuestions 198 through 202 refer to the following:Points A and B represent locations on the topographic map below. Elevations are shown in meters.
1242 - 1 - Page 48198) Which map would best represent this areaif sea level were to rise 10 meters?199) Which diagram best represents thetopographic profile from location A tolocation B?A)A)B)B)C)D)C)200) What is the approximate distance acrossCub Inlet from Little Neck Point to BoulderPoint?A) 2.4 kmB) 2.9 kmC) 1.4 kmD) 1.9 kmD)201) What could be the highest elevation onLittle Deer Island?A) 5 mC) 34 mB) 39 mD) 25 m202) Which section of Big Bear Island has thesteepest coastline?A) northeastB) southwestC) northwestD) southeast
1242 - 1 - Page 49203) The diagram below is a west-to-east profile across the Hudson River Valley area showing thebedrock surface and elevation.Which latitude is closest to the profile shown in the diagram?A) 44D301 N B) 43D301 N C) 40D301 N D) 42D301 N204) Map B below shows the average annual precipitation for sections of the United States.Which graph best represents the annual precipitation received along line AB on the map?A)C)B)D)
1242 - 1 - Page 50<strong>205</strong>) The weather map below shows a hurricane that was located over southern Florida. Theisobars show air pressure in inches of mercury. Letter A represents a point near the westcoast of Florida. The barogram shows the recorded air pressure in inches of mercury as thehurricane passed near Miami, Florida.What is the latitude and longitude at the center of the hurricane?A) 34DN 89DW B) 26DN 81DW C) 26DN 89DW D) 34DN 81DW