Detection of Sulfur Compounds in Natural Gas According to ASTM ...
Detection of Sulfur Compounds in Natural Gas According to ASTM ...
Detection of Sulfur Compounds in Natural Gas According to ASTM ...
- No tags were found...

You also want an ePaper? Increase the reach of your titles
YUMPU automatically turns print PDFs into web optimized ePapers that Google loves.
<strong>Detection</strong> <strong>of</strong> <strong>Sulfur</strong> <strong>Compounds</strong> <strong>in</strong> <strong>Natural</strong><strong>Gas</strong> Accord<strong>in</strong>g <strong>to</strong> <strong>ASTM</strong> D5504 withAgilent's Dual Plasma <strong>Sulfur</strong>Chemilum<strong>in</strong>escence Detec<strong>to</strong>r (G6603A) onthe 7890A <strong>Gas</strong> Chroma<strong>to</strong>graphApplicationHydrocarbon Process<strong>in</strong>gAuthorsWenm<strong>in</strong> LiuAgilent Technologies Co. Ltd.412 Y<strong>in</strong>g Lun RoadWaigaoqiao Free Trade ZoneShanghai, 200131Ch<strong>in</strong>aMario MoralesAgilent Technologies, Inc.2850 Centerville RoadWilm<strong>in</strong>g<strong>to</strong>n, DE 19808USAAbstractAn Agilent dual plasma sulfur chemilum<strong>in</strong>escence detec<strong>to</strong>r(DP SCD) comb<strong>in</strong>ed with an onl<strong>in</strong>e dilu<strong>to</strong>r was usedfor the analysis <strong>of</strong> sulfur compounds. By us<strong>in</strong>g thismethod, the detection limits <strong>of</strong> the sulfur compoundsachieved the ppb level. The stability <strong>of</strong> the DP SCD wasalso <strong>in</strong>vestigated. The long-term and short-term stabilityshow that the performance <strong>of</strong> DP SCD is stable, and nohydrocarbon <strong>in</strong>terference was found dur<strong>in</strong>g the analysis<strong>of</strong> natural gas samples.IntroductionMany sources <strong>of</strong> natural gas and petroleum gasesconta<strong>in</strong> vary<strong>in</strong>g amounts and types <strong>of</strong> sulfur compounds.The analysis <strong>of</strong> gaseous sulfur compoundsis difficult because they are polar, reactive, andpresent at trace levels. <strong>Sulfur</strong> compounds poseproblems both <strong>in</strong> sampl<strong>in</strong>g and analysis. Analysis<strong>of</strong> sulfur compounds many times requires specialtreatment <strong>to</strong> sample pathways <strong>to</strong> ensure <strong>in</strong>ertness<strong>to</strong> the reactive sulfur species. Sampl<strong>in</strong>g must bedone us<strong>in</strong>g conta<strong>in</strong>ers proven <strong>to</strong> be nonreactive.Labora<strong>to</strong>ry equipment must also be <strong>in</strong>ert and wellconditioned <strong>to</strong> ensure reliable results. Frequentcalibration us<strong>in</strong>g stable standards is required <strong>in</strong>sulfur analysis [1].GC SCD configuration with <strong>in</strong>ert plumb<strong>in</strong>g is one<strong>of</strong> the best methods <strong>to</strong> detect sulfur compounds <strong>in</strong>different hydrocarbon matrices. <strong>Sulfur</strong> compoundselute from the gas chroma<strong>to</strong>graphic column andare combusted with<strong>in</strong> the SCD burner. These combustionproducts are transferred <strong>to</strong> the SCD detec<strong>to</strong>rbox via vacuum <strong>to</strong> a reaction cell for ozonemix<strong>in</strong>g. This detection technique provides a highlysensitive, selective, and l<strong>in</strong>ear response <strong>to</strong> volatilesulfur compounds.Agilent Technologies DP technology is the detec<strong>to</strong>r<strong>of</strong> choice for sulfur analysis when deal<strong>in</strong>g with ahydrocarbon matrix. The burner easily mounts onthe 6890 and 7890A GCs and <strong>in</strong>corporates featuresfor easier and less frequent ma<strong>in</strong>tenance. In thisapplication, the Agilent 355 DP SCD was used <strong>to</strong>analyze the gaseous sulfur compounds <strong>in</strong> naturalgas. <strong>Detection</strong> limits, stability and l<strong>in</strong>earity were<strong>in</strong>vestigated.ExperimentalAn Agilent 7890A GC configured with a split/splitless <strong>in</strong>let (Sulf<strong>in</strong>ert-treated), and an Agilent355 DP SCD were used. Sample <strong>in</strong>troduction wasthrough a six-port Hastelloy C gas sample valve(GSV) <strong>in</strong>terfaced directly <strong>to</strong> the sulfur-treated <strong>in</strong>letwith Sulf<strong>in</strong>ert tub<strong>in</strong>g. An onl<strong>in</strong>e dilu<strong>to</strong>r was usedfor preparation <strong>of</strong> ppb-level sulfur compounds <strong>in</strong>
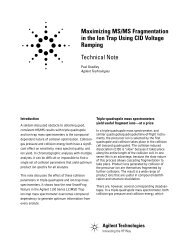
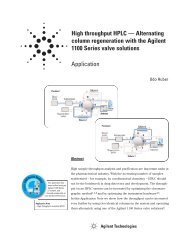
different matrices. Two four-port valves wereused — one for sample <strong>in</strong>troduction and one forstatic sample <strong>in</strong>jection. The valves were <strong>in</strong>stalledsequentially prior <strong>to</strong> the GSV. Figure 1 illustratesthe configuration <strong>of</strong> the gas blend<strong>in</strong>g system andGC SCD.The sulfur standards were blended <strong>in</strong> helium at1 ppm (V/V) and were purchased from Praxair, Inc.(Geismar, LA). See Table 1 for component details.Table 1. <strong>Sulfur</strong> Standards <strong>in</strong> Helium1. Hydrogen sulfide H 2S2. Carbonyl sulfide COS3. Methyl mercaptan CH 3SH4. Ethyl mercaptan CH 4CH 3SH5. Dimethyl sulfide CH 3SCH 36. Carbon disulfide CS 27. 2-propanethiol CH 3SHC 2H 58. Tert-butyl mercaptan (CH 3) 3CSH9. 1-propanethiol CH 3(CH 2) 2SH10. Thiophene C 4H 4S11. n-butanethiol CH 3(CH 2) 3SH12. Diethyl sulfide CH 3CH 2SCH 2CH 313. Methyl ethyl sulfide CH 3SCH 2CH 314. 2-methyl-1-propanethiol (CH 3) 2CHCH 2SH15. 1-methyl-1-propanethiol CH 3CH 2CHSHCH 3Experimental ConditionsGC ConditionsFront InletSplit/splitless (Sulf<strong>in</strong>ert-treatedcapillary <strong>in</strong>let system)Heater 150 °CPressure14.5 psiSeptum purge flow 3 mL/m<strong>in</strong>ModeSplitless<strong>Gas</strong> saver20 mL/m<strong>in</strong> after 2 m<strong>in</strong>Sample loop1 mLOven 30 °C (1.5 m<strong>in</strong>), 15 °C/m<strong>in</strong> 200 °C(3 m<strong>in</strong>)Column HP-1 60 m × 0.53 mm × 5 µmInjection modeStatic flow and dynamic flow modesSCD ConditionsBurner temperature 800 °CVacuum <strong>of</strong> burner 372 <strong>to</strong>rrVacuum <strong>of</strong> reaction cell 5 <strong>to</strong>rrH 240 mL/m<strong>in</strong>Air53 mL/m<strong>in</strong>Results and DiscussionFrom the comparative results <strong>of</strong> the sulfur detec<strong>to</strong>rs’sensitivity, it could be seen that SCD is thebest detec<strong>to</strong>r for sulfur components, especially atlow levels [3]. The Agilent DP technology is themost sensitive and selective detec<strong>to</strong>r for sulfurconta<strong>in</strong><strong>in</strong>ggaseous hydrocarbon samples.Figure 2 is the chroma<strong>to</strong>gram <strong>of</strong> low-level sulfurcompounds at 1.35 ppb (H 2 S), which is preparedby the po<strong>in</strong>t-<strong>of</strong>-use gas blend<strong>in</strong>g system. Table 2 isthe calculated signal <strong>to</strong> noise (S/N) <strong>of</strong> each compound,from the achieved data. It can be seen thatDP SCD can detect low-level sulfur compounds.Mix standard30 m x .25 mmcapillary column(flow restric<strong>to</strong>r)Inlet flow moduleDualPlasmaSCDHeMix<strong>in</strong>g teeSampleloopSample outPCMDead endOn/OffvalveGC-SCDDilu<strong>to</strong>rSample <strong>in</strong>Figure 1.Diagram <strong>of</strong> onl<strong>in</strong>e dilu<strong>to</strong>r GC-DP SCD.2
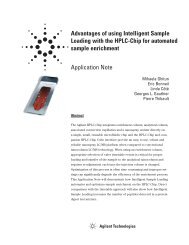
Table 2. S/N <strong>of</strong> Each <strong>Sulfur</strong> Component at 1.35 ppb (Refer <strong>to</strong> Table 1 for peak identification.)Peak No. 1 2 3 4 5 6 7 8 9 10 11 12 13 14 15S/N 12.0 5.0 2.1 2.6 4.9 11.5 4.0 2.7 3.7 9.1 7.6 2.3 5.7 1.0 1.115 µV600500164001130020023 4578 9 10121314 1510000 1 2 3 4 5 6 7 8 9m<strong>in</strong>Figure 2.Chroma<strong>to</strong>gram <strong>of</strong> sulfur compounds <strong>in</strong> helium at 1.35 ppb. (Refer <strong>to</strong> Table 1 for peak identification.)Because the low-level sulfur components were preparedby the onl<strong>in</strong>e dilu<strong>to</strong>r system, which was preparedby adjust<strong>in</strong>g the aux EPC <strong>to</strong> get appropriatediluent flow, high diluent flow could have thepotential <strong>to</strong> cause high pressure <strong>in</strong> the sampleloop, which results <strong>in</strong> the amount <strong>of</strong> the sample <strong>in</strong>the loop be<strong>in</strong>g different when the diluent flowchanges from low <strong>to</strong> high. In this application, twosample <strong>in</strong>jection modes, static and dynamic, were<strong>in</strong>vestigated. The mode is actuated by the on/<strong>of</strong>fvalve <strong>in</strong>stalled prior <strong>to</strong> GSV. When us<strong>in</strong>g static<strong>in</strong>jection mode, the valve is switched <strong>to</strong> the <strong>of</strong>fposition, the pressure <strong>in</strong> the sample loop balances<strong>to</strong> ambient pressure, and then the sample is<strong>in</strong>jected <strong>in</strong><strong>to</strong> the GC.Table 3 shows the l<strong>in</strong>ear ranges <strong>of</strong> the two <strong>in</strong>jectionmodes. The two <strong>in</strong>jection modes have no differencefrom a l<strong>in</strong>earity perspective, which meansthat the two <strong>in</strong>jection modes are both suitablewhen us<strong>in</strong>g the 1-mL sample loop. The 1-mLsample loop’s resistance is not high enough <strong>to</strong>cause variation <strong>in</strong> the sample <strong>in</strong>jection amount.Table 3 L<strong>in</strong>ear Ranges <strong>of</strong> Two Injection Modes (Refer <strong>to</strong> Table 1 for peak identification.)1 2 3 4 5 6 7 8L<strong>in</strong>ear range (ppb) 6.24-544.5Static mode 1 0.99996 0.99995 0.99999 0.99996 0.99999 0.99996 0.99999Dynamic mode 1 0.99996 0.99997 0.99997 0.99996 0.99999 0.99998 0.999989 10 11 12 13 14 15L<strong>in</strong>ear range (ppb) 6.24-544.5Static mode 0.99995 0.99994 0.99996 0.99996 0.99996 0.99998 0.99998Dynamic mode 0.99998 0.99997 0.99998 0.99998 0.99998 1 0.99998Table 4 shows the long-term (72 hours) and shortterm(8 hours) stability <strong>of</strong> the SCD at differentconcentration levels.In an effort <strong>to</strong> <strong>in</strong>vestigate the coelution <strong>of</strong> hydrocarbonand sulfur, the same sulfur standards <strong>in</strong>natural gas were analyzed on the SCD. Figure 3shows the chroma<strong>to</strong>gram; no quench<strong>in</strong>g was found.Table 4 The Long-Term and Short-Term Stability <strong>of</strong> SCD (Refer <strong>to</strong> Table 1 for peak identification.)1 2 3 4 5 6 7 8 9 10 11 12 13 14 1520.79 ppb 2.7 2.6 2.9 3.0 0.9 1.4 2.8 4.0 2.6 1.7 1.7 3.3 3.2 8.6 7.9S.T. RSD (%)L.T. RSD (%) 3.0 2.7 2.4 2.5 1.4 1.5 2.6 4.3 3.8 2.7 2.0 4.9 3.2 7.9 6.91.38 ppb 6.6 10.1 11.7 22.8 30.4 4.1 6.9 18.7 10.7 25.1 5.1 11.1 5.8 29.6 24.1S.T. RSD (%)L.T. RSD (%) 14.4 7.5 16.3 20.8 21.7 4.6 6.1 27.7 23.7 25.3 12.2 24.6 6.1 35.7 38.4ST: Short term (8 hours); LT: Long term (72 hours)3
15 µV200 1 2150310050050 1 2 3 4 5 6 7 8Figure 3.4678 9 10 11/1213 14 15Chroma<strong>to</strong>gram <strong>of</strong> sulfurs <strong>in</strong> natural gas. (Refer <strong>to</strong>Table 1 for peak identification.)<strong>Natural</strong> <strong>Gas</strong> Sample AnalysisThree natural gas samples were analyzed by us<strong>in</strong>gthe GC DP SCD system. Because the concentration<strong>of</strong> the target compounds is at ppm level, split modewas used and the method was recalibrated at ppmlevel. Table 5 shows the result <strong>of</strong> the three gassamples.Table 5. Result <strong>of</strong> the Three Real SamplesSamples H 2S COS MethylMercaptanBLEND AL Conc. (ppm, v/v) 2.3 2.0 2.0RSD (%, n = 5) 2.3 0.3 1.4BLEND 6 Conc. (ppm, v/v) 27.1 21.9 17.3RSD (%, n = 5) 1.2 0.4 2.3BLEND 12 Conc. (ppm, v/v) 15.0 9.2 10.1RSD (%, n = 5) 0.7 0.6 0.6Standard Conc. (ppm, v/v) 2.0 0.8 0.9natural gas RSD (%, n = 5) 1.7 2.5 1.7www.agilent.com/chemConclusionsAn onl<strong>in</strong>e dilu<strong>to</strong>r comb<strong>in</strong>ed with a GC DP SCD issuitable for gaseous sulfur components analysis,especially for the low-level components. The onl<strong>in</strong>edilu<strong>to</strong>r <strong>of</strong>fers an au<strong>to</strong>matable means <strong>of</strong> system calibrationand the detection limits for the trace sulfurdetection are down <strong>to</strong> ppb level. By us<strong>in</strong>g an on/<strong>of</strong>fvalve prior <strong>to</strong> the GSV, both the static and dynamic<strong>in</strong>jection modes <strong>of</strong> the sample gas blend<strong>in</strong>g systemcan be used. The static <strong>in</strong>jection mode is importantwhen a small sample loop with a large resistance isused. The diluter system with GC/SCD is availableas an Agilent SP1, please refer <strong>to</strong> SP1 7890-0375for order <strong>in</strong>formation.References1. <strong>ASTM</strong> D5504-98: Standard test method fordeterm<strong>in</strong>ation <strong>of</strong> sulfur compounds <strong>in</strong> naturalgas and gaseous fuels by gas chroma<strong>to</strong>graphyand chemilum<strong>in</strong>escence2. Roger L. Firor, “Volatile <strong>Sulfur</strong> <strong>in</strong> <strong>Natural</strong> <strong>Gas</strong>,Ref<strong>in</strong>ery <strong>Gas</strong>, and Liquified Petroleum <strong>Gas</strong>,”Agilent Technologies publication 5988-2791EN3. Roger L. Firor and Bruce D. Quimby, “A Comparison<strong>of</strong> <strong>Sulfur</strong> Selective Detec<strong>to</strong>rs for Low-Level Analysis <strong>in</strong> <strong>Gas</strong>eous Streams,” AgilentTechnologies publication 5988-2426ENFor More InformationFor more <strong>in</strong>formation on our products and services,visit our Web site at www.agilent.com/chem.Agilent shall not be liable for errors conta<strong>in</strong>ed here<strong>in</strong> or for <strong>in</strong>cidental or consequentialdamages <strong>in</strong> connection with the furnish<strong>in</strong>g, performance, or use <strong>of</strong> thismaterial.Information, descriptions, and specifications <strong>in</strong> this publication are subject <strong>to</strong> changewithout notice.© Agilent Technologies, Inc. 2008Pr<strong>in</strong>ted <strong>in</strong> the USAAugust 12, 20085989-9234EN