Slayt Başlığı Yok - Anadolu Sigorta
Slayt Başlığı Yok - Anadolu Sigorta
Slayt Başlığı Yok - Anadolu Sigorta
- No tags were found...

You also want an ePaper? Increase the reach of your titles
YUMPU automatically turns print PDFs into web optimized ePapers that Google loves.
INVESTOR PRESENTATION2009Q3
The Sector 3Corporate Profile 12Outline of the Company 18Financial Highlights 25Appendix 322
The Sector Corporate profile Outline of the company Financial highlights Appendix3
Premium Change Over Years(1 USD = 1,482 TRY)Number of Companies (As of 30.09.2009)59736199Foreign National Total470654175143 5258Non Life 19 13 32Life 22 4 26Reinsurance - 2 2Total 41 19 60711 830 94109.07 09.08 09.09Non-LifeLifeTotalPremium Production of the Sector (As of 31.12.2008)(1 USD = 1,512 TRY)Premium Production of the Sector (As of 30.09.2009)(1 USD = 1,482 TRY)31.12.2008(Million USD)Share %30.09.2009(Million USD)Share %Non Life 6.746 86,6Life 1.042 13,4Total 7.788 100Non Life 5.258 84,8Life 941 15,2Total 6.199 1004
Non-insured ratio877,03m65,1%68,0%80%70%65460%50%40%‣14 million of vehicles and 7 million ofautomobiles in Turkey.321018,4%22,9%2,17m6,9%0,38m0,2m 11,4%automobile mini-bus bus pick-upvan25,0%2,28m1,36m0,73mtruck tractor motorbike30%20%10%0%‣Almost 22% of houses had amandatory earthquake policy in 2008‣Last year there were almost 26,5minternet users in Turkey.Number of mandatory earthquake policies over years2,84m‣There are almost 43,8million of creditcard users in Turkey.2,41m2,55m2,61m‣%26 of Turkey’s population is in 0-14age bracket and %49 is in 14-44.2,09m2004 2005 2006 2007 2008‣ SOURCE: turkstat, State PlanningOrganization, Association ofInsurance Companies, bkm, tramer5
COMPANYMARKETSHARE FOREIGN CAPITAL STAKETRANSACTIONPRICEYEARBaşak <strong>Sigorta</strong> 5,1% 56,7%GroupamaBaşak Emeklilik 13,3% 41,0%268 Million USD 2006Emek Hayat - Global Equities Management 100,0% 1,5 Million TRY 2006İhlas <strong>Sigorta</strong> 1,4% HDI International 100,0% 16,75 Million Euro 2006Şeker <strong>Sigorta</strong> 1,6% Liberty Mutual Group 63,9% - 2006İsviçre <strong>Sigorta</strong> 6,9% Ergo Group 75,0% - 2006İsviçre Hayat 1,8% Ergo Group 67,5% - 2006Global Hayat 0,2% Denizbank-Dexia 99,6% 2,7 Million TRY 2007Ray <strong>Sigorta</strong> 3,2% TBIH 58,2% 81,48 Million USD 2007Garanti <strong>Sigorta</strong> 4,5% Eureko 80,0% 365 Million Euro 2007Garanti Emeklilik 7,1% Eureko 15,0% 100 Million Euro 2007Genel <strong>Sigorta</strong> 3,5% MapfreGenel Yaşam 1,7% Mapfre80,0% 285 Million Euro 2007Axa Oyak <strong>Sigorta</strong> 12,2% 35,5%AxaAxa Oyak Hayat 4,7% 50,0%525 Million USD 2008Koç Allianz 9,1% Allianz SE 43,4% 248 Million Euro 2008Koç Allianz Hayat 5,2% Allianz SE 49,0% 125 Million Euro 2008Güven Sigota 2,3% 99,0%GroupamaGüven Hayat 1,2% 99,0%180 Million Euro 2008‣ The amount paid in mergers and acquisitions is almost 5 - 5,5 times greater than company’s Mcaps.6
30.09.2009NON LIFE COMPANIESPREMIUMPRODUCTION(Million USD)MarketShare %Axa 647,0 12,3%<strong>Anadolu</strong> 596,0 11,3%Allianz 473,9 9,0%Ak <strong>Sigorta</strong> 435,3 8,3%Ergo Isvicre 360,3 6,9%Gunes 326,3 6,2%Eureko 278,2 5,3%Groupama 272,9 5,2%Yapı Kredi 269,8 5,1%Mapfre 189,2 3,6%Other 1.409,0 26,8%TOP TEN COMPANIES 3.848,9 73,2%TOTAL* 5.257,9 100,0%Mapfre4%Yapı Kredi5%Groupama5%Other27%Eureko5%Gunes6%Axa12%<strong>Anadolu</strong>12%Allianz9%Ak <strong>Sigorta</strong>8%Ergo Isvicre7%*Total premium production of Non Life Insurance Sector (1 USD = 1,482 TRY)7
Type of Coverage 30.09.2009 30.09.2008 Change (%) Share 30.09.2009 (%)Fire 822,2 777,1 5,8 15,6Earthquake(Compulsory) 170,5 139,6 22,2 3,2Marine 188,4 214,2 -12,0 3,6Motor Third Party Liability 1.116,4 1.033,5 8,0 21,2Accident 1.596,1 1.717,1 -7,0 30,4Personal Accident 248,5 238,7 4,1 4,7Credit 14,5 20,3 -28,5 0,3Legal Protection 18,0 16,2 11,4 0,3Engineering 310,2 266,3 16,5 5,9Agriculture 91,4 77,1 18,5 1,7Health 681,7 646,4 5,5 13,0TOTAL 5.257,9 5.146,3 2,2 100,08
2007 2008 2009 (Est.) 2010 (Est.)Inflation Rates (%) 8,4 10 5,4 5,3GDP Change (%) 4,7 0,9 (6,0) 3,5GDP (Per Person) ($) 9.221 10.285 8.456 8.821GDP (Per Person) (TRY) 12.002 13.367 13.167 14.152‣New Comers‣Competition‣Nontariff system in MTPL‣Global Economic Crisis‣New BranchesPremium Increase (%)(non life)15,9 6,3 2,5 4‣ SOURCE: turkstat, StatePlanning Organization9
Premium Production Over Years(million TRY) (non-life sector)12.00010.0009.60010.204 10.4608.0008.2826.5746.0005.5624.0002.00002004 2005 2006 2007 20082009(EST)10
Premium Per Person(non-life sector)1801601501611651401251301201091061101008092698189Premium (TRY)Premium ($)60402002004 2005 2006 2007 2008 2009(EST)11
The Sector Corporate profile Outline of the company Financial highlights Appendix12
‣ Founded by Türkiye İşbankası A.Ş. in 1925(Celebrating 84’th anniversary)‣ First National Insurance Company‣ Main activity: Non-life insurance (until 1991, bothlife and non-life)‣ Has been a leading company13
‣ To make <strong>Anadolu</strong> Insurance Company the insurance brandpreferred by everyone who needs insurance.‣ To achieve a strength that makes it a reference point inthe worldwide insurance industry as well.‣ To be a pioneer‣ To create a broad public awareness of insurance‣ To implement a customer-focused approach‣ To increase the financial strength‣ To enhance the value of the Company14
Headquarter: İstanbulRegional Branches : İstanbul (2)OverseasAnkaraAntalyaİzmirAdanaBursaZonguldakTrabzon: North CyprusDistribution Channels : 1541 Professional Agencies1074 İşbank Branchesİşbank; 8,4%Indirect; 4,5%Broker; 8,6%Direct; 3,0%Agencies;75,4%15
Area of activity : all non-life branches‣ Fire‣ Marine‣ Accident‣ Motor Third Party Liability‣ Personal Accident‣ Engineering‣ Legal Protection‣ Health‣ Others (agriculture, credit)16
As of 30.09.2009:(1 USD=1,482TRY) Paid – in capital ~ 287 million USD (425 million TRY) Market capital ~ 376 million USD (557 million TRY) Free floating Ratio ~ 48 %Other; 43%Türkiye İşBankası A.Ş.;35%MilliReasüransA.Ş.; 22%17
The Sector Corporate profile Outline of the company Financial highlights Appendix18
Type of Coverage 30.09.2009 30.09.2008 Change (%)Fire 87,6 82,8 5,9Earthquake(Compulsory) 21,2 18,3 15,7Marine 27,8 30,5 -8,9Motor Third Party Liability 125,9 100,5 25,2Accident 203,6 207,8 -2,0Personal Accident 21,7 21,3 2,0Credit 0,1 0,1 -6,1Legal Protection 2,4 2,4 -0,6Engineering 31,0 24,3 27,7Agriculture 5,2 5,6 -8,4Health 69,7 60,9 14,3TOTAL 596,0 554,5 7,519
30.09.2009Type of Coverage Market Share (%) Market RankFire 10,7 3Earthquake(Compulsory) 12,4 2Marine 14,7 1Accident 12,8 2Motor Third Party Liability 11,3 3Engineering 10,0 3Agriculture 5,7 4Health 10,2 3Legal Protection 13,1 3Personal Accident 8,7 4Credit 1 6TOTAL 11,3 220
140120117,710080604020025,254,221,696,7net profittech. profit-202006 2007 2008-15,121
25,023,120,017,415,012,013,1ROE (<strong>Anadolu</strong>)10,0ROE (sector)6,16,15,00,02006 (%) 2007 (%) 2008 (%)22
10,09,09,28,07,06,05,55,04,03,74,1ROA (<strong>Anadolu</strong>)ROA (sector)3,02,62,01,71,00,02006 (%) 2007 (%) 2008 (%)23
‣“Focusing profitability along with growth” strategy has beensucceed and we managed to score 117.7m TRY net profit with%117 increase compared to 2007.‣Premium portfolio has been reviewed and risky policies wereeliminated. We succeed better technical profit for almost allbranches in 2008 by reaching lower loss ratios.‣Automobile insurance policy prices have been reviewed andadapted to current economic conditions. We expect a positiveimpact in our technical profit.24
The Sector Corporate profile Outline of the company Financial highlights Appendix25
Assets 30.09.2009 30.09.2008 Change(%)Cash + Marketable Sec. 632,6 545,1 16,1Receivables 256,3 274,7 -6,7Equity Participations 116,7 83,0 40,7Fixed Assets 25,8 25,7 0,3Other Assets 66,2 52,4 26,4TOTAL 1.097,6 980,9 11,926
Liabilities 30.09.2009 30.09.2008 Change(%)Payables 54,6 50,7 7,7Technical Provisions 527,9 467,4 12,9Shareholders' Equity 491,6 433,8 13,3Other Liabilities 23,5 29,0 -18,7TOTAL 1.097,6 980,9 11,927
Income Statement(sum. in USD millions, 1 USD= 1,482 TRY)30.09.2009 30.09.2008 Change (%)Total Technical Income 535,9 453,9 15,3Total Technical Expenses -502,5 -400,1 20,4Technical Profit 33,4 53,8 -60,8Financial Income 92,8 80,3 13,4Financial Expenses -87,1 -56,5 35,1Financial Profit 5,7 23,8 -316,9Gross Profit / Loss 39,1 67,6 -72,928
Technical Figures (As of 30.09.2009)InvestmentIncomeTransferred73,314%Technical Income (m$)OtherTechnicalIncome12,02%OperatingExpenses130,226%Technical Expenses (m$)Net ClaimsNet EarnedPremiums450,584%NetProvisions24,35%Paid348,069%29
120,00%108,85%100,00%30.09.200980,00%82,13%Claims Ratio %82,13Expense Ratio %11,5760,00%Net Commission Ratio %15,15Combined Ratio %108,8540,00%20,00%11,57%15,15%0,00%Claims Ratio Expense RatioNet Comm.RatioCombinedRatio30
Company’s Portfolio (As of 30.09.2009)1% 4%7%32%STOCKSBONDS‣ Almost all of our bank depositsmature in 1 to 3 months time andbonds generally in 1 - 1,5 year.56%BANK DEPOSİTSINVESTMENT FUNDSOTHER‣ Our aim is to diversify our portfolioand gain more flexibility againstpossible fluctuations especially onglobal financial crisis times.31
The Sector Corporate profile Outline of the company Financial highlights Appendix32
‣ In 2008, <strong>Anadolu</strong> <strong>Sigorta</strong> was again chosen as “the most satisfactoryinsurance company with its products and services” in the makalem.comwebsite and in which over 80.000 people voted. As a result of this poll, theCompany received the Active Academy Private Customer Satisfaction Awardin Insurance.‣ In late 2004 <strong>Anadolu</strong> <strong>Sigorta</strong> was entitled for ISO 9001:2000 QualityManagement System Certification which is a guide for policyholders about ourhigh-quaility service.‣ In 2009 <strong>Anadolu</strong> <strong>Sigorta</strong> was chosen the most popular and favoritebrand, among the other insurance companies by a poll made by GFK group.33
‣ To continue financial andtechnical profitability.‣ To keep leading position by givingimportance to lower loss ratios.‣ Efficent use of resources and tryto cut down the costsTargets 2009 (%)ROE 12ROA 5Premium Increase 8Market Share 11,534
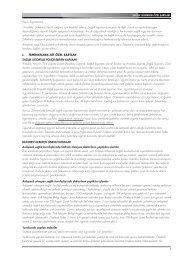
DisclaimerThis presentation contains forward-looking statements and information onthe business development of <strong>Anadolu</strong> <strong>Sigorta</strong>. These statements may bespoken or written and can be recognized by terms such as“expects”, “anticipates”, “intends”, “plans”, “seeks” or words with similarmeaning. These statements are based on assumptions relating to thedevelopment of the economies of individual countries, and in particular ofthe insurance industry, which we have made on the basis of the informationavailable to us and which we consider to be realistic at the time of going topress. The estimates given involve a degree of risk, and the actualdevelopments may differ from those forecasts.<strong>Anadolu</strong> <strong>Sigorta</strong> does not accept any liability whatsoever for any direct orconsequential loss arising from any use of this document or its content dueto misleading information in this document.35
Thank you…For further information pleasee-mailbsafak@anadolusigorta.com.tr,ccozer@anadolusigorta.com.tror call <strong>Anadolu</strong> <strong>Sigorta</strong> Investor Relations on(+90 212 350 02 54),(+90 212 350 01 64)36