Small Area Estimation of Poverty
Small Area Estimation of Poverty Small Area Estimation of Poverty
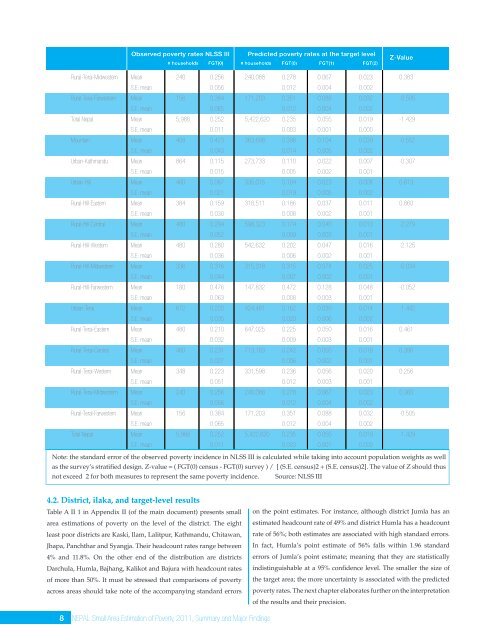
4. Results4.1 Strata-level results in comparison with NLSS3To get a general idea of the larger welfare trends, as wellas to judge the accuracy of our prediction models, we firstcompare the small-area estimations against the povertyincidence directly observed from NLSS3 at the strata level.This is the lowest level at which the household survey isrepresentative. Strata-level poverty rates are presentedin Table 2. The Z-value can be used to assess whetherthe predicted measure of poverty incidence FGT(0) iswithin two standard errors from the observed FGT(0) inthe NLSS3 11 . These Z-scores indicate that the small-areaestimations of poverty incidence based on our regionalmodels are generally within two standard errors of thepoverty incidence rates in the survey. However, two outof the 15 results fall outside the confidence interval of twostandard errors. Poverty incidence in rural central hilland rural western hill are predicted to be respectively17.4% and 20.2% compared to direct estimates from thesurvey of respectively 29.4% and 28%. Another thing tobe noted from the table is that the three regional modelsseem to do similarly well in predicting poverty. Povertyfor Nepal as a whole lies well within the 2 standard errorbounds. It also reflects the trend of a poverty rate thatis decreasing over time: the country’s headcount ratecontinues its steady decline from 60 % in 1995/96, to49 % in 2003/04, to 25% in 2010/11, using comparableconcepts of consumption (monthly recall) and povertylines.The small area estimations of poverty, though generallywithin the confidence interval, are for the majority ofstrata somewhat lower than the direct estimates from thehousehold survey. This could be related to an issue notedearlier - census means of common variables being mostly‘better off’ than population-weighted survey means.Table 2: Predicted poverty rates on the target level - by stratum and in comparison to NLSS3 poverty ratesObserved poverty rates NLSS IIIPredicted poverty rates at the target level# households FGT(0) # households FGT(0) FGT(1) FGT(2)Z-ValueMountain Mean 408 0.423 363,698 0.398 0.104 0.039 -0.552S.E. mean 0.043 0.014 0.005 0.002Urban-Kathmandu Mean 864 0.115 273,733 0.110 0.022 0.007 -0.307S.E. mean 0.015 0.005 0.002 0.001Urban-Hill Mean 480 0.087 335,015 0.104 0.023 0.008 0.613S.E. mean 0.021 0.019 0.005 0.002Rural-Hill-Eastern Mean 384 0.159 318,511 0.186 0.037 0.011 0.860S.E. mean 0.030 0.008 0.002 0.001Rural-Hill-Central Mean 480 0.294 598,323 0.174 0.040 0.013 -2.279S.E. mean 0.052 0.009 0.003 0.001Rural-Hill-Western Mean 480 0.280 542,632 0.202 0.047 0.016 -2.125S.E. mean 0.036 0.006 0.002 0.001Rural-Hill-Midwestern Mean 336 0.316 315,318 0.315 0.074 0.025 -0.034S.E. mean 0.044 0.007 0.002 0.001Rural-Hill-Farwestern Mean 180 0.476 147,832 0.472 0.128 0.048 -0.052S.E. mean 0.063 0.008 0.003 0.001Urban-Terai Mean 672 0.220 424,461 0.162 0.039 0.014 -1.442S.E. mean 0.035 0.020 0.006 0.002Rural-Terai-Eastern Mean 480 0.210 647,025 0.225 0.050 0.016 0.461S.E. mean 0.032 0.009 0.003 0.001Rural-Terai-Central Mean 480 0.231 713,183 0.242 0.055 0.018 0.390S.E. mean 0.027 0.006 0.002 0.001Rural-Terai-Western Mean 348 0.223 331,598 0.236 0.056 0.020 0.256S.E. mean 0.051 0.012 0.003 0.00111. It is defined as: Z = ( FGT(0) census - FGT(0) survey ) / √[ (S.E. census)2 + (S.E. census)2]. The value of Z should thus not exceed │2│for both measures to represent the samepoverty incidence.NEPAL Small Area Estimation of Poverty, 2011, Summary and Major Findings 7
Observed poverty rates NLSS IIIPredicted poverty rates at the target level# households FGT(0) # households FGT(0) FGT(1) FGT(2)Z-ValueRural-Terai-Midwestern Mean 240 0.256 240,088 0.278 0.067 0.023 0.383S.E. mean 0.056 0.012 0.004 0.002Rural-Terai-Farwestern Mean 156 0.384 171,203 0.351 0.088 0.032 -0.505S.E. mean 0.065 0.012 0.004 0.002Total Nepal Mean 5,988 0.252 5,422,620 0.235 0.055 0.019 -1.429S.E. mean 0.011 0.003 0.001 0.000Mountain Mean 408 0.423 363,698 0.398 0.104 0.039 -0.552S.E. mean 0.043 0.014 0.005 0.002Urban-Kathmandu Mean 864 0.115 273,733 0.110 0.022 0.007 -0.307S.E. mean 0.015 0.005 0.002 0.001Urban-Hill Mean 480 0.087 335,015 0.104 0.023 0.008 0.613S.E. mean 0.021 0.019 0.005 0.002Rural-Hill-Eastern Mean 384 0.159 318,511 0.186 0.037 0.011 0.860S.E. mean 0.030 0.008 0.002 0.001Rural-Hill-Central Mean 480 0.294 598,323 0.174 0.040 0.013 -2.279S.E. mean 0.052 0.009 0.003 0.001Rural-Hill-Western Mean 480 0.280 542,632 0.202 0.047 0.016 -2.125S.E. mean 0.036 0.006 0.002 0.001Rural-Hill-Midwestern Mean 336 0.316 315,318 0.315 0.074 0.025 -0.034S.E. mean 0.044 0.007 0.002 0.001Rural-Hill-Farwestern Mean 180 0.476 147,832 0.472 0.128 0.048 -0.052S.E. mean 0.063 0.008 0.003 0.001Urban-Terai Mean 672 0.220 424,461 0.162 0.039 0.014 -1.442S.E. mean 0.035 0.020 0.006 0.002Rural-Terai-Eastern Mean 480 0.210 647,025 0.225 0.050 0.016 0.461S.E. mean 0.032 0.009 0.003 0.001Rural-Terai-Central Mean 480 0.231 713,183 0.242 0.055 0.018 0.390S.E. mean 0.027 0.006 0.002 0.001Rural-Terai-Western Mean 348 0.223 331,598 0.236 0.056 0.020 0.256S.E. mean 0.051 0.012 0.003 0.001Rural-Terai-Midwestern Mean 240 0.256 240,088 0.278 0.067 0.023 0.383S.E. mean 0.056 0.012 0.004 0.002Rural-Terai-Farwestern Mean 156 0.384 171,203 0.351 0.088 0.032 -0.505S.E. mean 0.065 0.012 0.004 0.002Total Nepal Mean 5,988 0.252 5,422,620 0.235 0.055 0.019 -1.429S.E. mean 0.011 0.003 0.001 0.000Note: the standard error of the observed poverty incidence in NLSS III is calculated while taking into account population weights as wellas the survey’s stratified design. Z-value = ( FGT(0) census - FGT(0) survey ) / √[ (S.E. census)2 + (S.E. census)2]. The value of Z should thusnot exceed │2│for both measures to represent the same poverty incidence. Source: NLSS III4.2. District, ilaka, and target-level resultsTable A II 1 in Appendix II (of the main document) presents smallarea estimations of poverty on the level of the district. The eightleast poor districts are Kaski, Ilam, Lalitpur, Kathmandu, Chitawan,Jhapa, Panchthar and Syangja. Their headcount rates range between4% and 11.8%. On the other end of the distribution are districtsDarchula, Humla, Bajhang, Kalikot and Bajura with headcount ratesof more than 50%. It must be stressed that comparisons of povertyacross areas should take note of the accompanying standard errorson the point estimates. For instance, although district Jumla has anestimated headcount rate of 49% and district Humla has a headcountrate of 56%; both estimates are associated with high standard errors.In fact, Humla’s point estimate of 56% falls within 1.96 standarderrors of Jumla’s point estimate; meaning that they are statisticallyindistinguishable at a 95% confidence level. The smaller the size ofthe target area; the more uncertainty is associated with the predictedpoverty rates. The next chapter elaborates further on the interpretationof the results and their precision.8 NEPAL Small Area Estimation of Poverty, 2011, Summary and Major Findings
- Page 2: NEPALSmall Area Estimation of Pover
- Page 5 and 6: Table of ContentsPrefaceiiiTable of
- Page 7 and 8: The character of the spatial distri
- Page 9 and 10: 2. Methodology2.1 Small-area estima
- Page 11 and 12: 3. Data sources and description3.1
- Page 13: eason for this is to improve usabil
- Page 17 and 18: Figure 2: Poverty incidence on dist
- Page 19 and 20: Figure 6- Poverty incidence on targ
- Page 21 and 22: 5.2 Breakdown of standard errorsHow
- Page 23 and 24: ReferencesAlderman, H., Babita, M.,
- Page 25 and 26: A 1: SAE Poverty Rates at the Distr
- Page 27 and 28: A 2: SAE Poverty Rates at the Targe
- Page 29 and 30: A 3: SAE Poverty Rates at the Ilaka
- Page 32 and 33: A 3: SAE Poverty Rates at the Ilaka
- Page 34 and 35: A 3: SAE Poverty Rates at the Ilaka
- Page 36 and 37: A 3: SAE Poverty Rates at the Ilaka
- Page 38 and 39: A 3: SAE Poverty Rates at the Ilaka
- Page 41 and 42: A 3: SAE Poverty Rates at the Ilaka
- Page 43 and 44: A 3: SAE Poverty Rates at the Ilaka
- Page 45 and 46: A 3: SAE Poverty Rates at the Ilaka
- Page 47 and 48: A 3: SAE Poverty Rates at the Ilaka
- Page 49 and 50: A 4: SAE Poverty Rates at the “Ta
- Page 51 and 52: A 4: SAE Poverty Rates at the “Ta
- Page 53: A 5 : SAE of target areas( having n
Observed poverty rates NLSS IIIPredicted poverty rates at the target level# households FGT(0) # households FGT(0) FGT(1) FGT(2)Z-ValueRural-Terai-Midwestern Mean 240 0.256 240,088 0.278 0.067 0.023 0.383S.E. mean 0.056 0.012 0.004 0.002Rural-Terai-Farwestern Mean 156 0.384 171,203 0.351 0.088 0.032 -0.505S.E. mean 0.065 0.012 0.004 0.002Total Nepal Mean 5,988 0.252 5,422,620 0.235 0.055 0.019 -1.429S.E. mean 0.011 0.003 0.001 0.000Mountain Mean 408 0.423 363,698 0.398 0.104 0.039 -0.552S.E. mean 0.043 0.014 0.005 0.002Urban-Kathmandu Mean 864 0.115 273,733 0.110 0.022 0.007 -0.307S.E. mean 0.015 0.005 0.002 0.001Urban-Hill Mean 480 0.087 335,015 0.104 0.023 0.008 0.613S.E. mean 0.021 0.019 0.005 0.002Rural-Hill-Eastern Mean 384 0.159 318,511 0.186 0.037 0.011 0.860S.E. mean 0.030 0.008 0.002 0.001Rural-Hill-Central Mean 480 0.294 598,323 0.174 0.040 0.013 -2.279S.E. mean 0.052 0.009 0.003 0.001Rural-Hill-Western Mean 480 0.280 542,632 0.202 0.047 0.016 -2.125S.E. mean 0.036 0.006 0.002 0.001Rural-Hill-Midwestern Mean 336 0.316 315,318 0.315 0.074 0.025 -0.034S.E. mean 0.044 0.007 0.002 0.001Rural-Hill-Farwestern Mean 180 0.476 147,832 0.472 0.128 0.048 -0.052S.E. mean 0.063 0.008 0.003 0.001Urban-Terai Mean 672 0.220 424,461 0.162 0.039 0.014 -1.442S.E. mean 0.035 0.020 0.006 0.002Rural-Terai-Eastern Mean 480 0.210 647,025 0.225 0.050 0.016 0.461S.E. mean 0.032 0.009 0.003 0.001Rural-Terai-Central Mean 480 0.231 713,183 0.242 0.055 0.018 0.390S.E. mean 0.027 0.006 0.002 0.001Rural-Terai-Western Mean 348 0.223 331,598 0.236 0.056 0.020 0.256S.E. mean 0.051 0.012 0.003 0.001Rural-Terai-Midwestern Mean 240 0.256 240,088 0.278 0.067 0.023 0.383S.E. mean 0.056 0.012 0.004 0.002Rural-Terai-Farwestern Mean 156 0.384 171,203 0.351 0.088 0.032 -0.505S.E. mean 0.065 0.012 0.004 0.002Total Nepal Mean 5,988 0.252 5,422,620 0.235 0.055 0.019 -1.429S.E. mean 0.011 0.003 0.001 0.000Note: the standard error <strong>of</strong> the observed poverty incidence in NLSS III is calculated while taking into account population weights as wellas the survey’s stratified design. Z-value = ( FGT(0) census - FGT(0) survey ) / √[ (S.E. census)2 + (S.E. census)2]. The value <strong>of</strong> Z should thusnot exceed │2│for both measures to represent the same poverty incidence. Source: NLSS III4.2. District, ilaka, and target-level resultsTable A II 1 in Appendix II (<strong>of</strong> the main document) presents smallarea estimations <strong>of</strong> poverty on the level <strong>of</strong> the district. The eightleast poor districts are Kaski, Ilam, Lalitpur, Kathmandu, Chitawan,Jhapa, Panchthar and Syangja. Their headcount rates range between4% and 11.8%. On the other end <strong>of</strong> the distribution are districtsDarchula, Humla, Bajhang, Kalikot and Bajura with headcount rates<strong>of</strong> more than 50%. It must be stressed that comparisons <strong>of</strong> povertyacross areas should take note <strong>of</strong> the accompanying standard errorson the point estimates. For instance, although district Jumla has anestimated headcount rate <strong>of</strong> 49% and district Humla has a headcountrate <strong>of</strong> 56%; both estimates are associated with high standard errors.In fact, Humla’s point estimate <strong>of</strong> 56% falls within 1.96 standarderrors <strong>of</strong> Jumla’s point estimate; meaning that they are statisticallyindistinguishable at a 95% confidence level. The smaller the size <strong>of</strong>the target area; the more uncertainty is associated with the predictedpoverty rates. The next chapter elaborates further on the interpretation<strong>of</strong> the results and their precision.8 NEPAL <strong>Small</strong> <strong>Area</strong> <strong>Estimation</strong> <strong>of</strong> <strong>Poverty</strong>, 2011, Summary and Major Findings


