1 MoLE Gas Laws Activities* To begin this ... - John I. Gelder
1 MoLE Gas Laws Activities* To begin this ... - John I. Gelder
1 MoLE Gas Laws Activities* To begin this ... - John I. Gelder
- No tags were found...

You also want an ePaper? Increase the reach of your titles
YUMPU automatically turns print PDFs into web optimized ePapers that Google loves.
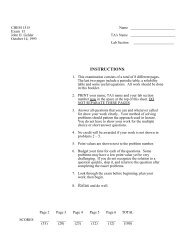
<strong>MoLE</strong> <strong>Gas</strong> <strong>Laws</strong> Activities *<strong>To</strong> <strong>begin</strong> <strong>this</strong> assignment you must be able to log on to the Internet using InternetExplorer (Microsoft) 4.5 or higher. If you do not have the current version of the browser, go tohttp://www.microsoft.com/downloads and follow the instructions on the page. You will needInternet Explorer for your particular operating system. If you have any difficulties contact yourinstructor.Once the browser is running, type the following address into the location-input line nearthe top of the Internet Explorer window:http://intro.chem.okstate.edu/NSFCCLI/<strong>Gas</strong>Law/GLP.htmThis will load the <strong>Gas</strong> Simulation. Once you have the simulation is running your screen willlook like what is shown in left hand section of Figure I. below.Control Bar Region<strong>Gas</strong> Sample RegionGraphing RegionFigure I.There are three important regions that require some discussion. The <strong>Gas</strong> Sample Regionhas the most activity. It is a container with a plunger. <strong>To</strong> explore the behavior of the gas sample* ” Michael R. Abraham & <strong>John</strong> <strong>Gelder</strong>, September 20021
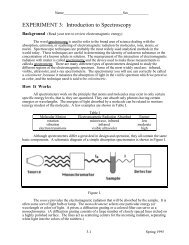
you can change the variables located in the Control Bar Region. The Control Bar Region showsfive scrollbars: pressure (in units of atmospheres), volume (in units of liters), mol of gas (one forHe gas and the other for Ne gas), and temperature (in units of Kelvins). <strong>To</strong> the left of eachscrollbar is a radio button. When selected, that particular variable (called the dependent variable)is calculated based on the value of the other four variables. In the default mode the pressurescrollbar's radio button is selected so the pressure of the gas sample is calculated.As a simple exploration try moving each of the scrollbars and observe the effect on thegas sample. These effects will be addressed in more detail in <strong>this</strong> experiment.There are three buttons immediately below the Control Bar Region. The Pause buttonwill suspend the motion in the gas sample, the Reset button returns the program to the defaultconditions, and the Enable Tracking button turns a red tracking line on and off.Below the Pause Button is a fourth button different from the previous three in that it is adropdown menu. Clicking and holding the mouse button will reveal three choices: Velocities(default); Relations (graphing); and Help.Figure II.The default mode is Velocities. The Velocity Distribution Region shows a plot of thevelocity distribution in the gas sample (see Figure II.). The y-axis of <strong>this</strong> plot represents thenumber of particles. The x-axis represents the range of velocities starting at zero. The bars in <strong>this</strong>plot represent the velocities of the particles in the <strong>Gas</strong> Sample Region. As the velocities of theparticles change, the plot is redrawn. The smooth curved line in the plot represents the idealdistribution of the velocities for the gas sample. The vertical line represents the average (rootmean-squareaverage) velocity of the sample. Observe the behavior of <strong>this</strong> region while changingeach of the variables in the Control Bar Region. In the <strong>Gas</strong> Sample Region, one of the particles islabeled with a red dot. This same particle is identified in red in the velocity distribution plot. Ifyou click on the enable tracking button, you can follow the path of the particle. The length of thetail represents a fixed unit of time, and consequently can be used as a measure of the velocity ofthe particle. If you pause the motion of the particles, you can click on different particles to get ameasure of their velocity.A second choice from the drop down menu is the Relations view. This choice reveals anx,y graph with a dropdown menu on each axis. Selecting the dropdown menu on either axis2
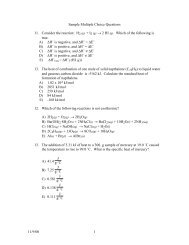
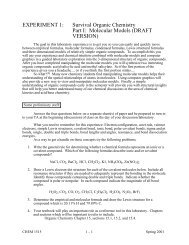
provides a list of the variables shown in the Control Bar Region. The two buttons, Enable andMultiple are used when plotting pairs of variables. If you select pressure for the y-axis andvolume for the x-axis, and the click on “Enable,” these same variables are activated in theControl Bar Region. By scrolling the volume slide bar in the Control Bar Region you will traceout a plot that will look similar to Figure III.Figure III.The Multiple Button allows two or more plots to be superimposed. Select Pressure and Volumeas the variable to be plotted on your graph. Then click on the Multiple button and adjust thetemperature to 400 K. Click on the Enable button and scroll the Volume slide bar. Click on theDisable button and change the temperature to 200 K. Click on the Enable button and scroll theVolume slide bar. Repeat <strong>this</strong> process for the minimum temperature. You will see a graph thatlooks similar to Figure IV.Figure IV.Got the hang of it? If you have any questions check with another student in the class,your instructor.3
<strong>Gas</strong> Pressure and Volume RelationshipsExp. Computer Simulation -A *Name________________________________Lab Section___________________________Problem Statement: How are the pressure and volume of a gas sample related?I. Data Collection:A. Open the <strong>Gas</strong> Law Simulation program and observe and describe, in the space below, theactivity in the <strong>Gas</strong> Sample window. Consider using the some or all of the following terms inyour description: particles, atoms, molecules, collisions, velocity, energy, force.B. One of the objects in the window is colored differently than the others. Enable the trackingfunction and trace the path of a particle from one side of the screen to the other in the spacebelow. Explain any changes in velocity or direction that you observe.* ” Michael R. Abraham & <strong>John</strong> <strong>Gelder</strong>, September 20024
C. Record the values for pressure, volume and temperature on the digital read-outs of theControl Bar window.D. Observe the action in the Velocity Distribution window. Relate what you see with thebehavior of the objects in the <strong>Gas</strong> Sample window.Click the Pause button and sketch and label the graph in the space below.E. Using the controls in the Control Bar window, fix Pressure as a dependent variable byclicking on its radio button. Change the volume of the container using the Volume slider barand observe what happens to the pressure of the system. Also observe what happens in theVelocity Distribution window. Explain how the activity in the <strong>Gas</strong> Sample window accountsfor your observations.5
F. Collect five additional observations of volume/pressure relationships and record all of yourdata in the following table.Data TablePressure Volume_______________________________________________________________________________________________________________________________________________________________________________II. Data Analysis:What patterns are shown in these data? It might be helpful to graph the data. Try to come up withan algebraic equation that expresses the pattern you found.6
III. Interpretation and Conclusions:A. How are the pressure and volume of a gas sample related?B. Mental Model - Draw a picture(s) that explains how the pressure and volume of a gas sampleare related at the level of atoms and molecules, and that illustrates the observations you madein the experiment. In words, explain how your picture(s) illustrate(s) <strong>this</strong> relationship.C. Using your data, predict the pressure of a gas sample at a volume of 100L. Show how youmade your prediction.Please take a moment to fill out a brief survey of your opinions of <strong>this</strong> activity at:http://intro.chem.okstate.edu/NSFCCLI/<strong>Gas</strong>Law/BAR.htm7
<strong>Gas</strong> Pressure and Temperature RelationshipsExp. Computer Simulation -B *Name________________________________Lab Section___________________________Problem Statement: How are the pressure and temperature of a gas sample related?I. Data Collection:A. Record the values for pressure, volume and temperature on the digital read-outs of theControls window.B. Observe the action in the Velocity Distribution window. Relate what you see with thebehavior of the objects in the <strong>Gas</strong> Sample window.Click the Pause button and sketch and label the graph in the space below.C. Using the controls in the Control Bar window, change the temperature in the container andobserve what happens to the pressure of the system. Also observe what happens in theVelocity Distribution window. Explain how the activity in the <strong>Gas</strong> Sample window accountsfor your observations.* ” Michael R. Abraham & <strong>John</strong> <strong>Gelder</strong>, September 20028
C. Collect five additional observations of pressure/temperature relationships and record all ofyour data in the following table.Data TablePressure Temperature_______________________________________________________________________________________________________________________________________________________________________________II. Data Analysis:A. What patterns are shown in these data? It might be helpful to graph the data. Try to come upwith an algebraic equation that expresses the pattern you found.9
III. Interpretation and Conclusions:A. How are the pressure and temperature of a gas sample related?B. Mental Model - Draw a picture(s) that explains how the pressure and temperature of a gassample are related at the level of atoms and molecules, and that illustrates the observationsyou made in the experiment. In words, explain how your picture(s) illustrate(s) <strong>this</strong>relationship.C. Using your data, predict the pressure of a gas sample at a temperature of 10 Kelvins. Showhow you made your prediction.Please take a moment to fill out a brief survey of your opinions of <strong>this</strong> activity at:http://intro.chem.okstate.edu/NSFCCLI/<strong>Gas</strong>Law/BAR.htm10
<strong>Gas</strong> SystemsComputer Simulation *System 1Investigate the relationship between the volume and temperature of a gas sample at constant pressureand amount.System 2Investigate how the number of gas particles affects the pressure of a gas sample.System 3Compare and interpret pressure vs. volume relationships of gas samples at different temperatures.System 4Investigate the average speed (distance per unit time) of particles in a gas as a function of pressure,volume, amount, or temperature.System 5Investigate the average number of collisions between particles or with the container walls in a gassample as a function of pressure, volume, amount, or temperature.System 6Investigate any of the above systems using different kinds of particles or combinations of particles.System 7Investigate any other gas system or investigate a modification of any of the above systems.Please take a moment to fill out a brief survey of your opinions of <strong>this</strong> activity at:http://intro.chem.okstate.edu/NSFCCLI/<strong>Gas</strong>Law/BAR.htm* ” Michael R. Abraham & <strong>John</strong> <strong>Gelder</strong>, September 200211
Research Statements *Use evidence from the <strong>MoLE</strong> simulation to prove or disprove the following statements.1. The total pressure of a combination of gases is equal to the sum of the individual pressuresexerted by each gas.2. If you increase the pressure on a gas sample by decreasing the volume, the gas particles willspeed up.3. The pressure exerted by a gas depends on its molar mass.4. The speed of a gas particle depends on its molar mass.5. The kinetic energy of a gas particle depends on its molar mass.6. <strong>Gas</strong> particles slow down when they collide with the walls of a container.7. The speed of gas particles are not affected by collisions with other gas particles.8. The average speed of two like gas particles before a collision is equal to the average speedafter the collision.9. The average speed of two unlike gas particles before a collision is equal to the average speedafter the collision.Please take a moment to fill out a brief survey of your opinions of <strong>this</strong> activity at:http://intro.chem.okstate.edu/NSFCCLI/<strong>Gas</strong>Law/BAR.htm* ” Michael R. Abraham & <strong>John</strong> <strong>Gelder</strong>, September 200212