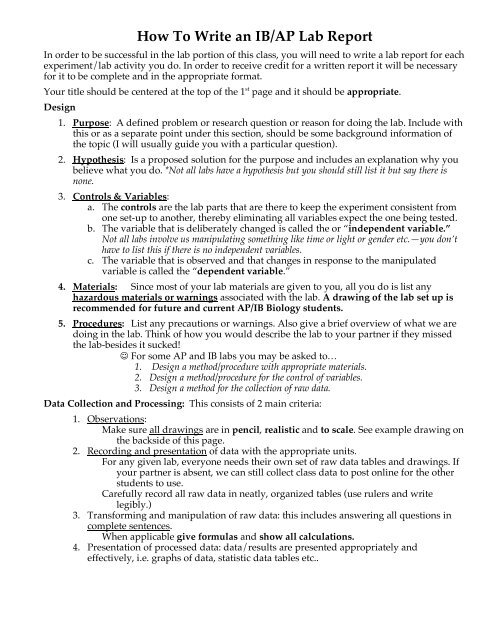
How To Write an IB/AP Lab Report
How To Write an IB/AP Lab Report
How To Write an IB/AP Lab Report

You also want an ePaper? Increase the reach of your titles
YUMPU automatically turns print PDFs into web optimized ePapers that Google loves.
<strong>How</strong> <strong>To</strong> <strong>Write</strong> <strong>an</strong> <strong>IB</strong>/<strong>AP</strong> <strong>Lab</strong> <strong>Report</strong><br />
In order to be successful in the lab portion of this class, you will need to write a lab report for each<br />
experiment/lab activity you do. In order to receive credit for a written report it will be necessary<br />
for it to be complete <strong>an</strong>d in the appropriate format.<br />
Your title should be centered at the top of the 1 st page <strong>an</strong>d it should be appropriate.<br />
Design<br />
1. Purpose: A defined problem or research question or reason for doing the lab. Include with<br />
this or as a separate point under this section, should be some background information of<br />
the topic (I will usually guide you with a particular question).<br />
2. Hypothesis: Is a proposed solution for the purpose <strong>an</strong>d includes <strong>an</strong> expl<strong>an</strong>ation why you<br />
believe what you do. *Not all labs have a hypothesis but you should still list it but say there is<br />
none.<br />
3. Controls & Variables:<br />
a. The controls are the lab parts that are there to keep the experiment consistent from<br />
one set-up to <strong>an</strong>other, thereby eliminating all variables expect the one being tested.<br />
b. The variable that is deliberately ch<strong>an</strong>ged is called the or “independent variable.”<br />
Not all labs involve us m<strong>an</strong>ipulating something like time or light or gender etc.—you don’t<br />
have to list this if there is no independent variables.<br />
c. The variable that is observed <strong>an</strong>d that ch<strong>an</strong>ges in response to the m<strong>an</strong>ipulated<br />
variable is called the “dependent variable.”<br />
4. Materials: Since most of your lab materials are given to you, all you do is list <strong>an</strong>y<br />
hazardous materials or warnings associated with the lab. A drawing of the lab set up is<br />
recommended for future <strong>an</strong>d current <strong>AP</strong>/<strong>IB</strong> Biology students.<br />
5. Procedures: List <strong>an</strong>y precautions or warnings. Also give a brief overview of what we are<br />
doing in the lab. Think of how you would describe the lab to your partner if they missed<br />
the lab-besides it sucked!<br />
� For some <strong>AP</strong> <strong>an</strong>d <strong>IB</strong> labs you may be asked to…<br />
1. Design a method/procedure with appropriate materials.<br />
2. Design a method/procedure for the control of variables.<br />
3. Design a method for the collection of raw data.<br />
Data Collection <strong>an</strong>d Processing: This consists of 2 main criteria:<br />
1. Observations:<br />
Make sure all drawings are in pencil, realistic <strong>an</strong>d to scale. See example drawing on<br />
the backside of this page.<br />
2. Recording <strong>an</strong>d presentation of data with the appropriate units.<br />
For <strong>an</strong>y given lab, everyone needs their own set of raw data tables <strong>an</strong>d drawings. If<br />
your partner is absent, we c<strong>an</strong> still collect class data to post online for the other<br />
students to use.<br />
Carefully record all raw data in neatly, org<strong>an</strong>ized tables (use rulers <strong>an</strong>d write<br />
legibly.)<br />
3. Tr<strong>an</strong>sforming <strong>an</strong>d m<strong>an</strong>ipulation of raw data: this includes <strong>an</strong>swering all questions in<br />
complete sentences.<br />
When applicable give formulas <strong>an</strong>d show all calculations.<br />
4. Presentation of processed data: data/results are presented appropriately <strong>an</strong>d<br />
effectively, i.e. graphs of data, statistic data tables etc..
Conclusions <strong>an</strong>d evaluations: Consists of 3 parts:<br />
1. Interpretation of results: drawing valid conclusions (i.e. support or reject your<br />
hypothesis) based on your data, with <strong>an</strong> expl<strong>an</strong>ation. Where appropriate, results are<br />
compared with given/known values.<br />
2. Evaluate procedure: The procedure (i.e. materials <strong>an</strong>d methods) including limitations,<br />
weaknesses or errors in m<strong>an</strong>ipulation are evaluated (discussion of the limitations of<br />
data <strong>an</strong>alysis may be included.)<br />
3. Modifying the Procedure: Suggest ways to improve the lab or suggest <strong>an</strong> area for<br />
further study. This should be based on the identification of weaknesses or limitations.<br />
This is not the time to slam the instructor on how useless the lab was in your eyes.<br />
Microscopic Drawing Instructions:<br />
1. Drawings should be done in pencil on unlined paper <strong>an</strong>d graphs should be on<br />
graphing paper. Each partner needs his or her own drawings for <strong>an</strong>y lab.<br />
2. Use ruler to draw lines.<br />
3. Either they should be left or right side of drawing shouldn’t cross over.<br />
4. <strong>Lab</strong>els should be at end of line, not on the line.<br />
5. Use petri dish (or approximately 3” diameter circular object) to draw field of vision.<br />
6. Make sure picture is realistic. I’m not expecting Rembr<strong>an</strong>dt, but something better th<strong>an</strong><br />
stick figures. Color is not expected, but it adds to realism in most cases.<br />
7. The size of the object should be to scale for field of vision, i.e. it should take up the same<br />
amount of the circle on your paper as when you look at it in the scope.<br />
receding<br />
hairline<br />
ultrasonic ears<br />
Sloped forehead<br />
Title - should reflect what your drawing<br />
Microscopic Mr. Ingham<br />
<strong>To</strong>tal Mag. 400X<br />
multiply objective by eye piece<br />
beady eyes<br />
goofy smile<br />
scruffy goat tee<br />
Flat feet
Calculating Magnification on Images <strong>an</strong>d Drawings<br />
1. Measure the size of your image. The image below was captured on high power.<br />
100 mm<br />
2. If you viewing the image through the microscope <strong>an</strong>d sketching it, use the following known<br />
values for the actual diameter of the field on the lens you used:<br />
Sc<strong>an</strong>ning = 4 mm Low = 1.6 mm High = .4 mm<br />
3. If you are video capturing the image from the computer, the image produced by the digital<br />
microscope is magnified two times, so what do you have to do to the values below?<br />
Sc<strong>an</strong>ning = 2 mm Low = 0.8 mm High = .2 mm<br />
4. Do the math<br />
image size/actual image = magnification<br />
100 mm/.2 mm = 500 X<br />
Making a scale marker<br />
100 mm<br />
1. The scale marker line drawn on the image is 5 mm.<br />
2. Divide the size of the marker (5mm) by the magnification <strong>an</strong>d convert to micrometers (µm).<br />
3. So 5 mm/500 = 0.01 mm or 10µm . You write this in below the marker.
Evaluation Criteria for <strong>Lab</strong>s
Check List for <strong>Lab</strong> <strong>Report</strong><br />
Don’t turn your lab in until you have checked this list. If I find <strong>an</strong>y missing areas you will get a 0.<br />
Do you have <strong>an</strong> appropriate title?<br />
Does your background reflect the topic being explored <strong>an</strong>d does it lead into your hypothesis?<br />
Have you identified all the variables?<br />
<strong>How</strong> have you controlled outside factors that might influence your results?<br />
Does your data table have a title, units <strong>an</strong>d lines?<br />
Did you include a table with all of your statistical calculations?<br />
Did you highlight signific<strong>an</strong>tly different data?<br />
Does your graph have a title, labelled axes, units <strong>an</strong>d a legend (if necessary)?<br />
Did you support or reject your hypothesis with data <strong>an</strong>d statistical support?<br />
Do your drawings have the correct magnification <strong>an</strong>d scale markers?