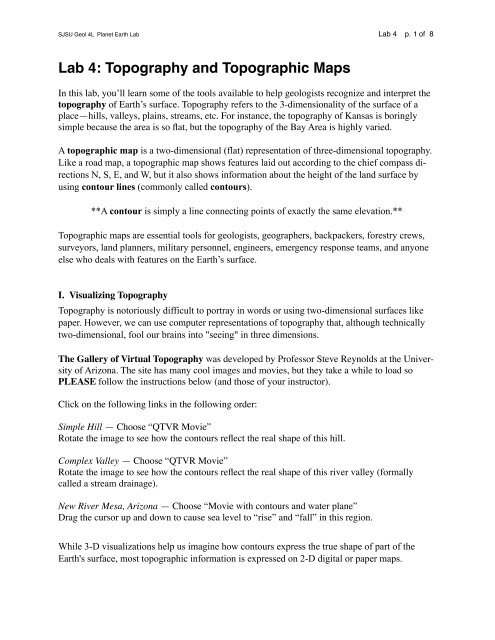
Lab 4: Topography and Topographic Maps
Lab 4: Topography and Topographic Maps
Lab 4: Topography and Topographic Maps
- No tags were found...

You also want an ePaper? Increase the reach of your titles
YUMPU automatically turns print PDFs into web optimized ePapers that Google loves.
SJSU Geol 4L Planet Earth <strong>Lab</strong> <strong>Lab</strong> 4 p. 3 of 8Glossary of terms <strong>and</strong> features you’ll find on maps in this labMap name: The name of the quadrangle is shown in the upper right corner.Map publisher: The publisher of the map is indicated in the upper left corner; in the U.S.,topographic maps are published by the U.S. Geological Survey.Latitude <strong>and</strong> longitude: These are marked at the four corners of the map (in the white area justoutside the map); intermediate values are shown at a few points along the map edges.Township, range, <strong>and</strong> sections: The U.S. government developed this method of subdividingl<strong>and</strong> in the late 1700s so it could more easily distribute farml<strong>and</strong> to settlers. Townships are 1-mile-high horizontal subdivisions, ranges are 1-mile-wide vertical subdivision, <strong>and</strong> sections arethe squares formed by the intersection of a township <strong>and</strong> range—roughly 1 mile on a side. Alltownship, range, <strong>and</strong> section information is shown in red ink on U.S. topographic maps.Scale: Every map is a scale model of the real world, so it must specify the ratio by which thereal world was reduced to fit on the map. This ratio scale usually is printed just below the map.The most common scale for U.S. topographic maps is 1:24,000, which means that 1 unit ofmeasurement (inch, cm, foot, etc.) on the map equals 24,000 of those same units in the realworld. <strong>Maps</strong> also include one or more graphic (bar) scales in the bottom map panel, which youcan use with a ruler to calculate distances between points.Contour lines: Imaginary lines that connect points of exactly the same elevation above sealevel. A contour line separates areas above its elevation from areas below its elevation. On mostU.S. maps, every fifth contour line is a bit thicker than other contour lines <strong>and</strong> is called an indexcontour. The difference in elevation of two adjacent contour lines is the contour interval, whichis specified in the bottom map panel beneath the bar scales.Relief: The difference in elevation of two points. For instance, if a hill is 500 feet high <strong>and</strong> anadjacent valley floor is 100 feet high, then the relief between them is 400 feet.Control stations (aka benchmarks): Some points on the map have been surveyed precisely,<strong>and</strong> their elevations are shown as specific numbers, generally printed next to an X or a triangle.Symbols: Every map uses numerous symbols to convey information, but they aren’t always explainedon the sheet. Symbols are used for roads, bridges, railways, waterways, mines, vegetationtype, buildings, <strong>and</strong> many other features.Magnetic declination: Lines of longitude run exactly from the north pole to the south pole, butmagnetic compasses point to Earth’s north magnetic pole, which currently lies about 700 km(450 mi) from the north pole. The angle between the the directions of true geographic north <strong>and</strong>magnetic north is called the magnetic declination, <strong>and</strong> is usually shown in the bottom map panel.
SJSU Geol 4L Planet Earth <strong>Lab</strong> <strong>Lab</strong> 4 p. 4 of 8III. Working With <strong>Topographic</strong> <strong>Maps</strong><strong>Topographic</strong> maps depict quasi-rectangular quadrangles. The top <strong>and</strong> bottom edges of the mapare east-west latitude lines; the left <strong>and</strong> right edges of the map are north-south longitude lines.Work in pairs to answer questions about each of the following topographic maps. You can workon the maps in any order. You may have to wait to obtain a copy of a map.——————————————————————————————————————A. Lihu’e (li-HOO-ay), Hawai’i1. What is the latitude <strong>and</strong> longitude of the northwest corner of this map?latitude: ___________________ longitude: ___________________2. What is the contour interval? _________________________3. What is the highest point on the map? __________________ What is its elevation? ________4. Find Lihu’e airport. Like all airports, it was constructed on relatively flat ground. How doesthe spacing of the contour lines indicate the ground is flat here?5. Imagine st<strong>and</strong>ing atop Keopaweo, a peak that is about 1 mile west of Kawai Point. In whatdirection would descent be the steepest <strong>and</strong> (probably) most dangerous? _______ How does thespacing of the contour lines indicate this?6. Find Aweoweonui, about 1 mile west of Kawelikoa Point. What is the elevation of the smallpond (blue oval) between the “A” <strong>and</strong> “w”? _______ Careful! This is a bit tricky. Hints: Followthe nearby contour lines closely. Note the small tick lines on some of the contours—they aren’tfound elsewhere on the map, indicating something unusual about this spot.7. What is the elevation of Kaua’i Community College? ________8. What is the straight-line distance between the lighthouse in Nawiliwili Bay <strong>and</strong> the tip of KawaiPoint, in kilometers (to one decimal place)?
SJSU Geol 4L Planet Earth <strong>Lab</strong> <strong>Lab</strong> 4 p. 6 of 85. Did Highway 17 replace a surface street? ________6. When was Highway 17 built? Be as specific as warranted by the maps.Now lay out side-by-side the 1953, 1961, <strong>and</strong> 1980 versions of the map. You should be able toclearly see a dramatic change in l<strong>and</strong>-use patterns.7. What percentage of the l<strong>and</strong> surface on the San José West quadrangle is fairly flat, <strong>and</strong> thussuitable for either agricultural use or urban development? _______%8. Estimate the percentage of fairly flat l<strong>and</strong> used for agricultural <strong>and</strong> urban purposes on eachmap. [Note that the agricultural areas have a green pattern on some 1953 <strong>and</strong> 1961 maps, butlack patterns or coloring on others. Maybe the USGS was experiencing a green-ink shortage....]agriculturalurban1953 1961 1980Find the following stretches of roadway on the 1980 map:a. Lawrence Expressway between Stevens Creek Blvd. <strong>and</strong> Graves Ave.b. San Tomas Expressway between El Camino Real <strong>and</strong> Campbell Ave.c. Highway 17 from Hamilton Ave. to Camden Ave.Now find the future locations of all three on the 1953 map.9. What did these future locations have in common?10. Why do you think humans selected those locations for roadways?
SJSU Geol 4L Planet Earth <strong>Lab</strong> <strong>Lab</strong> 4 p. 7 of 81899194311.Compare the changing patterns of l<strong>and</strong> use as shown on the three San José quadrangles <strong>and</strong>on the excerpts of the 1899 <strong>and</strong> 1943 maps shown above.A. Did change in l<strong>and</strong> use follow a particular compass direction or directions? If so, what?B. Did most of it happen earlier? later?C. Did the change exp<strong>and</strong> smoothly? r<strong>and</strong>omly? in some other pattern?
SJSU Geol 4L Planet Earth <strong>Lab</strong> <strong>Lab</strong> 4 p. 8 of 8D. Test Your Underst<strong>and</strong>ing1. <strong>Lab</strong>el all contours in the map below, <strong>and</strong> make the 1000´ contour line thicker than the others.2. In what compass direction does the Muddy River flow? ___________3. In what compass direction does the Raven River flow? _____________4. What is the minimum elevation of point B? _____________5. Is Point B the highest point on the map? _____ Explain your reasoning.