139736eo.pdf (20MB) - Japan Oceanographic Data Center
139736eo.pdf (20MB) - Japan Oceanographic Data Center 139736eo.pdf (20MB) - Japan Oceanographic Data Center
STATION : VERAVALL , J , F , M , A , M , J , J I A , S , O I N , D ,-201 -30\"5 40-cIFigure 3.Normal monthly data for Veraval. The dashedline in the top panel gives the recordedmonthly-mean sea level (mm). The sea levelcorrected for variations in atmosphericpressure is shown by the solid line in thesame panel. The second panel shows thelongshore component of the coastal current(cm sec-') based on the ship-drift values.The third panel gives the monthly meanrainfall in mm. The horizontal axis definesthe month. Sources of data are given in thetext.96
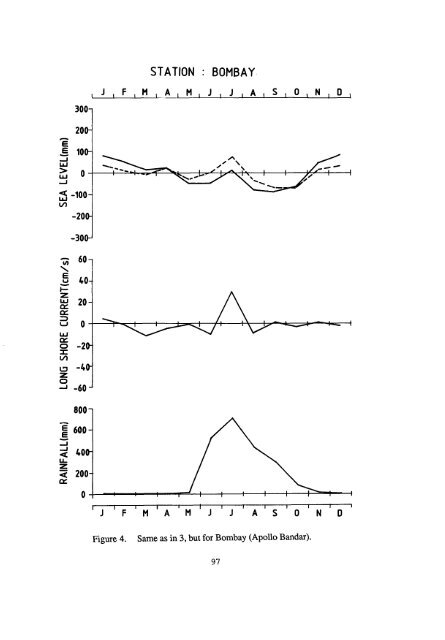
STATION : BOMBAY~ J , F I M .- , A , M , J , J I A I S I O I N I D l3001200--9 -100-v)-2oe-r/)60\CI 40I- z 20 aOL30Wa0 -20IVI13 -40z0A -608000E600CId< 400LL5 200aI I I I I I I Ir J ' F I M ' A M I J J A S 0 N 0Figure 4. Same as in 3, but for Bombay (Apollo Bandar).97
- Page 44 and 45: PROBLEMS IN THE PHYSICAL OCEANOGRAP
- Page 46: B2: How does the Agulhas Current in
- Page 50 and 51: 0Q0mbWbvx(U49
- Page 52 and 53: Figure 6 Average wind stress curl f
- Page 54 and 55: THE DESTRUCTION OF THE TETHYS AND P
- Page 56 and 57: part of the Seychelles-Mascarene bl
- Page 58 and 59: Much of the old Tethys seafloor has
- Page 60 and 61: when there was little or no movemen
- Page 62 and 63: scouring of the sediments by cold b
- Page 64 and 65: CANDE, S.C. and MUTTER, J.C. (1982)
- Page 66: SHACKLETON, N.J. and KENNETT, J.P.
- Page 71 and 72: 0EYNz 10c2XaYWeKB20LuUz a5 cl300 10
- Page 75: CALCAREOUS FORAMINIFERANANNOFOSSIL
- Page 79 and 80: GEOLOGICAL-GEOPHYSICAL MAPPING OF T
- Page 81 and 82: The latest tectonic generalization
- Page 83 and 84: LE PICHON, X. and HEIRTZLER, J.R. (
- Page 85 and 86: AN EXAMINATION OF THE FACTORS THAT
- Page 87 and 88: is the specific volume anomaly. Po
- Page 89 and 90: circulation. At Nagappattinam, Madr
- Page 91 and 92: Table 1.MarmagaoCochin1969-781958-7
- Page 93: tFigure 2. An idealized coastal cur
- Page 97 and 98: STATION : COCHIN, J , F , M , A , M
- Page 99 and 100: 3007STATION : MADRASI J I F , M I A
- Page 101 and 102: STATION : CALCUTTA, J l F , M , A ,
- Page 103 and 104: RED TIDE§ IN THE INDO-WEST PACIFIC
- Page 105 and 106: were observed as early as 1770 duri
- Page 107 and 108: diarrhetic shellfish poisoning (DSP
- Page 109 and 110: GACUTAN, R.Q., TABBU, M.Y., AUJERO,
- Page 111 and 112: Table 1.Clinical symptoms of variou
- Page 113 and 114: Table 3. Fish species implicated in
- Page 115 and 116: FIGURE CAPTIONSFigure la. Trichodes
- Page 118 and 119: (*14aEE15aHH15c120
- Page 120 and 121: MINERAL RESOURCES OF THE INDIAN OCE
- Page 122 and 123: tonnes of monazite. Similar deposit
- Page 124 and 125: Madagascar and the Red Sea. Within
- Page 126 and 127: South Australian Basin: (Figs. 10-1
- Page 128 and 129: Offshore placers are likely to occu
- Page 130 and 131: MILLIMAN, J.D. (1974). Marine Carbo
- Page 132 and 133: Thailand Tin 5560 (1980) NA 4.2 (19
- Page 134 and 135: Table 2. The range (in percent) of
- Page 136 and 137: Table 4. Chemical composition of po
- Page 138 and 139: 141FIGURE - 1
- Page 140 and 141: ~IT 73qw p' le' IS IFigure 4. Map s
- Page 142 and 143: @A5 3 9 93 3 s 3 m4P 8O C ' . .' ,
STATION : BOMBAY~ J , F I M .- , A , M , J , J I A I S I O I N I D l3001200--9 -100-v)-2oe-r/)60\CI 40I- z 20 aOL30Wa0 -20IVI13 -40z0A -608000E600CId< 400LL5 200aI I I I I I I Ir J ' F I M ' A M I J J A S 0 N 0Figure 4. Same as in 3, but for Bombay (Apollo Bandar).97


