- Page 1 and 2:
Intergovernmental Oceanographic Com
- Page 3 and 4:
of the IOC Marine Pollution Monitor
- Page 5:
PageMARGINAL SEASSTORM SURGES IN TH
- Page 9 and 10:
Marine PollutionAt present, marine
- Page 11 and 12:
THE INDIAN OCEAN --- AN ENVIRONMENT
- Page 13 and 14:
The subtropical anticyclonic gyre i
- Page 15 and 16:
GEOLOGICALBecause of its asymmetric
- Page 17 and 18:
RADIOACTIVE AND THERMAL WASTESIn co
- Page 19 and 20:
RESEARCH AND MONITORING ACTIVITIESM
- Page 21 and 22:
2-5, Mn 3-7, Zn 8-31, Fe 35-94, Pb
- Page 23 and 24:
Localized problems, both short-term
- Page 25 and 26:
HOLEMAN, J.N. (1968). The sediment
- Page 28 and 29:
UNEP/UNIDO (1982a). Industrial sour
- Page 30 and 31:
0-5-24 -I I I I I I I I I 11--25- A
- Page 32 and 33:
I*in '0( U N '0- '0 '0 N , p d'0I I
- Page 34:
C'EO IIFigure 6. Observations of oi
- Page 38 and 39:
Table 2.Ranges of Dissolved heavy m
- Page 40 and 41:
d.2 W2n2 n z0U.IzIO N m mENmIYEE*Ed
- Page 42 and 43:
Table 6. Population and related dat
- Page 44 and 45: PROBLEMS IN THE PHYSICAL OCEANOGRAP
- Page 46: B2: How does the Agulhas Current in
- Page 50 and 51: 0Q0mbWbvx(U49
- Page 52 and 53: Figure 6 Average wind stress curl f
- Page 54 and 55: THE DESTRUCTION OF THE TETHYS AND P
- Page 56 and 57: part of the Seychelles-Mascarene bl
- Page 58 and 59: Much of the old Tethys seafloor has
- Page 60 and 61: when there was little or no movemen
- Page 62 and 63: scouring of the sediments by cold b
- Page 64 and 65: CANDE, S.C. and MUTTER, J.C. (1982)
- Page 66: SHACKLETON, N.J. and KENNETT, J.P.
- Page 71 and 72: 0EYNz 10c2XaYWeKB20LuUz a5 cl300 10
- Page 75: CALCAREOUS FORAMINIFERANANNOFOSSIL
- Page 79 and 80: GEOLOGICAL-GEOPHYSICAL MAPPING OF T
- Page 81 and 82: The latest tectonic generalization
- Page 83 and 84: LE PICHON, X. and HEIRTZLER, J.R. (
- Page 85 and 86: AN EXAMINATION OF THE FACTORS THAT
- Page 87 and 88: is the specific volume anomaly. Po
- Page 89 and 90: circulation. At Nagappattinam, Madr
- Page 91 and 92: Table 1.MarmagaoCochin1969-781958-7
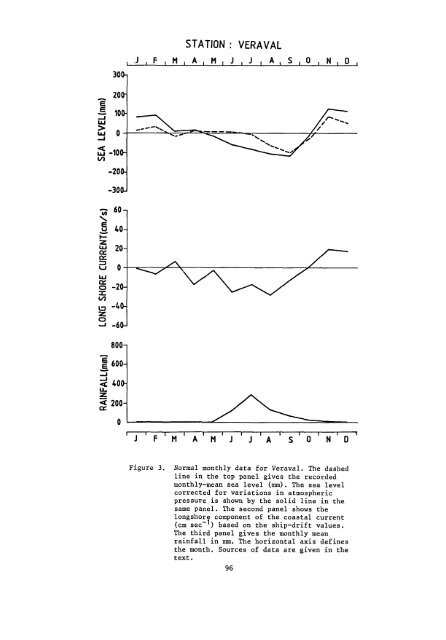
- Page 93: tFigure 2. An idealized coastal cur
- Page 97 and 98: STATION : COCHIN, J , F , M , A , M
- Page 99 and 100: 3007STATION : MADRASI J I F , M I A
- Page 101 and 102: STATION : CALCUTTA, J l F , M , A ,
- Page 103 and 104: RED TIDE§ IN THE INDO-WEST PACIFIC
- Page 105 and 106: were observed as early as 1770 duri
- Page 107 and 108: diarrhetic shellfish poisoning (DSP
- Page 109 and 110: GACUTAN, R.Q., TABBU, M.Y., AUJERO,
- Page 111 and 112: Table 1.Clinical symptoms of variou
- Page 113 and 114: Table 3. Fish species implicated in
- Page 115 and 116: FIGURE CAPTIONSFigure la. Trichodes
- Page 118 and 119: (*14aEE15aHH15c120
- Page 120 and 121: MINERAL RESOURCES OF THE INDIAN OCE
- Page 122 and 123: tonnes of monazite. Similar deposit
- Page 124 and 125: Madagascar and the Red Sea. Within
- Page 126 and 127: South Australian Basin: (Figs. 10-1
- Page 128 and 129: Offshore placers are likely to occu
- Page 130 and 131: MILLIMAN, J.D. (1974). Marine Carbo
- Page 132 and 133: Thailand Tin 5560 (1980) NA 4.2 (19
- Page 134 and 135: Table 2. The range (in percent) of
- Page 136 and 137: Table 4. Chemical composition of po
- Page 138 and 139: 141FIGURE - 1
- Page 140 and 141: ~IT 73qw p' le' IS IFigure 4. Map s
- Page 142 and 143: @A5 3 9 93 3 s 3 m4P 8O C ' . .' ,
- Page 144 and 145:
Figure 10. Map showng the abundance
- Page 146 and 147:
Figure 14. Map showing the distribu
- Page 148 and 149:
IFigure 17. Marine mineral explorat
- Page 150 and 151:
central are corals to the integrity
- Page 152 and 153:
Very little information is availabl
- Page 154 and 155:
leaving little trace of their exist
- Page 156 and 157:
REFERENCESAGASSIZ, A. (1903). The c
- Page 158 and 159:
PILLAI, C.S.G. (1969b). Studies on
- Page 160 and 161:
Table 1.Extent of damage to coral r
- Page 162 and 163:
STATUS OF CRITICAL MARINE HABITATS
- Page 164 and 165:
OCCURRENCEThe distribution of reefs
- Page 166 and 167:
Mining of Reef RockMining of reef r
- Page 168 and 169:
-resource. Their significance deriv
- Page 170 and 171:
Coating of Aerial Roots by Fine Sed
- Page 172 and 173:
associated with the roots (e.g. GOE
- Page 174 and 175:
Temperature and SalinityThe effects
- Page 176 and 177:
significant numbers in the Red Sea,
- Page 178 and 179:
mersas are known to serve as nurser
- Page 180 and 181:
BURCHARD, J.E. (1979). Coral fauna
- Page 182 and 183:
HIRTH, H.F., KLIKOFF, L.G. and HARP
- Page 184 and 185:
MacNAE, W. (1974). Mangrove forests
- Page 186 and 187:
RINKEVITCH, B. and LOYA, Y. (1977).
- Page 188 and 189:
WALKER, D.I. and ORMOND, R.F.G. (19
- Page 190 and 191:
DAMMING AND DIVERSION OF RIVERSIn d
- Page 192 and 193:
FUTURE STUDIESWhat can marine scien
- Page 194 and 195:
!0OD9 -8 Nc80,a,u-3(dcab(Dbrr)8brr)
- Page 196 and 197:
0 0-0 00 O0O 0% LD d- m cu 0 0202
- Page 198 and 199:
STORM SURGES IN THE BAY OF BENGAL*T
- Page 200 and 201:
low pressure centres over the Bay i
- Page 202 and 203:
ACKNOWLEDGEMENTSThe writers wish to
- Page 204 and 205:
Table 1.Latitude and longitude of p
- Page 207 and 208:
214
- Page 209 and 210:
0Poa9nU0m0Yan-I2li7mYUVQk?401mc0mYm
- Page 211 and 212:
0In218
- Page 214 and 215:
221
- Page 216 and 217:
Table 3. Nomenclature used by India
- Page 218 and 219:
ANDHRAB A Y OFB E N G A L ,.16'LO 4
- Page 220 and 221:
INDIABAY OF-Point CalirnereLanka L-
- Page 222 and 223:
pressure in the South Pacific and l
- Page 224 and 225:
SWALLOW, J.C. (1983). Arabian Sea c
- Page 226 and 227:
234
- Page 228 and 229:
236
- Page 230 and 231:
scale wind phenomenon that occurs w
- Page 232 and 233:
Several two-dimensional models of t
- Page 234 and 235:
HARTMANN, M., LANGE, H., SEIBOLD, E
- Page 236 and 237:
Y-Model Domaint=6hrs.b-250 0 59 Xw-
- Page 238 and 239:
UELEVATIONS (m) ai 18 HOURS L2:-+EL
- Page 240 and 241:
HARMONIC CONSTITUENT K,Figure 8. Ob
- Page 242 and 243:
Age of Semi-Diurnal Tide (hrs)28".+
- Page 244 and 245:
! 5"BOTTOMFigure 13. Predicted mode
- Page 246 and 247:
OCEANOGRAPHIC CONDITIONS PELAGIC PR
- Page 248 and 249:
Low oxygen content in subsurface wa
- Page 250 and 251:
R/V Dr. F. Nansen trawl of 41 m hea
- Page 252 and 253:
thermocline temperature decreases s
- Page 254 and 255:
Nitrate - NitrogenSimilarly to phos
- Page 256 and 257:
The maximum standing stocks in the
- Page 258 and 259:
By April/May the demersal stocks ha
- Page 260 and 261:
in 6 months when spawning occurs. T
- Page 262 and 263:
REFERENCES3BANSE, K. (1968). Hydrog
- Page 264 and 265:
GILSON, H.C., (1937). The nitrogen
- Page 266 and 267:
ROYAL SOCIETY (1963). International
- Page 268 and 269:
APPENDIX:REGIONAL COOPERATIVE INVES
- Page 270 and 271:
20 015 20 25FEBOC015 20 25 30 35M A
- Page 272 and 273:
W0-8w0-Inww[r3a+eW281
- Page 274 and 275:
B35 36 a7 XlO+ 35 36 a7- Mar--- Fob
- Page 276 and 277:
a, A
- Page 278 and 279:
...... :'I. .. ,... .. 8.*.. ... ._
- Page 280 and 281:
ASTAT.Si -Si (OH14 in p M - d ~ n -
- Page 282 and 283:
YU0IwYY->02(33-1 II 1amLyY>02(33amL
- Page 284 and 285:
I I I I I10 Ic L0U0mI(dw -rlo u0w m
- Page 286 and 287:
III I I I0. 1....w'3...-0U-J..,....
- Page 288 and 289:
297
- Page 290 and 291:
clearly is too low. Because of low
- Page 292 and 293:
KARBE, L., THIEL, H., WEIKERT, H. a
- Page 294 and 295:
50010001 scoOxygen (rnl/l)0I1I2I3I4
- Page 296 and 297:
c1 oc50C10001500_j_///.///II:I? 0:3
- Page 298 and 299:
THE RED SEAPHYSIOGRAPHYThe Red Sea
- Page 300 and 301:
intensity of magnetization which co
- Page 302 and 303:
1969; SEARLE and ROSS, 1975). This
- Page 304 and 305:
y normal faulting. This is most int
- Page 306 and 307:
South of 19"N, the McKENZIE pole no
- Page 308 and 309:
BAUMANN, A., RICHTER, H. and SCHOEL
- Page 310 and 311:
EYAL, M., EYAL, Y., BARTOV, Y. and
- Page 312 and 313:
LEWIS, B.T.R. (1983). The process o
- Page 314 and 315:
TARLING, D.H. and MITCHELL, J.G. (1
- Page 316 and 317:
mC- 1000- 2000- 3000E0Figure 2.Sche
- Page 318 and 319:
-20b-0,20wFigure 4. Seismicity and
- Page 320 and 321:
kmaFigure 6. Summary of seismic ref
- Page 322 and 323:
kQ)Um 5U0c04 3N 4COQ)k3M*rlk332
- Page 324 and 325:
5 b'o w-Y EO'i Ii04!I 0I0I334
- Page 326 and 327:
II,'{34/,'0SOMALIAND: N. DANAKILFig
- Page 328 and 329:
spreadingvulcanismmblock faultingII
- Page 330 and 331:
SUPERFICIAL SEDIMENTS OF NORTHERN R
- Page 332 and 333:
normally sorted, with median diamet
- Page 334 and 335:
EL-SAYED (1983) used the trace meta
- Page 336 and 337:
BEHAIRY, AKA. (1983). Marine transg
- Page 338 and 339:
SHUKRI, N.M. (1953). Bottom deposit
- Page 340 and 341:
Table 2 Heavy metal concentrations
- Page 342 and 343:
EGYPTEl-Morgan 1Bargan IBargan 2Yub
- Page 344 and 345:
Figure 4. Distribution of minerals
- Page 346 and 347:
ARAGONITEHIGH HG-CALCITEFigure 6. T
- Page 348 and 349:
MARINE LIVING RESOURCES OF THE RED
- Page 350 and 351:
This elevated productivity may resu
- Page 352 and 353:
REVELLE (1981) mentioned that the p
- Page 354 and 355:
FISHELSON, L. (1964). Observation o