Download complate issue - Ozean Publications
Download complate issue - Ozean Publications
Download complate issue - Ozean Publications
- No tags were found...

You also want an ePaper? Increase the reach of your titles
YUMPU automatically turns print PDFs into web optimized ePapers that Google loves.
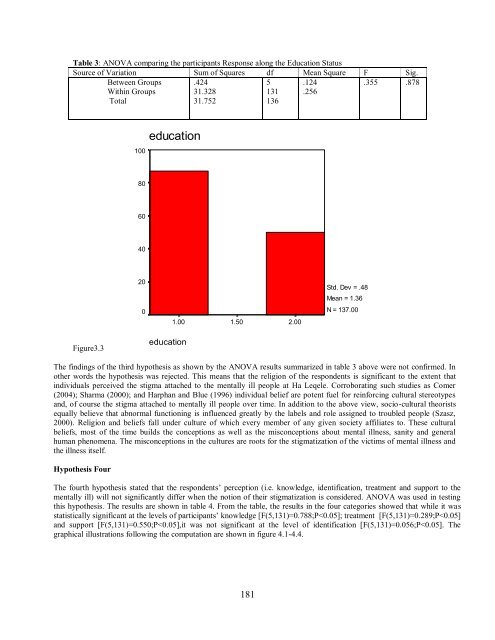
FrequencyTable 3: ANOVA comparing the participants Response along the Education StatusSource of Variation Sum of Squares df Mean Square F Sig.Between GroupsWithin GroupsTotal.42431.32831.7525131136.124.256.355 .878100education8060402001.001.502.00Std. Dev = .48Mean = 1.36N = 137.00Figure3.3educationThe findings of the third hypothesis as shown by the ANOVA results summarized in table 3 above were not confirmed. Inother words the hypothesis was rejected. This means that the religion of the respondents is significant to the extent thatindividuals perceived the stigma attached to the mentally ill people at Ha Leqele. Corroborating such studies as Comer(2004); Sharma (2000); and Harphan and Blue (1996) individual belief are potent fuel for reinforcing cultural stereotypesand, of course the stigma attached to mentally ill people over time. In addition to the above view, socio-cultural theoristsequally believe that abnormal functioning is influenced greatly by the labels and role assigned to troubled people (Szasz,2000). Religion and beliefs fall under culture of which every member of any given society affiliates to. These culturalbeliefs, most of the time builds the conceptions as well as the misconceptions about mental illness, sanity and generalhuman phenomena. The misconceptions in the cultures are roots for the stigmatization of the victims of mental illness andthe illness itself.Hypothesis FourThe fourth hypothesis stated that the respondents’ perception (i.e. knowledge, identification, treatment and support to thementally ill) will not significantly differ when the notion of their stigmatization is considered. ANOVA was used in testingthis hypothesis. The results are shown in table 4. From the table, the results in the four categories showed that while it wasstatistically significant at the levels of participants’ knowledge [F(5,131)=0.788;P