Lake Taupo long-term monitoring programme 2010–2011 - Waikato ...
Lake Taupo long-term monitoring programme 2010–2011 - Waikato ...
Lake Taupo long-term monitoring programme 2010–2011 - Waikato ...
- No tags were found...

Create successful ePaper yourself
Turn your PDF publications into a flip-book with our unique Google optimized e-Paper software.
Peer reviewed by:Bill VantDate June 2012Approved for release by:Dr Edmund BrownDate June 2012DisclaimerThis technical report has been prepared for the use of <strong>Waikato</strong> Regional Council as a referencedocument and as such does not constitute Council’s policy.Council requests that if excerpts or inferences are drawn from this document for further use byindividuals or organisations, due care should be taken to ensure that the appropriate contexthas been preserved, and is accurately reflected and referenced in any subsequent spoken orwritten communication.While <strong>Waikato</strong> Regional Council has exercised all reasonable skill and care in controlling thecontents of this report, Council accepts no liability in contract, tort or otherwise, for any loss,damage, injury or expense (whether direct, indirect or consequential) arising out of the provisionof this information or its use by you or any other party.Doc # 2208110
Doc # 2208110
<strong>Lake</strong> <strong>Taupo</strong> Long-<strong>term</strong> Monitoring Programme:2010 - 2011Prepared for <strong>Waikato</strong> Regional CouncilMay 2012
Authors/Contributors:Max GibbsFor any information regarding this report please contact:Dr Max GibbsFreshwater Ecology+64-7-856 1773m.gibbs@niwa.co.nzNational Institute of Water & Atmospheric Research LtdGate 10, Silverdale RoadHillcrest, Hamilton 3216PO Box 11115, HillcrestHamilton 3251New ZealandPhone +64-7-856 7026Fax +64-7-856 0151NIWA Client Report No: HAM2012-016Report date: May 2012NIWA Project:EVW11210© All rights reserved. This publication may not be reproduced or copied in any form without thepermission of the copyright owner(s). Such permission is only to be give in accordance with the <strong>term</strong>sof the client’s contract with NIWA. This copyright extends to all forms of copying and any storage ofmaterial in any kind of information retrieval system.Whilst NIWA has used all reasonable endeavours to ensure that the information contained in thisdocument is accurate, NIWA does not give any express or implied warranty as to the completeness ofthe information contained herein, or that it will be suitable for any purpose(s) other than thosespecifically contemplated during the Project or agreed by NIWA and the Client
Contents1. Executive summary ...................................................................................................... 52. Introduction ................................................................................................................... 93. Methods ....................................................................................................................... 113.1 Report contents ................................................................................................... 113.2 Statistical evaluation ............................................................................................ 123.3 “TREND” definition ............................................................................................... 124. Results and discussion .............................................................................................. 134.1 Temperature and dissolved oxygen ..................................................................... 134.2 VHOD rate ........................................................................................................... 154.3 Secchi depth ........................................................................................................ 184.4 Phytoplankton ...................................................................................................... 214.5 Deep chlorophyll maxima .................................................................................... 234.6 Algal species abundance ..................................................................................... 254.7 Nutrients in the upper waters ............................................................................... 254.8 Nutrient accumulation in the hypolimnion ............................................................ 274.9 Total mass accumulated ...................................................................................... 284.10 Net accumulation rate .......................................................................................... 294.11 Total N ................................................................................................................. 315. Knowledge gaps ......................................................................................................... 326. Summary ...................................................................................................................... 337. Acknowledgements .................................................................................................... 378. Glossary of abbreviations and <strong>term</strong>s ........................................................................ 399. References ................................................................................................................... 41Appendix 1. Site map, sampling strategy and methods ............................................ 43Site map ........................................................................................................................ 43Methods ........................................................................................................................ 44Data handling and less than detection limit values ....................................................... 45Statistical methods ........................................................................................................ 47Appendix 2. The calculation of VHOD rates ................................................................ 49<strong>Lake</strong> <strong>Taupo</strong> Long-<strong>term</strong> Monitoring Programme 2010 - 2011
Rationale ....................................................................................................................... 49Method of calculation .................................................................................................... 49Statistical evaluation of the VHOD rate ......................................................................... 50Appendix 3. Temperature and dissolved oxygen data ............................................... 53Appendix 4. Nutrient data ............................................................................................. 77Appendix 5. Phytoplankton data ................................................................................ 105Appendix 6. Historical data ......................................................................................... 125TablesTable 1: Summary of VHOD rates. 18Table 2: <strong>Lake</strong> <strong>Taupo</strong> Hypsographic Data used in the Net VHOD RATE calculation. 51Table 3: Julian Date or sequential day number. 51FiguresFigure 1: Site map of <strong>Lake</strong> <strong>Taupo</strong>. 10Figure 2: Time-series temperature data. 13Figure 3: Time-series dissolved oxygen data. 14Figure 4: <strong>Lake</strong> <strong>Taupo</strong> CTD-O profiles in January 2011. 14Figure 5: VHOD for 2010-2011 <strong>monitoring</strong> period. 16Figure 6: Time-series VHOD data. 17Figure 7: Water clarity as measured by Secchi depth. 19Figure 8: Seasonal cycle of water clarity. 20Figure 9: The timing of minimum water clarity has recently changed. 21Figure 10: Time-series chlorophyll a concentrations in the upper 10 m of <strong>Lake</strong> <strong>Taupo</strong>. 22Figure 11: Annual mean and maximum chlorophyll a concentrations. 23Figure 12: Deep chlorophyll maxima. 24Figure 13: Fluorescence profiles in <strong>Lake</strong> <strong>Taupo</strong>. 24Figure 14: Time series nutrient data in <strong>Lake</strong> <strong>Taupo</strong>. 26Figure 15: Time series bottom water nutrient data. 28Figure 16: Total mass of NO 3 -N in the hypolimnion of <strong>Lake</strong> <strong>Taupo</strong> in autumn beforewinter mixing. 28Figure 17: Net Hypolimnetic NO 3 -N accumulation rates . 30Figure 18: Estimates of the mass of total nitrogen (TN) in <strong>Lake</strong> <strong>Taupo</strong>. 31Figure 19: Site map of <strong>Lake</strong> <strong>Taupo</strong>. 43Reviewed byApproved for release byDr P. VerburgDr D. Rowe<strong>Lake</strong> <strong>Taupo</strong> Long-<strong>term</strong> Monitoring Programme 2010 - 2011
1. Executive summaryWith the expectation that the trophic status of <strong>Lake</strong> <strong>Taupo</strong> will slowly change to reflectchanges in land use within the lake's catchments, a <strong>long</strong> <strong>term</strong> <strong>programme</strong> to monitor thelake's water quality was commissioned by <strong>Waikato</strong> Regional council. This <strong>programme</strong>commenced in October 1994 and is conducted by NIWA with field assistance from theDepartment of Internal Affairs, <strong>Taupo</strong> Harbourmaster’s Office. This report presents theresults from the 2010/11 <strong>monitoring</strong> period.The <strong>monitoring</strong> <strong>programme</strong> was designed to detect change through assessment of the rateof consumption of oxygen from the bottom waters of the lake (volumetric hypolimneticoxygen depletion – VHOD) as an integration of all biological processes occurring in <strong>Lake</strong><strong>Taupo</strong>. Additional parameters are measured to provide a more comprehensive picture ofwater quality. Recently it has become apparent that VHOD may be too coarse to de<strong>term</strong>inetrophic change in a lake the size and complexity of <strong>Lake</strong> <strong>Taupo</strong>. Consequently, moreemphasis is now focused on the parameters chlorophyll a, water clarity, and nutrient(particularly nitrate) accumulation in the lake.The <strong>long</strong>-<strong>term</strong> <strong>monitoring</strong> <strong>programme</strong> uses the historical mid-lake site, Site A. Monitoring ofadditional sites in the Kuratau Basin (Site B) and the Western Bays (Site C) between January2002 and December 2004 de<strong>term</strong>ined that spatial variability of water quality across <strong>Lake</strong><strong>Taupo</strong> is minimal and that it is valid to use the mid-lake site as representative of the openwater quality of the lake. Further validation of the use of a single mid-lake <strong>monitoring</strong> site wasobtained in a separate study over a 2-year period from February 2007 up to June 2009,which compared mid-lake nutrient and chlorophyll a concentrations and algal speciescomposition with that at near-shore sites in Whangamata Bay (Kinloch) and Whakaipo Bay.This study de<strong>term</strong>ined that “the near-shore water quality was very similar to the mid-lakewater quality” and that “within this similarity in the measured data was much variability whichmay be due to short period time lags between the near-shore and mid-lake sites with respectto nutrient sources, and the zones of algal growth”.There was a <strong>long</strong>-<strong>term</strong> trend of increasing phytoplankton biomass (chlorophyll a) of 0.014 ±0.013 mg m -3 y -1 in the upper 10 m of water column over the <strong>monitoring</strong> period. However,inter-annual variability in the data was high. As the <strong>long</strong>-<strong>term</strong> data accumulates, it isbecoming apparent that the increase in chlorophyll a occurred mostly before 2000. Theannual mean chlorophyll a concentration from 1994 to 2003 increased at a statisticallysignificant rate of 0.087 ± 0.029 mg m -3 y -1 (P < 0.001, r 2 = 0.857, n = 10), but since 2000there has been a significant decline at a rate of 0.024 ± 0.023 mg m -3 y -1 (P
The 2010 winter bloom was dominated by the diatoms, Asterionella formosa and Fragilariacrotonensis, each accounting for about 40% of the biovolume in the upper 50 m of the watercolumn. The dinoflagellate, Gymnodinium sp. was dominant through summer 2011.Cyanobacteria (blue-green algae) were always present in low numbers in the upper watercolumn throughout the 2010/11 <strong>monitoring</strong> period, with Anabaena lemmermannii being themost common species.Nutrient concentrations - dissolved reactive phosphorus, ammoniacal nitrogen, and nitratenitrogen (DRP, NH 4 -N, and NO 3 -N) - in the upper water column were comparable withconcentrations measured since 2003. NO 3 -N concentrations were lower and NH 4 -Nconcentrations were elevated in the upper water column since 2007. The elevated NH 4 -Nconcentrations may indicate water column decomposition of the winter-spring bloom, orexcretion from a zooplankton bloom.The total mass of NO 3 -N in the hypolimnion before winter has increased at a statisticallysignificant rate of about 6.4 t y -1 (P
<strong>Lake</strong> <strong>Taupo</strong> Long-<strong>term</strong> Monitoring Programme 2010 - 2011 7
2. IntroductionA <strong>long</strong> <strong>term</strong> <strong>monitoring</strong> <strong>programme</strong> of <strong>Lake</strong> <strong>Taupo</strong>’s water quality was commissioned by<strong>Waikato</strong> Regional Council in October 1994 in the expectation that the trophic state of the lakewould change to reflect changes in land use within the lake's catchment. This <strong>programme</strong> isconducted by NIWA with field assistance from the Department of Internal Affairs, <strong>Taupo</strong>Harbourmaster’s Office. Various additions and improvements to the <strong>monitoring</strong> methodologyhave occurred with advances in available technology but the core <strong>monitoring</strong> parametersremain unchanged (Appendix 1). This report presents data from the routine mid-lake<strong>monitoring</strong> station from August 2010 to July 2011. Additional information for water clarity,temperature, and chlorophyll a collected between August 2011 and the time of beginning thisreport has also been included in the data sets in the appendices.In two earlier reports (Gibbs 2005, 2006), data were included from two additional sitesrepresenting those historically sampled in the 1974-76 assessments of lake water quality(White et al. 1980) (Figure 1) to evaluate spatial variability of water quality across the lake.Results from these two additional sites showed that, in general, there were minimaldifferences between the sites in seasonal variation and that data collected from site A (midlake) could be used as representative of the main body of the lake. More recently, acomparison of upper water column nutrient and chlorophyll a concentrations and algalabundance was made between Site A and near-shore sites in Whangamata Bay (Kinloch)and Whakaipo Bay (Figure 1), over a 2-year period from February 2007 up to June 2009(Gibbs 2010a). That study de<strong>term</strong>ined that, although there were small differences, “the nearshorewater quality was very similar to the mid-lake water quality” and the small differencesthat were observed “may be due to short period time lags between the near-shore and midlakesites with respect to nutrient sources, and the zones of algal growth”. This reportpresents data from site A only.The <strong>monitoring</strong> <strong>programme</strong> has 3 components: bottom water oxygen depletion, upper watercolumn water quality, and whole water column water quality. Bottom water oxygen depletionis estimated as the volumetric hypolimnetic oxygen depletion (VHOD) rate, which is sensitiveto changes in trophic state of lakes that thermally stratify for part of the year (Burns 1995).VHOD is considered a good indicator to detect changes in the water quality of <strong>Lake</strong> <strong>Taupo</strong>.Estimates of VHOD are made from dissolved oxygen and temperature profiles measured at2-3 week intervals during the stratified period. However, the VHOD rate can only indicatechanges that may occur in water quality, but does not identify their underlying causes. Inorder to enable understanding of contributing processes, the upper water column (0-10 mdepth) is sampled for nutrients, chlorophyll a, phytoplankton species composition and waterclarity at 2-3 weekly intervals, and full depth profiles are carried out twice during the stratifiedperiod. The first profile is taken in spring, when thermal stratification has become establishedand is stable, the second profile in autumn the following year before thermal stratificationbegins to break down, as the thermocline deepens.<strong>Lake</strong> <strong>Taupo</strong> Long-<strong>term</strong> Monitoring Programme 2010 - 2011 9
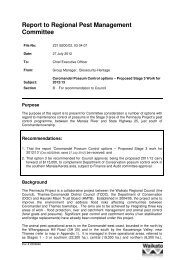
Whangamata Bay<strong>Waikato</strong> RiverWhakaipo BayCAHoromatangi ReefBTongariro RiverSampling sitesTokaanu TailraceFigure 1: Site map of <strong>Lake</strong> <strong>Taupo</strong>. Showing location of the routine <strong>monitoring</strong> site at mid lake(A), and the two additional sites at Kuratau Basin (B) and the Western Bays (C) sampled during thethree-year period 2002-04. The near-shore comparison sites at Whangamata Bay and Whakaipo Baysampled during a two-year period 2007-09 are also shown.10 <strong>Lake</strong> <strong>Taupo</strong> Long-<strong>term</strong> Monitoring Programme 2010 - 2011
3. MethodsDetailed method descriptions are given in Appendix 1. The parameters measured routinely at2-3 weekly intervals are:ooodepth-related temperature and dissolved oxygen (DO), using the RBR XR420f CTDprofiler until January 2008, thereafter using the RBR XR620f CTD profiling system.Additional parameters of conductivity and chlorophyll fluorescence, and sinceJanuary 2008, PAR, recorded by the profiler sensors are available at NIWA and willonly be reported as appropriatewater clarity by Secchi disc depth (20-cm black and white quartered)chlorophyll a, nitrate+nitrite-nitrogen (NO 3 -N), ammoniacal-N (NH 4 -N), dissolvedorganic N (DON), particulate-N (PN), dissolved reactive phosphorus (DRP), dissolvedorganic phosphorus (DOP), particulate phosphorus (PP), and algal speciesdominance in integrated-tube water samples from the top 10 m. Concentrations oftotal nitrogen (TN) and total phosphorus (TP) are estimated by summing therespective measured fractions. Zooplankton net hauls from 100 m (63 μm mesh) arepreserved in 4% formalin and stored pending analysis.Since 2000, water samples have also been collected at the same time from just above thelake bed (150 m) for analysis of NO 3 -N, NH 4 -N, and DRP to assess nutrient accumulationrates in the hypolimnion and to assess the extent of winter mixing.For whole water column sampling, carried out twice a year in spring and autumn, theparameters measured at 10 m depth intervals from the surface down to 150 m depth are:oConductivity, pH, temperature, DO, chlorophyll a, DRP, DOP, PP, TP, NO 3 -N, NH 4 -N,DON, PN, TN, urea nitrogen (Urea-N), total suspended solids (SS), volatilesuspended solids (VSS), particulate carbon (PC), and dissolved organic carbon(DOC).Additional parameters measured twice yearly, but not as complete profiles are:oAlgal species composition and abundance on water samples from 1, 10, 50, 100 and140 m.Details of data handling and the treatment of values that are near analytical detection limitsare described in Appendix 1.3.1 Report contentsThis report presents the results from the 2010/11 stratified period plus the winter 2011mixing, and refers to data in previous annual <strong>monitoring</strong> reports from 1995 to 2010 (e.g.,Gibbs 2011; Gibbs et al. 2002) for inter-annual comparisons, and archived historical datasince 1974 held by NIWA. The methods used are as per the 1994/95 report (Gibbs 1995)and a copy of these methods is included in Appendix 1. The calculation of the net VHODrate, as applied to <strong>Lake</strong> <strong>Taupo</strong> data, was described in the 1996/97 report and a copy of themethods is presented in Appendix 2. Data of temperature and dissolved oxygen from the<strong>Lake</strong> <strong>Taupo</strong> Long-<strong>term</strong> Monitoring Programme 2010 - 2011 11
previous sixteen years are given in Appendix 3 and nutrient data are in Appendix 4.Graphical presentations of historical time-series temperature, dissolved oxygen, and Secchidisc depth data collected since the start of this <strong>monitoring</strong> <strong>programme</strong> are updated andpresented in figures in the text. Phytoplankton species composition and biomass data for2010/11 are included in Appendix 5 and discussed in the text. Historical (before 1994) nitrateand dissolved reactive phosphorus data from spring and autumn full lake profiles arepresented in Appendix 6 for reference.3.2 Statistical evaluationSimple statistical evaluation of data has been made using Microsoft Excel® and regressionresults have been reported to ± 95% confidence limits. Statistical significance (P), whereused, includes the coefficient of de<strong>term</strong>ination (r 2 ) and the number of data points used (n).For details see Statistical Methods, Appendix 1.3.3 “TREND” definitionAs in previous reports, the word “trend” is used in the context of a change between the startand the end of a time series data set where the use of a linear regression analysis shows astatistically significant difference from the null hypothesis of there being no change. Use ofthe word “trend” is a statistical one. It does not imply any valid extrapolation of the observedchange beyond the period of the data set being examined by the linear regression.12 <strong>Lake</strong> <strong>Taupo</strong> Long-<strong>term</strong> Monitoring Programme 2010 - 2011
4. Results and discussion4.1 Temperature and dissolved oxygenThe time-series of temperature and DO from 20 m depth (epilimnion) and 130 m depth(hypolimnion) collected in the <strong>monitoring</strong> <strong>programme</strong> since 1994 are presented in Figure 2and Figure 3.Annual maximum temperatures at 20 m are variable between 17 ºC and 21 ºC, reflectingwarmer or cooler summers, while near bottom water temperatures have been relativelyconstant between 10.3 ºC and 11.6 ºC. Near bottom temperatures slightly increase eachyear during the stratified period (Fig. 2). Winter mixing occurs when the upper and lowertemperatures are the same. Mixing rarely extends for more than a month (e.g., winter 2004,Figure 2), during which the whole water column cools rapidly.Figure 2: Time-series temperature data. Time-series temperature from 20 m (black line) and130 m (pink line) depths. Winter mixing occurred where these two lines meet. The data show the lackof mixing in winter 1998 and only partial mixing in 1999 and 2005. Mixing was brief in 1997 and 2010but strong in 1996, 2002, 2004, 2008, 2009 and 2011. Data ticks are 1 January each year.Conversely, in some years the period of mixing may be brief or does not occur at all, forinstance during winter 1998 (Figure 2) when the bottom water continued to warm throughoutwinter. The decrease in bottom water temperature during winter is a reasonable indicator ofthe strength and duration of the winter mixing. In winter 2009, there was a significantdecrease in bottom water temperature during winter mixing, suggesting strong mixing for aperiod of at least a month. In winter 2010 there was no decrease in bottom watertemperature suggesting that winter mixing was weak and of short duration.Even in years with incomplete mixing, the DO content of the hypolimnion rarely fell below 7.0g m -3 , even close to the sediment except in summer 2001 (Figure 3). However, oxygenconcentrations close to the sediment were below 7.0 g m -3 in 2008 and 2009 and, at the endof summer 2009/10, they were below 6.5 g m -3 (Appendix. 3). In contrast, during win<strong>term</strong>ixing in 2008 and 2009 the bottom water oxygen concentrations exceeded 10.5 g m -3<strong>Lake</strong> <strong>Taupo</strong> Long-<strong>term</strong> Monitoring Programme 2010 - 2011 13
(Figure 3) confirming the high degree of mixing in these years indicated by the colder bottomwaters (Figure 2).Figure 3: Time-series dissolved oxygen data. Time-series dissolved oxygen data from 20 m(black line) and 130 m (pink line) depths. Mixing and reoxygenation occurred where the 2 lines in thetemperature data (Fig. 2) meet each winter. However, where temperature data indicate incompletemixing there is incomplete reoxygenation of the hypolimnion. Date ticks are 1 January in each year.In summer 2010/11, surface (
The low surface DO (Figure 4A) coincided with a period of strong conductivity anomalies(Figure 4C) associated with hydrothermal activity in the bottom of the lake. Without thehydrothermal activity, which periodically introduces hot water with dissolved salts, thespecific conductance profile would be a nearly straight, vertical line. At the <strong>monitoring</strong> site,which is about 3 km from the volcanic vents in the bottom of the lake, the temperaturesignature from the hot water input was not measurable, but the salt content of that waterremains and was detected as a conductivity anomaly.<strong>Lake</strong> circulation currents transport the water from the vents in the lake bed past the<strong>monitoring</strong> site as the hydraulic inertia from the hydrothermal event causes the plume to riseto the thermocline or, with larger events, to the lake surface. With larger events, bottom waterand surficial sediments can be entrained into the upward moving water. On January 2011 theamount of sediment entrained was sufficient to reduce the clarity from an expected Secchidepth of >18 m to 11 m (Figure 7). This has happened on other occasions (see Secchi depthsection 4.3). Several rapid Secchi depth transitions from 18 m to 11 m and back within a fewweeks following the initial event are consistent with several larger events occurring insummer 2011.The entrained sediment in the water column provides an oxygen demand throughdecomposition processes causing the reduction in DO concentrations at all depths. Theshape of the DO profile also includes the effects of primary production and the increase inDO concentration just below the thermocline is attributable to the deep chlorophyll maximumbelow the thermocline (Figure 4B) oxygenating the water via photosynthesis.4.2 VHOD rateThe VHOD rate was estimated between August 2010 and the beginning of February 2011based on oxygen profile data collected at site A. VHOD calculations were made using thevolume-weighted mean DO concentration below 70 m on each sampling occasion (Figure 5)– see Appendix 2 for more detail. From February 2011 onwards the volume weighted meanDO concentration increased and became variable indicating re-oxygenation was occurringand rendering those data invalid for use in the VHOD calculation. The VHOD rate in 2010/11was 17.52 ± 3.95 mg m -3 d -1 (mean ± 95% confidence limit) (Fig. 4). This value was 1.7 mgm -3 d -1 lower than the value for 2009/10, which was 19.21 ± 1.79 mg m -3 d -1 (Table 1).<strong>Lake</strong> <strong>Taupo</strong> Long-<strong>term</strong> Monitoring Programme 2010 - 2011 15
Figure 5: VHOD for 2010-2011 <strong>monitoring</strong> period. Volume-weighted mean dissolved oxygen(DO) concentrations below 70 m for 2010/11. The slope of the linear regression through the solid datapoints provides the VHOD rate. (P < 0.0001, r 2 = 0.99, n = 10). From February 2011 the data show aslight increase, indicating re-oxygenation was occurring.Reoxygenation of the hypolimnion beginning in February is unusual, although reoxygenationhas begun around this time in the last two years. February is the hottest month, thethermocline is strongest and there is usually insufficient wind stress for deep mixing.However, from February to April 2011 the weather was fine with clear skies allowing coldernight temperatures. These conditions would cause the major rivers, such as the TongariroRiver, to plunge as they enter the lake at night, entraining surface oxygenated water into thehypolimnion with the under-flowing density current. It is also possible that the circulationcurrents associated with the hydrothermal events which began in January 2011 (Figure 4)could cause a redistribution of DO in the hypolimnion. The near bottom DO concentrations(Appendix 3) fell to below 7 g m -3 by February 2011 then fluctuated between 7 and 7.5 g m -3until August when the lake mixed. This pattern is consistent with an in<strong>term</strong>ittent oxygensource such as an underflow, rather than photosynthetic production below the thermocline.From April to August there was minimal phytoplankton abundance below the thermocline,eliminating that as a source of the DO.16 <strong>Lake</strong> <strong>Taupo</strong> Long-<strong>term</strong> Monitoring Programme 2010 - 2011
Figure 6: Time-series VHOD data. Time-series of VHOD rates since 1994-5. The low VHOD in1997-2000 (following the 1995/96 eruptions of Mount Ruapehu) correlates with a shift in algaldominance from diatoms to colonial greens (Botryococcus braunii). The regression through the solid(red) dots (P
Table 1: Summary of VHOD rates. Summary of the volumetric hypolimnetic oxygen depletion(VHOD) rates (mg O 2 m -3 d -1 ) (± 95% confidence limit) and the dominant phytoplankton species duringthe preceding winter bloom. (* not measured in winter but measured in October 1994).Year VHOD rate Dominant phytoplankton species Type1994-95 8.93 (2.39) Aulacoseira granulata* Diatom1995-96 9.07 (2.77) A. granulata Diatom1996-97 5.12 (1.37) Botryococcus braunii Colonial green1997-98 3.21 (2.03) B. braunii Colonial green1998-99 2.64 (1.90) B. braunii Colonial green1999-00 5.11 (1.14) B. braunii + A. granulata + Cyclotella stelligera C.G. – Diatom mix2000-01 9.34 (2.9) A. granulata Diatom2001-02 9.06 (2.7) Asterionella formosa Diatom2002-03 13.76 (2.14) A. formosa + A. granulata Diatom2003-04 11.50 (2.80) A. formosa + A. granulata Diatom2004-05 11.30 (1.13) Fragilaria crotonensis + A. formosa Diatom2005-06 9.56 (2.24) A. formosa + A. granulata Diatom2006-07 10.73 (2.45) A. granulata Diatom2007-08 14.51 (2.94) Fragilaria crotonensis + A. formosa Diatom2008-09 17.50 (3.64) A. formosa + A. granulata Diatom2009-10 19.21 (1.79) Fragilaria crotonensis + A. formosa + A. granulata Diatom2010-11 17.52 (3.95) Fragilaria crotonensis + A. formosa + A. granulata Diatom4.3 Secchi depthWater clarity, as measured by Secchi depth, in <strong>Lake</strong> <strong>Taupo</strong> generally follows a seasonalpattern inversely correlating with the pattern of phytoplankton abundance. Secchi depths inthe <strong>long</strong>-<strong>term</strong> record, until recently (since 2002), have mostly been between 10 m to 20 m(Figure 7A) with lowest water clarity during the winter/spring growth phase and highest waterclarity during summer when the phytoplankton have settled out of the epilimnion, which isdepleted in nutrients at that time.18 <strong>Lake</strong> <strong>Taupo</strong> Long-<strong>term</strong> Monitoring Programme 2010 - 2011
Figure 7: Water clarity as measured by Secchi depth. Time-series Secchi depth data A) allrecords since 1932 (♦), and B) all records for the present <strong>monitoring</strong> <strong>programme</strong> since 1994.The maximum water clarity in summer 2010/11 was lower than in most recent years, withSecchi depths reaching 19 m briefly in March 2011 and being around 17 m for most of thesummer (Figure 7B). The low clarity is likely to be associated with a wetter spring andsummer, which is in contrast to the three previous summers which had extremely dry(drought) periods. The high variability in the clarity appeared to be associated with sedimentsuspension from the lake bed entrained in rising plumes of warm water from a series ofhydrothermal eruptions. Sediment detritus particles were observed in the water samples onat least three occasions and there were substantial conductivity anomalies in the profile data.Mean water clarity during winter (July – September) has increased by 0.11 ± 0.10 m y -1 (P =0.038, r 2 = 0.27, n = 16) since the beginning of <strong>monitoring</strong> in 1994 (Figure 7B). However, thisincrease has not been consistent over the whole period. Examining the data in 5-yearlyblocks shows that the mean winter water clarities for the periods 1995-1999, 2000-2004, and2005-2009 were 12.5 m, 13.0 m, and 13.5 m, respectively, whereas the minimum values foreach period were 10 m, 9.5 m, and 11 m, respectively. The <strong>monitoring</strong> period that is thesubject of this report (July 2010- June 2011) was wetter than usual and produced lower<strong>Lake</strong> <strong>Taupo</strong> Long-<strong>term</strong> Monitoring Programme 2010 - 2011 19
mean and minimum water clarities during the mixing period of 12.2 m and 10.5 m,respectively.Minimum Secchi depth (1994 to 2011) usually occurs around September (Figure 8). Since2000 the timing of minimum water clarity may have shifted by two months, from winter tospring (Figure 9). Between 2000 and 2007 the lowest Secchi depth values occurred usuallyin August but from 2007 to 2011 the lowest Secchi depth values occurred mostly in October.Water clarity in summer was higher after 2007 than before.25231994-20112119Secchi depth (m)171513119751 2 3 4 5 6 7 8 9 10 11 12Month of yearFigure 8: Seasonal cycle of water clarity. The annual pattern of all water clarity data has aseasonal cycle with minimum clarity occurring usually in September.20 <strong>Lake</strong> <strong>Taupo</strong> Long-<strong>term</strong> Monitoring Programme 2010 - 2011
25232000-20072007-20112119Secchi depth (m)171513119751 2 3 4 5 6 7 8 9 10 11 12Month of yearFigure 9: The timing of minimum water clarity has recently changed. Between 2000 and 2007(blue), minimum water clarity occurred in winter (August). Since 2007 (red) minimum water clarity hasoccurred two months later in spring (October). Water clarity in summer was higher after 2007 thanbefore. Curves are 3 rd order polynomials fitted to the data.4.4 PhytoplanktonChlorophyll a concentrations tend to be maximum during the winter algal bloom andminimum in summer. As would be expected, there is a statistically significant inverselogarithmic relationship between chlorophyll a concentration and Secchi disk depth (Gibbs2006).The previously reported <strong>long</strong>-<strong>term</strong> trend of increasing mean and maximum chlorophyll aconcentrations in the upper 10 m of the water column at the mid-lake site (e.g., Gibbs2010b), has not changed substantially. With addition of the 2010/11 data, the trend in meanconcentration is statistically significant (P = 0.03) and there is an apparent pattern of increaseand decline in the overall data set (Figure 10).<strong>Lake</strong> <strong>Taupo</strong> Long-<strong>term</strong> Monitoring Programme 2010 - 2011 21
Figure 10: Time-series chlorophyll a concentrations in the upper 10 m of <strong>Lake</strong> <strong>Taupo</strong>. Thesolid regression line represents a weakly statistically significant increase in the mean chlorophyll aconcentrations of 0.014 ± 0.013 mg m -3 y -1 (P = 0.03, r 2 = 0.017, n = 285). Date ticks are 1 January ineach year.The apparent increase-decrease pattern is driven by a statistically significant increase in theannual mean chlorophyll a concentrations of 0.087 ± 0.029 mg m -3 y -1 (P < 0.001, r 2 = 0.857,n = 10) from 1994 to 2003 (Fig. 10), and a weakly statistically significant decrease of 0.024 ±0.023 mg m -3 y -1 (P = 0.04, r 2 = 0.36, n = 12) from 2000 to 2011 (Figure 11).A similar pattern is seen in the annual maximum chlorophyll a concentrations with astatistically significant increase of 0.19 ± 0.086 mg m -3 y -1 (P < 0.001, r 2 = 0.765, n = 10) from1994 to 2003, but a non-statistically significant decrease of 0.043 ± 0.07 mg m -3 y -1 (P = 0.2,r 2 = 0.143, n = 12) from 2000 to 2011 (Figure 10). The mean of the annual maxima was 2.41± 0.074 mg m -3 . There was no significant change during the period 1994-2011.22 <strong>Lake</strong> <strong>Taupo</strong> Long-<strong>term</strong> Monitoring Programme 2010 - 2011
Figure 11: Annual mean and maximum chlorophyll a concentrations. Annual mean and win<strong>term</strong>aximum chlorophyll a concentrations from the 10-m tube samples since 1994. Regression linesindicate significant (P
Figure 14: Time series nutrient data in <strong>Lake</strong> <strong>Taupo</strong>. Time series data from the top 10 m of thewater column in <strong>Lake</strong> <strong>Taupo</strong> for (A) dissolved reactive phosphorus (DRP), (B) ammoniacal nitrogen(NH 4 -N), (C) nitrate + nitrite nitrogen (NO 3 -N), and (D) dissolved organic nitrogen (DON). Broken lineindicates the <strong>long</strong> <strong>term</strong> minimum DON concentration of 29 mg m -3 , which may be mostly refractoryorganic material. Date ticks are 1 January in each year.26 <strong>Lake</strong> <strong>Taupo</strong> Long-<strong>term</strong> Monitoring Programme 2010 - 2011
During the 2008/09 <strong>monitoring</strong> period, DON concentrations fell below the <strong>long</strong>-<strong>term</strong> minimumvalue of around 29 mg m -3 for the first time since the beginning of the <strong>monitoring</strong> <strong>programme</strong>.It has been assumed that the minimum amount of DON consists of refractory organicmaterial. During the 2010/11 <strong>monitoring</strong> period, DON concentrations also fell below 29 mgm -3 during September and October before increasing to more typical values of 40 to 50 mgm -3 . Increases above 60 mg m -3 coincided with hydrothermal eruption events as indicated byconductivity anomalies observed in the CTD profile data. Labile DON is an in<strong>term</strong>ediaryproduct of the decomposition processes occurring in the sediment. DON accumulates in thesediment pore water where it is further mineralised to NH 4 -N and can be nitrified to NO 3 -N.DRP mineralised from organic matter also accumulates in the pore water. Hot water rising tothe surface during a hydrothermal event entrains bottom water, including surficial sedimentpore water, bringing it to the lake surface. This may explain the sudden increase inepilimnetic nutrient concentrations from time to time (Figure 14) which would implyentrainment of hypolimnetic water may be a mechanism for pumping nutrients into theepilimnion of <strong>Lake</strong> <strong>Taupo</strong> without a full mixing event. From conductivity anomalies in the CTDprofile data, hydrothermal events are relatively common in <strong>Lake</strong> <strong>Taupo</strong>. That the time-seriesdata does not show a large peak on each occasion may be due to pore water depletionduring frequent or extended events, or the sampling frequency, which may not coincide witha hydrothermal eruption event. Much of the variability in the nutrient data (Figure 14) may bedue to such events.Except during winter mixing, NH 4 -N concentrations in the hypolimnion are usually very low(
Figure 15: Time series bottom water nutrient data. DRP, NO 3 -N and NH 4 -N concentrations in thebottom waters (150 m depth) of <strong>Lake</strong> <strong>Taupo</strong> since winter mixing of 2003.4.9 Total mass accumulatedFigure 16: Total mass of NO 3 -N in the hypolimnion of <strong>Lake</strong> <strong>Taupo</strong> in autumn before win<strong>term</strong>ixing. .The linear regression (solid line) indicates a statistically significant increase of 6.4 t y -1 (P
The total mass 1 of NO 3 -N in the hypolimnion (below 70 m depth) in autumn each year beforethe onset of winter mixing has ranged from about 120 t (1978) to more than 650 t (1999)(Figure 16). While this graph is similar to those in earlier reports, it also includes additionalinformation from historical data sets held by NIWA. The historical data used to produce theadditional data points from 1988 to 1990 are given in Appendix 6. Since 1975 there has beena statistically significant (P
significant increase in the net accumulation rate of 0.025 ± 0.03 t d -1 per year (P = 0.07, r 2 =0.144, n = 24) since 1975 (Figure 17), which was similar to the previous report. The data for1976 and 1987 were excluded from the regression analysis because they were estimatedusing different periods than the rest of the data (see also Figure 16). The data points for1976 and 1987 are included in Figure 17 as an indication of what the net accumulation ratesmay have been in those two years.3.0Net NO 3-N accumulation rate (t d -1 )2.52.01.51.00.50.0-0.51970 1975 1980 1985 1990 1995 2000 2005 2010Figure 17: Net Hypolimnetic NO 3 -N accumulation rates . Net NO 3 -N accumulation rates (t d -1 ) inthe hypolimnion below 70 m. The regression line shows an increase in the net accumulation rate of0.025 ± 0.027 t d -1 (P = 0.07, r 2 = 0.144, n = 24). Open circle data were not included in the regressionanalysis (see text). Note that the Y-axis extends to -0.5 t d -1 for the 2006 data point. Date ticks are 1January in each year.The net accumulation rate for the 2010/11 period was 1.59 t d -1 , which was almost the sameas in the previous year (1.65 t d -1 ). The time-series of net accumulation rates of NO 3 -N(Figure 17) show a high degree of variability between years, with the 1999 and 2006 datapoints falling well below the trend line. The negative net accumulation rate in 2006 indicatesa net loss of NO 3 -N from the hypolimnion during the 2005-06 stratified period. Both of thesedata points are for years following a winter where there was incomplete mixing. Thissuggests that those two low values are anomalies relative to the rest of the data. The effectof incomplete mixing was discussed in an earlier report (Gibbs 2007). Excluding those twovalues, the net accumulation rates of NO 3 -N shows a highly significant increase of 0.034 ±0.018 t d -1 (P
4.11 Total NTotal nitrogen (TN) mass in <strong>Lake</strong> <strong>Taupo</strong> was estimated from the spring profile in each year.Although there was an average increase of about 5.4 t y -1 since 1975 there was nostatistically significant trend in the total mass of TN (Figure 18). The mean was 3360 t,contrasting with a net annual external TN input to the lake of around 1200 t (W. Vant,<strong>Waikato</strong> Regional Council, pers. comm.), The total mass of TN in <strong>Lake</strong> <strong>Taupo</strong> in spring 2010was 3140 t, 420 t more than in the previous year.Figure 18: Estimates of the mass of total nitrogen (TN) in <strong>Lake</strong> <strong>Taupo</strong>. Although there was anaverage increase of about 5.4 t y -1 from 1975 to 2011, this apparent trend in the data is not statisticallysignificant. The mean was 3360 t. Date ticks are 1 January in each year.<strong>Lake</strong> <strong>Taupo</strong> Long-<strong>term</strong> Monitoring Programme 2010 - 2011 31
5. Knowledge gapsAn earlier report (Gibbs 2006) listed several knowledge gaps including in-lake processes in<strong>Lake</strong> <strong>Taupo</strong>, and process rates at the sediment-water interface. This report presentsestimates of the net rate of NO 3 -N accumulation in the hypolimnion during the stratifiedperiod as well as estimates of the net efflux of inorganic nitrogen from the sediments.Together these data indicate that the net NO 3 -N accumulation rates in 1999 and 2006 maybe anomalous. These years have in common that they followed a year of incomplete mixingin winter. The immediate return of the net accumulation rate to the trend in the netaccumulation rate data the following year, points to water column processes being asimportant as sediment processes for controlling hypolimnetic NO 3 -N concentrations andhighlights the need to understand how the water column processes work in <strong>Lake</strong> <strong>Taupo</strong>.The sum of the external inputs to the lake from the catchment via rivers minus the mass lostfrom the lake via the <strong>Waikato</strong> river is estimated to be around 1200 t y -1 (W. Vant, <strong>Waikato</strong>Regional Council, pers. comm.). Despite this net input of TN, which represents around a thirdof the average mass of N in the lake (3360 t), there is no significant <strong>long</strong> <strong>term</strong> increase in themass of TN in the lake (Figure 18).The total mass of NO 3 -N in the hypolimnion just before winter mixing each year appears toreach a plateau (see shape of NO 3 -N concentration curves, Figure 16). This may beexplained by diffusion across an increasing concentration gradient in the metalimnion orassimilation by algae in the DCM.Together these data suggest that processes at the sediment-water interface and elsewherein the hypolimnion are capable of sequestering a very large amount of N each year.However, the net increase in accumulation rate of NO 3 -N in the hypolimnion suggests thatthe sediment processes of nitrogen burial, decomposition, mineralisation, nitrification,denitrification and assimilation are changing.We have little or no information on any of these N transformation and sequestration processrates in <strong>Lake</strong> <strong>Taupo</strong>.The appearance of NH 4 -N a<strong>long</strong> with DRP in the upper water column during late spring andsummer in 2007, 2008 and 2009 is unusual as these nutrients are usually rapidly assimilatedin <strong>Lake</strong> <strong>Taupo</strong> by phytoplankton. The source of the epilimnetic NH 4 -N is unknown.In February 2010 and January 2011, sampling coincided with hydrothermal eruption eventsin the lake floor (e.g., Figure 4). These events brought sediment to the lake surface (personalobservation), together with a pulse of NO 3 -N and DON. The latter is presumed to have comefrom sediment pore water. This observation suggests that these periodic hydrothermalevents bring additional nutrients into the upper water column. Also, it is not clear whetherthere are nutrients in the geothermal sources in the lake bed and whether they have asignificant role in the nutrient budget of the lake.The mean annual water clarity and the mean annual chlorophyll a concentrations in theupper 10 m of the water column have increased significantly since 1994. These parametersare usually inversely related and thus other factors must be influencing the relationshipbetween water clarity and phytoplankton biomass. Notably, the DCM can contain up to 70%more chlorophyll a than in the upper 10 m layer. This represents a substantial amount of thealgal biomass which is not being assessed in the <strong>monitoring</strong> reports, although it is measuredas chlorophyll fluorescence at every sampling occasion.32 <strong>Lake</strong> <strong>Taupo</strong> Long-<strong>term</strong> Monitoring Programme 2010 - 2011
6. Summary• Using a linear regression through all data, the annual mean chlorophyll aconcentration in the upper 10 m of water column in <strong>Lake</strong> <strong>Taupo</strong>, as an indicatorof phytoplankton biomass, has increased at a rate of 0.014 ± 0.013 mg m -3 y -1(P
• There was no change in the whole lake TN, nor the <strong>long</strong> <strong>term</strong> mean load of3360 t. The TN content of the lake in spring 2010 was 3139 t, an increase ofaround 420 t since the previous year.• The 2010/11 net VHOD rate for the period from August 2010 to February 2011was 17.52 ± 3.95 mg m -3 d -1 (mean ± 95% confidence limit) which was almost 2mg m -3 d -1 lower than the previous year at 19.21 ± 1.79 mg m -3 d -1 .• There has been a statistically significant (P
annual maximum hypolimnetic concentrations of DRP and NO 3 -N in autumn for the last 7years (Figure 15). These nutrients become available for algal growth after winter mixing.However, the persistent increase in the net VHOD rate indicating an increase in oxygendemand implies a change in the loading of organic carbon on the lake. The temporaldisassociation of the chlorophyll a maximum in July-August from the minimum water clarity inOctober (Gibbs 2011) suggests that the carbon load through suspended sediment inputsfrom land may have increased in spring months when high rainfall occurred.<strong>Lake</strong> <strong>Taupo</strong> Long-<strong>term</strong> Monitoring Programme 2010 - 2011 35
7. AcknowledgementsThis report was made possible by the team effort of Philip King and Heath Cairns of the<strong>Taupo</strong> Harbourmaster’s Office, and Eddie Bowman (NIWA Rotorua) who have collected thedata. Much of the success of this <strong>monitoring</strong> <strong>programme</strong> is attributable to the extra effort byEddie and the team.Water samples were processed in the NIWA chemistry laboratory and analytical results wereprovided by Graham Bryers, Margaret McMonagle, Cara Mackle and team. Quality controlwas provided by Mike Crump, Lab Manager.Phytoplankton dominance and enumeration results were provided by Karl Safi.<strong>Lake</strong> <strong>Taupo</strong> Long-<strong>term</strong> Monitoring Programme 2010 - 2011 37
8. Glossary of abbreviations and <strong>term</strong>sBODBiochemical Oxygen Demand: the rate of oxygen consumption associated withbiological decomposition and chemical processes and in the water column.VHODPhytoplanktonCyanobacteriaZooplanktonBiomassThermal stratificationThermoclineEpilimnionHypolimnionMetalimnionEuphotic zoneEuphotic depthNutrientsAmmoniacal nitrogenNitrate nitrogenDINDONPNTNVolumetric Hypolimnetic Oxygen Demand: the net rate of oxygen loss associatedwith biological, chemical and physical processes in the hypolimnion of a lake in theabsence of a temperature change.Microscopic free-floating aquatic plants (algae).Blue-green algae. These are potentially toxic. They can adjust their depth in thewater column using small gas bladders (gas vacuoles), and some species can use(i.e., fix) atmospheric nitrogen for growth when nutrient nitrogen in the watercolumn is depleted.Small to microscopic free-swimming aquatic animals which graze on phytoplanktonor smaller zooplankton.The living mass of the phytoplankton or zooplankton populations.Separation of a water column into two layers by temperature – warmer water ontop.The boundary zone or temperature gradient between the two layers in a thermallystratified water column.The upper water column in a thermally stratified water column.The lower water column in a thermally stratified water column.The thermocline zone — of variable thickness.The upper water column in which there is sufficient light for photosynthesis andhence phytoplankton growth.Lower limit of phytoplankton growth where light levels are 1% of surface irradiance.Essential dissolved inorganic nitrogen and phosphorus compounds which can beused directly by plants for growth.Sum of ammonium ion (NH 4 + ) plus free (unionised) ammonia (NH 3 ). Some amines(NH 2 - ) may be included as interference during analysis. Symbol, NH 4 -N.Used in this report as the sum of nitrate (NO 3 - ) plus nitrite (NO 2 - ). Symbol, NO 3 -N.Dissolved Inorganic Nitrogen: the sum of NH 4 -N + NO 3 -N.Dissolved Organic Nitrogen: the soluble nitrogen other than DIN.Particulate Nitrogen: includes phytoplankton and other detritus.Total Nitrogen: Sum of DIN + DON + PN.NO x Gaseous oxides of nitrogen, including N 2 O, NO, NO 2.<strong>Lake</strong> <strong>Taupo</strong> Long-<strong>term</strong> Monitoring Programme 2010 - 2011 39
9. ReferencesBurns, N.M. (1995). Using hypolimnetic dissolved oxygen depletion rates for<strong>monitoring</strong> lakes. New Zealand Journal of Marine and Freshwater Research 29:1–11.Gibbs, M.M. (1995). <strong>Lake</strong> <strong>Taupo</strong> <strong>long</strong> <strong>term</strong> <strong>monitoring</strong> <strong>programme</strong>. NIWAconsultancy report to Environment <strong>Waikato</strong>, Report No. EVW60203/1.Gibbs, M.M. (2000). <strong>Lake</strong> <strong>Taupo</strong> <strong>long</strong> <strong>term</strong> <strong>monitoring</strong> <strong>programme</strong>: 1999-2000.NIWA consultancy report to Environment <strong>Waikato</strong>, Report No. EVW01203.Gibbs, M.M.; Rutherford, J.C.; Hawes, I. (2002). <strong>Lake</strong> <strong>Taupo</strong> <strong>long</strong> <strong>term</strong> <strong>monitoring</strong><strong>programme</strong> 2000 – 2001, with a review of accumulated data since 1994. NIWAconsultancy report to Environment <strong>Waikato</strong>, Report No. HAM2002-029, August.Gibbs, M.M. (2005). <strong>Lake</strong> <strong>Taupo</strong> <strong>long</strong> <strong>term</strong> <strong>monitoring</strong> <strong>programme</strong> 2003-2004:including two additional sites. NIWA consultancy report to Environment <strong>Waikato</strong>,Report No.HAM2005-006, February.Gibbs, M.M. (2006). <strong>Lake</strong> <strong>Taupo</strong> <strong>long</strong> <strong>term</strong> <strong>monitoring</strong> <strong>programme</strong> 2004-2005:including two additional sites. NIWA consultancy report to Environment <strong>Waikato</strong>,Report No.HAM2006-033, May.Gibbs, M.M. (2007). <strong>Lake</strong> <strong>Taupo</strong> <strong>long</strong> <strong>term</strong> <strong>monitoring</strong> <strong>programme</strong> 2005-2006.NIWA consultancy report to Environment <strong>Waikato</strong>, Report No. HAM2007-029,March.Gibbs, M.M. (2009). <strong>Lake</strong> <strong>Taupo</strong> <strong>long</strong> <strong>term</strong> <strong>monitoring</strong> <strong>programme</strong> 2007-2008.NIWA consultancy report to Environment <strong>Waikato</strong>, Report No. HAM2009-044,MarchGibbs, M.M. (2010a). <strong>Lake</strong> <strong>Taupo</strong> Near-Shore Water Quality Monitoring 2007-2009.Environment <strong>Waikato</strong> Technical Report 2010/02.Gibbs, M.M. (2010b). <strong>Lake</strong> <strong>Taupo</strong> <strong>long</strong> <strong>term</strong> <strong>monitoring</strong> <strong>programme</strong> 2008-2009.NIWA consultancy report to Environment <strong>Waikato</strong>, Report No. HAM2010-026,MarchGibbs, M.M. (2011). <strong>Lake</strong> <strong>Taupo</strong> <strong>long</strong> <strong>term</strong> <strong>monitoring</strong> <strong>programme</strong> 2009-2010.NIWA consultancy report to Environment <strong>Waikato</strong>, Report No. HAM2011-032,MarchHelsel, D.R.; Hirsch, R.M. (1992). Statistical methods in water resources. Studies inEnvironmental Science No. 49, Elsevier Science Publishers, Amsterdam.U<strong>term</strong>öhl, von, H. (1931). Neue Wege in der quantitativen Erfassung des Planktons.(Mit besondere Beriicksichtigung des Ultraplanktons). Verh. Int. Verein. Theor.Angew. Limnol. 5: 567–595.<strong>Lake</strong> <strong>Taupo</strong> Long-<strong>term</strong> Monitoring Programme 2010 - 2011 41
Vant, W.N. (1987). Hypolimnetic dissolved oxygen: survey and interpretation.Chapter 6: 59-65, In: Vant, W.N. (ed.) <strong>Lake</strong> Managers Handbook. Water & SoilMiscellaneous Publication No. 103. Wellington.Vincent, W.F. (1983). Plankton production and winter mixing: contrasting effects intwo oligotrophic lakes. Journal of Ecology 71: 1–20.Vincent, W.F.; Downes, M.T. (1981). Nitrate accumulation in aerobic hypolimnia:relative importance of benthic and planktonic nitrifiers in an oligotrophic lake.Applied and Environmental Microbiology 42: 565–573.White, E.; Downes, M.; Gibbs, M.; Kemp, L.; Mackenzie, L.; Payne, G. (1980).Aspects of the physics, chemistry, and phytoplankton biology of <strong>Lake</strong> <strong>Taupo</strong>.New Zealand Journal of Marine and Freshwater Research 14(2): 139–148.42 <strong>Lake</strong> <strong>Taupo</strong> Long-<strong>term</strong> Monitoring Programme 2010 - 2011
Appendix 1. Site map, sampling strategy and methodsSite map<strong>Lake</strong> <strong>monitoring</strong> sites were originally established using land-based markers (Figure 19).These have now been defined using GPS and corrected for curvature using WGS84convention.6285000Transit lines for sampling sites6280000Ju st o pe n clif fs andWaih ah a River m ou thTrig at scrub/pastureb oun darySteam plu me fromFletchers bores6275000Vertical edge ofheadland6270000C110 m6265000A150 mRangatira Point62600006255000Kura tau Riv ermouthB100 m62500006245000NZMG Coordinates (WGS84)Site A: 2768101.95 6265248. 87Site B: 2752476.92 6252097. 10Site C: 2755955.48 6271420. 0762400002745000 2750000 2755000 2760000 2765000 2770000 2775000 2780000 2785000Figure 19: Site map of <strong>Lake</strong> <strong>Taupo</strong>. Site map of <strong>Lake</strong> <strong>Taupo</strong> showing location of the routine<strong>monitoring</strong> site at mid lake (A). Two additional sites at Kuratau Basin (B) and the Western Bays (C)were sampled between January 2002 and December 2004 inclusive. Data from those sites have beenretained with the Site A data presented in the appendices. Map coordinates are in NZ Map Grid withWGS84 correction. Lat. Long WGS 84 corrected co-ordinates of "Site A" are 38° 46'.810 S; 175°58'.440 E.The following section has been copied from Gibbs 1995, and modified after 1998.<strong>Lake</strong> <strong>Taupo</strong> Long-<strong>term</strong> Monitoring Programme 2010 - 2011 43
MethodsThe sampling site was selected in the central basin of <strong>Lake</strong> <strong>Taupo</strong> (Site Map) with a waterdepth of about 160 m. This site is more than 5 km from the nearest land and is exposed toboth the north-south and east-west axis of the lake.To calculate VHOD requires two measurements each year far enough apart in time for ameasurable change to occur in the DO concentrations in the hypolimnion of the lake. Detailsof the procedure and limitations of this measurement are described by Vant (1987). For the<strong>monitoring</strong> of <strong>Lake</strong> <strong>Taupo</strong>, which mixes briefly in winter between July and August, the initialsampling time was selected to be in October, to give sufficient time for thermal stratificationto establish a stable hypolimnion. The final sampling time was selected to be in April, beforelake cooling causes the downward movement of the thermocline which precedes the win<strong>term</strong>ixing.At each of these biannual samplings, a detailed profile of DO and temperature wasmeasured. Prior to 1998, measurements were made at 1 m depth intervals through the fulldepth of the water column using an in situ recording Applied Microsystems STD-12 profilerfitted with a Royce DO sensor, and compared with manual measurements of DO andtemperature made at 10 m depth intervals from the surface to the bottom of the lake using aYellow Springs Instrument (YSI) model 58 dissolved oxygen meter fitted with a stirred Model5739 probe on a 160 m cable. Subsequent to 1998, a Richard Brancker Research (RBR)model TD410 conductivity-temperature-depth (CTD) profiler fitted with a stirred YSI model5739 DO sensor was used. In January 2002, the TD410 CTD profiler was upgraded to anRBR model XR420f freshwater CTD profiler fitted with the YSI model 5739 DO sensor and aSeapoint chlorophyll fluorescence probe. The DO sensor was calibrated regularly by NIWA,Rotorua staff and chlorophyll fluorescence was converted to chlorophyll a from extractedchlorophyll a analyses of water samples collected beside the profiler.In January 2008, the XR420f profiler was upgraded to a RBR model XR620f freshwaterprofiler/logger with improved sensitivity. The new profiler is fitted with a Sea Point chlorophyllfluorescence probe and a Li-Cor underwater photosynthetically active radiance (PAR) sensorto measure in situ light levels and light extinction (Kd) associated with the vertical distributionof algal biomass within the lake water column. In the new system the YSI dissolved oxygen(DO) sensor was replaced with an Oxyguard DO sensor, with a temperature sensor, fitted toa separate RBR logger attached to the profiling frame.Cross-calibration between the two profilers confirmed the quality of the data and the XR420fhas been retained as a back-up.The following parameters were also measured as profiles from water samples collectedusing a van Dorn water sampling bottle starting at 1 m and then at 10 m intervals from 10 mto the bottom of the lake:DO, chlorophyll a, dissolved reactive phosphorus (DRP), dissolved organic phosphorus(DOP), particulate phosphorus (PP), total phosphorus (TP), nitrate+nitrite nitrogen (NO 3 -N)*,ammoniacal nitrogen (NH 4 -N), dissolved organic nitrogen (DON), particulate nitrogen (PN),total nitrogen (TN), urea nitrogen (Urea-N), total suspended solids (SS), volatile suspendedsolids (VSS), particulate carbon (PC) and dissolved organic carbon (DOC). (* Little, if anynitrite is ever found in the <strong>Lake</strong> <strong>Taupo</strong> water column, hence the use of NO 3 -N).44 <strong>Lake</strong> <strong>Taupo</strong> Long-<strong>term</strong> Monitoring Programme 2010 - 2011
Note: TN and TP values are the summation of all other N and P components, respectively,excluding Urea-N which is part of the DON component.Additional parameters measured but not as complete profiles were:Water clarity (by Secchi disc depth) and algal species composition and abundance on watersamples from 1, 10, 50, 100, and 140 m.De<strong>term</strong>inations on the water samples were made with the standard methods routinely usedfor freshwater analysis by NIWA on a Lachat FIA flow injection analyser.Algal species composition and abundance were obtained by settling a measured volume ofsample (up to 100 mL) in U<strong>term</strong>öhl (1931) tubes and counting on an inverted microscope.Biovolume was estimated from cell volume tables calculated from the cell dimensions ofeach species. Dominance was estimated from relative biovolumes with the highestbiovolume assigned dominance 1 as most common and the lowest biovolume assigned thedominance 10 as rare. Professional judgement was used to relate dominance betweensamplings.Since 2007, dominance is no <strong>long</strong>er used and the algal data are reported in cell counts andbiovolume.Data for the <strong>long</strong> <strong>term</strong> <strong>monitoring</strong> <strong>programme</strong> were scheduled to be collected from the midlakesampling station at 2 weekly intervals. The practicality of achieving this target waslimited by the weather and in reality data were generally collected at about 2-3 weeklyintervals. Parameters measured were:DO and temperature profiles at 1 m depth intervals to the bottom of the lake by RBR profiler,water clarity as Secchi disc depth, and a 10 m tube water sample was collected formeasurement of chlorophyll a, NO 3 -N, NH 4 -N, TN, DRP, TP, and algal species dominance.Chlorophyll fluorescence, conductivity, and PAR data from the profiler are archived but notroutinely included in this report.From 2000, near-bottom water samples from 150 m were collected using a van Dorn watersampling bottle and analysed for DRP, NO 3 -N, and NH 4 -N.Data handling and less than detection limit valuesAll data in this report have been processed and manipulated on Excel spreadsheets. Data isrounded using the Excel protocol to an appropriate number of significant numbers based onthe need for detailed knowledge tempered with the confidence in the precision and accuracyof the analytical methods used. This treatment may lead to small differences betweenelectronic copies of the data and the values presented in this report.The difference between the written report and the Excel spreadsheet of essentially the samedata is the treatment of the less than detection limit (
• In general the data is reported as a series of results from analytical methods whichhave known limitations and precision. The raw number is reported where ever possibleso that the user can draw their own conclusions about the reliability of the "lastsignificant figure" on any result when performing data manipulations.• The real problem arises at very low levels and the result obtained is less than themethod’s prescribed DL The problem is not so much the result obtained but what to dowith it which in turn raises the question 'What do we mean by detection limit'?• In the book "Statistical methods in water resources" Helsel & Hirsch 1992 [Studies inEnvironmental Science 49, Elsevier], and chapter 13 "Methods for data below thereporting limit" it is pointed out that the 'detection limit' is variously known as the'reporting limit' or the 'limit of quantitation'. If no other value is available, there are 3main options: call it zero (which is clearly an under estimate), call it the detection limit(which is clearly an over estimate), or call it half the detection limit (which gives a 50:50chance of an over or under estimate). The choice then is one of 'which convention doyou wish to use'. In the written reports, I have treated the
Helsel & Hirsch suggest an alternative method for estimating a value in the DL, a probability curve can be derived and extrapolated aroundthe DL to generate the most probable number for the
Appendix 2. The calculation of VHOD ratesCopied from Gibbs 1995.RationaleIn the strictest <strong>term</strong>s, VHOD can only be calculated for a lake which has thermally stratifiedand the resultant thermocline provides an effective barrier against re-oxygenation of thehypolimnion. The measure of the barrier efficiency is the rate of heating of the hypolimnionfollowing stratification as heat will be transferred across the thermocline at a similar rate tooxygen.In <strong>Lake</strong> <strong>Taupo</strong>, the thermal inertia of the hypolimnion is so great that heating during thestratified period is typically about 0.2 °C and never more than 0.4 °C over a 200 day period.While this would seem to meet the temperature criterion, in a lake that large, oxygen can betransferred into the hypolimnion by mechanisms other than diffusion.Wind induced mixing may increase turbulent diffusion across the thermocline as would aninternal seiche on the thermocline. Both of these mechanisms would transfer heat. Thepenetration of the thermocline by an under-flowing density current would entrain oxygenatedsurface water into the hypolimnion with that flow. As the density current must be colder thanthe thermocline to plunge through it, there is no heat transferred with this mechanism.In <strong>Lake</strong> <strong>Taupo</strong> the Tongariro River water is always colder than the lake surface water and forat least 9 months of the year it is also colder than the minimum lake water temperature of10.3 ºC. Thus, during most of the stratified period, the Tongariro River flows directly into thehypolimnion entraining oxygenated surface water with it. The amount of surface waterentrained has been estimated to be about 10 times the river discharge. The amount ofoxygen transported in this way is likely to be more than 200 tonnes per day.Clearly this is a substantial oxygen input which invalidates the concept of the thermoclineforming an oxygen barrier for purposes of calculating the VHOD. The true VHOD may onlybe calculated during mid-summer when the Tongariro River flows deep into the epilimnionbut does not penetrate the thermocline.The data collected to date indicates that hypolimnetic oxygen depletion occurs throughoutthe stratified period - with or without the density current re-oxygenation - and hence the valueobtained from a VHOD calculation over the whole stratified period is the net VHOD ratetaking all the factors affecting the hypolimnion into account.As the data from 1996/97 shows, the density current also advects dissolved organic nutrientswith it. Hence, management strategies which affect the Tongariro River also impact on thelake. Hence it is appropriate to use the net VHOD rate for inter-annual comparisons ratherthan the true VHOD rate calculated only through mid-summer.Method of calculationThe following is the method used to calculate the net VHOD rate for <strong>Lake</strong> <strong>Taupo</strong>.Requirements:Microsoft Excel spreadsheet or equivalent.<strong>Lake</strong> <strong>Taupo</strong> Long-<strong>term</strong> Monitoring Programme 2010 - 2011 49
Although the thermocline in <strong>Lake</strong> <strong>Taupo</strong> is usually at about 40 m, the isothermal watercolumn lies below 70 m. To accommodate the gradient across the thermocline, the netVHOD rate calculation only uses oxygen data from below 70 m.To calculate the mean oxygen concentration in the water column below 70 m, the DOconcentration at each 10 m depth increment is multiplied by the volume of the 10 m slice itcame from. This assumes rapid horizontal mixing and minimal vertical mixing to extrapolateone DO value across the whole lake. Historical data from multiple sites would suggest thatthis is a reasonable assumption.The slice volumes (hypsographic volumes) for <strong>Lake</strong> <strong>Taupo</strong> have been calculated for 10 mthick layers centred on the 5 m point of each slice i.e., 75, 85, 95, 105 m etc. The DOmeasurements are made at 10 m intervals i.e., 70, 80, 90, 100, 110 m etc.The mass of oxygen in each 10 m slice is the average of the DO concentration at the top andbottom of a slice multiplied by the slice volume. i.e., for the 70 - 80 m slice the calculation is:-DO Mass 70-80m = ((DO 70m + DO 80m ) ÷ 2) × Volume 70-80mFor each profile date:Compute the DO mass for each 10 m slice between 70 m and 150 m and sum the results asthe total mass of DO in the hypolimnion below 70 m. Sum the slice volumes below 70 m asthe total volume of the hypolimnion below 70 m.The volume weighted mean DO concentration is the total DO mass value divided by the totalvolume value.Use the sequential day number or equivalent to construct a time series of volume weightedmean DO concentrations over the stratified period and use the Excel regression analysis toolto obtain the y = ax + b straight line fit for these data.As the DO data are in g m -3 , the value of 'a' is in g m -3 d -1 . Multiply 'a' by 1000 to get the netVHOD rate in mg m -3 d -1 . The negative sign from the regression equation indicates a lossrate. By convention VHOD is always a “loss” <strong>term</strong> and thus the negative sign is omitted whenreporting net VHOD rates.The hypsographic volumes and upper surface areas of the 10 m slices through the wholedepth of <strong>Lake</strong> <strong>Taupo</strong> are listed at the end of this section.Statistical evaluation of the VHOD rateFrom the 1999-2000 <strong>monitoring</strong> report (Gibbs 2000), the VHOD rate is expressed as thecalculated net VHOD rate ± the 95% confidence limit. This gives a meaningful estimate of therange within which the VHOD rate lies and is more appropriate than the standard deviationon the data or a standard error estimate on the regression coefficient.50 <strong>Lake</strong> <strong>Taupo</strong> Long-<strong>term</strong> Monitoring Programme 2010 - 2011
Table 2: <strong>Lake</strong> <strong>Taupo</strong> Hypsographic Data used in the Net VHOD RATE calculation. .Slice depths (m) Volume of slice (km 3 ) Upper surfacearea of slice (km 2 )0 - 10 5.849359 60010 - 20 5.599702 57020 - 30 5.459951 55030 - 40 5.359888 54240 - 50 5.288266 53050 - 60 5.150538 52860 - 70 4.899510 50270 - 80 4.619076 47880 - 90 4.278738 44690 - 100 3.847292 410100 - 110 3.006616 360110 - 120 1.730549 245120 - 130 0.837468 110130 - 140 0.394439 60140 - 150 0.073333 22150 - 0 0Table 3: Julian Date or sequential day number. Julian Date or sequential day number for eachday of the year excluding leap years. For Leap Years, add 1 to the sequential day number from 1March to 31 December of that year.Jan Feb Mar Apr May Jun Jul Aug Sep Oct Nov Dec1 1 32 60 91 121 152 182 213 244 274 305 335 12 2 33 61 92 122 153 183 214 245 275 306 336 23 3 34 62 93 123 154 184 215 246 276 307 337 34 4 35 63 94 124 155 185 216 247 277 308 338 45 5 36 64 95 125 156 186 217 248 278 309 339 56 6 37 65 96 126 157 187 218 249 279 310 340 67 7 38 66 97 127 158 188 219 250 280 311 341 78 8 39 67 98 128 159 189 220 251 281 312 342 89 9 40 68 99 129 160 190 221 252 282 313 343 910 10 41 69 100 130 161 191 222 253 283 314 344 1011 11 42 70 101 131 162 192 223 254 284 315 345 1112 12 43 71 102 132 163 193 224 255 285 316 346 1213 13 44 72 103 133 164 194 225 256 286 317 347 1314 14 45 73 104 134 165 195 226 257 287 318 348 1415 15 46 74 105 135 166 196 227 258 288 319 349 1516 16 47 75 106 136 167 197 228 259 289 320 350 1617 17 48 76 107 137 168 198 229 260 290 321 351 1718 18 49 77 108 138 169 199 230 261 291 322 352 1819 19 50 78 109 139 170 200 231 262 292 323 353 1920 20 51 79 110 140 171 201 232 263 293 324 354 2021 21 52 80 111 141 172 202 233 264 294 325 355 2122 22 53 81 112 142 173 203 234 265 295 326 356 2223 23 54 82 113 143 174 204 235 266 296 327 357 2324 24 55 83 114 144 175 205 236 267 297 328 358 2425 25 56 84 115 145 176 206 237 268 298 329 359 2526 26 57 85 116 146 177 207 238 269 299 330 360 2627 27 58 86 117 147 178 208 239 270 300 331 361 2728 28 59 87 118 148 179 209 240 271 301 332 362 2829 29 88 119 149 180 210 241 272 302 333 363 2930 30 89 120 150 181 211 242 273 303 334 364 3031 31 90 151 212 243 304 365 31<strong>Lake</strong> <strong>Taupo</strong> Long-<strong>term</strong> Monitoring Programme 2010 - 2011 51
Appendix 3. Temperature and dissolved oxygen dataIncludes accumulated data since 1994.* represents data missing or invalid.For completeness, additional data from Kuratau Basin (Site B) and Western Bays (Site C)collected for the period between January 2002 and December 2004 are included as separatesheets following the mid-lake data from Site A for those years.<strong>Lake</strong> <strong>Taupo</strong> Long-<strong>term</strong> Monitoring Programme 2010 - 2011 53
<strong>Lake</strong> <strong>Taupo</strong> Temperature, Dissolved Oxygen, and Secchi Depth Database. 2010-2011Mid-<strong>Lake</strong> site A for the period starting 13 July 2010TemperatureDate13/07/2010 10/08/2010 24/08/2010 13/09/2010 5/10/2010 26/10/2010 10/11/2010 25/11/2010 21/12/2010 11/01/2011 27/01/2011 17/02/2011 1/03/2011 15/03/2011 13/04/2011 10/05/2011 31/05/2011 22/06/2011 5/07/2011 9/08/2011Depth (m)0 11.31 11.01 10.92 11.37 11.90 13.00 13.98 15.96 18.32 19.75 19.62 20.54 20.47 19.94 17.68 15.51 14.13 13.11 12.35 11.0710 11.29 10.96 10.86 11.02 11.66 11.72 13.25 15.65 18.25 19.62 19.58 20.44 20.48 19.72 17.67 15.52 14.14 13.13 12.33 10.9520 11.29 10.95 10.85 10.95 11.23 11.53 13.13 13.81 14.51 17.39 18.98 20.35 20.48 19.53 17.64 15.50 14.15 13.12 12.33 10.9430 11.28 10.95 10.85 10.89 11.01 11.44 11.88 12.10 12.53 12.88 15.19 16.03 15.33 15.41 17.62 15.43 14.15 13.12 12.33 10.9340 11.28 10.95 10.85 10.85 10.96 11.37 11.54 11.42 11.66 11.62 12.22 12.26 12.17 12.27 12.12 15.32 14.15 13.13 12.33 10.9450 11.28 10.95 10.85 10.85 10.88 11.31 11.17 11.11 11.24 11.37 11.47 12.09 11.31 11.43 11.39 12.27 11.84 13.11 12.32 10.9460 11.26 10.94 10.83 10.83 10.85 11.21 11.02 10.98 11.03 11.08 11.13 11.33 11.10 11.11 11.12 11.28 11.31 11.38 11.41 10.9470 11.01 10.94 10.81 10.82 10.82 11.03 10.93 10.91 10.92 10.96 10.97 11.09 10.98 11.02 10.99 11.09 11.11 11.19 11.18 10.9480 10.96 10.92 10.80 10.81 10.80 10.89 10.85 10.87 10.88 10.89 10.90 10.96 10.93 10.97 10.95 11.00 11.03 11.07 11.03 10.9490 10.79 10.84 10.78 10.81 10.78 10.88 10.82 10.84 10.85 10.86 10.86 10.92 10.92 10.92 10.92 10.97 11.00 11.00 11.02 10.94100 10.75 10.81 10.76 10.80 10.76 10.83 10.81 10.83 10.84 10.86 10.85 10.89 10.90 10.90 10.89 10.93 10.97 10.97 10.98 10.93110 10.70 10.75 10.76 10.80 10.75 10.82 10.78 10.81 10.81 10.85 10.84 10.88 10.90 10.87 10.88 10.91 10.95 10.95 10.97 10.93120 10.68 10.73 10.75 10.80 10.75 10.80 10.77 10.81 10.80 10.84 10.84 10.87 10.88 10.87 10.87 10.90 10.95 10.94 10.97 10.93130 10.67 10.71 10.75 10.78 10.75 10.78 10.77 10.80 10.79 10.83 10.83 10.87 10.87 10.85 10.86 10.89 10.92 10.92 10.95 10.93140 10.66 10.71 10.74 10.76 10.75 10.79 10.77 10.80 10.79 10.83 10.83 10.85 10.85 10.85 10.84 10.87 10.92 10.91 10.92 10.92150 10.66 10.70 10.74 10.76 10.75 10.77 10.77 10.80 10.79 10.82 10.83 10.84 10.85 10.85 10.84 10.87 10.91 10.90 10.93 10.92Dissolved Oxygen (g m -3 )Depth (m)0 10.50 9.50 10.64 11.24 9.90 10.12 9.83 9.57 9.00 8.73 8.76 8.60 8.64 8.30 9.17 9.54 9.85 10.07 10.22 10.4910 11.42 11.29 10.52 10.92 9.80 9.78 9.68 9.32 8.37 8.00 7.98 8.63 8.64 8.73 9.64 10.26 10.71 10.30 10.27 10.6220 11.57 11.60 10.50 10.62 9.68 9.76 9.52 10.10 9.06 8.74 7.96 8.61 8.69 9.15 9.93 10.81 11.21 10.84 10.09 10.5330 11.65 11.63 10.44 10.71 9.64 9.75 9.29 10.07 9.52 8.57 7.91 8.72 8.99 9.55 9.86 10.72 10.99 10.92 10.10 10.4040 11.35 11.59 10.41 10.13 9.51 9.54 9.18 9.70 9.31 8.86 8.23 9.26 9.40 10.06 10.23 10.51 10.91 11.05 10.07 10.3250 11.30 11.63 10.37 10.17 9.47 9.56 9.05 9.58 9.14 8.55 8.08 9.17 9.33 9.63 9.78 10.15 10.57 10.97 10.07 10.3660 11.04 11.67 10.31 10.03 9.34 9.32 8.86 9.24 8.86 8.41 7.90 8.84 8.84 9.13 9.67 9.44 9.26 9.54 8.80 10.3470 10.73 11.81 10.25 10.04 9.31 9.27 8.81 9.29 8.71 8.29 7.66 8.70 8.76 9.11 9.12 9.28 9.01 9.41 8.62 10.3880 10.04 11.58 10.22 9.85 9.25 8.90 8.75 9.03 8.49 8.10 7.51 8.28 8.43 8.92 9.08 9.13 8.65 8.96 8.10 10.2990 9.68 11.21 10.18 9.87 9.19 8.90 8.72 9.24 8.47 7.93 7.42 8.19 8.31 9.03 8.46 9.06 8.72 8.91 8.06 10.28100 9.25 10.56 10.15 9.64 9.17 8.78 8.73 8.80 8.31 7.70 7.33 7.93 8.03 8.53 8.22 8.59 8.37 8.68 7.81 10.31110 9.06 10.35 10.10 9.67 9.11 8.73 8.64 9.12 8.35 7.56 7.26 7.90 8.00 8.55 8.06 8.60 8.27 8.53 7.72 10.29120 8.71 9.83 10.06 9.43 9.04 8.61 8.66 8.84 8.07 7.46 7.18 7.86 7.95 8.40 7.92 8.27 7.91 8.45 7.67 10.29130 8.66 9.44 10.05 9.49 8.95 8.60 8.66 8.67 8.04 7.45 7.16 7.85 7.91 8.35 7.42 8.06 7.84 8.08 7.54 10.30140 8.59 9.34 10.10 8.83 8.84 8.36 8.66 8.62 7.50 7.42 7.16 7.80 7.79 7.43 7.48 7.72 7.62 7.81 7.15 10.25150 8.33 9.10 9.96 8.71 8.81 8.17 8.66 8.51 7.46 7.30 7.16 7.47 7.51 7.52 6.98 7.24 7.40 7.30 7.00 10.20Secchi depth(m) 14.5 12.8 11 10.5 10.8 12.5 11.5 14.2 17 11 17 12 19 15 17 16.5 17 14 13 1654 <strong>Lake</strong> <strong>Taupo</strong> Long-<strong>term</strong> Monitoring Programme 2010 - 2011
<strong>Lake</strong> <strong>Taupo</strong> Temperature, Dissolved Oxygen, and Secchi Depth Database. 2009-2010Mid-<strong>Lake</strong> site A for the period starting 6 July 2009TemperatureDate 6/07/2009 13/08/2009 7/09/2009 17/09/2009 19/10/2009 12/11/2009 17/12/2009 13/01/2010 2/02/2010 11/02/2010 18/02/2010 10/03/2010 8/04/2010 28/04/2010 20/05/2010 3/06/2010 23/06/2010 13/07/2010 10/08/2010Depth (m)0 10.93 10.43 10.56 11.63 11.72 13.00 16.99 17.89 19.23 20.60 20.45 20.08 17.36 16.38 15.09 14.11 12.23 11.31 11.0110 10.93 10.41 10.52 11.08 11.25 12.54 16.25 17.89 19.15 20.53 20.40 20.04 17.35 16.31 15.09 14.00 12.25 11.29 10.9620 10.92 10.41 10.51 10.71 11.24 12.43 15.85 17.56 17.60 18.34 18.73 19.69 17.35 16.30 15.09 13.99 12.23 11.29 10.9530 10.92 10.41 10.47 10.57 11.20 12.19 13.45 13.21 13.95 14.51 13.91 15.56 17.34 16.12 15.08 13.99 12.25 11.28 10.9540 10.91 10.38 10.47 10.50 10.98 11.77 12.54 11.65 11.92 12.03 12.02 12.23 12.28 12.72 12.41 11.71 12.21 11.28 10.9550 10.92 10.36 10.47 10.49 10.67 11.40 11.34 11.20 11.13 11.07 11.10 11.20 11.19 11.21 11.25 11.12 11.02 11.28 10.9560 10.92 10.36 10.46 10.48 10.58 10.97 10.86 11.02 10.86 10.88 10.86 10.84 10.82 10.85 10.88 10.90 10.84 11.26 10.9470 10.92 10.36 10.46 10.48 10.53 10.67 10.68 10.71 10.68 10.68 10.67 10.68 10.67 10.73 10.73 10.77 10.72 11.01 10.9480 10.91 10.35 10.46 10.47 10.50 10.56 10.57 10.59 10.59 10.62 10.63 10.62 10.62 10.65 10.66 10.69 10.69 10.96 10.9290 10.92 10.34 10.46 10.47 10.49 10.54 10.53 10.51 10.55 10.58 10.57 10.58 10.60 10.60 10.63 10.65 10.67 10.79 10.84100 10.92 10.34 10.46 10.46 10.47 10.50 10.49 10.51 10.52 10.55 10.53 10.56 10.57 10.59 10.60 10.63 10.65 10.75 10.81110 10.91 10.33 10.46 10.46 10.46 10.46 10.48 10.51 10.52 10.52 10.51 10.53 10.57 10.56 10.58 10.61 10.64 10.70 10.75120 10.91 10.33 10.44 10.45 10.44 10.44 10.46 10.49 10.50 10.51 10.51 10.52 10.55 10.55 10.57 10.59 10.64 10.68 10.73130 10.91 10.33 10.36 10.42 10.43 10.42 10.44 10.48 10.49 10.50 10.50 10.51 10.53 10.54 10.55 10.56 10.62 10.67 10.71140 10.90 10.33 10.35 10.38 10.41 10.40 10.44 10.47 10.49 10.50 10.50 10.51 10.53 10.54 10.55 10.56 10.61 10.66 10.71150 10.90 10.30 10.35 10.38 10.41 10.40 10.44 10.46 10.49 10.49 10.50 10.51 10.53 10.54 10.55 10.56 10.61 10.66 10.70Dissolved Oxygen (g m -3 )Depth (m)0 8.91 9.83 9.37 10.58 11.67 9.88 9.66 9.48 9.29 9.47 9.34 8.84 9.48 10.48 10.57 10.44 10.54 10.50 9.5010 9.88 10.72 10.29 11.08 12.13 10.80 9.63 9.18 9.26 9.40 9.32 8.28 10.17 10.17 11.29 10.25 10.86 11.42 11.2920 11.06 11.48 10.48 11.00 11.79 10.78 9.58 9.62 9.38 9.71 9.59 8.75 9.66 9.39 10.84 10.34 10.40 11.57 11.6030 11.31 11.57 10.49 10.68 11.78 10.84 9.71 9.34 9.17 9.65 9.45 8.92 9.43 9.09 10.63 10.39 10.38 11.65 11.6340 11.28 11.39 10.46 10.40 11.24 10.56 9.31 9.15 8.86 8.72 8.75 8.60 9.04 8.53 9.06 9.39 10.28 11.35 11.5950 11.29 11.39 10.36 10.31 11.10 10.47 9.29 8.78 8.36 8.21 8.44 8.14 8.57 8.13 8.68 9.26 9.46 11.30 11.6360 11.03 11.20 10.18 10.15 10.10 9.86 8.78 8.68 8.06 7.94 7.99 7.73 8.31 7.92 8.11 8.93 9.04 11.04 11.6770 11.05 11.16 10.21 10.12 10.02 9.86 8.60 8.31 7.88 7.76 7.97 7.59 8.11 7.84 8.08 8.84 8.82 10.73 11.8180 10.83 10.86 10.09 10.11 9.70 9.24 8.34 8.27 7.69 7.74 7.70 7.51 7.97 7.70 8.03 8.54 8.55 10.04 11.5890 10.87 10.97 10.16 10.02 9.72 9.26 8.25 7.97 7.47 7.55 7.68 7.38 7.74 7.56 7.70 8.44 8.37 9.68 11.21100 10.68 10.87 10.23 10.03 9.51 8.60 8.17 7.71 7.37 7.54 7.41 7.25 7.43 7.42 7.51 8.18 8.26 9.25 10.56110 10.72 10.90 10.30 9.95 9.50 8.60 8.05 7.50 7.23 7.37 7.43 7.22 7.27 7.27 7.39 8.10 8.09 9.06 10.35120 10.55 10.86 9.91 10.26 9.20 8.20 7.98 7.55 7.23 7.19 7.17 7.15 7.11 7.08 7.17 7.95 8.03 8.71 9.83130 10.55 10.71 9.80 10.00 9.18 8.15 7.87 7.37 7.18 7.20 7.12 6.98 7.09 7.05 7.11 7.90 8.00 8.66 9.44140 10.48 10.80 9.52 9.69 8.82 7.70 7.62 7.42 6.90 6.95 6.71 6.57 6.82 6.77 6.79 7.18 7.85 8.59 9.34150 10.30 10.77 9.46 9.47 8.79 7.72 7.41 7.25 6.88 6.93 6.65 6.46 6.75 6.75 6.73 7.17 7.84 8.33 9.10Secchi depth(m) 15 12 15 * 13 12.5 15 14.5 16 * 17 19 21.5 19 19.5 14.5 14 14.5 12.8<strong>Lake</strong> <strong>Taupo</strong> Long-<strong>term</strong> Monitoring Programme 2010 - 2011 55
<strong>Lake</strong> <strong>Taupo</strong> Temperature, Dissolved Oxygen, and Secchi Depth Database. 2008-2009Mid-<strong>Lake</strong> site A for the period starting 11 September 2007TemperatureDate 4/09/2008 16/09/2008 14/10/2008 4/11/2008 26/11/2008 22/12/2008 13/01/2009 22/01/2009 28/01/2009 11/02/2009 25/02/2009 16/03/2009 26/03/2009 15/04/2009 7/05/2009 27/05/2009 18/06/2009 6/07/2009 13/08/2009Depth (m)0 10.97 11.34 12.59 13.37 15.45 18.84 19.67 19.84 20.88 21.42 20.46 18.71 17.96 16.60 15.05 12.97 11.60 10.93 10.4310 10.92 11.14 12.09 12.94 15.26 17.50 19.55 19.23 20.17 21.21 20.39 18.29 17.95 16.59 15.04 12.96 11.61 10.93 10.4120 10.85 10.99 11.93 12.62 15.17 15.77 16.97 19.12 18.45 20.04 20.37 18.25 17.94 16.59 15.04 12.96 11.61 10.92 10.4130 10.82 10.93 11.85 12.55 12.87 13.32 13.60 13.90 13.21 13.92 14.47 16.68 13.86 16.58 15.04 12.90 11.61 10.92 10.4140 10.79 10.91 11.75 12.35 12.07 12.27 12.19 12.11 11.90 12.09 12.84 12.43 12.13 12.53 12.55 12.62 11.60 10.91 10.3850 10.75 10.88 11.59 11.51 11.44 11.39 11.33 11.52 11.31 11.50 11.62 11.56 11.45 11.56 11.64 11.50 11.60 10.92 10.3660 10.72 10.79 10.90 10.83 10.93 11.06 11.08 11.04 11.05 11.19 11.18 11.22 11.19 11.12 11.17 11.06 11.60 10.92 10.3670 10.69 10.69 10.76 10.79 10.78 10.88 10.89 10.90 10.89 10.97 10.92 10.98 10.98 10.98 11.01 10.94 11.60 10.92 10.3680 10.66 10.68 10.71 10.72 10.76 10.81 10.82 10.87 10.84 10.86 10.87 10.88 10.89 10.92 10.93 10.90 11.59 10.91 10.3590 10.66 10.66 10.69 10.70 10.77 10.78 10.78 10.81 10.80 10.81 10.82 10.83 10.84 10.88 10.89 10.88 11.41 10.92 10.34100 10.65 10.65 10.68 10.68 10.82 10.75 10.76 10.80 10.78 10.77 10.79 10.81 10.81 10.86 10.86 10.86 11.09 10.92 10.34110 10.64 10.64 10.66 10.67 10.78 10.73 10.75 10.78 10.74 10.76 10.77 10.80 10.79 10.84 10.86 10.85 11.00 10.91 10.33120 10.63 10.64 10.64 10.65 10.78 10.71 10.73 10.77 10.74 10.75 10.76 10.79 10.78 10.82 10.84 10.84 10.98 10.91 10.33130 10.63 10.63 10.60 10.63 10.79 10.70 10.72 10.74 10.73 10.73 10.75 10.77 10.77 10.79 10.82 10.82 10.95 10.91 10.33140 10.63 10.62 10.59 10.63 10.81 10.70 10.72 10.73 10.72 10.73 10.74 10.77 10.76 10.78 10.80 10.81 10.94 10.90 10.33150 10.62 10.62 10.59 10.63 10.80 10.70 10.71 10.74 10.72 10.73 10.74 10.76 10.76 10.78 10.80 10.81 10.89 10.90 10.30Dissolved Oxygen (g m -3 )Depth (m)0 10.03 9.84 10.29 * 10.09 9.29 8.67 9.24 8.52 8.48 * 9.26 9.44 9.33 10.05 10.13 10.47 8.91 9.8310 10.85 10.65 10.29 * 10.08 9.72 9.21 8.89 8.45 8.34 * 9.16 10.06 10.11 10.15 10.25 10.73 9.88 10.7220 10.90 11.05 10.50 * 10.00 9.39 8.88 8.68 8.47 8.19 * 9.40 10.55 10.76 10.15 10.13 10.59 11.06 11.4830 11.12 10.91 10.46 * 9.79 9.81 9.02 8.53 8.54 8.20 * 9.12 10.34 10.83 10.15 10.17 10.57 11.31 11.5740 10.76 10.82 10.34 * 9.23 9.69 8.96 8.46 8.06 8.36 * 8.24 9.86 10.39 9.15 9.78 10.56 11.28 11.3950 10.88 10.63 10.05 * 9.10 9.05 8.49 8.06 7.98 7.92 * 7.97 9.25 9.58 8.91 9.47 10.49 11.29 11.3960 10.74 10.55 9.89 * 8.54 8.77 8.25 7.91 7.81 7.80 * 7.62 8.97 9.06 8.67 8.73 10.40 11.03 11.2070 10.52 10.25 9.86 * 8.60 8.53 8.10 7.64 7.74 7.71 * 7.55 8.94 8.84 8.51 8.60 10.43 11.05 11.1680 10.48 10.20 9.81 * 8.43 8.47 7.98 7.46 7.66 7.64 * 7.44 8.54 8.21 7.79 8.25 10.43 10.83 10.8690 10.34 10.13 9.85 * 8.44 8.21 7.92 7.38 7.56 7.60 * 7.37 8.45 8.24 7.79 8.24 10.25 10.87 10.97100 10.28 10.10 10.03 * 8.20 8.22 7.78 7.25 7.53 7.44 * 7.26 8.24 8.07 7.65 8.10 8.65 10.68 10.87110 9.79 10.00 10.13 * 8.31 7.99 7.67 7.22 7.47 7.31 * 7.20 8.26 8.12 7.62 8.06 8.53 10.72 10.90120 9.62 9.97 10.09 * 8.04 7.91 7.63 7.17 7.32 7.26 * 7.01 7.94 8.02 7.63 7.79 8.17 10.55 10.86130 9.42 9.75 9.83 * 8.09 7.70 7.48 7.21 7.24 7.04 * 7.03 7.93 8.15 7.59 7.83 8.11 10.55 10.71140 9.37 9.52 9.76 * 7.88 7.59 7.40 7.24 7.08 6.92 * 6.68 7.08 8.01 7.74 7.49 7.99 10.48 10.80150 9.17 9.24 9.85 * 7.85 7.48 7.25 7.03 6.90 6.72 * 6.59 6.91 7.55 7.35 7.30 7.97 10.30 10.77Secchi depth(m) 13.0 14.5 12.2 12.0 10.0 12.0 13.0 14.8 18.0 22.0 20.0 15.6 18.5 18.0 16.0 15.0 16.0 15.0 12.056 <strong>Lake</strong> <strong>Taupo</strong> Long-<strong>term</strong> Monitoring Programme 2010 - 2011
<strong>Lake</strong> <strong>Taupo</strong> Temperature, Dissolved Oxygen, and Secchi Depth Database. 2007-2008Mid-<strong>Lake</strong> site A for the period starting 11 September 2007TemperatureDate 11/9/2007 9/10/2007 30/10/2007 15/11/2007 4/12/2007 20/12/2007 17/01/2008 31/01/2008 14/02/2008 27/02/2008 13/03/2008 26/03/2008 17/04/2008 7/05/2008 22/05/2008 5/06/2008 19/06/2008 1/07/2008 15/07/2008 7/08/2008 20/08/2008Depth (m)0 11.00 12.33 12.84 13.47 16.64 17.38 21.23 19.79 19.87 19.28 18.83 19.26 17.88 15.67 14.65 13.60 12.89 11.97 11.42 11.06 10.7010 10.99 11.69 11.83 13.19 16.20 17.15 19.96 19.62 19.81 19.26 18.75 19.24 17.87 15.67 14.65 13.60 12.90 12.03 11.41 10.98 10.7020 10.98 11.67 11.76 12.92 14.48 14.76 17.21 17.59 19.65 19.24 18.75 18.92 17.85 15.67 14.65 13.59 12.90 12.03 11.40 10.98 10.6930 10.99 11.44 11.70 12.86 12.58 13.19 13.64 13.82 16.07 14.08 16.20 16.92 15.58 15.67 14.65 13.60 12.90 12.01 11.40 10.98 10.6940 10.99 11.42 11.64 12.78 12.02 12.18 12.26 12.31 12.63 12.24 12.54 12.44 12.38 15.27 12.27 13.60 12.90 12.03 11.40 10.98 10.6950 10.99 11.39 11.51 11.80 11.69 11.75 11.64 11.61 11.80 11.71 11.76 11.77 11.72 12.11 11.66 11.93 12.86 12.03 11.39 10.99 10.7060 10.99 11.34 11.43 11.49 11.42 11.53 11.41 11.39 11.47 11.44 11.47 11.48 11.48 11.56 11.44 11.54 11.60 12.03 11.39 10.98 10.7070 10.99 11.16 11.32 11.37 11.29 11.33 11.23 11.26 11.33 11.30 11.34 11.29 11.34 11.37 11.32 11.37 11.36 11.61 11.38 10.98 10.7080 10.96 11.00 11.23 11.31 11.25 11.23 11.22 11.17 11.25 11.25 11.24 11.23 11.27 11.29 11.27 11.29 11.27 11.39 11.38 10.98 10.7090 10.96 10.98 11.16 11.17 11.14 11.12 11.12 11.11 11.19 11.18 11.18 11.17 11.20 11.21 11.22 11.24 11.23 11.29 11.35 10.98 10.70100 10.96 10.98 11.07 11.10 11.10 11.09 11.12 11.09 11.15 11.14 11.14 11.14 11.17 11.16 11.18 11.21 11.21 11.28 11.30 10.98 10.70110 10.96 10.97 11.04 11.04 11.07 11.04 11.06 11.08 11.11 11.11 11.11 11.12 11.14 11.16 11.16 11.19 11.19 11.28 11.25 10.98 10.70120 10.96 10.96 11.02 11.02 11.05 11.03 11.04 11.06 11.07 11.09 11.09 11.11 11.15 11.15 11.15 11.16 11.17 11.25 11.22 10.98 10.70130 10.96 10.96 11.00 11.00 11.02 11.00 11.02 11.05 11.06 11.07 11.07 11.09 11.12 11.12 11.13 11.15 11.15 11.22 11.20 10.98 10.70140 10.96 10.96 10.98 10.97 10.99 11.01 11.00 11.05 11.05 11.06 11.06 11.08 11.11 11.11 11.12 11.13 11.15 11.17 11.19 10.98 10.70150 10.96 10.95 10.96 10.95 10.98 10.99 11.00 11.04 11.04 11.05 11.06 11.08 11.11 11.10 11.12 11.13 11.15 11.16 11.19 10.98 10.70Dissolved Oxygen (g m -3 )Depth (m)0 11.00 10.23 10.18 10.03 9.35 9.21 8.61 * 10.77 9.20 9.38 9.87 9.49 9.91 10.13 10.36 10.53 10.75 10.89 10.21 9.5510 11.12 10.37 10.27 10.11 9.45 9.24 8.63 * 8.76 9.09 9.05 8.61 8.97 9.04 9.37 9.84 10.26 10.63 10.66 11.03 10.8020 10.87 10.12 10.25 10.07 9.23 9.21 8.70 * 9.00 9.32 9.24 8.85 8.46 8.97 9.18 9.72 10.14 10.32 10.51 11.04 11.1630 10.99 10.17 10.07 10.17 9.36 9.37 8.93 * 9.35 9.45 9.01 8.73 8.52 8.86 9.16 9.63 10.10 10.37 10.48 10.94 11.1140 10.84 9.92 10.02 9.97 9.09 9.09 8.69 * 9.01 8.92 8.96 8.57 8.72 8.87 8.68 9.81 10.12 10.40 10.42 10.72 11.0850 10.92 10.09 9.85 9.66 9.08 9.21 8.67 * 8.64 8.82 8.60 8.51 8.48 8.45 8.56 9.22 10.10 10.31 10.52 10.83 11.0760 11.07 9.96 9.52 9.75 9.14 8.69 8.60 8.70 8.44 8.49 8.34 8.15 8.20 8.25 8.58 8.96 9.51 10.36 10.45 10.60 11.0570 10.89 9.90 9.77 9.30 8.74 8.69 8.26 8.22 8.19 8.15 8.02 7.79 7.84 7.89 8.37 8.65 9.07 10.28 10.39 10.76 10.9880 10.90 9.59 9.58 9.12 8.76 8.38 8.03 8.05 8.16 7.88 7.92 7.52 7.71 7.90 8.30 8.53 8.91 9.60 10.34 10.74 10.9690 10.66 9.63 9.42 9.07 8.62 8.46 8.10 8.06 7.99 7.87 7.76 7.47 7.57 7.68 8.22 8.45 8.72 9.18 10.23 10.73 10.91100 10.64 9.58 9.49 9.14 8.46 8.41 7.90 7.90 7.97 7.86 7.69 7.45 7.45 7.46 8.14 8.44 8.66 9.06 9.93 10.72 10.90110 10.62 9.57 9.16 8.83 8.37 8.46 7.83 7.87 7.81 7.64 7.50 7.20 7.29 7.38 8.03 8.19 8.43 8.72 9.34 10.68 10.84120 10.66 9.52 9.27 8.95 8.42 8.08 7.95 7.52 7.82 7.39 7.45 7.20 7.29 7.38 7.94 8.16 8.32 8.55 8.94 10.67 10.83130 10.42 9.35 9.01 8.81 8.31 8.13 7.72 7.40 7.59 7.41 7.27 7.16 7.18 7.19 7.86 7.86 8.14 8.31 8.79 10.63 10.57140 10.40 9.30 9.11 8.81 8.28 7.88 7.74 7.27 7.62 7.05 7.10 7.10 7.13 7.17 7.81 7.61 8.01 8.25 8.48 10.62 10.38150 10.37 9.13 8.91 8.45 7.95 7.95 7.33 7.35 7.27 7.00 6.76 6.59 6.72 6.85 7.40 7.50 7.73 8.08 8.48 10.57 9.67Secchi depth(m) 11 15 16 14 15 17.5 22.5 21.5 25 22 22 19 20.5 16 17 15 16.5 14 13 12.5 12.5<strong>Lake</strong> <strong>Taupo</strong> Long-<strong>term</strong> Monitoring Programme 2010 - 2011 57
<strong>Lake</strong> <strong>Taupo</strong> Temperature, Dissolved Oxygen, and Secchi Depth Database. 2006-2007Mid-<strong>Lake</strong> site A for the period starting 4 September 2006TemperatureDate 4/09/2006 26/09/2006 18/10/2006 1/11/2006 5/12/2006 19/12/2006 9/01/2007 25/01/2007 8/02/2007 21/02/2007 21/03/2007 3/04/2007 19/04/2007 8/05/2007 22/05/2007 14/06/2007 27/06/2007 18/07/2007 8/08/2007 23/08/2007 11/09/2007Depth (m)0 11.10 11.88 11.72 12.43 15.21 15.62 16.51 18.60 19.31 19.58 18.70 18.04 16.49 19.29 15.17 13.56 12.38 11.43 11.15 11.00 11.0010 10.93 11.48 11.73 12.27 14.06 15.46 16.41 18.42 18.98 19.12 18.03 18.03 16.48 18.98 15.16 13.56 12.39 11.43 11.15 11.00 10.9920 10.93 11.29 11.72 12.25 13.87 14.45 15.44 17.96 18.16 17.62 17.99 17.94 16.47 18.16 15.16 13.56 12.39 11.43 11.16 11.00 10.9830 10.89 11.19 11.69 12.20 13.69 14.15 14.42 15.82 14.86 15.17 15.18 16.72 16.47 14.86 15.16 13.56 12.39 11.36 11.15 11.00 10.9940 10.87 11.15 11.45 12.10 13.16 12.43 12.25 13.05 12.89 13.09 12.65 13.50 13.78 12.89 15.15 13.56 12.39 11.29 11.16 11.00 10.9950 10.83 11.08 11.34 11.96 11.77 11.64 11.74 11.84 11.89 11.91 11.94 12.33 12.47 11.89 11.99 13.55 12.39 11.27 11.16 11.00 10.9960 10.82 11.06 11.25 11.34 11.20 11.36 11.29 11.47 11.39 11.46 11.51 11.65 11.69 11.39 11.54 11.77 12.38 11.25 11.15 11.00 10.9970 10.82 11.00 11.21 11.17 11.11 11.21 11.15 11.26 11.21 11.21 11.22 11.28 11.33 11.21 11.33 11.35 11.39 11.22 11.16 11.01 10.9980 10.82 10.94 11.16 11.06 11.06 11.10 11.09 11.14 11.15 11.15 11.16 11.22 11.20 11.15 11.21 11.22 11.28 11.17 11.16 11.01 10.9690 10.81 10.90 11.08 10.99 10.97 11.03 11.03 11.04 11.06 11.05 11.09 11.11 11.13 11.06 11.12 11.11 11.22 11.14 11.16 11.01 10.96100 10.81 10.87 10.97 10.94 10.94 11.00 11.00 11.00 11.03 11.05 11.05 11.10 11.09 11.03 11.10 11.10 11.16 11.13 11.16 11.01 10.96110 10.81 10.84 10.89 10.91 10.91 10.96 10.98 10.98 11.01 11.02 11.03 11.04 11.05 11.01 11.07 11.09 11.12 11.12 11.16 11.01 10.96120 10.80 10.81 10.86 10.88 10.90 10.94 10.97 10.99 11.06 11.02 11.02 11.04 11.04 11.06 11.07 11.08 11.11 11.12 11.16 11.01 10.96130 10.79 10.79 10.85 10.85 10.88 10.92 10.95 10.97 10.99 10.99 11.01 11.01 11.03 10.99 11.03 11.07 11.08 11.11 11.16 11.01 10.96140 10.76 10.78 10.83 10.84 10.88 10.89 10.94 10.97 10.97 10.98 10.99 11.00 11.02 10.97 11.03 11.05 11.07 11.10 11.16 11.01 10.96150 10.75 10.76 10.82 10.85 10.88 10.91 10.93 10.99 10.96 11.02 11.04 11.03 11.02 11.00 11.04 11.05 11.07 11.10 11.16 11.01 10.96Dissolved Oxygen (g m -3 )Depth (m)0 10.52 10.31 10.36 10.23 9.62 9.52 9.35 8.99 8.95 9.16 9.31 9.44 9.74 9.20 10.01 10.01 10.26 10.36 10.96 11.02 11.0010 10.47 10.28 10.31 10.16 9.69 9.52 9.52 8.95 8.96 9.26 9.27 9.51 9.73 9.29 10.06 9.95 10.37 10.43 11.08 11.05 11.1220 10.33 10.25 10.23 10.14 9.56 9.43 9.64 8.95 8.77 9.22 9.27 9.45 9.84 9.08 10.12 9.83 10.48 10.56 11.05 11.15 10.8730 10.23 10.22 10.27 10.07 9.48 9.50 9.49 8.61 8.78 9.21 8.52 9.30 9.75 9.09 10.06 9.74 10.25 10.27 10.89 11.01 10.9940 10.13 10.10 10.14 10.08 9.38 9.39 9.47 8.84 8.95 9.08 8.94 8.86 9.26 9.28 9.87 9.71 10.17 10.11 10.89 10.92 10.8450 10.00 9.96 9.99 10.03 9.05 9.28 9.33 8.66 8.68 8.71 8.77 8.87 9.11 9.00 9.39 9.70 10.12 9.88 10.67 10.90 10.9260 9.91 10.06 9.93 9.73 9.15 8.97 9.15 8.61 8.62 8.63 8.72 8.76 9.00 8.93 8.83 9.28 10.23 9.84 10.67 10.84 11.0770 9.82 9.95 9.83 9.54 8.79 8.89 9.02 8.53 8.48 8.57 8.76 8.82 8.96 8.78 8.90 8.45 9.67 9.60 10.67 10.68 10.8980 9.88 9.83 9.82 9.51 8.66 8.85 8.85 8.34 8.47 8.41 8.62 8.49 8.89 8.78 8.62 8.42 9.34 9.39 10.78 10.88 10.9090 9.78 9.71 9.71 9.33 8.69 8.67 8.75 8.29 8.29 8.40 8.54 8.53 8.70 8.59 8.66 7.89 8.47 8.36 10.67 10.73 10.66100 9.82 9.69 9.65 9.30 8.49 8.46 8.65 7.99 8.21 8.01 8.36 8.23 8.58 8.51 8.13 7.66 8.56 8.20 10.79 10.67 10.64110 9.73 9.62 9.47 9.21 8.40 8.38 8.38 8.02 8.04 7.95 8.22 8.24 8.41 8.33 8.20 7.74 8.40 7.87 10.66 10.70 10.62120 9.79 9.38 9.37 9.08 8.34 8.33 8.38 7.88 7.84 7.72 8.02 8.01 8.24 8.12 7.74 7.69 8.30 7.92 10.61 10.76 10.66130 9.65 9.35 9.29 9.00 8.24 8.26 8.27 7.81 7.91 7.71 7.58 8.09 8.01 8.19 7.74 7.54 7.95 7.75 10.52 10.55 10.42140 9.61 9.38 9.10 8.94 8.22 8.21 8.14 7.75 7.86 7.61 7.58 7.72 7.66 8.15 7.34 7.35 7.94 7.74 10.50 10.75 10.40150 9.65 9.13 9.02 8.69 7.96 7.82 7.89 7.45 7.25 7.35 7.25 7.25 7.32 7.50 7.18 7.39 7.58 7.55 10.46 10.54 10.37Secchi depth(m) 11 17.5 13 14.5 16 15.5 13.5 14.5 16 18.2 16.5 19 16 16 18.5 18 18.5 14.5 14 13 1158 <strong>Lake</strong> <strong>Taupo</strong> Long-<strong>term</strong> Monitoring Programme 2010 - 2011
<strong>Lake</strong> <strong>Taupo</strong> Temperature, Dissolved Oxygen, and Secchi Depth Database. 2005-2006Mid-<strong>Lake</strong> site A for the period starting 17 August 2005TemperatureDate 17/08/2005 31/08/2005 14/09/2005 29/09/2005 12/10/2005 25/10/2005 10/11/2005 1/12/2005 10/01/2006 2/02/2006 1/03/2006 12/04/2006 27/04/2006 9/05/2006 30/05/2006 27/06/2006 11/07/2006 25/07/2006 4/09/2006Depth (m)0 11.17 11.74 12.42 11.91 11.92 13.40 16.10 15.09 17.40 20.20 19.50 16.71 16.31 15.70 14.21 11.94 11.51 11.15 11.1010 10.98 11.24 11.76 11.68 11.79 12.84 14.59 14.93 17.10 20.11 19.50 16.72 16.29 15.70 14.21 11.99 11.51 11.15 10.9320 10.97 11.10 11.22 11.67 11.76 12.17 14.27 14.22 16.85 18.15 19.25 16.72 16.29 15.70 14.21 11.99 11.50 11.15 10.9330 10.97 11.05 11.05 11.66 11.66 11.63 12.36 13.34 14.84 15.46 16.14 16.71 16.29 15.70 14.21 11.99 11.48 11.15 10.8940 10.97 11.00 11.01 11.60 11.47 11.47 11.66 12.32 12.21 13.40 12.93 16.48 13.96 13.40 14.20 11.99 11.48 11.15 10.8750 10.97 10.98 10.98 11.18 11.39 11.29 11.27 11.66 11.60 11.75 11.57 12.00 12.20 11.94 14.16 11.99 11.48 11.15 10.8360 10.97 10.97 10.99 11.02 11.37 11.17 11.15 11.26 11.21 11.35 11.35 11.53 11.56 11.36 11.54 11.39 11.47 11.15 10.8270 10.96 10.97 10.97 10.97 11.26 11.06 11.04 11.11 11.13 11.19 11.16 11.29 11.30 11.23 11.27 11.21 11.46 11.15 10.8280 10.97 10.96 10.97 10.97 11.13 10.99 11.00 11.06 11.06 11.11 11.14 11.19 11.19 11.14 11.19 11.16 11.45 11.15 10.8290 10.96 10.96 10.96 10.96 11.07 10.97 10.98 11.01 11.05 11.06 11.06 11.12 11.12 11.10 11.16 11.15 11.42 11.15 10.81100 10.96 10.95 10.96 10.95 11.01 10.97 10.97 10.98 11.04 11.04 11.05 11.08 11.08 11.09 11.12 11.14 11.23 11.15 10.81110 10.96 10.94 10.94 10.94 10.98 10.94 10.95 10.97 11.02 11.02 11.05 11.05 11.07 11.06 11.11 11.14 11.20 11.15 10.81120 10.96 10.94 10.93 10.93 10.98 10.94 10.94 10.97 11.00 11.02 11.05 11.03 11.06 11.06 11.09 11.13 11.19 11.15 10.80130 10.96 10.93 10.93 10.92 10.96 10.93 10.93 10.96 10.99 11.00 11.03 11.02 11.05 11.04 11.07 11.13 11.18 11.15 10.79140 10.95 10.93 10.91 10.91 10.96 10.93 10.94 10.96 10.99 11.00 11.00 11.02 11.04 11.03 11.07 11.12 11.18 11.15 10.76150 10.93 10.93 10.89 10.91 10.96 10.92 10.96 10.97 10.98 10.99 11.00 11.02 11.04 11.04 11.07 11.10 11.14 11.15 10.75Dissolved Oxygen (g m -3 )Depth (m)0 10.52 10.47 10.26 10.35 10.38 10.04 9.95 9.70 9.23 9.00 9.20 9.33 9.39 9.46 9.97 10.29 10.84 10.54 10.5210 10.55 10.47 10.26 10.47 10.49 9.98 9.99 9.94 9.38 9.39 9.24 9.15 9.96 9.59 10.49 10.27 10.88 10.94 10.4720 10.41 10.26 10.37 10.39 10.40 10.04 9.88 9.69 9.37 9.20 9.43 9.51 9.39 9.47 9.97 10.30 10.77 10.59 10.3330 10.39 10.28 10.19 10.39 10.44 9.89 9.74 9.26 8.96 8.94 8.99 9.23 9.31 9.50 10.21 10.22 10.76 10.54 10.2340 10.31 9.80 9.40 10.32 10.25 9.61 9.48 9.74 8.95 8.69 9.02 8.92 8.82 8.90 9.98 10.22 10.74 10.34 10.1350 10.29 9.66 9.39 10.20 10.23 9.51 9.36 9.63 8.61 8.59 8.91 8.61 8.70 8.51 10.10 10.16 10.71 10.54 10.0060 10.17 9.57 9.18 9.83 9.92 9.14 8.65 9.08 8.69 8.22 8.78 8.49 8.31 8.29 9.25 9.64 10.70 10.38 9.9170 10.13 9.41 9.26 9.63 9.86 9.03 8.83 8.80 8.50 8.20 8.52 8.20 8.51 8.26 8.87 8.85 10.64 10.45 9.8280 10.06 9.38 9.01 9.46 9.63 8.76 8.50 8.78 8.21 8.04 8.19 7.94 8.17 8.19 8.47 8.42 10.47 10.36 9.8890 10.05 9.42 9.07 9.38 9.68 8.76 8.59 8.40 8.12 8.07 7.82 7.98 8.10 8.08 8.33 8.15 10.46 10.44 9.78100 10.04 9.41 8.86 9.20 9.33 8.54 8.35 8.39 7.96 7.88 7.89 8.05 8.12 8.06 8.16 8.05 9.65 10.34 9.82110 10.04 9.37 8.88 9.12 9.24 8.49 8.41 8.35 7.92 7.94 7.85 7.91 7.84 7.96 8.11 7.96 8.87 10.35 9.73120 9.96 9.23 8.56 9.03 9.13 8.44 8.22 8.28 7.89 7.62 7.86 7.44 7.57 7.77 8.04 7.89 8.41 10.17 9.79130 9.93 9.14 8.56 8.96 9.07 8.40 8.27 8.20 7.82 7.78 7.72 7.58 7.49 7.66 8.04 7.84 8.31 10.33 9.65140 9.32 8.94 8.38 8.79 9.01 8.38 7.92 8.08 7.62 7.36 7.67 7.34 7.32 7.58 7.99 7.82 8.29 10.39 9.61150 8.63 8.57 8.20 8.56 8.94 8.24 7.86 8.00 7.39 7.28 7.34 7.19 7.15 7.23 7.57 7.61 8.14 10.28 9.65Secchi depth(m) 13 13 13 14 14 15 17.5 19.3 19 15.5 15.3 15.8 17 17.5 18.2 15.2 13.5 12 11<strong>Lake</strong> <strong>Taupo</strong> Long-<strong>term</strong> Monitoring Programme 2010 - 2011 59
<strong>Lake</strong> <strong>Taupo</strong> Temperature, Dissolved Oxygen, and Secchi Depth Database. 2004-2005Mid-<strong>Lake</strong> site A for the period starting 24 August 2004TemperatureDate 24/08/2004 7/09/2004 21/10/2004 2/11/2004 22/11/2004 15/12/2004 11/01/2005 25/01/2005 9/02/2005 22/02/2005 10/03/2005 21/03/2005 14/04/2005 18/05/2005 9/06/2005 20/06/2005 20/07/2005 3/08/2005 17/08/2005 31/08/2005 14/09/2005Depth (m)0 10.92 10.70 11.75 12.94 15.31 14.17 16.97 19.27 20.73 20.05 19.25 19.34 17.92 14.33 12.98 12.67 11.46 11.12 11.17 11.74 12.4210 10.83 10.66 11.61 12.89 15.15 14.10 16.01 18.05 20.19 19.73 19.24 19.17 17.96 14.31 12.99 12.47 11.31 11.11 10.98 11.24 11.7620 10.83 10.66 11.60 12.49 13.69 13.89 15.83 16.72 18.05 18.80 19.23 18.81 17.95 14.24 12.98 12.43 11.31 11.10 10.97 11.10 11.2230 10.83 10.66 11.59 11.65 13.17 13.79 13.37 14.55 14.65 14.02 14.92 14.59 15.13 14.13 12.98 12.42 11.30 11.11 10.97 11.05 11.0540 10.83 10.66 11.59 11.28 11.61 13.59 12.39 13.12 12.83 12.36 13.06 12.62 12.92 13.88 12.98 12.44 11.30 11.10 10.97 11.00 11.0150 10.83 10.65 11.58 10.93 11.09 11.35 11.33 11.89 11.75 11.49 11.75 11.64 12.00 11.47 12.97 12.42 11.28 11.11 10.97 10.98 10.9860 10.83 10.66 11.15 10.75 10.97 11.03 11.04 11.23 11.12 11.00 11.16 11.20 11.33 11.18 12.57 11.54 11.28 11.10 10.97 10.97 10.9970 10.83 10.66 10.78 10.72 10.77 10.88 10.86 10.98 10.90 10.87 10.92 10.96 10.99 10.97 11.13 11.07 11.26 11.11 10.96 10.97 10.9780 10.83 10.65 10.74 10.64 10.73 10.80 10.81 10.91 10.83 10.82 10.88 10.94 10.88 10.93 10.98 11.00 11.21 11.10 10.97 10.96 10.9790 10.82 10.61 10.72 10.62 10.69 10.73 10.75 10.80 10.75 10.80 10.80 10.81 10.82 10.89 10.95 10.93 10.98 11.10 10.96 10.96 10.96100 10.83 10.58 10.71 10.61 10.68 10.70 10.74 10.81 10.80 10.78 10.80 10.82 10.78 10.90 10.90 10.91 10.94 11.10 10.96 10.95 10.96110 10.83 10.56 10.67 10.60 10.64 10.67 10.69 10.72 10.73 10.75 10.74 10.76 10.76 10.87 10.89 10.87 10.93 11.08 10.96 10.94 10.94120 10.83 10.56 10.66 10.58 10.64 10.66 10.68 10.73 10.76 10.76 10.76 10.79 10.76 10.88 10.87 10.86 10.89 10.99 10.96 10.94 10.93130 10.82 10.55 10.64 10.57 10.61 10.63 10.66 10.69 10.71 10.71 10.72 10.73 10.74 10.81 10.84 10.86 10.88 10.97 10.96 10.93 10.93140 10.82 10.53 10.61 10.57 10.61 10.61 10.65 10.68 10.74 10.73 10.75 10.77 10.74 10.82 10.80 10.86 10.88 10.93 10.95 10.93 10.91150 10.79 10.47 10.56 10.58 10.60 10.62 10.67 10.67 10.70 10.70 10.71 10.72 10.72 10.77 10.78 10.85 10.87 10.90 10.93 10.93 10.89Dissolved Oxygen (g m -3 )Depth (m)0 10.7 10.7 10.4 10.1 9.5 9.9 9.4 8.95 8.64 8.74 8.77 8.89 9.12 9.75 10.12 10.15 10.7 10.7 10.52 10.47 10.2610 10.5 10.5 10.1 10.2 9.6 9.8 9.5 8.87 8.75 8.78 8.77 8.87 9.01 9.75 10.03 10.12 10.5 10.5 10.55 10.47 10.2620 10.5 10.5 10.3 10.0 9.5 9.8 9.5 8.79 8.73 8.59 8.72 8.85 9.04 9.66 9.97 10.17 10.5 10.5 10.41 10.26 10.3730 10.4 10.4 10.1 9.9 9.5 9.7 9.2 8.72 8.68 8.62 8.01 8.34 8.37 9.55 9.97 10.03 10.4 10.4 10.39 10.28 10.1940 10.4 10.3 10.2 9.9 9.5 9.7 9.2 8.80 8.76 8.68 8.48 8.39 8.66 9.49 9.88 9.99 10.4 10.3 10.31 9.80 9.4050 10.3 10.3 10.0 9.6 9.4 9.3 9.0 8.54 8.45 8.36 8.16 8.17 8.34 9.01 9.87 9.93 10.3 10.3 10.29 9.66 9.3960 10.3 10.2 9.9 9.5 9.1 9.4 8.9 8.50 8.41 8.37 8.14 8.22 8.21 8.66 9.69 9.05 10.3 10.2 10.17 9.57 9.1870 10.2 10.2 9.7 9.3 9.1 9.3 8.8 8.40 8.36 8.32 8.04 8.18 8.21 8.56 8.90 8.72 10.2 10.2 10.13 9.41 9.2680 10.2 10.1 9.6 9.2 9.0 9.2 8.7 8.29 8.24 8.27 8.04 8.13 8.19 8.22 8.70 8.33 10.2 10.1 10.06 9.38 9.0190 10.1 10.0 9.4 9.1 8.8 9.1 8.6 8.18 8.12 8.13 8.03 8.11 8.27 8.07 8.39 8.23 10.1 10.0 10.05 9.42 9.07100 10.1 10.0 9.4 9.0 8.8 9.0 8.5 8.13 7.86 7.93 7.89 7.90 7.99 7.90 8.27 8.06 10.1 10.0 10.04 9.41 8.86110 9.9 9.9 9.3 9.0 8.8 8.9 8.4 8.07 7.84 7.81 7.82 7.83 7.82 7.75 8.16 7.99 9.9 9.9 10.04 9.37 8.88120 10.0 9.9 9.3 8.9 8.6 8.8 8.4 8.02 7.78 7.71 7.73 7.81 7.66 7.78 8.08 7.70 10.0 9.9 9.96 9.23 8.56130 10.0 9.9 9.3 8.7 8.6 8.7 8.3 8.00 7.76 7.71 7.68 7.78 7.69 7.77 8.03 7.57 10.0 9.9 9.93 9.14 8.56140 9.9 9.9 9.2 8.7 8.4 8.5 8.1 7.83 7.59 7.50 7.36 7.48 7.56 7.69 7.94 7.42 9.9 9.9 9.32 8.94 8.38150 9.8 9.7 9.0 8.6 8.2 8.3 7.9 7.51 7.54 7.46 7.35 7.43 7.47 7.67 7.75 7.36 9.8 9.7 8.63 8.57 8.20Secchi depth(m) 12.5 12 15 16 16 19.5 20 19.5 18 21.5 18.5 20 17.2 16 14.1 13.8 13 14 13 13 1360 <strong>Lake</strong> <strong>Taupo</strong> Long-<strong>term</strong> Monitoring Programme 2010 - 2011
<strong>Lake</strong> <strong>Taupo</strong> Temperature, Dissolved Oxygen, and Secchi Depth Database. 2003-2004Mid-<strong>Lake</strong> site A for the period starting 14 July 2003TemperatureDate 14/07/2003 31/07/2003 14/08/2003 26/08/2003 8/09/2003 7/10/2003 21/10/2003 19/11/2003 4/12/2003 18/12/2003 13/01/2004 26/02/2004 8/03/2004 31/03/2004 14/04/2004 10/05/2004 10/06/2004 13/07/2004 26/07/2004 24/08/2004 7/09/2004Depth (m)0 11.85 11.38 11.25 11.23 11.13 11.48 13.11 13.96 16.15 17.72 20.29 17.20 17.50 16.49 15.27 14.74 13.04 11.59 11.29 10.92 10.7010 11.86 11.38 11.24 11.17 11.13 11.39 11.92 13.79 15.11 17.76 19.60 17.19 17.00 16.29 15.24 14.74 13.05 11.64 11.26 10.83 10.6620 11.86 11.38 11.24 11.12 11.11 11.37 11.53 13.78 14.53 15.57 16.72 17.18 16.70 16.23 15.21 14.74 13.04 11.62 11.25 10.83 10.6630 11.86 11.38 11.24 11.11 11.06 11.37 11.40 13.70 12.96 13.23 13.87 17.16 16.55 16.19 15.19 14.74 13.05 11.65 11.25 10.83 10.6640 11.86 11.38 11.24 11.11 11.06 11.32 11.34 12.30 12.26 12.33 12.58 12.90 13.30 16.15 15.13 14.73 13.05 11.62 11.26 10.83 10.6650 11.86 11.38 11.24 11.11 11.06 11.31 11.23 11.35 11.48 11.84 11.58 11.83 11.60 12.51 12.40 12.56 13.05 11.65 11.26 10.83 10.6560 11.86 11.38 11.24 11.11 11.06 11.31 11.19 11.28 11.41 11.39 11.33 11.53 11.60 11.59 11.67 11.66 13.05 11.64 11.26 10.83 10.6670 11.86 11.38 11.24 11.10 11.06 11.31 11.16 11.23 11.26 11.26 11.26 11.35 11.40 11.40 11.48 11.43 12.42 11.65 11.25 10.83 10.6680 11.35 11.38 11.24 11.00 11.06 11.30 11.15 11.19 11.25 11.22 11.23 11.30 11.35 11.34 11.39 11.38 11.56 11.64 11.25 10.83 10.6590 11.31 11.38 11.24 11.09 11.06 11.29 11.13 11.16 11.20 11.17 11.22 11.25 11.27 11.30 11.32 11.35 11.51 11.66 11.25 10.82 10.61100 11.27 11.35 11.24 11.09 11.06 11.25 11.11 11.15 11.18 11.17 11.21 11.23 11.27 11.27 11.30 11.32 11.39 11.65 11.25 10.83 10.58110 11.24 11.34 11.23 11.09 11.06 11.21 11.10 11.12 11.17 11.15 11.19 11.20 11.24 11.26 11.28 11.30 11.35 11.65 11.26 10.83 10.56120 11.22 11.32 11.22 11.09 11.06 11.14 11.10 11.11 11.18 11.14 11.18 11.18 11.22 11.24 11.25 11.30 11.34 11.65 11.26 10.83 10.56130 11.21 11.27 11.22 11.08 11.06 11.11 11.08 11.09 11.14 11.13 11.17 11.18 11.20 11.22 11.23 11.28 11.33 11.49 11.26 10.82 10.55140 11.21 11.26 11.21 11.08 11.06 11.09 11.08 11.09 11.15 11.13 11.16 11.17 11.20 11.21 11.21 11.27 11.32 11.39 11.26 10.82 10.53150 11.20 11.22 11.20 11.08 11.07 11.09 11.08 11.09 11.14 11.13 11.16 11.17 11.20 11.21 11.21 11.26 11.31 11.34 11.26 10.79 10.47Dissolved Oxygen (g m -3 )Depth (m)0 10.3 10.6 10.5 10.5 10.5 10.5 10.1 9.9 9.5 9.1 9.2 9.3 9.4 9.2 9.5 9.7 10.2 10.5 10.6 10.7 10.710 10.2 10.4 10.5 10.5 10.6 10.5 10.0 9.9 9.5 9.2 9.3 9.4 9.0 9.1 9.2 9.6 9.9 10.5 10.6 10.5 10.520 10.2 10.2 10.3 10.4 10.4 10.4 10.2 9.8 9.4 9.0 9.1 9.0 8.8 9.0 9.1 9.4 9.8 10.5 10.6 10.5 10.530 10.2 9.9 10.1 10.3 10.1 10.1 10.0 9.5 9.2 9.2 9.1 8.9 8.5 9.0 8.8 9.3 9.5 10.3 10.3 10.4 10.440 10.1 9.9 10.0 10.0 9.8 10.0 9.7 9.3 9.0 9.1 8.7 8.4 8.0 8.9 8.8 9.2 9.5 10.1 10.1 10.4 10.350 10.0 9.0 9.9 9.9 9.8 9.8 9.4 9.0 8.7 8.8 8.5 8.1 7.9 8.2 8.2 8.6 9.4 9.8 9.9 10.3 10.360 9.9 8.8 9.8 9.7 9.6 9.7 9.2 8.9 8.6 8.4 8.2 8.0 7.7 8.0 8.0 8.2 9.4 9.9 9.8 10.3 10.270 9.9 8.7 9.8 9.6 9.6 9.6 9.1 8.7 8.5 8.3 8.1 7.9 7.6 8.0 7.8 7.9 9.1 9.6 9.7 10.2 10.280 8.7 8.6 9.7 9.5 9.5 9.6 8.9 8.6 8.4 8.1 8.0 7.9 7.5 8.0 7.7 7.9 8.5 9.7 9.6 10.2 10.190 8.5 8.5 9.7 9.5 9.5 9.5 8.9 8.6 8.3 8.1 8.0 7.9 7.5 7.9 7.6 7.8 8.0 9.5 9.5 10.1 10.0100 8.2 8.4 9.6 9.5 9.5 9.4 8.8 8.6 8.2 7.9 7.8 7.8 7.4 7.8 7.5 7.7 7.7 9.5 9.4 10.1 10.0110 8.2 8.1 9.6 9.4 9.5 9.3 8.8 8.4 8.2 7.9 7.8 7.7 7.3 7.7 7.4 7.6 7.6 9.4 9.4 9.9 9.9120 8.0 8.0 9.5 9.4 9.5 9.3 8.7 8.4 8.1 7.8 7.7 7.5 7.1 7.6 7.3 7.4 7.5 9.4 9.3 10.0 9.9130 8.0 7.9 9.5 9.4 9.4 9.1 8.7 8.3 8.0 7.8 7.5 7.3 7.0 7.5 7.2 7.3 7.4 9.1 9.2 10.0 9.9140 7.8 7.8 9.5 9.3 9.4 9.0 8.5 8.2 7.9 7.5 7.4 7.3 6.9 7.4 7.0 7.3 7.3 8.3 9.2 9.9 9.9150 7.7 7.6 9.3 9.3 9.4 8.9 8.5 8.0 7.7 7.3 7.2 7.1 6.8 7.1 6.8 7.1 7.3 8.0 9.2 9.8 9.7Secchi depth(m) 14.5 14 13.5 13 12.5 13 17 16 18.5 17.5 19 17 15 16 15 18 13.5 12 11 12.5 12<strong>Lake</strong> <strong>Taupo</strong> Long-<strong>term</strong> Monitoring Programme 2010 - 2011 61
<strong>Lake</strong> <strong>Taupo</strong> Temperature, Dissolved Oxygen, and Secchi Depth Database. 2003-2004Additional site B (Kuratau Basin ) for the period starting 14 July 2003TemperatureDate14/07/2003 31/07/2003 14/08/2003 26/08/2003 8/09/2003 7/10/2003 21/10/2003 19/11/2003 4/12/2003 18/12/2003 13/01/2004 26/02/2004 8/03/2004 31/03/2004 14/04/2004 10/05/2004 10/06/2004 13/07/2004 26/07/2004 24/08/2004 7/09/2004Depth (m)0 11.82 11.32 11.38 11.36 11.13 11.70 13.31 13.79 15.65 17.08 20.25 16.83 17.63 15.92 15.10 14.72 13.02 11.43 11.26 10.92 10.8510 11.80 11.29 11.22 11.17 11.11 11.44 12.28 13.49 15.00 16.43 19.73 16.72 16.56 15.90 15.02 14.68 12.95 11.40 11.20 10.77 10.5920 11.79 11.29 11.22 11.14 11.07 11.40 11.71 13.33 13.81 15.28 16.73 16.58 16.51 15.89 15.00 14.64 12.84 11.41 11.20 10.73 10.5830 11.79 11.29 11.21 11.13 11.03 11.35 11.46 12.22 12.37 13.38 13.74 16.16 16.40 15.88 14.99 14.47 12.71 11.41 11.20 10.72 10.5740 11.79 11.29 11.21 11.13 11.02 11.34 11.38 11.67 11.90 12.91 12.48 15.75 15.53 15.53 14.18 14.07 12.67 11.41 11.19 10.72 10.5750 11.79 11.29 11.21 11.13 11.02 11.33 11.28 11.40 11.57 11.65 11.62 12.97 12.55 12.89 12.48 12.48 12.66 11.41 11.19 10.72 10.5660 11.78 11.29 11.21 11.13 11.01 11.25 11.23 11.31 11.37 11.33 11.40 11.88 11.64 11.69 11.72 11.78 12.57 11.40 11.19 10.72 10.5670 11.78 11.29 11.21 11.12 11.01 11.12 11.15 11.24 11.25 11.27 11.28 11.55 11.47 11.49 11.51 11.47 12.51 11.41 11.18 10.72 10.5680 11.77 11.29 11.16 11.12 11.01 11.06 11.09 11.18 11.21 11.25 11.20 11.38 11.41 11.37 11.43 11.38 12.27 11.37 11.18 10.72 10.5190 11.35 11.29 11.04 11.11 11.01 11.02 11.08 11.13 11.13 11.19 11.16 11.32 11.35 11.32 11.37 11.31 11.77 11.26 11.17 10.71 10.45100 11.27 11.29 10.91 11.08 11.01 11.02 11.05 11.10 11.11 11.16 11.14 11.28 11.33 11.26 11.30 11.24 11.65 11.24 11.17 10.66 10.38Dissolved Oxygen (g m -3 )Depth (m)0 10.7 10.9 10.8 10.6 10.6 10.4 10.5 10.1 9.8 9.1 9.2 9.3 9.5 8.8 10.5 11.4 12.3 10.6 10.5 10.5 10.810 10.5 11.0 10.6 10.6 10.5 10.4 10.4 10.3 9.9 9.3 9.2 9.1 9.0 9.0 9.5 10.2 10.7 10.6 10.5 10.4 10.720 10.3 11.3 10.4 10.2 10.2 10.2 10.1 9.9 9.6 9.4 9.2 9.0 8.9 8.9 9.2 9.9 10.1 10.1 10.5 10.5 10.730 10.2 11.2 10.1 9.9 10.1 9.9 10.0 9.6 9.3 9.1 9.0 9.0 8.7 8.8 8.9 9.4 9.7 9.8 10.3 10.4 10.640 10.1 11.2 9.9 9.8 9.9 9.6 9.7 9.2 8.9 9.1 8.8 8.7 8.2 8.7 8.5 9.1 9.6 9.6 10.0 10.3 10.550 10.0 10.9 9.8 9.6 9.8 9.6 9.4 9.0 8.8 8.7 8.5 8.2 7.9 8.2 7.9 8.5 9.3 9.5 9.8 10.2 10.360 9.9 10.7 9.7 9.5 9.7 9.4 9.0 8.8 8.6 8.3 8.2 8.1 7.7 8.0 7.6 8.0 9.2 9.3 9.6 10.1 10.370 9.9 10.4 9.7 9.5 9.7 9.3 8.9 8.7 8.6 8.3 8.1 7.9 7.6 7.8 7.3 7.7 8.9 9.2 9.6 10.1 10.280 9.8 10.3 9.4 9.4 9.6 9.1 8.7 8.6 8.4 7.9 7.8 7.8 7.4 7.6 7.1 7.4 8.7 9.1 9.4 10.0 10.190 9.2 10.1 9.2 9.3 9.6 9.0 8.7 8.5 8.3 7.9 7.8 7.7 7.3 7.6 7.0 7.5 8.3 8.7 9.5 9.9 10.1100 8.3 10.0 9.2 9.3 9.6 8.9 8.6 8.2 7.9 7.9 7.6 7.4 7.3 7.3 6.8 7.0 8.1 8.1 9.4 9.8 10.0Secchi depth(m) 12 13 13 11.5 11 9.5 15 17 17 15 16 13.5 5 11 14 15.5 12 11 10 10 1162 <strong>Lake</strong> <strong>Taupo</strong> Long-<strong>term</strong> Monitoring Programme 2010 - 2011
<strong>Lake</strong> <strong>Taupo</strong> Temperature, Dissolved Oxygen, and Secchi Depth Database. 2003-2004Additional site C (Western Bays ) for the period starting 14 July 2003TemperatureDate14/07/2003 31/07/2003 14/08/2003 26/08/2003 8/09/2003 7/10/2003 21/10/2003 19/11/2003 4/12/2003 18/12/2003 13/01/2004 26/02/2004 8/03/2004 31/03/2004 14/04/2004 10/05/2004 10/06/2004 13/07/2004 26/07/2004 24/08/2004 7/09/2004Depth (m)011.86 11.43 11.56 11.31 11.32 11.85 13.29 15.10 15.79 17.00 20.17 16.90 18.43 16.37 15.41 14.98 13.16 11.58 11.51 10.97 11.141011.80 11.36 11.26 11.21 11.13 11.24 11.93 13.84 15.29 16.33 18.89 16.69 17.02 16.35 15.18 14.80 13.08 11.61 11.32 10.94 10.732011.80 11.34 11.25 11.14 11.09 11.17 11.62 13.76 14.31 15.26 17.11 16.34 16.45 16.35 15.15 14.76 13.07 11.61 11.30 10.90 10.713011.80 11.32 11.25 11.14 11.08 11.14 11.52 13.63 12.99 13.46 13.74 14.66 15.33 15.95 15.15 14.75 13.07 11.61 11.31 10.90 10.714011.80 11.31 11.25 11.14 11.08 11.14 11.50 11.91 12.03 12.88 12.25 12.56 13.64 13.21 15.14 14.73 13.07 11.60 11.31 10.89 10.705011.80 11.31 11.25 11.14 11.07 11.13 11.46 11.42 11.43 11.64 11.57 11.63 11.64 11.68 12.68 12.57 12.80 11.61 11.30 10.90 10.706011.80 11.31 11.25 11.14 11.07 11.13 11.38 11.31 11.30 11.31 11.36 11.53 11.48 11.45 11.76 11.73 11.68 11.60 11.30 10.89 10.707011.80 11.31 11.25 11.14 11.07 11.12 11.21 11.27 11.28 11.26 11.28 11.39 11.37 11.34 11.54 11.48 11.44 11.61 11.30 10.89 10.708011.79 11.31 11.25 11.14 11.07 1.10 11.13 11.20 11.25 11.22 11.25 11.31 11.35 11.32 11.37 11.39 11.37 11.58 11.30 10.89 10.709011.60 11.29 11.25 11.14 11.07 11.04 11.07 11.14 11.21 11.19 11.21 11.26 11.33 11.29 11.30 11.32 11.33 11.61 11.30 10.89 10.7010011.28 11.27 11.24 11.14 11.07 11.03 11.07 11.11 11.19 11.12 11.19 11.23 11.32 11.25 11.29 11.31 11.32 11.61 11.30 10.89 10.70Dissolved Oxygen (g m -3 )Depth (m)010.3 10.7 10.3 10.4 10.4 11.4 10.1 9.8 9.5 9.2 9.2 9.3 9.3 9.4 10.4 10.3 10.6 10.6 11.0 10.4 10.71010.3 10.8 10.3 10.3 10.4 11.0 10.1 9.9 9.9 9.1 9.2 9.1 9.0 9.2 9.5 9.8 10.1 10.6 10.5 10.4 10.42010.1 10.3 10.1 10.1 10.2 10.8 9.9 9.9 9.5 9.2 9.1 9.2 9.1 9.0 9.1 9.7 9.9 10.6 10.2 10.3 10.43010.1 10.0 9.9 9.9 10.0 10.1 9.6 9.6 9.3 9.1 8.8 8.6 8.6 8.9 8.9 9.4 9.7 10.3 9.9 10.2 10.44010.0 10.0 9.8 9.7 9.9 9.7 9.4 9.4 9.0 9.1 8.8 8.4 8.4 8.3 8.7 9.2 9.6 9.9 9.8 10.1 10.3509.9 9.9 9.6 9.6 9.7 9.7 9.3 9.2 8.8 8.8 8.5 8.2 8.0 8.0 8.2 8.7 9.3 9.6 9.6 10.1 10.2609.8 9.6 9.6 9.5 9.6 9.5 9.2 9.0 8.5 8.5 8.2 8.0 7.9 8.0 7.8 8.2 8.6 9.5 9.5 10.1 10.2709.8 9.5 9.5 9.4 9.5 9.4 9.1 8.8 8.5 8.3 8.1 7.9 7.8 7.9 7.5 8.0 8.2 9.4 9.5 10.0 10.1809.7 9.5 9.5 9.4 9.5 9.3 8.8 8.8 8.3 8.2 7.9 7.8 7.8 7.8 7.4 7.8 8.0 9.3 9.4 10.0 10.0909.6 9.1 9.4 9.3 9.4 9.2 8.7 8.6 8.4 7.9 7.8 7.8 7.7 7.7 7.3 7.6 7.9 9.2 9.2 9.9 10.01008.8 8.8 9.0 9.3 9.4 9.1 8.7 8.5 8.3 7.9 7.7 7.6 7.7 7.5 7.3 7.5 7.8 9.1 9.3 9.9 10.0Secchi depth(m)14 12 14.5 13 12 12.5 12 17.2 17 19 17.5 14 13 12.5 16.5 16 14 12.5 11 10 12<strong>Lake</strong> <strong>Taupo</strong> Long-<strong>term</strong> Monitoring Programme 2010 - 2011 63
<strong>Lake</strong> <strong>Taupo</strong> Temperature, Dissolved Oxygen, and Secchi Depth Database. 2002-2003Mid-<strong>Lake</strong> site A for the period starting 1 July 2002TemperatureDate 1/07/2002 17/07/2002 31/07/2002 29/08/2002 18/09/2002 9/10/2002 13/11/2002 28/11/2002 18/12/2002 30/01/2003 13/02/2003 17/03/2003 3/04/2003 28/04/2003 15/05/2003 12/06/2003 14/07/2003 31/07/2003 14/08/2003 26/08/2003 8/09/2003Depth (m)0 12.13 11.44 11.20 11.10 11.38 11.60 12.58 14.12 15.00 17.84 19.31 18.55 19.05 16.76 15.67 13.59 11.85 11.38 11.25 11.23 11.1310 12.12 11.44 11.20 10.90 11.33 11.60 12.55 14.02 14.78 17.59 19.19 18.43 18.70 16.73 15.57 13.56 11.86 11.38 11.24 11.17 11.1320 12.11 11.44 11.20 10.90 11.28 11.40 12.50 12.91 14.48 17.08 18.10 18.37 18.59 16.73 15.56 13.55 11.86 11.38 11.24 11.12 11.1130 12.11 11.44 11.20 10.80 11.02 11.30 12.38 12.41 14.26 16.13 15.50 16.77 17.02 16.72 15.57 13.55 11.86 11.38 11.24 11.11 11.0640 12.11 11.44 11.20 10.90 10.97 11.30 12.16 11.98 12.67 12.69 12.85 13.44 13.31 12.80 15.53 12.22 11.86 11.38 11.24 11.11 11.0650 12.11 11.44 11.20 10.90 10.96 11.20 12.00 11.54 11.87 12.03 12.14 12.03 12.30 11.96 12.20 11.82 11.86 11.38 11.24 11.11 11.0660 12.10 11.44 11.20 10.80 10.94 11.20 11.72 11.22 11.64 11.70 11.68 11.60 11.81 11.62 11.61 11.52 11.86 11.38 11.24 11.11 11.0670 12.10 11.44 11.20 10.80 10.93 11.20 11.51 11.09 11.31 11.41 11.33 11.39 11.52 11.34 11.36 11.38 11.86 11.38 11.24 11.10 11.0680 11.97 11.44 11.20 10.90 10.92 11.10 11.32 10.98 11.17 11.25 11.25 11.27 11.31 11.27 11.27 11.27 11.35 11.38 11.24 11.00 11.0690 11.49 11.43 11.20 10.90 10.91 11.10 11.13 10.95 11.06 11.15 11.16 11.16 11.20 11.17 11.22 11.21 11.31 11.38 11.24 11.09 11.06100 11.39 11.41 11.20 10.90 10.90 11.10 11.05 10.92 11.04 11.11 11.10 11.13 11.18 11.15 11.20 11.20 11.27 11.35 11.24 11.09 11.06110 11.32 11.37 11.20 10.90 10.89 11.00 11.05 10.90 11.04 11.09 11.08 11.10 11.13 11.13 11.16 11.17 11.24 11.34 11.23 11.09 11.06120 11.29 11.32 11.20 10.90 10.87 11.00 11.01 10.87 11.00 11.06 11.06 11.09 11.13 11.13 11.15 11.15 11.22 11.32 11.22 11.09 11.06130 11.25 11.27 11.20 10.90 10.85 10.90 10.99 10.85 10.98 11.04 11.04 11.08 11.09 11.10 11.12 11.12 11.21 11.27 11.22 11.08 11.06140 11.23 11.26 11.20 10.80 10.83 10.90 10.97 10.83 10.97 11.03 11.03 11.09 11.09 11.09 11.12 11.11 11.21 11.26 11.21 11.08 11.06150 11.23 11.26 11.20 10.80 10.81 10.90 10.96 10.82 10.97 11.03 11.03 11.07 11.08 11.09 11.11 11.11 11.20 11.22 11.20 11.08 11.07Dissolved Oxygen (g m -3 )Depth (m)0 10.3 10.4 9.7 10.5 10.5 10.3 10.2 9.8 9.6 9.1 8.9 9.0 8.8 9.2 9.5 10.0 10.3 10.6 10.5 10.5 10.510 10.3 10.7 9.5 10.4 10.7 10.3 10.2 10.0 9.7 9.1 8.9 8.9 8.8 9.2 9.2 9.7 10.2 10.4 10.5 10.5 10.620 10.3 10.7 9.4 10.3 10.6 10.2 10.2 10.1 9.6 9.2 8.9 8.8 8.6 9.1 9.3 9.4 10.2 10.2 10.3 10.4 10.430 10.2 10.7 9.4 10.3 10.5 10.2 10.2 10.1 9.6 9.1 8.8 8.5 8.3 8.9 9.2 9.3 10.2 9.9 10.1 10.3 10.140 10.2 10.6 9.4 10.2 10.4 10.2 10.1 9.7 9.5 9.2 8.8 8.4 8.0 8.4 9.1 9.0 10.1 9.9 10.0 10.0 9.850 10.2 10.6 9.4 10.2 10.3 10.1 10.1 9.7 9.3 9.1 8.6 8.2 7.8 8.2 8.2 8.2 10.0 9.0 9.9 9.9 9.860 10.1 10.5 9.4 10.2 10.2 10.1 10.0 9.5 9.1 8.9 8.4 8.0 7.7 8.1 8.1 8.1 9.9 8.8 9.8 9.7 9.670 10.1 10.5 9.3 10.1 10.2 10.0 9.9 9.5 8.8 8.8 8.4 7.8 7.6 8.0 8.0 8.0 9.9 8.7 9.8 9.6 9.680 10.0 10.3 9.4 10.1 10.2 10.1 9.7 9.4 8.7 8.7 8.3 7.8 7.5 7.9 7.8 7.9 8.7 8.6 9.7 9.5 9.590 9.7 10.3 9.4 10.1 10.1 10.1 9.5 9.3 8.7 8.7 8.2 7.8 7.4 7.8 7.5 7.6 8.5 8.5 9.7 9.5 9.5100 8.6 10.1 9.4 10.1 10.0 9.8 9.4 9.1 8.6 8.6 8.1 7.7 7.3 7.7 7.2 7.5 8.2 8.4 9.6 9.5 9.5110 8.3 9.8 9.3 9.9 9.9 9.8 9.4 9.1 8.4 8.4 8.0 7.6 7.2 7.6 7.1 7.4 8.2 8.1 9.6 9.4 9.5120 8.1 8.8 9.3 9.9 9.9 9.8 9.3 9.0 8.3 8.3 7.8 7.4 7.0 7.5 7.1 7.2 8.0 8.0 9.5 9.4 9.5130 8.0 8.5 9.3 9.9 9.9 9.7 9.2 9.0 8.3 8.2 7.7 7.2 6.9 7.4 7.0 7.0 8.0 7.9 9.5 9.4 9.4140 7.8 8.1 9.3 9.9 9.9 9.4 9.0 8.8 8.2 8.0 7.4 7.1 6.8 7.2 6.8 6.7 7.8 7.8 9.5 9.3 9.4150 7.8 8.1 9.3 9.8 9.8 9.4 8.9 8.7 8.1 7.9 7.3 6.9 6.5 6.9 6.7 6.5 7.7 7.6 9.3 9.3 9.4Secchi depth(m) 16 15.5 12 9.5 12 15.5 18 12.7 13.5 18 19 15 13.5 14 16.5 11 14.5 14 13.5 13 12.564 <strong>Lake</strong> <strong>Taupo</strong> Long-<strong>term</strong> Monitoring Programme 2010 - 2011
<strong>Lake</strong> <strong>Taupo</strong> Temperature, Dissolved Oxygen, and Secchi Depth Database. 2002-2003Additional site B (Kuratau Basin ) for the period starting 1 July 2002TemperatureDate 1/07/2002 17/07/2002 31/07/2002 29/08/2002 18/09/2002 9/10/2002 13/11/2002 28/11/2002 18/12/2002 30/01/2003 13/02/2003 17/03/2003 3/04/2003 28/04/2003 15/05/2003 12/06/2003 14/07/200331/07/2003 14/08/2003 26/08/2003 8/09/2003Depth (m)0 12.13 11.48 11.3 11 11.08 11.70 11.98 13.82 15.16 16.76 18.87 18.74 19.09 16.73 15.79 13.24 11.82 11.32 11.38 11.36 11.1310 12.09 11.49 11.1 10.8 11.05 11.30 11.94 13.67 15.08 16.75 18.46 18.54 18.82 16.66 15.49 13.02 11.8 11.29 11.22 11.17 11.1120 12.09 11.48 11.1 10.8 11.03 11.20 11.9 12.79 13.86 16.53 17.71 18.45 18.49 16.62 15.47 12.79 11.79 11.29 11.22 11.14 11.0730 12.09 11.48 11.1 10.8 11.03 11.20 11.8 12.31 13.4 14.33 16.2 14.87 15.32 16.2 15.41 11.83 11.79 11.29 11.21 11.13 11.0340 12.08 11.48 11.1 10.8 11.02 11.20 11.68 11.75 13.18 12.98 13.89 12.03 13.25 13.46 13.2 11.62 11.79 11.29 11.21 11.13 11.0250 11.97 11.49 11.1 10.8 10.91 11.20 11.44 11.44 12.91 12.1 12.59 12.06 12 12.28 12.09 11.51 11.79 11.29 11.21 11.13 11.0260 11.93 11.49 11.1 10.8 10.9 11.10 11.26 11.27 12.27 11.69 11.75 11.58 11.58 11.7 11.71 11.38 11.78 11.29 11.21 11.13 11.0170 11.87 11.48 11.1 10.8 10.89 11.10 11.11 11.17 11.58 11.37 11.4 11.36 11.35 11.4 11.4 11.29 11.78 11.29 11.21 11.12 11.0180 11.78 11.48 11.1 10.8 10.89 11.00 11 11.03 11.51 11.23 11.3 11.24 11.25 11.25 11.28 11.27 11.77 11.29 11.16 11.12 11.0190 11.37 11.46 11.1 10.7 10.87 11.00 10.93 10.96 11.39 11.14 11.17 11.13 11.15 11.18 11.21 11.26 11.35 11.29 11.04 11.11 11.01100 11.28 11.3 11 10.7 10.85 11.00 10.91 10.92 11.2 11.09 11.12 11.13 11.12 11.12 11.18 11.25 11.27 11.29 10.91 11.08 11.01110 10.7 10.7 10.90Dissolved Oxygen (g m -3 )Depth (m)0 10.3 10.4 9.9 10.4 10.4 10.4 10.3 9.9 9.6 9.3 9.4 8.9 8.9 9.7 9.4 10 10.7 10.9 10.8 10.6 10.610 10.3 10.8 9.7 10.3 10.5 10.5 10.3 10 9.7 9.3 9.3 8.9 8.8 9.6 9.4 10 10.5 11 10.6 10.6 10.520 10.2 10.6 9.6 10.3 10.5 10.3 10.3 9.9 9.5 9.2 9.3 8.8 8.5 9.5 9.3 9.6 10.3 11.3 10.4 10.2 10.230 10.2 10.6 9.6 10.2 10.5 10.3 103 9.9 9.6 9.2 9.2 8.2 8.1 9.4 8.8 9.2 10.2 11.2 10.1 9.9 10.140 10.1 10.5 9.6 10.2 10.4 10.2 10.2 9.5 9.4 9.1 9 8.2 8 8.8 8.5 8.8 10.1 11.2 9.9 9.8 9.950 10.1 10.5 9.6 10.1 10.3 10.1 10.1 9.5 9.4 8.9 8.8 8 7.7 8.3 7.9 8.5 10 10.9 9.8 9.6 9.860 9.8 10.4 9.6 10.1 10.2 10.1 9.9 9.4 9.2 8.6 8.6 7.8 7.6 8.3 7.8 8.3 9.9 10.7 9.7 9.5 9.770 9.7 10.4 9.5 10 10.1 9.8 9.8 9.4 9 8.4 8.4 7.7 7.4 8.2 7.7 8.2 9.9 10.4 9.7 9.5 9.780 9.5 10.3 9.5 10 10.1 9.7 9.7 9 8.6 8.3 8.3 7.3 7.3 8 7.7 8.1 9.8 10.3 9.4 9.4 9.690 9.1 10.3 9.5 10 10 9.7 9.5 9 8.6 8.2 8 7.2 7.1 7.7 7.5 7.7 9.2 10.1 9.2 9.3 9.6100 8.7 9.8 9.6 9.9 9.9 9.7 9.2 9 8.4 7.7 7.6 7 7 7.6 7.1 7.5 8.3 10 9.2 9.3 9.6110 9.2 9.8 9.4Secchi depth(m) 16 12.5 10.5 8 11 16 14 12.7 14 18 11 14 12.8 13.5 15.5 12 12 13 13 11.5 11<strong>Lake</strong> <strong>Taupo</strong> Long-<strong>term</strong> Monitoring Programme 2010 - 2011 65
<strong>Lake</strong> <strong>Taupo</strong> Temperature, Dissolved Oxygen, and Secchi Depth Database. 2002-2003Additional site C (Western Bays ) for the period starting 1 July 2002TemperatureDate 1/07/2002 17/07/2002 31/07/2002 29/08/2002 18/09/2002 9/10/2002 13/11/2002 28/11/2002 18/12/2002 30/01/2003 13/02/2003 17/03/2003 3/04/2003 28/04/2003 15/05/2003 12/06/2003 14/07/2003 31/07/2003 14/08/2003 26/08/2003 8/09/2003Depth (m)0 12.22 11.52 11.6 11.4 11.24 12.10 12.56 13.98 15.12 17.61 19.58 19.04 18.15 17.1 15.8 13.65 11.86 11.43 11.56 11.31 11.3210 12.15 11.5 11.2 10.9 11.23 11.30 12.5 13.45 14.21 17.49 18.95 18.45 18.58 16.82 15.54 13.62 11.8 11.36 11.26 11.21 11.1320 12.14 11.49 11.2 10.9 11.16 11.30 12.38 12.63 13.31 17.48 17.41 18.29 18.3 16.77 15.52 13.59 11.8 11.34 11.25 11.14 11.0930 12.14 11.49 11.2 10.8 11.06 11.20 12.33 12.42 12.73 14.31 14.19 14.81 14.61 16.76 15.51 13.59 11.8 11.32 11.25 11.14 11.0840 12.13 11.49 11.2 10.8 11.02 11.20 11.75 12.2 11.98 12.36 12.79 12.88 12.73 13.62 13.07 13.59 11.8 11.31 11.25 11.14 11.0850 12.13 11.49 11.2 10.8 11.02 11.20 11.28 11.98 11.53 12 11.98 11.86 12.1 12.08 12.14 13.54 11.8 11.31 11.25 11.14 11.0760 11.92 11.49 11.2 10.8 11 11.10 11.12 11.37 11.33 11.61 11.68 11.49 11.71 11.56 11.71 13.28 11.8 11.31 11.25 11.14 11.0770 11.55 11.49 11.2 10.8 10.99 11.10 11.08 11.21 11.15 11.29 11.3 11.35 11.37 11.35 11.4 11.8 11.8 11.31 11.25 11.14 11.0780 11.5 11.49 11.2 10.8 10.95 11.10 11.03 11.04 11.12 11.19 11.19 11.25 11.22 11.24 11.27 11.45 11.79 11.31 11.25 11.14 11.0790 11.47 11.49 11.2 10.8 10.94 11.00 11 10.98 11.1 11.11 11.15 11.2 11.18 11.18 11.22 11.35 11.6 11.29 11.25 11.14 11.07100 11.45 11.49 11.2 10.8 10.92 11.00 10.97 10.96 11.08 11.08 11.13 11.2 11.15 11.15 11.17 11.23 11.28 11.27 11.24 11.14 11.07Dissolved Oxygen (g m -3 )Depth (m)0 10.4 10.5 9.7 10.3 10.5 10.4 10.2 9.9 9.6 9.1 9.5 9.9 8.9 9.4 9.3 10 10.3 10.7 10.3 10.4 10.410 10.4 10.8 9.5 10.2 10.7 10.4 10.3 9.7 9.6 9 9.3 9.7 8.8 9.2 9.1 9.6 10.3 10.8 10.3 10.3 10.420 10.4 10.8 9.5 10.2 10.7 10.4 10.3 9.9 9.7 9 9.3 9 8.8 9.2 9 9.3 10.1 10.3 10.1 10.1 10.230 10.3 10.7 9.4 10.1 10.6 10.4 10.2 9.9 9.6 8.7 9 8.4 8.3 9 8.8 9.1 10.1 10 9.9 9.9 1040 10.3 10.5 9.4 10 10.5 10.3 10.1 9.7 9.5 8.7 9 8.4 8.1 8.5 8.3 9.3 10 10 9.8 9.7 9.950 10.2 10.5 9.4 10 10.4 10 9.9 9.7 9.2 8.6 8.7 8.1 7.9 8.2 7.8 9.2 9.9 9.9 9.6 9.6 9.760 10 10.5 9.4 10 10.4 10 9.7 9.6 9.1 8.5 8.5 8.1 7.9 8.2 7.8 9.9 9.8 9.6 9.6 9.5 9.670 9.6 10.5 9.4 9.9 10.3 9.9 9.7 9.5 9 8.4 8.4 7.9 7.8 8 7.7 9.7 9.8 9.5 9.5 9.4 9.580 8.8 10.5 9.3 9.9 10.2 9.9 9.5 9 8.8 8.3 8.3 7.6 7.7 8 7.5 9.4 9.7 9.5 9.5 9.4 9.590 8.7 10.4 9.3 9.9 10.1 9.8 9.5 9.1 8.7 8.1 8.3 7.5 7.6 7.9 7.3 9.2 9.6 9.1 9.4 9.3 9.4100 8.6 10.2 9.3 10 10 9.6 9.3 9.1 8.7 8 8.1 7.3 7.4 7.8 7.2 9.1 8.8 8.8 9 9.3 9.4Secchi depth(m) 14 12.5 12 8 12 19 16 15.5 13.5 18.5 19 15 14.5 14.5 17 11 14 12 14.5 13 1266 <strong>Lake</strong> <strong>Taupo</strong> Long-<strong>term</strong> Monitoring Programme 2010 - 2011
<strong>Lake</strong> <strong>Taupo</strong> Temperature, Dissolved Oxygen, and Secchi Depth Database. 2001-2002Mid-<strong>Lake</strong> site A for the period starting 2 July 2001TemperatureDate 2/07/01 25/07/01 13/08/01 3/09/01 25/09/01 25/10/01 12/11/01 10/12/01 20/12/01 8/01/02 22/01/02 6/03/02 4/04/02 22/04/02 5/05/02 19/06/02 1/07/02 17/07/02 31/07/02 29/08/02 18/09/02 9/10/02Depth (m)0 12.11 11.26 11.15 10.96 11.58 12.97 14.23 15.47 17.92 18.37 19.4 18.69 17.45 17.05 15.51 12.57 12.13 11.44 11.2 11.1 11.38 11.6010 12.04 11.26 11.12 10.98 11.57 12.91 14.16 15.51 16.60 18.07 18.8 18.69 17.38 16.64 15.54 12.57 12.12 11.44 11.2 10.9 11.33 11.6020 12.00 11.26 11.12 10.95 11.56 12.90 13.37 15.52 15.46 17.62 18.05 18.68 17.18 16.61 15.52 12.57 12.11 11.44 11.2 10.9 11.28 11.4030 11.99 11.26 11.11 10.94 11.52 12.89 12.85 14.52 13.79 13.5 14.8 15.3 16.83 16.56 15.5 12.56 12.11 11.44 11.2 10.8 11.02 11.3040 11.98 11.26 11.11 10.94 11.04 12.00 11.87 13.01 12.41 12.43 13.1 12.42 12.9 13.35 15.39 12.56 12.11 11.44 11.2 10.9 10.97 11.3050 11.98 11.26 11.11 10.94 10.96 11.50 11.57 11.80 11.70 11.61 12.06 11.73 12.09 11.93 11.92 12.56 12.11 11.44 11.2 10.9 10.96 11.2060 11.95 11.26 11.10 10.94 10.92 11.13 11.24 11.27 11.32 11.38 11.52 11.43 11.51 11.53 11.49 12.53 12.1 11.44 11.2 10.8 10.94 11.2070 11.76 11.26 11.09 10.94 10.91 11.01 11.13 11.13 11.22 11.24 11.25 11.27 11.3 11.3 11.33 11.98 12.1 11.44 11.2 10.8 10.93 11.2080 11.51 11.26 11.08 10.92 10.90 10.96 11.03 11.05 11.16 11.16 11.17 11.2 11.24 11.25 11.27 11.35 11.97 11.44 11.2 10.9 10.92 11.1090 11.45 11.26 11.08 10.91 10.90 10.95 11.01 11.02 11.12 11.13 11.15 11.17 11.19 11.22 11.28 11.27 11.49 11.43 11.2 10.9 10.91 11.10100 11.41 11.26 11.08 10.91 10.90 10.94 10.99 11.00 11.08 11.12 11.14 11.16 11.17 11.2 11.38 11.25 11.39 11.41 11.2 10.9 10.9 11.10110 11.39 11.26 11.08 10.91 10.90 10.92 10.97 10.99 11.07 11.1 11.13 11.13 11.14 11.18 11.27 11.24 11.32 11.37 11.2 10.9 10.89 11.00120 11.36 11.26 11.08 10.91 10.89 10.92 10.95 10.97 11.04 11.1 11.12 11.13 11.14 11.17 11.26 11.21 11.29 11.32 11.2 10.9 10.87 11.00130 11.35 11.26 11.07 10.90 10.89 10.91 10.94 10.96 11.04 11.09 11.1 11.13 11.13 11.15 11.24 11.2 11.25 11.27 11.2 10.9 10.85 10.90140 11.34 11.26 11.07 10.90 10.89 10.90 10.94 10.96 11.04 11.08 11.1 11.13 11.13 11.14 11.23 11.19 11.23 11.26 11.2 10.8 10.83 10.90150 11.33 11.26 11.07 10.90 10.89 10.90 10.94 10.96 11.03 11.08 11.1 11.12 11.13 11.14 11.19 11.9 11.23 11.26 11.2 10.8 10.81 10.90Dissolved Oxygen (g m -3 )Depth (m)0 9.2 10.2 9.6 10.6 10.4 9.9 9.5 9.4 9.1 9.1 9.0 8.7 8.8 9.4 10.5 10.2 10.3 10.4 9.7 10.5 10.5 10.310 9.1 10.5 9.6 10.7 10.4 9.9 9.8 9.5 8.9 9.0 8.9 8.7 8.9 9.3 9.5 10.2 10.3 10.7 9.5 10.4 10.7 10.320 9.4 9.4 9.6 10.6 10.4 10.0 9.4 9.5 9.0 9.0 9.1 8.7 8.8 9.3 9.5 10.2 10.3 10.7 9.4 10.3 10.6 10.230 9.8 9.2 9.6 10.6 10.4 10.1 9.4 9.1 8.8 9.0 9.1 8.4 8.7 9.2 9.4 10.2 10.2 10.7 9.4 10.3 10.5 10.240 9.8 9.1 9.6 10.6 10.0 9.7 8.9 9.1 8.6 8.8 9.0 8.4 8.3 8.7 9.3 10.1 10.2 10.6 9.4 10.2 10.4 10.250 9.6 8.9 9.6 10.6 9.9 9.5 9.0 8.7 8.6 8.7 8.7 8.2 8.2 8.3 8.6 10.1 10.2 10.6 9.4 10.2 10.3 10.160 9.4 8.9 9.5 10.5 9.8 9.3 8.7 8.6 8.5 8.6 8.6 8.2 8.1 8.1 8.3 10.0 10.1 10.5 9.4 10.2 10.2 10.170 9.5 9.0 9.4 10.4 9.7 9.3 8.8 8.7 8.5 8.6 8.5 8.2 8.0 8.0 8.2 9.6 10.1 10.5 9.3 10.1 10.2 10.080 7.7 8.9 9.4 10.4 9.7 9.2 8.6 8.4 8.5 8.6 8.4 8.1 7.9 7.9 8.2 8.5 10.0 10.3 9.4 10.1 10.2 10.190 7.8 8.9 9.4 10.4 9.6 9.5 8.8 8.5 8.5 8.6 8.2 8.1 7.8 7.8 8.0 8.3 9.7 10.3 9.4 10.1 10.1 10.1100 7.5 8.6 9.3 10.4 9.6 9.2 8.6 8.4 8.3 8.5 8.1 8.0 7.8 7.8 7.5 8.2 8.6 10.1 9.4 10.1 10.0 9.8110 7.4 8.7 9.3 10.4 9.6 9.2 8.6 8.4 8.3 8.4 8.1 8.0 7.7 7.7 7.3 8.1 8.3 9.8 9.3 9.9 9.9 9.8120 6.9 8.5 9.3 10.3 9.5 9.0 8.4 8.4 8.3 8.2 8.1 7.9 7.7 7.6 7.2 8.0 8.1 8.8 9.3 9.9 9.9 9.8130 6.9 8.5 9.3 10.2 9.5 9.0 8.4 8.4 8.3 8.2 8.2 7.9 7.6 7.5 7.3 7.9 8.0 8.5 9.3 9.9 9.9 9.7140 6.8 8.3 9.2 10.2 9.5 8.6 8.2 8.2 8.1 8.0 8.1 7.8 7.1 7.8 7.3 7.8 7.8 8.1 9.3 9.9 9.9 9.4150 6.4 8.2 9.2 10.2 9.3 8.5 8.1 8.1 7.9 7.8 7.9 7.6 7.0 7.2 7.3 7.7 7.8 8.1 9.3 9.8 9.8 9.4Secchi depth(m) 12 14.5 13.5 17.5 11 14.5 15.5 16 13 13 15 14.5 19 22 16.4 17 16 15.5 12 9.5 12 15.5<strong>Lake</strong> <strong>Taupo</strong> Long-<strong>term</strong> Monitoring Programme 2010 - 2011 67
<strong>Lake</strong> <strong>Taupo</strong> Temperature, Dissolved Oxygen, and Secchi Depth Database. 2001-2002Additional site B (Kuratau Basin ) for the period starting 8 January 2002 onTemperatureDate 8/01/2002 22/01/2002 6/03/2002 4/04/2002 22/04/2002 5/05/2002 19/06/2002 1/07/2002 17/07/2002 31/07/2002 29/08/2002 18/09/2002Depth (m)0 18.1 18.8 18.64 17.38 16.84 15.12 12.45 12.13 11.48 11.3 11 11.0810 17.55 18.45 18.58 17.35 16.61 15.14 12.44 12.09 11.49 11.1 10.8 11.0520 15.72 17.4 18.56 17.1 16.6 15.05 12.44 12.09 11.48 11.1 10.8 11.0330 13.74 13.9 15.07 16.74 16.4 14.75 12.43 12.09 11.48 11.1 10.8 11.0340 12.62 12.73 13.08 14.3 13.4 14.4 12.24 12.08 11.48 11.1 10.8 11.0250 11.92 11.98 11.91 12.77 12.12 14.07 12.11 11.97 11.49 11.1 10.8 10.9160 11.31 11.41 11.5 12.03 11.53 12.96 11.73 11.93 11.49 11.1 10.8 10.970 11.21 11.25 11.24 11.5 11.32 12.2 11.49 11.87 11.48 11.1 10.8 10.8980 11.15 11.19 11.21 11.29 11.24 11.97 11.38 11.78 11.48 11.1 10.8 10.8990 11.1 11.13 11.15 11.2 11.18 11.69 11.3 11.37 11.46 11.1 10.7 10.87100 11.1 11.12 11.12 11.19 11.15 11.39 11.22 11.28 11.3 11 10.7 10.85110 10.7 10.7Dissolved Oxygen (g m -3 )Depth (m)0 8.7 8.8 9.3 9.3 9.3 10.9 10.4 10.3 10.4 9.9 10.4 10.410 8.6 9 9.1 9.2 9.3 9.5 10.3 10.3 10.8 9.7 10.3 10.520 8.8 9 9.1 9.2 9.2 9.4 10.2 10.2 10.6 9.6 10.3 10.530 8.8 8.9 8.6 9.1 9.2 9.3 10.2 10.2 10.6 9.6 10.2 10.540 8.7 8.7 8.7 8.9 8.5 9.1 10.1 10.1 10.5 9.6 10.2 10.450 8.7 8.4 8.5 8.6 8.2 9 10 10.1 10.5 9.6 10.1 10.360 8.7 8.3 8.4 8.4 8 8.6 9 9.8 10.4 9.6 10.1 10.270 8.7 8.3 8.3 8.3 7.9 8.1 8.7 9.7 10.4 9.5 10 10.180 8.7 8.2 8.1 8.1 7.8 7.9 8.4 9.5 10.3 9.5 10 10.190 8.2 8.1 7.9 7.7 7.7 7.8 8.2 9.1 10.3 9.5 10 10100 8 7.6 7.5 7.7 7.5 7.7 7.8 8.7 9.8 9.6 9.9 9.9110 8 6.2 9.2 9.8Secchi depthDepth (m) 13.5 12 14.5 19.5 19 13.2 15 16 12.5 10.5 8 1168 <strong>Lake</strong> <strong>Taupo</strong> Long-<strong>term</strong> Monitoring Programme 2010 - 2011
<strong>Lake</strong> <strong>Taupo</strong> Temperature, Dissolved Oxygen, and Secchi Depth Database. 2001-2002Additional site C (Western Bays ) for the period starting 8 January 2002 onTemperatureDate 8/01/2002 22/01/2002 6/03/2002 4/04/2002 22/04/2002 5/05/2002 19/06/2002 1/07/2002 17/07/2002 31/07/2002 29/08/2002 18/09/2002 9/10/2002Depth (m)0 18.72 18.82 18.68 17.47 16.88 15.6 12.58 12.22 11.52 11.6 11.4 11.24 12.1010 17.41 18.46 18.47 17.24 11.63 15.64 12.56 12.15 11.5 11.2 10.9 11.23 11.3020 16.95 18.21 18.32 17.16 16.58 15.64 12.56 12.14 11.49 11.2 10.9 11.16 11.3030 14 13.77 15.9 17.12 16.5 15.61 12.56 12.14 11.49 11.2 10.8 11.06 11.2040 13.14 12.01 12.98 13.17 13.02 12.26 12.56 12.13 11.49 11.2 10.8 11.02 11.2050 11.97 11.5 12.13 12.11 11.87 11.57 12.56 12.13 11.49 11.2 10.8 11.02 11.2060 11.44 11.26 11.59 11.57 11.47 11.37 11.9 11.92 11.49 11.2 10.8 11 11.1070 11.26 11.17 11.36 11.38 11.32 11.29 11.36 11.55 11.49 11.2 10.8 10.99 11.1080 11.18 11.16 11.25 11.32 11.26 11.24 11.28 11.5 11.49 11.2 10.8 10.95 11.1090 11.15 11.14 11.18 11.21 11.23 11.21 11.23 11.47 11.49 11.2 10.8 10.94 11.00100 11.12 11.11 11.18 11.19 11.19 11.19 11.22 11.45 11.49 11.2 10.8 10.92 11.00110 11.11 11.1 11.16 11.15 11.2 10.8 10.90120 11.2 10.8 10.90Dissolved Oxygen (g m -3 )Depth (m)0 8.6 8.9 9.3 9.4 9.3 10.6 10.3 10.4 10.5 9.7 10.3 10.5 10.410 8.4 8.9 9 9.1 9.2 9.5 10.2 10.4 10.8 9.5 10.2 10.7 10.420 8.9 8.9 9 9.1 9.2 9.5 10.2 10.4 10.8 9.5 10.2 10.7 10.430 8.6 8.9 8.8 9.1 9.1 9.4 10.1 10.3 10.7 9.4 10.1 10.6 10.440 8.6 8.5 8.6 8.6 8.5 8.9 10.1 10.3 10.5 9.4 10 10.5 10.350 8.5 8.2 8.5 8.5 8.1 8.6 10 10.2 10.5 9.4 10 10.4 1060 8.6 8.1 8.5 8.2 7.9 8.3 9.7 10 10.5 9.4 10 10.4 1070 8.6 8.1 8.2 8.2 7.8 8.2 9.1 9.6 10.5 9.4 9.9 10.3 9.980 8.7 8.1 8.1 8 7.7 8 8.4 8.8 10.5 9.3 9.9 10.2 9.990 8.6 8.1 8.1 7.9 7.7 7.9 8 8.7 10.4 9.3 9.9 10.1 9.8100 8.7 8.1 8.1 7.9 7.6 7.8 7.7 8.6 10.2 9.3 10 10 9.6110 8.5 7.9 7.6 7.7 9.3 10 9.7120 8.5 7.7 9.1 9.9 9.6Secchi depthDepth (m) 14.5 15.5 16 19 18.5 15.6 16 14 12.5 12 8 12 19<strong>Lake</strong> <strong>Taupo</strong> Long-<strong>term</strong> Monitoring Programme 2010 - 2011 69
<strong>Lake</strong> <strong>Taupo</strong> Temperature, Dissolved Oxygen, and Secchi Depth Database. 2000-2001For the period starting 11 July 2000TemperatureDate 11-7-00 04-8-00 21-8-00 11-9-00 28-9-00 25-10-00 13-11-00 06-12-00 03-1-01 15-1-01 20-2-01 01-3-01 19-3-01 09-4-01 11-4-01 10-5-01 29-5-01 02-7-01 25-7-01 13-8-01Depth (m)0 11.87 11.32 11.19 11.80 12.47 14.04 13.27 15.73 18.16 18.98 20.47 20.87 19.01 16.99 16.99 15.78 13.62 12.11 11.26 11.1510 11.87 11.32 11.15 11.46 11.52 13.03 13.09 15.06 17.37 18.51 19.37 20.71 19.05 16.87 16.99 15.78 13.74 12.04 11.26 11.1220 11.86 11.32 11.14 11.33 11.36 11.99 12.98 14.15 15.46 14.79 18.08 18.98 19.06 16.78 16.97 15.78 13.78 12.00 11.26 11.1230 11.86 11.33 11.14 11.30 11.33 11.83 12.80 13.31 13.61 13.63 16.06 15.95 16.46 15.82 16.84 15.73 13.79 11.99 11.26 11.1140 11.86 11.33 11.14 11.27 11.31 11.60 12.36 12.49 12.73 12.81 13.39 13.36 13.05 13.13 13.87 13.19 13.80 11.98 11.26 11.1150 11.86 11.33 11.14 11.22 11.30 11.49 12.10 12.16 12.21 12.27 12.67 12.58 12.42 12.35 12.68 12.42 13.80 11.98 11.26 11.1160 11.64 11.33 11.15 11.18 11.27 11.42 11.69 11.78 11.76 11.87 12.01 12.01 11.84 11.81 11.89 11.90 11.92 11.95 11.26 11.1070 11.42 11.33 11.15 11.15 11.24 11.39 11.41 11.53 11.64 11.67 11.77 11.79 11.67 11.67 11.69 11.69 11.61 11.76 11.26 11.0980 11.31 11.33 11.15 11.14 11.20 11.38 11.29 11.40 11.47 11.55 11.56 11.63 11.55 11.54 11.54 11.52 11.54 11.51 11.26 11.0890 11.22 11.33 11.15 11.13 11.17 11.33 11.26 11.36 11.43 11.46 11.50 11.55 11.49 11.46 11.48 11.47 11.46 11.45 11.26 11.08100 11.21 11.32 11.15 11.13 11.14 11.33 11.21 11.32 11.38 11.39 11.43 11.50 11.43 11.41 11.43 11.42 11.42 11.41 11.26 11.08110 11.19 11.32 11.15 11.13 11.06 11.29 11.19 11.28 11.36 11.36 11.40 11.46 11.41 11.37 11.39 11.40 11.38 11.39 11.26 11.08120 11.19 11.31 11.15 11.13 11.04 11.27 11.19 11.27 11.33 11.34 11.39 11.44 11.39 11.33 11.35 11.38 11.35 11.36 11.26 11.08130 11.18 11.26 11.15 11.12 11.02 11.23 11.17 11.26 11.30 11.32 11.37 11.43 11.37 11.32 11.34 11.36 11.33 11.35 11.26 11.07140 11.16 11.18 11.14 11.12 11.01 11.18 11.15 11.25 11.30 11.31 11.35 11.40 11.35 11.31 11.32 11.34 11.31 11.34 11.26 11.07150 11.15 11.18 11.14 11.12 11.01 11.15 11.15 11.25 11.32 11.31 11.33 11.41 11.34 11.31 11.32 11.34 11.31 11.33 11.26 11.07Dissolved Oxygen (g m -3 )Depth (m)0 9.0 9.0 9.2 9.3 9.1 8.9 8.2 8.7 8.2 8.0 8.0 8.2 8.4 8.3 8.4 8.2 8.7 9.2 10.2 9.610 9.0 9.0 9.4 9.5 8.7 8.8 8.4 8.3 8.3 8.6 8.0 8.5 8.3 8.3 8.2 8.0 8.5 9.1 10.5 9.620 9.0 9.1 9.4 9.5 8.7 9.1 8.4 8.5 8.4 8.1 8.2 8.6 8.6 8.4 7.9 7.9 8.4 9.4 9.4 9.630 9.0 9.1 9.6 9.5 8.7 8.9 8.4 8.5 8.5 8.2 8.0 8.3 8.0 8.0 8.0 7.8 8.4 9.8 9.2 9.640 9.0 9.1 9.6 9.5 9.1 8.7 8.2 8.2 8.4 7.9 8.1 8.1 7.6 7.8 7.6 7.7 8.3 9.8 9.1 9.650 9.0 9.1 9.6 9.5 9.1 8.5 8.2 8.2 8.2 8.1 7.9 7.8 7.6 7.5 7.4 7.5 8.3 9.6 8.9 9.660 9.0 9.1 9.7 9.5 8.7 8.4 8.0 7.9 8.0 7.5 7.7 7.4 6.8 7.2 7.2 7.5 7.2 9.4 8.9 9.570 8.9 9.1 9.7 9.5 8.7 8.3 7.9 7.8 7.9 7.4 7.6 7.2 6.8 7.1 7.4 7.3 7.0 9.5 9.0 9.480 7.8 9.0 9.7 9.5 8.7 8.2 7.6 7.6 7.8 7.5 7.4 7.0 6.5 6.9 7.3 7.3 7.0 7.7 8.9 9.490 7.4 8.9 9.7 9.5 8.7 8.2 7.6 7.6 7.7 7.5 7.4 6.9 6.5 6.9 7.1 7.1 7.0 7.8 8.9 9.4100 7.2 8.7 9.7 9.5 8.7 8.0 7.5 7.6 7.6 7.3 7.2 6.8 6.6 6.8 7.0 7.0 6.9 7.5 8.6 9.3110 7.1 8.3 9.7 9.5 8.7 8.0 7.5 7.5 7.6 7.2 7.1 6.7 6.5 6.8 7.0 7.0 6.7 7.4 8.7 9.3120 6.9 7.9 9.7 9.5 8.2 8.1 7.4 7.4 7.5 7.1 7.0 6.5 6.5 6.7 6.8 6.9 6.6 6.9 8.5 9.3130 6.9 7.3 9.7 9.5 8.5 8.1 7.4 7.3 7.4 7.0 7.0 6.5 6.5 6.6 6.7 6.6 6.5 6.9 8.5 9.3140 6.9 7.1 9.7 9.5 8.6 8.0 7.3 7.2 7.2 6.9 6.8 6.4 6.5 6.4 6.4 6.7 6.3 6.8 8.3 9.2150 6.8 7.4 9.7 9.3 8.5 7.9 7.3 7.1 7.1 6.6 6.5 6.3 6.4 6.3 6.3 6.6 6.1 6.4 8.2 9.2Secchi depthDepth (m)11 12 15 12 13 11 12 17 17 18 17 14.5 17 13.5 13.5 17 14.5 12 14.5 13.570 <strong>Lake</strong> <strong>Taupo</strong> Long-<strong>term</strong> Monitoring Programme 2010 - 2011
<strong>Lake</strong> <strong>Taupo</strong> Temperature, Dissolved Oxygen, and Secchi Depth Database. 1999-2000For the period starting 13 July 1999TemperatureDate 13-7-99 6-8-99 3-9-99 29-9-99 18-10-99 19-12-99 18-1-00 12-4-00 4-5-00 25-5-00 20-6-00 11-7-00 4-8-00 21-8-00 11-9-00 28-9-00 25-10-00 13-11-00 6-12-00Depth (m)0 12.0 11.8 11.8 11.5 12.8 16.56 18.63 17.41 15.82 14.22 12.28 11.87 11.32 11.19 11.80 12.47 14.04 13.27 15.7310 12.0 11.4 11.3 11.5 12.7 16.40 18.35 17.25 15.77 14.28 12.28 11.87 11.32 11.15 11.46 11.52 13.03 13.09 15.0620 12.0 11.4 11.2 11.5 12.4 15.96 17.22 17.21 15.76 14.31 12.28 11.86 11.32 11.14 11.33 11.36 11.99 12.98 14.1530 12.0 11.4 11.1 11.4 11.6 15.23 14.94 16.65 15.75 14.28 12.27 11.86 11.33 11.14 11.30 11.33 11.83 12.86 13.3140 12.0 11.3 11.1 11.2 11.4 12.16 13.29 12.55 13.64 14.22 12.26 11.86 11.33 11.14 11.27 11.31 11.60 12.36 12.4950 12.0 11.3 11.1 11.1 11.3 11.64 11.91 11.67 12.14 12.53 12.26 11.86 11.33 11.14 11.22 11.30 11.49 12.10 12.1660 12.0 11.3 11.0 11.1 11.1 11.35 11.45 11.39 11.56 11.56 12.21 11.85 11.33 11.15 11.18 11.27 11.42 11.69 11.7870 12.0 11.3 11.0 11.0 11.1 11.25 11.31 11.29 11.36 11.34 11.58 11.64 11.33 11.15 11.15 11.24 11.39 11.41 11.5380 11.4 11.3 11.0 11.0 11.0 11.18 11.21 11.23 11.24 11.23 11.32 11.42 11.33 11.15 11.14 11.20 11.38 11.29 11.4090 11.3 11.3 11.0 11.0 11.0 11.16 11.17 11.20 11.21 11.20 11.24 11.31 11.33 11.15 11.13 11.17 11.33 11.26 11.36100 11.2 11.2 11.0 11.0 11.0 11.14 11.14 11.17 11.17 11.15 11.17 11.22 11.32 11.15 11.13 11.14 11.33 11.21 11.32110 11.2 11.2 11.0 11.0 11.0 11.12 11.12 11.15 11.14 11.12 11.16 11.21 11.32 11.15 11.13 11.06 11.29 11.19 11.28120 11.2 11.1 11.0 11.0 11.0 11.10 11.09 11.13 11.12 11.10 11.14 11.19 11.31 11.15 11.13 11.04 11.27 11.19 11.27130 11.1 11.1 11.0 11.0 11.0 11.08 11.08 11.11 11.10 11.09 11.12 11.18 11.26 11.15 11.12 11.02 11.23 11.17 11.26140 11.1 11.1 11.0 11.0 11.0 11.07 11.07 11.09 11.09 11.09 11.10 11.16 11.18 11.14 11.12 11.01 11.18 11.15 11.25150 11.1 11.0 11.0 10.9 11.0 11.10 11.06 11.09 11.09 11.07 11.10 11.15 11.18 11.14 11.12 11.01 11.15 11.15 11.25Dissolved Oxygen (g m -3 )Depth (m)0 10.5 10.1 9.2 9.5 8.9 8.3 7.9 9.2 8.7 8.5 8.1 9.0 9.0 9.2 9.3 9.1 8.9 8.2 8.710 10.7 10.2 9.8 9.8 8.9 8.6 7.9 9.2 8.6 8.3 8.3 9.0 9.0 9.4 9.5 8.7 8.8 8.4 8.320 10.7 9.9 9.8 9.9 8.9 8.7 8.1 9.2 8.8 8.5 8.7 9.0 9.1 9.4 9.5 8.7 9.1 8.4 8.530 10.6 10.0 9.8 9.7 8.9 8.7 8.3 9.0 8.8 8.5 8.6 9.0 9.1 9.6 9.5 8.7 8.9 8.4 8.540 10.6 9.7 9.5 9.6 8.8 8.7 8.1 8.3 8.2 8.6 8.6 9.0 9.1 9.6 9.5 9.1 8.7 8.2 8.250 10.4 9.9 9.5 9.3 8.6 8.7 8.0 8.0 7.9 8.2 8.6 9.0 9.1 9.6 9.5 9.1 8.5 8.2 8.260 10.4 9.8 9.4 9.2 8.6 8.6 8.0 8.0 7.9 7.7 8.7 9.0 9.1 9.7 9.5 8.7 8.4 8.0 7.970 10.3 9.7 9.3 9.0 8.6 8.7 8.0 8.0 7.8 7.7 8.4 8.9 9.1 9.7 9.5 8.7 8.3 7.9 7.880 10.3 9.0 9.2 9.0 8.5 8.5 7.9 7.9 7.7 7.6 7.6 7.8 9.0 9.7 9.5 8.7 8.2 7.6 7.690 8.1 8.6 9.2 9.0 8.6 8.5 7.7 7.9 7.8 7.4 7.4 7.4 8.9 9.7 9.5 8.7 8.2 7.6 7.6100 7.9 7.3 9.2 8.9 8.6 8.5 8.3 7.7 7.6 7.4 7.3 7.2 8.7 9.7 9.5 8.7 8.0 7.5 7.6110 7.5 7.1 9.1 8.9 8.6 8.3 8.1 7.7 7.6 7.6 7.4 7.1 8.3 9.7 9.5 8.7 8.0 7.5 7.5120 7.4 6.8 9.1 8.9 8.3 8.4 8.1 7.7 7.4 7.5 7.3 6.9 7.9 9.7 9.5 8.2 8.1 7.4 7.4130 7.3 6.7 9.0 8.8 7.9 8.2 8.0 7.5 7.4 7.5 7.3 6.9 7.3 9.7 9.5 8.5 8.1 7.4 7.3140 7.1 6.7 8.9 8.7 7.5 8.1 8.0 7.5 7.2 7.4 7.2 6.9 7.1 9.7 9.5 8.6 8.0 7.3 7.2150 6.9 6.4 8.9 8.6 7.5 8.0 7.5 7.2 6.8 7.0 6.9 6.8 7.4 9.7 9.3 8.5 7.9 7.3 7.1Secchi depthDepth (m) 16 14.5 10 10 14.9 18 19.1 15 14 14 14 11 12 15 12 13 11 12 17<strong>Lake</strong> <strong>Taupo</strong> Long-<strong>term</strong> Monitoring Programme 2010 - 2011 71
<strong>Lake</strong> <strong>Taupo</strong> Temperature, Dissolved Oxygen, and Secchi Depth Database. 1998-1999For the period starting 28 July 1998TemperatureDate 28-7-98 22-8-98 29-9-98 1-11-98 26-11-98 22-12-98 12-2-99 3-3-99 14-4-99 30-4-99 19-5-99 1-6-99 17-6-99 13-7-99 6-8-99 3-9-99 29-9-99 18-10-99Depth (m)0 11.4 11.5 12.9 13.6 18.4 18.5 20.1 20.9 18.3 16.4 14.4 14.2 13.0 12.0 11.8 11.8 11.5 12.810 11.6 11.3 11.9 13.2 15.6 16.7 20.1 19.8 18.3 16.4 14.4 14.1 13.4 12.0 11.4 11.3 11.5 12.720 11.6 11.3 11.5 12.7 15.4 15.7 20.1 19.8 18.3 16.4 14.5 14.1 13.4 12.0 11.4 11.2 11.5 12.430 11.6 11.3 11.3 12.4 12.7 14.5 14.9 15.1 18.1 16.0 14.5 14.1 13.4 12.0 11.4 11.1 11.4 11.640 11.6 11.3 11.2 12.4 12.1 12.7 13.2 13.1 12.9 13.1 14.5 13.9 13.4 12.0 11.3 11.1 11.2 11.450 11.6 11.3 11.1 12.2 11.8 11.8 12.1 12.1 11.9 12.2 13.1 13.0 13.4 12.0 11.3 11.1 11.1 11.360 11.6 11.3 11.1 11.7 11.5 11.5 11.6 11.8 11.6 12.0 11.8 12.0 12.1 12.0 11.3 11.0 11.1 11.170 11.6 11.1 11.0 11.2 11.3 11.3 11.4 11.5 11.4 11.8 11.3 11.4 11.5 12.0 11.3 11.0 11.0 11.180 10.6 10.9 11.0 11.1 11.2 11.2 11.2 11.4 11.3 11.2 11.2 11.3 11.3 11.4 11.3 11.0 11.0 11.090 10.6 10.9 10.9 11.1 11.1 11.1 11.1 11.3 11.2 11.1 11.1 11.2 11.2 11.3 11.3 11.0 11.0 11.0100 10.5 10.8 10.9 11.0 11.1 11.1 11.1 11.3 11.2 11.1 11.1 11.1 11.2 11.2 11.2 11.0 11.0 11.0110 10.5 10.5 10.9 11.0 11.0 11.1 11.1 11.2 11.2 11.1 11.1 11.1 11.1 11.2 11.2 11.0 11.0 11.0120 10.5 10.5 10.9 11.0 11.0 11.0 11.0 11.2 11.2 11.1 11.1 11.1 11.1 11.2 11.1 11.0 11.0 11.0130 10.5 10.5 10.7 11.0 11.0 11.1 11.1 11.1 11.1 11.1 11.0 11.1 11.1 11.1 11.1 11.0 11.0 11.0140 10.5 10.5 10.7 10.9 11.0 11.1 11.1 11.1 11.1 11.1 11.0 11.1 11.0 11.1 11.1 11.0 11.0 11.0150 10.5 10.5 10.7 10.9 11.0 11.1 11.1 11.1 11.1 11.1 11.0 11.1 11.0 11.1 11.0 11.0 10.9 11.0Dissolved Oxygen (g m -3 )Depth (m)0 10.6 10.6 10.6 10.4 9.6 9.7 9.0 8.6 9.1 9.5 9.9 10.0 10.4 10.5 10.1 9.2 9.5 8.910 10.5 10.5 10.7 10.7 9.9 10.1 9.0 8.7 9.2 9.5 10.5 10.4 10.3 10.7 10.2 9.8 9.8 8.920 10.4 10.4 10.6 10.7 9.8 10.2 8.9 8.7 9.1 9.6 10.4 10.4 10.4 10.7 9.9 9.8 9.9 8.930 10.4 10.3 10.5 10.6 10.1 10.2 9.9 9.5 9.1 9.6 10.1 10.7 10.5 10.6 10.0 9.8 9.7 8.940 10.3 10.3 10.3 10.4 10.0 10.1 9.9 9.2 9.1 9.1 10.0 10.4 10.4 10.6 9.7 9.5 9.6 8.850 10.3 10.2 10.2 10.2 9.8 9.9 9.6 8.9 9.0 8.7 9.2 9.6 10.4 10.4 9.9 9.5 9.3 8.660 10.3 10.1 10.1 10.0 9.7 9.7 9.5 8.8 8.9 8.7 8.7 9.4 9.0 10.4 9.8 9.4 9.2 8.670 10.3 9.5 9.9 9.6 9.5 9.5 9.4 8.7 8.7 8.6 8.3 9.1 8.9 10.3 9.7 9.3 9.0 8.680 8.6 8.2 9.5 9.1 9.2 9.3 9.2 8.6 8.6 8.4 8.2 9.1 8.6 10.3 9.0 9.2 9.0 8.590 8.5 7.9 9.3 8.8 9.1 9.1 9.1 8.4 8.6 8.0 7.8 8.8 8.5 8.1 8.6 9.2 9.0 8.6100 8.3 7.4 8.9 8.5 9.1 8.9 8.9 8.3 8.6 8.0 7.7 8.5 8.2 7.9 7.3 9.2 8.9 8.6110 8.3 7.4 8.5 8.3 8.8 8.9 8.7 8.2 8.5 8.0 7.5 8.2 8.1 7.5 7.1 9.1 8.9 8.6120 8.2 7.4 7.7 8.0 8.6 8.8 8.3 7.9 8.3 7.9 7.4 8.2 8.0 7.4 6.8 9.1 8.9 8.3130 8.2 7.4 7.6 7.8 8.4 8.6 8.1 7.7 8.1 7.7 7.3 8.1 7.7 7.3 6.7 9.0 8.8 7.9140 8.1 7.4 7.4 7.6 8.2 8.4 7.9 7.5 7.9 7.5 7.2 7.8 7.4 7.1 6.7 8.9 8.7 7.5150 8.1 7.4 7.4 7.6 8.0 8.2 7.7 7.3 7.7 7.3 7.0 7.5 7.3 6.9 6.4 8.9 8.6 7.5Secchi depthDepth (m) 10.0 10.5 10.4 13.5 15.0 14.5 12.5 14.3 13.0 12.2 15.0 15.0 15.0 16.0 14.5 10.0 10.0 14.972 <strong>Lake</strong> <strong>Taupo</strong> Long-<strong>term</strong> Monitoring Programme 2010 - 2011
<strong>Lake</strong> <strong>Taupo</strong> Temperature, Dissolved Oxygen, and Secchi Depth Database. 1997-1998For the period starting 16 September 1997TemperatureDate 16-9-97 11-10-97 28-10-97 02-12 -97 21-1 -98 04-3-98 24-3-98 26-3-98 07-4-98 29-5-98 28-7-98 22-8-98Depth (m)1 10.8 11.8 12.2 14.5 17.7 20.0 19.3 18.6 17.7 14.2 11.4 11.4910 10.5 11.4 12.0 13.7 17.6 19.9 18.6 18.6 17.7 14.3 11.6 11.3220 10.5 11.1 11.5 13.6 16.5 19.7 18.5 18.5 17.7 14.0 11.6 11.2730 10.5 10.8 11.5 13.1 14.3 16.4 18.0 18.1 17.5 13.1 11.6 11.2740 10.5 10.6 11.4 12.5 12.0 13.3 13.0 12.6 13.7 12.0 11.6 11.2750 10.5 10.5 11.1 11.5 11.2 12.0 11.9 11.7 11.5 11.2 11.6 11.2660 10.5 10.5 11.1 11.0 11.0 11.5 11.1 11.1 11.0 10.9 11.6 11.2670 10.5 10.5 10.8 10.8 10.8 11.0 10.7 10.8 10.8 10.8 11.6 11.1280 10.5 10.5 10.7 10.7 10.7 10.8 10.6 10.7 10.6 10.6 10.6 10.9090 10.5 10.5 10.6 10.6 10.6 10.7 10.5 10.6 10.6 10.6 10.6 10.86100 10.5 10.5 10.5 10.5 10.6 10.7 10.5 10.6 10.6 10.6 10.5 10.82110 10.5 10.5 10.4 10.5 10.6 10.6 10.5 10.5 10.5 10.6 10.5 10.5120 10.5 10.5 10.5 10.5 10.5 10.6 10.5 10.5 10.5 10.5 10.5 10.5130 10.5 10.5 10.5 10.5 10.5 10.6 10.5 10.5 10.5 10.5 10.5 10.5140 10.5 10.5 10.5 10.5 10.5 10.5 10.5 10.5 10.5 10.5 10.5 10.5150 10.5 10.5 10.5 10.5 10.5 10.5 10.5 10.5 10.5 10.5 10.5 10.5Dissolved Oxygen (g m -3 )Depth (m)1 10.55 10.37 10.68 9.89 9.27 9.17 9.43 9.10 9.14 9.92 10.60 10.6410 10.52 10.51 10.22 9.86 9.38 9.19 9.53 9.07 9.10 9.88 10.46 10.5020 10.50 10.46 10.24 9.86 9.46 9.22 9.61 8.95 9.07 9.87 10.40 10.3630 10.29 10.46 10.00 9.74 9.81 9.30 9.78 8.97 9.09 9.68 10.35 10.2740 10.31 10.39 9.96 9.66 9.85 9.32 9.73 9.47 9.32 9.40 10.32 10.2650 10.27 10.36 9.89 9.47 9.53 9.16 9.55 9.45 9.34 9.26 10.30 10.2060 10.16 10.31 9.77 9.44 9.37 9.17 9.30 9.47 9.30 9.18 10.28 10.1070 10.08 10.24 9.76 9.19 9.30 9.11 9.21 9.38 9.24 9.20 10.25 9.5480 10.06 10.15 9.85 9.04 9.13 9.04 9.14 9.30 9.13 9.12 8.58 8.1590 10.03 10.09 9.33 9.00 9.10 8.93 9.03 9.24 9.05 9.08 8.52 7.90100 9.99 10.06 9.23 8.96 9.01 8.89 8.39 9.16 8.97 8.94 8.34 7.36110 9.96 10.02 9.03 8.87 8.89 8.83 8.38 8.98 8.94 8.78 8.26 7.36120 9.91 10.00 8.96 8.87 8.84 8.75 8.38 8.87 8.88 8.69 8.21 7.36130 9.86 9.92 8.76 8.84 8.68 8.63 8.38 8.38 8.79 8.41 8.21 7.36140 9.82 9.87 8.76 8.71 8.45 8.30 8.38 8.38 8.58 8.41 8.14 7.36150 9.56 9.69 8.76 8.65 8.38 8.22 8.38 8.38 8.40 8.41 8.14 7.36Secchi depth data (m)Depth (m) 12.0 13.7 12.5 14.5 14.7 11.5 13.5 13.5 13.5 15.5 10.0 10.5<strong>Lake</strong> <strong>Taupo</strong> Long-<strong>term</strong> Monitoring Programme 2010 - 2011 73
<strong>Lake</strong> <strong>Taupo</strong> Temperature, Dissolved Oxygen, and Secchi Depth Database. 1996-1997For the period starting 3 September 1996TemperatureDate 3-9-96 17-9-96 27-9-96 17-10-96 24-10-96 6-11-96 28-11-96 11-12-96 23-12-96 8-1-97 29-1-97 26-3-97 2-4-97 15-4-97 20-5-97 29-5-97 7-7-97 29-7-97Depth (m)1 10.5 10.7 12.5 13.3 12.6 13.5 13.6 14.8 16.3 17.9 17.8 17.7 17.3 16.7 14.1 14.2 11.7 10.910 10.4 10.6 11.6 12.0 12.3 13.6 13.6 14.8 15.3 16.8 17.6 17.6 17.3 16.7 14.0 14.1 11.7 11.020 10.3 10.4 11.1 11.9 12.3 13.4 13.3 14.4 15.1 16.5 17.4 17.2 17.2 16.7 14.0 14.1 11.7 11.030 10.3 10.3 11.0 11.8 12.3 13.3 13.3 14.2 15.0 15.6 14.8 16.6 17.2 16.7 12.6 14.1 11.7 11.040 10.3 10.3 10.5 11.7 11.9 11.7 11.6 12.7 13.5 13.0 13.4 13.8 14.5 14.0 11.5 14.0 11.7 11.050 10.4 10.3 10.4 11.5 11.6 10.8 10.9 12.5 12.4 11.9 11.8 12.4 11.5 11.9 11.0 12.1 11.7 11.060 10.3 10.3 10.4 10.9 11.1 10.6 10.9 11.7 11.3 11.2 10.9 11.2 10.9 11.1 10.5 11.8 11.7 11.070 10.3 10.3 10.3 10.6 10.6 10.5 10.5 11.7 10.7 10.8 10.7 10.7 10.6 10.9 10.5 11.1 11.7 11.080 10.3 10.3 10.3 10.5 10.5 10.4 10.4 11.1 10.6 10.6 10.6 10.5 10.5 10.7 10.5 10.8 10.9 11.090 10.3 10.3 10.3 10.4 10.4 10.4 10.4 10.4 10.5 10.5 10.4 10.5 10.5 10.6 10.5 10.6 10.8 10.9100 10.3 10.3 10.3 10.3 10.4 10.4 10.4 10.4 10.4 10.4 10.4 10.4 10.5 10.5 10.5 10.5 10.6 10.7110 10.3 10.3 10.3 10.3 10.3 10.3 10.3 10.4 10.4 10.4 10.4 10.4 10.4 10.5 10.5 10.5 10.5 10.6120 10.3 10.3 10.3 10.3 10.3 10.3 10.3 10.4 10.4 10.4 10.4 10.4 10.4 10.5 10.5 10.5 10.5 10.5130 10.3 10.3 10.3 10.3 10.3 10.3 10.3 10.4 10.4 10.4 10.4 10.4 10.4 10.5 10.5 10.5 10.5 10.5140 10.3 10.3 10.3 10.3 10.3 10.3 10.3 10.4 10.3 10.3 10.3 10.4 10.4 10.5 10.5 10.5 10.5 10.5150 10.3 10.3 10.3 10.3 10.3 10.3 10.3 10.3 10.3 10.3 10.3 10.4 10.4 10.5 10.4 10.4 10.5 10.5Dissolved Oxygen (g m -3 )Depth (m)1 8.81 9.08 10.03 9.78 10.32 9.96 9.99 10.03 9.10 8.71 8.80 9.70 9.40 9.06 9.09 9.3 9.9 10.5310 9.17 9.17 10.43 9.85 10.27 9.84 9.87 9.97 9.30 8.70 8.80 9.30 9.25 8.95 9.10 9.2 9.8 10.4220 9.14 8.98 10.32 9.84 10.15 9.80 9.80 9.90 9.30 8.70 8.70 8.93 8.94 8.91 9.06 9.2 9.8 10.4530 8.98 8.95 10.16 9.84 9.89 9.79 9.81 9.76 9.30 8.80 9.10 8.80 8.82 8.87 9.01 9.2 9.8 10.4340 8.90 8.93 9.98 9.80 9.89 9.73 9.77 9.70 9.30 9.00 8.90 8.78 8.79 8.82 8.94 9.1 9.8 10.4650 8.78 8.87 9.69 9.76 9.80 9.29 9.35 9.10 9.30 8.80 8.90 8.51 8.58 8.65 8.86 9.1 9.7 10.4060 8.73 8.80 9.54 9.67 9.67 9.19 9.14 9.04 9.15 8.60 8.70 8.49 8.56 8.71 8.70 9.0 9.7 10.3670 8.74 8.80 9.45 9.56 9.44 9.14 9.09 9.03 9.07 8.60 8.60 8.47 8.52 8.71 8.64 8.9 9.7 10.3480 8.70 8.77 9.37 9.42 9.33 9.03 9.01 9.01 9.00 8.60 8.50 8.36 8.46 8.69 8.48 8.5 8.6 10.3490 8.63 8.70 9.24 9.29 9.30 8.99 8.96 8.92 8.98 8.60 8.50 8.30 8.45 8.63 8.32 8.3 8.2 10.24100 8.59 8.61 9.11 9.22 9.21 8.94 8.93 8.88 8.95 8.60 8.40 8.27 8.40 8.54 8.29 8.2 8.1 8.70110 8.48 8.49 9.13 9.15 9.20 8.90 8.87 8.80 8.89 8.50 8.30 8.18 8.29 8.48 8.27 8.1 8.0 8.02120 8.44 8.33 9.07 8.91 8.98 8.77 8.74 8.73 8.85 8.40 8.20 8.08 8.20 8.41 8.22 8.1 8.0 8.05130 8.19 8.27 9.07 8.83 8.98 8.71 8.69 8.69 8.66 8.30 8.30 7.96 8.02 8.20 8.19 8.1 7.9 8.09140 8.39 8.35 9.05 8.89 8.89 8.62 8.65 8.60 8.33 8.20 8.20 7.40 7.60 7.87 7.97 7.8 7.4 7.79150 8.81 8.84 8.98 8.49 8.94 8.48 8.43 8.47 8.25 8.10 8.10 7.40 7.50 7.71 7.88 7.7 7.2 7.13Secchi depth data (m)Secchi d 13.1 14..2 11.2 12.6 13.4 14.9 14.1 14.7 17.7 15.1 15.2 15.3 16.0 17.7 14.6 14.5 12.5 13.574 <strong>Lake</strong> <strong>Taupo</strong> Long-<strong>term</strong> Monitoring Programme 2010 - 2011
<strong>Lake</strong> <strong>Taupo</strong> Temperature, Dissolved Oxygen, and Secchi Depth Database. 1995-1996For the period starting 12 September 1995TemperatureDate 12-9-95 25-9-95 30-10-95 24-11-95 06-12-95 12-1-96 31-1-96 13-2-96 29-2-96 20-3-96 28-3-96 18-4-96 19-5-96 14-6-96 9-7-96Depth (m)1 10.7 13.7 17.7 21.1 21.7 22.7 20.5 18.2 16.8 17.7 14.8 12.2 11.210 10.7 11.9 16.2 20.7 20.7 21.0 20.1 18.2 16.7 17.4 14.8 12.2 11.220 10.7 11.4 15.3 18.1 18.5 20.6 20.0 18.2 16.6 17.3 14.8 12.1 11.230 10.7 11.2 12.4 14.8 13.5 15.1 15.5 18.1 13.7 17.0 14.8 12.1 11.240 10.7 10.9 11.4 12.4 12.3 12.2 11.9 12.3 12.4 12.6 14.7 12.0 11.250 10.7 10.8 11.0 11.5 11.6 11.6 11.3 11.4 11.6 11.4 11.6 11.2 11.260 10.7 10.7 10.7 11.0 11.2 11.0 11.0 11.1 11.4 11.1 11.1 10.9 11.270 10.7 10.5 10.6 10.9 10.8 10.8 10.8 10.9 11.6 11.1 10.9 10.8 11.280 10.5 10.5 10.6 10.9 10.7 10.7 10.7 10.8 11.2 10.9 10.8 10.8 11.290 10.4 10.5 10.6 10.7 10.7 10.7 10.7 10.7 11.3 10.8 10.7 10.8 10.8100 10.4 10.5 10.5 10.6 10.6 10.7 10.7 10.7 10.9 10.8 10.7 10.7 10.8110 10.4 10.5 10.5 10.5 10.6 10.7 10.7 10.6 10.8 10.8 10.7 10.7 10.8120 10.4 10.5 10.5 10.5 10.5 10.6 10.6 10.6 10.7 10.7 10.7 10.7 10.8130 10.4 10.5 10.5 10.5 10.5 10.7 10.6 10.6 10.7 10.7 10.7 10.7 10.8140 10.4 10.5 10.5 10.5 10.5 10.6 10.6 10.6 10.7 10.7 10.7 10.7 10.8150 10.4 10.5 10.5 10.5 10.5 10.6 10.6 10.6 10.6 10.7 10.7 10.7 10.8160 10.4 * 10.5 10.5 10.5 * * * * * * * *Dissolved oxygen (g m -3 )Depth (m)1 9.6 10.3 9.5 8.5 8.5 8.1 8.2 8.4 8.7 8.6 9.0 9.2 9.310 9.6 10.5 9.9 8.7 8.5 8.1 8.2 8.3 8.7 8.6 9.0 9.2 9.120 9.6 10.6 10.0 9.1 9.1 8.2 8.1 8.3 8.8 8.6 8.9 9.2 9.130 9.6 10.7 10.5 9.7 10.1 9.2 9.0 8.1 9.0 8.4 8.9 9.1 9.040 9.7 10.7 10.5 10.1 10.2 9.5 9.1 8.7 8.8 8.7 8.9 9.0 8.950 9.6 10.3 10.3 9.9 9.9 9.0 9.0 8.6 8.6 8.4 8.7 8.4 8.860 9.5 10.3 10.0 9.6 8.9 8.7 8.8 8.5 8.5 8.4 8.5 8.1 8.770 9.4 10.2 10.0 9.6 8.9 8.6 8.6 8.5 8.5 8.4 8.3 7.9 8.780 9.4 10.2 9.9 9.6 8.8 8.5 8.5 8.4 8.3 8.4 8.3 7.8 8.690 9.0 10.1 9.8 9.5 8.8 8.4 8.4 8.3 8.2 8.3 8.2 7.7 8.1100 9.0 10.0 9.7 9.4 8.8 8.3 8.3 8.3 8.2 8.3 8.1 7.7 7.5110 9.0 9.9 9.6 9.4 8.8 8.1 8.3 8.2 8.1 7.9 7.8 7.6 7.3120 8.8 9.9 9.4 9.3 8.3 8.1 8.3 8.1 8.3 7.9 7.8 7.5 7.1130 8.8 9.8 9.3 9.2 8.3 7.9 8.2 7.8 8.3 7.8 7.8 7.5 7.1140 8.7 9.6 9.1 8.9 7.9 7.6 8.2 7.5 8.0 7.6 7.7 7.4 7.0150 8.7 9.2 8.9 8.7 7.9 7.6 8.0 7.4 7.8 7.4 7.5 7.4 7.0Secchi depthDepth (m) 11.9 11.9 13.0 13.6 15.1 16.3 15.7 17.8 18.4 14.1 14.6 14.4 14.7 14.4 12.9<strong>Lake</strong> <strong>Taupo</strong> Long-<strong>term</strong> Monitoring Programme 2010 - 2011 75
<strong>Lake</strong> <strong>Taupo</strong> Temperature, Dissolved Oxygen, and Secchi Depth Database. 1994-1995Started 27 October 1994TemperatureDate 27-10-94 21-11-94 01-12-94 13-12 -94 27-12 -94 13-1 -95 25-1 -95 09-2 -95 26-2 -95 08-3 -95 24-3-95 12-4-95 19-4-95 04-5-95 21-5-95 08-6-95 14-7-95 30-7-95Depth (m)1 11.7 12.8 15.7 17.5 17.8 18.6 19.9 20.6 20.9 20.9 18.5 19.4 18.4 17.0 15.0 13.4 11.3 10.810 11.5 12.6 14.2 16.4 17.3 18.4 19.9 20.0 19.9 19.8 18.4 18.6 18.2 16.9 15.0 13.5 11.3 10.820 11.5 12.6 13.2 15.5 16.9 18.0 17.8 19.6 19.9 19.7 18.4 18.4 18.2 16.8 15.0 13.4 11.3 10.830 11.3 12.6 13.0 13.2 13.3 15.9 15.6 15.0 15.0 15.1 18.4 15.7 16.5 14.6 15.0 13.4 11.3 10.840 10.9 12.6 12.1 12.5 12.2 13.1 13.3 12.9 13.0 12.8 12.7 13.0 12.5 12.2 12.7 13.3 11.3 10.850 10.9 12.4 11.4 11.7 11.6 12.0 11.8 11.9 11.9 11.8 12.0 11.8 11.6 11.3 11.7 12.8 11.2 10.860 10.8 11.8 10.7 11.1 * 11.4 11.5 11.4 11.1 11.2 11.3 11.3 11.1 11.2 11.3 11.7 11.2 10.870 10.7 10.9 10.6 10.8 * * 11.2 11.0 10.9 10.9 11.0 10.9 10.9 10.9 11.0 11.2 11.2 10.880 10.6 10.7 10.5 10.7 * * 11.0 10.8 10.8 10.8 10.8 10.8 10.8 10.8 10.8 11.0 10.9 10.890 10.5 10.6 10.5 10.6 * * 10.7 10.7 10.7 10.7 10.7 10.7 10.7 10.7 10.8 10.8 10.8 10.8100 10.5 10.5 10.5 10.5 * * 10.7 10.6 10.7 10.7 10.7 10.7 10.7 10.7 10.7 10.8 10.7 10.8110 10.5 10.5 10.4 10.4 * * 10.6 10.6 10.6 10.6 10.7 10.7 10.7 10.7 10.7 10.8 10.7 10.8120 10.4 10.4 10.4 10.4 * * 10.6 10.5 10.6 10.6 10.6 10.7 10.7 10.7 10.7 10.8 10.7 10.8130 10.4 10.4 10.4 10.3 * * 10.5 10.5 10.6 10.6 10.6 10.6 10.7 10.7 10.7 10.8 10.7 10.8140 10.4 10.3 10.4 10.3 * * 10.5 10.5 10.6 10.6 10.6 10.6 10.7 10.6 10.7 10.8 10.7 10.8150 10.3 10.3 10.3 10.3 * * 10.5 10.5 10.6 10.6 10.6 10.6 10.6 10.6 10.7 10.8 10.7 10.8160 10.3 10.3 10.3 10.3 * * 10.5 10.5 10.6 10.6 10.6 10.6 10.6 10.7 * 10.7 * *Dissolved oxygen (g m -3 )Depth (m)1 10.5 9.6 9.8 9.2 9.0 8.0 8.9 8.4 8.5 8.5 8.7 * 9.2 9.3 9.0 9.0 9.6 9.610 10.6 9.4 10.3 9.4 10.6 10.4 10.2 8.5 8.4 8.0 * * 9.3 9.1 8.8 9.1 9.6 9.520 10.8 9.4 10.3 9.4 11.0 10.5 11.5 8.5 8.4 8.0 * * 9.2 9.0 8.8 9.1 9.4 9.430 10.7 9.4 10.2 9.7 12.5 11.2 11.4 9.8 9.6 9.7 * * 9.3 9.2 8.7 9.0 9.4 9.340 10.5 9.3 10.1 9.6 12.5 11.9 12.0 9.7 9.4 9.7 * * 9.7 9.3 8.6 9.0 9.3 9.350 10.4 9.3 9.9 9.5 12.6 11.9 12.0 9.4 9.4 9.5 * * 9.5 9.2 8.5 8.8 9.2 9.360 10.4 9.4 9.9 9.5 * 10.3 11.9 9.4 9.3 9.4 * * 9.5 9.2 8.5 8.3 9.2 9.270 10.4 * 9.8 9.5 * * 11.7 9.3 9.3 9.3 * * 9.5 9.2 8.4 8.3 9.2 9.280 10.4 * 9.8 9.5 * * 11.6 9.3 8.9 9.1 * * 9.0 9.2 8.3 8.3 8.5 9.190 10.4 * 9.7 9.5 * * 11.4 9.2 8.8 9.0 * * 8.7 9.0 8.1 7.9 8.3 9.0100 10.2 * 9.6 9.4 * * 11.3 9.0 8.6 8.8 * * 8.6 8.6 8.0 7.6 7.8 8.9110 10.3 * 9.7 9.3 * * 11.1 9.0 8.3 8.7 * * 8.3 8.2 8.0 7.5 7.4 8.8120 10.2 * 9.4 9.2 * * 10.9 8.7 8.2 8.4 * * 8.2 7.9 7.8 7.1 7.2 8.6130 9.8 * 9.2 9.0 * * 10.6 8.5 7.9 8.3 * * 8.0 7.7 7.6 7.0 7.2 8.4140 9.8 * 8.9 9.0 * * 10.5 8.3 7.6 8.1 * * 8.0 7.5 7.4 7.0 7.1 8.4150 9.9 * 8.6 8.7 * * 10.4 8.3 7.3 7.9 * * 7.5 7.3 7.0 7.0 7.1 8.3160 * * 8.5 8.5 * * 10.0 8.2 7.5 7.7 * * 6.6 7.2 * 6.8 * *Secchi depthDepth(m) 11.7 11.4 12.5 12.9 15.6 17.8 15.7 17.0 16.5 17.1 14.7 15.7 16.1 15.1 14.3 15.0 12.5 15.7* = missing or invalid data76 <strong>Lake</strong> <strong>Taupo</strong> Long-<strong>term</strong> Monitoring Programme 2010 - 2011
Appendix 4. Nutrient dataIncludes accumulated 10-m tube data since 1994. Blank cells represent missing data.For completeness, 10-m tube data collected from the Kuratau Basin (site B) and WesternBays (site C) from January 2002 to December 2004 are included as separate sheetsfollowing the mid-lake data from site A for those years.In the spring/autumn profile data, two different analytical methods are used to measureparticulate nitrogen:1. a wet digestion method involving high temperature refluxing in digestion mixture[persulphate / sulphuric acid / Selenium catalyst] for 3 hours followed by colorimetricde<strong>term</strong>ination of the nitrogen as the ammoniacal form; and2. a CHN combustion method which converts all nitrogen compounds to N 2 gas in afurnace at ~1000°C to be measured in a thermal conductivity detector.Particulate nitrogen analysed by the wet digestion method may not include some refractorynitrogen components which may be detected by the CHN combustion furnace method.Consequently the PN value from the CHN combustion furnace method should always begreater than or equal to the PN value obtained by the wet digestion method. Occasionallythey are reported as less than the wet digestion method value in which case the wetdigestion value should be regarded as correct. The cause of this difference is unknown butmay be associated with the presence of low molecular weight organic nitrogen compoundslost during the drying step before combustion. The PN values for the time series data are allfrom wet digestion method analyses and hence are directly comparable with the profile data.Low level NH 4 -N results are likely to be subject to interference from low molecular weightDON and hence may not be biologically available for phytoplankton growth.From February 2002, DRP, NO 3 -N, and NH 4 -N were measured on a Lachat Flow InjectionAnalysis (FIA) system but using essentially the same chemistry as previously used on theTechnical Auto-Analyzer system. The reported detection limits for these nutrients remainsthe same at 0.5 mg m -3 for DRP and NO 3 -N, and 1 mg m -3 for NH 4 -N, however, the greaterprecision of the FIA system provides confidence in reporting results to a lower level as anindication of likely absolute values near zero. Such values are provided as an indication onlyand the true value should be expressed as less than the detection limit. TN and TP valuesare the sum of all N and P components, excluding Urea-N which is part of the DONcomponent. All analytical values ‘on-the-day’ are used wherever possible or
<strong>Lake</strong> <strong>Taupo</strong> cumulative database of 10m tube sample data from October1994 to September 2002.Samples collected from central lake site.Date Temp. Secchi DRP DOP PP TP NH4-N NO3-N DON PN TN Chlorophyll a PCCollectedo C m mg m -3 mg m -3 mg m -3 mg m -3 mg m -3 mg m -3 mg m -3 mg m -3 mg m -3 mg m -3 mg m -327/10/1994 11.7 11.7 1.2 0.7 2.5 4.4 1.1 0.2 56 16.6 73.4 1.1624/11/1994 12.8 11.4 0.5 2.7 1.7 4.8 1.7 1.0 51 12.6 66.5 0.411/12/1994 15.7 12.5 0.6 2.4 2.4 5.4 2.2 1.2 56 18.5 78.0 0.4113/12/1994 17.5 12.9 0.8 4.2 1.4 6.4
<strong>Lake</strong> <strong>Taupo</strong> cumulative database of 10 m tube sample data from June 2000 onSamples collected from Mid <strong>Lake</strong> (Site A)Date Collected Temp. Secchi DRP DOP PP TP NH 4 -N NO 3 -N DON PN TN Chlorophyll a PCºC (m) (mg m -3 ) (mg m -3 ) (mg m -3 ) (mg m -3 ) (mg m -3 ) (mg m -3 ) (mg m -3 ) (mg m -3 ) (mg m -3 ) (mg m -3 ) (mg m -3 )20/06/2000 12.3 14.0
Date Collected Temp. Secchi DRP DOP PP TP NH 4 -N NO 3 -N DON PN TN Chlorophyll a PCºC (m) (mg m -3 ) (mg m -3 ) (mg m -3 ) (mg m -3 ) (mg m -3 ) (mg m -3 ) (mg m -3 ) (mg m -3 ) (mg m -3 ) (mg m -3 ) (mg m -3 )29/08/2002 11.1 9.5 1.6 1.4 3.1 6.1 0.0 0 90 23 113.0 2.6 19618/09/2002 11.4 12 1.3 1.7 2 5.0 0 0.3 47 13 60.3 0.9 196.59/10/2002 11.6 15.5 1.3 2.7 2.1 6.1 2.9 0 29 12 43.9 0.6 159.513/11/2002 12.6 18 0.9 1.1 2.4 4.4 1.7 1.3 41 14.0 58.0 0.7 158.528/11/2002 14.1 12.7 0.7 2.3 2.7 5.7 0.1 0.0 43.0 22.0 65.1 0.7 201.518/12/2002 15.0 13.5 0.6 1.8 2.5 4.9 0.2 0.1 47.0 14.0 61.3 0.4 123.030/01/2003 17.8 18 0.4 3.6 1.9 5.9 0.4 0.1 56.5 12.0 69.0 0.7 166.013/02/2003 19.3 19 0.5 2.5 1.6 4.6 0.0 0.4 43.6 8.0 52.0 0.5 146.017/03/2003 18.5 15 0.8 2.2 1.7 4.7
Date Collected Temp. Secchi DRP DOP PP TP NH 4 -N NO 3 -N DON PN TN Chlorophyll a PCºC (m) (mg m -3 ) (mg m -3 ) (mg m -3 ) (mg m -3 ) (mg m -3 ) (mg m -3 ) (mg m -3 ) (mg m -3 ) (mg m -3 ) (mg m -3 ) (mg m -3 )11/01/2005 16.0 20 0.4 2.6 1.4 4.4 0 0.1 42.9 12.5 55.5 0.2 13725/01/2005 19.3 19.5 0.5 2.5 1.5 4.5 0.0 0.1 54.9 14.5 69.5 0.3 131.09/02/2005 20.7 18 2.2 0.8 1.4 4.4 0.5 0.0 38.5 12.7 51.7 0.2 136.022/02/2005 20.0 21.5 0.8 5.2 1.7 7.7 1.5 0.5 58.0 15.8 75.8 0.2 159.010/03/2005 19.3 18.5 0.2 2.8 1.4 4.4 1.8 0.2 34.0 14.5 50.5 0.4 158.021/03/2005 19.3 20 0.8 3.2 1.2 5.2 0.5 0.1 43.4 10.0 54.0 0.5 140.014/04/2005 17.9 17.2 0.9 2.1 1.6 4.6 0.8 0.2 54.0 14.0 69.0 0.7 177.018/05/2005 14.3 16 0.8 2.2 1.9 4.9 0.0 0.5 46.5 13.9 60.9 1.3 177.59/06/2005 13.0 14.1 0.6 3.4 2.2 6.2 0.1 1.6 41.3 17.4 60.4 1.3 140.520/06/2005 12.7 13.8 0.6 3.4 2.0 6.0 0.1 1.0 39.9 18.5 59.5 1.2 158.520/07/2005 11.5 13 3.9 6.1 2.5 12.5 0.8 0.8 97.4 19.1 118.1 2.1 1693/08/2005 11.1 14 2.6 1.4 2.3 6.3 2.0 1.4 61.6 20.3 85.3 1.2 11617/08/2005 11.2 13 3.1 1 3.2 7.3 0.3 2.1 49.6 26.4 78.4 1.7 172.531/08/2005 11.7 13 2 1 2.4 5.4
Date Collected Temp. Secchi DRP DOP PP TP NH 4 -N NO 3 -N DON PN TN Chlorophyll a PCºC (m) (mg m -3 ) (mg m -3 ) (mg m -3 ) (mg m -3 ) (mg m -3 ) (mg m -3 ) (mg m -3 ) (mg m -3 ) (mg m -3 ) (mg m -3 ) (mg m -3 )8/05/2007 19.3 16 1.1 3.9 1.2 6.2 0.3 0.4 63.3 17.8 81.8 1.2 16922/05/2007 15.2 18.5 0.7 2.3 1.3 4.3 2.0 0.5 53.5 15.4 71.4 0.8 20114/06/2007 13.6 18 0.6 2.4 1.8 4.8 4.0 0.8 65.2 21.8 91.8 1 15927/06/2007 12.4 18.5 0.8 0.2 3.6 4.6 2.1 1.4 45.5 25.8 74.8 1.2 16218/07/2007 11.4 14.5 1.1 1.9 2.9 5.9 1.3 1.0 44.7 37.8 84.8 1.78/08/2007 11.1 14 1.1 1.9 2.8 5.8 2.0 2.2 46.8 28.2 79.2 1.3 22923/08/2007 11.0 13 0.8 2.2 2.5 5.5 0.4 0.4 39.2 30.3 70.3 2.2 20211/09/2007 11.0 11 1 4 3.3 8.3 0 1 67 34.7 102.7 1.4 3249/10/2007 12.1 15 1 1 2.6 4.6 1.4 1.5 59.1 23.8 85.8 0.8 18430/10/2007 12.8 16 1.1 0.9 2.4 4.4 1.2 0.6 64.2 30.5 96.5 0.7 25315/11/2007 13.5 14 1.8 2.2 2.1 6.1 1.8 0.3 53.9 24.8 80.8 0.5 2624/12/2007 16.6 15 0.9 2.1 2 5 0.9 0.6 40.5 20.6 62.6 0.3 19620/12/2007 17.4 17.5 1.1 2.9 1.1 5.1 0.2 0.4 44.4 17 62 0.6 11217/01/2008 21.1 22.5 1 4 1.5 6.5 0.9 0.4 62.7 24.5 88.5 0.3 23031/01/2008 19.8 21.5 0.5 1.5 1.3 3.3 1.5 0.3 75.2 17.6 94.6 0.3 19014/02/2008 19.9 25 0.3 1.7 1.6 3.6 1.4 0.7 75.9 19.8 97.8 0.4 13827/02/2008 19.3 22 0.1 1.9 1.6 3.6 0.7 0.2 70.1 20 91 0.4 14313/03/2008 18.8 22 1 1 1.2 3.2 1.2 0.6 56.2 19.6 77.6 0.5 14726/03/2008 19.3 19 1 0 0.9 1.9 0.4 0.5 63.1 17.1 81.1 0.5 16017/04/2008 17.8 20.5 1.2 0.8 1.3 3.3 1.1 1 51.9 14.2 68.2 0.8 1897/05/2008 15.7 16 0.7 2.3 1.5 4.5 1.3 0.3 60.4 21.1 83.1 0.6 18922/05/2008 14.7 17 0.2 1.8 1.5 3.5 0.4 0.4 71.2 23.6 95.6 0.7 1915/06/2008 13.6 15 1.3 0.7 1.6 3.6 1 2.1 29.9 17.5 50.5 1 17719/06/2008 12.9 16.5 0.5 1.5 1.6 3.6 2 0.7 34.3 29.2 66.2 1.2 2591/07/2008 12.0 14 0.9 2.1 2.15 5.15 0.6 0.7 50.7 34.6 86.6 1.7 24215/07/2008 11.4 13 1.3 1.7 2.7 5.7 0.0 0.9 38.1 26.5 65.5 1.9 1937/08/2008 11.1 12.5 1.8 1.2 3.4 6.4 0.0 0.7 25.3 28.8 54.8 3.0 11920/08/2008 10.7 12.5 1.3 1.7 2.1 5.1 0.7 0.6 24.7 25 51 1.5 1794/09/2008 11.0 13 0.6 3.4 2 6 1.0 0.0 50 21.5 72.5 1.1 21716/09/2008 11.3 14.5 1.4 2.6 2.1 6.1 2.2 0.5 28.3 24.3 55.3 0.7 20214/10/2008 12.6 12.2 0.5 2.5 2.6 5.6 0.5 0.0 45.5 27.1 73.1 0.6 2034/11/2008 13.4 12 1.0 4 2.5 7.5 3.2 0.5 35.3 28.5 67.5 0.9 14026/11/2008 15.7 10 1.1 1.9 2.4 5.4 0.4 0.0 47.6 27.6 75.6 1 21722/12/2008 18.8 12 0.3 1.7 2.3 4.3 1.8 0.0 53.2 35.2 90.2 0.6 24513/01/2009 19.7 13 1.4 1.6 2.1 5.1 0.3 1.4 61.3 29.4 92.4 0.5 26628/01/2009 20.9 18 0.4 4.6 1.8 6.8 0.0 3.8 52.2 27.6 83.6 0.3 20411/02/2009 21.4 22 0.1 4.9 1.6 6.6 4.1 0.5 49.4 25.6 79.6 0.4 185.525/02/2009 20.5 20 0.5 2.5 1.6 4.6 2.7 0.4 37.9 21.3 62.3 0.5 186.526/03/2009 18.0 18.5 1.1 1.9 2.7 5.7 0.0 1.3 56.7 25.1 83.1 0.6 28515/04/2009 16.6 18 1.5 2.5 3.4 7.4 1.1 0.7 60.8 22.7 85.3 0.8 2407/05/2009 15.0 16 1.4 4.6 2.3 8.3 1.3 1.1 56.6 21.7 80.7 1.3 22327/05/2009 13.0 15 1.2 4.8 1.5 7.5 0.0 0.6 58.4 16.7 75.7 1.2 19018/06/2009 11.6 16 1.9 0.1 1.7 3.7 0.7 1.7 45.6 23.5 71.5 1.5 2016/07/2009 10.9 15 2.8 1.2 2.4 6.4 0.1 8.1 46.8 23.4 78.4 1.6 19013/08/2009 10.43 12 1.9 2.1 2.7 6.7 0.6 0.5 46.9 31.4 79.4 1.9 2307/09/2009 10.56 15 4.2 0 2.9 7.1 0.1 0.6 54.3 32.3 87.3 1.5 30182 <strong>Lake</strong> <strong>Taupo</strong> Long-<strong>term</strong> Monitoring Programme 2010 - 2011
Date Collected Temp. Secchi DRP DOP PP TP NH 4 -N NO 3 -N DON PN TN Chlorophyll a PCºC (m) (mg m -3 ) (mg m -3 ) (mg m -3 ) (mg m -3 ) (mg m -3 ) (mg m -3 ) (mg m -3 ) (mg m -3 ) (mg m -3 ) (mg m -3 ) (mg m -3 )19/10/2009 11.72 13 4.2 0 2.7 6.9 0.5 1.1 42.4 23.4 67.4 0.6 282.512/11/2009 13.00 12.5 1.2 2.8 2.4 6.4 1.0 0.3 33.7 19.5 54.5 0.7 24917/12/2009 16.99 15 0.9 2.1 1.4 4.4 0.0 0.7 58.3 21 80.0 0.7 239.513/01/2010 17.89 14.5 0.6 1.4 1.8 3.8 0.0 1.0 47 21.6 69.6 0.6 306.52/02/2010 19.23 16 0.7 2.3 1.7 4.7 0.0 0.1 55.9 28.3 84.3 0.8 274.518/02/2010 20.45 17 1.1 1.9 3.9 6.9 1.3 2.3 102.4 85.4 191.4 0.9 53010/03/2010 20.10 19 0.8 2.2 1.3 4.3 0.0 4 58 19.1 81.1 0.4 158.58/04/2010 17.40 21.5 0.8 2.2 1.7 4.7 0.0 1.2 58.8 26 86.0 0.7 23128/04/2010 16.38 19 1.2 1.8 2.5 5.5 0.3 1.1 61 39.6 101.6 0.9 26220/05/2010 15.09 19.5 1.9 1.1 2.1 5.1 7.6 2.5 66.9 25.1 102.1 0.9 2483/06/2010 14.11 14.5 0.9 2.1 1.8 4.8 1.1 0.1 44.8 13.7 59.7 1.1 141.523/06/2010 12.23 14 1.1 1.9 2.4 5.4 1.1 0.8 46.1 22.1 70.1 1.1 196.513/07/2010 11.31 14.5 1.5 7.5 2.3 11.3 0.9 1.0 52.1 27.9 81.9 1.7 21710/08/2010 11.01 12.8 1.7 1.3 2.6 5.6 0.9 1.0 30.1 29.7 61.7 1.9 22524/08/2010 10.92 11 1.6 1.4 1.5 4.5 0.6 0.5 30.9 34.5 66.5 2.4 244.513/09/2010 11.37 10.5 1.1 0.9 3.3 5.3 1.3 0.3 28.4 33.7 63.7 1.6 342.55/10/2010 11.90 10.8 3.1 0 2.5 5.6 2.0 2.3 28.7 22.8 55.8 0.9 26926/10/2010 13.00 12.5 1.7 1.3 2.4 5.4 0.9 0.9 34.2 18.2 54.2 0.8 23710/11/2010 13.98 11.5 0.8 2.2 2.3 5.3 0.5 0.3 59.2 21.1 81.1 0.7 250.525/11/2010 16.14 14.2 1.4 2.6 1.7 5.7 2.9 1.4 41.7 18 64.0 0.4 184.58/12/2010 15.5 1.2 2.8 1.8 5.8 1.8 0.6 43.6 18.3 64.3 0.4 18121/12/2010 18.41 17 0.8 3.2 1.8 5.8 5.7 0.4 66.9 41.4 114.4 0.4 259.511/01/2011 19.81 11 0.8 1.2 1.9 3.9 1.8 0.5 48.7 27.1 78.1 0.5 281.527/01/2011 19.69 17 1.0 1 1.7 3.7 1.4 0.7 45.9 21.5 69.5 0.4 178.517/02/2011 20.61 12 0.9 1.1 2.1 4.1 0.5 0.5 57 23.6 81.6 0.5 2241/03/2011 20.41 19 0.5 2.5 1.5 4.5 0.7 0.9 48.4 19.9 69.9 0.6 150.515/03/2011 20.07 15 3.0 0 1.4 4.4 0.2 2.7 50.1 21.6 74.6 0.5 179.513/04/2011 17.62 17 3.1 0 1.5 4.6 0.0 0.8 64.2 24.7 89.7 0.8 22310/05/2011 15.53 16.5 1.4 2.6 1.5 5.5 0.9 0.9 74.2 17.5 93.5 0.7 20731/05/2011 14.05 17 1.2 0.8 1.6 3.6 0.3 0.8 44.9 22.5 68.5 0.9 166.522/06/2011 12.95 14 0.4 1.6 2 4 1.1 0.4 42.5 22 66 1.0 190.55/07/2011 12.13 13 1.0 1 1.8 3.8 0.0 0.2 41.8 28.8 70.8 1.3 2339/08/2011 11.10 16 1.8 1.2 2.3 5.3 3.4 5.0 75.6 24.7 108.7 1.7 34624/08/2011 10.86 9 1.6 1.4 2.8 5.8 1.0 0.2 86.8 39.2 127.2 1.6 3117/09/2011 11.22 16 0.6 3.4 1.8 5.8 2.0 1.1 44.9 23.2 71.2 0.8 19828/09/2011 10.96 13 1.0 2 2.9 5.9 2.0 0.8 59.2 32.1 94.1 1.2 341<strong>Lake</strong> <strong>Taupo</strong> Long-<strong>term</strong> Monitoring Programme 2010 - 2011 83
<strong>Lake</strong> <strong>Taupo</strong> cumulative database of 10 m tube sample dataSamples collected from Kuratau Basin (Site B)Date Collected Temp. Secchi DRP DOP PP TP NH 4 -N NO 3 -N DON PN TN Chlorophyll a PCo C m mg m -3 mg m -3 mg m -3 mg m -3 mg m -3 mg m -3 mg m -3 mg m -3 mg m -3 mg m -3 mg m -38/01/2002 18.1 13.5 0.4 2 2.2 4.6 0.4 1.3 48 16.7 66.4 0.9 23322/01/2002 18.8 12 0.9 2 2.6 5.5 0.9 0.3 41 19.9 62.1 0.9 2216/03/2002 18.6 14.5 0.3 2 2.3 4.6 1.4 0.5 73 18.3 93.2 0.9 2074/04/2002 17.4 19.5 0.6 2 1.5 4.1 0.4 0.1 40 11.2 51.7 0.9 16217/04/2002 16.8 19 0.0 3 1.6 4.6 0.5 0.1 45 12.3 57.9 0.9 1435/05/2002 15.1 13.2 0.3 1.1 1.6 0.4 40 0.919/06/2002 12.5 15 1.0 1 2.2 4.2 0.4 0.8 48.2 17.4 66.8 1.5 1821/07/2002 12.1 16 1.5 1.5 1.8 4.8 0.8 1.7 41.5 14.2 58.2 1.6 14617/07/2002 11.5 12.5 1.8 2.2 2 6 0.8 5.1 51.1 16.1 73.1 1.5 156.531/07/2002 11.3 10.5 2.0 3 2.5 7.5 1.5 2.2 81.5 18.5 103.7 2.6 194.529/08/2002 11.0 8 1.2 4.8 3.3 9.3 0 0.2 184.0 22.9 207.1 2.3 22118/09/2002 11.1 11 1.9 2.1 2.1 6.1 0.4 0.6 43.4 14 58.4 1.1 1499/10/2002 11.7 16 1.4 1.6 1.7 4.7 4.4 0.2 19.6 11.7 35.9 0.5 14913/11/2002 12.0 14 1 3 2.5 6.5 0.3 0 35 15.2 50.5 1.8 47828/11/2002 13.8 12.7 0.9 2.9 2 5.8 0 0 40 16.7 56.7 0.7 203.518/12/2002 15.2 14 0.6 1.4 2.1 4.1 0 0.1 36 11.2 47.3 0.4 14330/01/2003 16.8 18 0.5 2.5 1.7 4.7
Date Collected Temp. Secchi DRP DOP PP TP NH 4 -N NO 3 -N DON PN TN Chlorophyll a PCºC (m) (mg m -3 ) (mg m -3 ) (mg m -3 ) (mg m -3 ) (mg m -3 ) (mg m -3 ) (mg m -3 ) (mg m -3 ) (mg m -3 ) (mg m -3 ) (mg m -3 )26/02/2004 16.8 13.5 1.1 1.9 1.8 4.8 0.6 0.1 42.3 15.8 58.8 0.8 157.08/03/2004 17.6 5.0 0.8 2.2 3.1 6.1 1.0 0.3 41.7 17.5 60.5 0.9 172.031/03/2004 15.9 11.0 0.8 3.2 1.8 5.8 0.7 0.2 45.1 9.9 55.9 1.4 124.514/04/2004 15.0 14.0 0.9 4.1 2.2 7.2 0.6 0.3 52.1 14.9 67.9 1.3 171.510/05/2004 14.7 15.5 0.8 2.2 1.7 4.7 0.0 0.2 59.8 15.9 75.9 1.3 179.010/06/2004 12.9 12.0 1.4 2.6 2.1 6.1 0.0 0.2 108.8 18.6 127.6 1.2 183.013/07/2004 11.4 11.0 2.1 2.9 2.5 7.5 0.0 8.4 40.6 19.3 68.3 1.4 154.026/07/2004 11.2 10.0 1.3 2.7 3.2 7.2 0.2 5.8 38.0 25.0 69.0 2.7 204.024/08/2004 10.9 10.0 0.7 3.3 3.1 7.1 0.0 0.0 47.0 20.9 67.9 2.5 158.07/09/2004 10.8 11.0 0.7 2.3 2.6 5.6 0.0 0.2 44.8 17.1 62.1 1.5 172.521/10/2004 11.7 11.0 1.2 1.8 2.1 5.1 0.2 0.0 30.8 16.1 47.1 0.8 172.52/11/2004 13.1 15.0 1.0 2.0 1.7 4.7 0.2 0.1 42.7 11.0 54.0 0.5 152.022/11/2004 14.9 15.0 0.6 3.4 1.6 5.6 0.6 0.0 33.4 9.5 43.5 0.5 141.515/12/2004 13.2 17.2 0.6 3.4 1.6 5.6 0.4 0.1 39.5 12.6 52.6 0.2 120.0<strong>Lake</strong> <strong>Taupo</strong> Long-<strong>term</strong> Monitoring Programme 2010 - 2011 85
<strong>Lake</strong> <strong>Taupo</strong> cumulative database of 10 m tube sample dataSamples collected from Western Bays (site C)Date Collected Temp. Secchi DRP DOP PP TP NH 4 -N NO 3 -N DON PN TN Chlorophyll a PCo C m mg m -3 mg m -3 mg m -3 mg m -3 mg m -3 mg m -3 mg m -3 mg m -3 mg m -3 mg m -3 mg m -38/01/2002 18.72 14.5 0.9 4 2.3 7.2 0.9 0.6 88 16.1 105.6 0.8 21322/01/2002 18.82 15.5 0.7 2 2.2 4.9 0.7 0.0 37 16.8 54.5 0.8 2216/03/2002 18.68 16 0.2 2 2 4.2 0 0.1 45 16 61.1 0.7 1774/04/2002 17.47 19 0.6 2 1.4 4 0.0 0.0 38 8.8 46.8 0.9 15217/04/2002 16.88 18.5 0 3 1.6 4.6 0.7 0.2 44 11.8 56.7 0.9 1675/05/2002 15.6 15.6 0.4 1 2 0.2 45 1.119/06/2002 12.58 16 0.9 2.1 2 5 0.3 1.2 38.8 15.9 56.2 0.9 1611/07/2002 12.22 14 1.3 1.7 1.9 4.9 0.3 0.4 45 15 60.7 1.4 14817/07/2002 11.52 12.5 1.9 2.1 2 6 0.9 4.9 46.1 16.3 68.2 1.5 16031/07/2002 11.6 12 2.3 2.7 2.3 7.3 1.7 4.0 113.3 16.7 135.7 2.3 15029/08/2002 11.4 8 1 3 3.2 7.2 0 0 177 22.3 199.3 2.4 21718/09/2002 11.24 12 2.8 2.2 2 7 1.7 0.4 45.3 11.7 59.1 0.9 1529/10/2002 12.10 19 1.5 1.5 1.7 4.7 0.3 0.2 28 10.2 38.7 0.4 11613/11/2002 12.60 16 1.1 2.9 2 6 0.1 0 51 12.2 63.3 0.6 14128/11/2002 13.90 15.5 0.9 2.1 2 5 0.4 0.4 40 14.4 55.2 0.8 125.518/12/2002 15.10 13.5 0.8 2.2 1.9 4.9 0 0.3 45 10.2 55.5 0.5 136.530/01/2003 17.60 18.5 0.5 2.5 1.5 4.5
Date Collected Temp. Secchi DRP DOP PP TP NH 4 -N NO 3 -N DON PN TN Chlorophyll a PCºC (m) (mg m -3 ) (mg m -3 ) (mg m -3 ) (mg m -3 ) (mg m -3 ) (mg m -3 ) (mg m -3 ) (mg m -3 ) (mg m -3 ) (mg m -3 ) (mg m -3 )21/10/2003 13.0 12.0 1.5 1.5 3.1 6.1 0.3 0.0 44.7 17.4 62.4 1.1 195.019/11/2003 14.3 17.2 1.5 1.5 2.3 5.3 0.8 0.0 38.2 14.4 53.4 0.7 123.04/12/2003 15.5 17.0 1.7 3.3 1.7 6.7 0.0 0.2 46.8 11.2 58.2 0.5 129.018/12/2003 17.0 19.0 0.5 4.5 1.5 6.5 0.0 0.0 47.0 9.9 56.9 0.4 124.513/01/2004 20.2 17.5 0.7 4.3 1.6 6.6 0.0 0.1 53.0 11.9 65.0 0.4 118.526/02/2004 16.9 14.0 0.9 2.1 2.2 5.2 0.8 0.4 40.8 17.2 59.2 0.7 156.08/03/2004 18.4 13.0 0.8 2.2 2.0 5.0 0.7 0.1 34.2 11.1 46.1 0.6 124.031/03/2004 16.4 12.5 0.6 3.4 2.0 6.0 0.7 0.3 51.0 12.3 64.3 1.2 175.514/04/2004 15.4 16.5 0.9 3.1 2.3 6.3 0.6 0.3 50.1 14.2 65.2 1.2 159.010/05/2004 14.9 16.0 0.8 3.2 1.6 5.6 0.0 0.2 48.8 15.4 64.4 1.1 153.010/06/2004 13.1 14.0 0.8 2.2 2.0 5.0 0.0 0.2 41.8 16.6 58.6 1.0 151.013/07/2004 11.6 12.5 1.3 2.7 2.5 6.5 0.0 5.9 39.1 19.9 64.9 1.6 156.526/07/2004 11.5 11.0 1.5 2.5 2.9 6.9 0.3 2.7 46.0 22.2 71.2 2.4 180.524/08/2004 10.9 10.0 1.0 3.0 2.9 6.9 0.0 0.4 37.6 18.5 56.5 2.5 161.07/09/2004 11.1 12.0 1.2 3.8 2.6 7.6 0.0 0.0 54.0 16.8 70.8 1.5 202.021/10/2004 11.7 12.0 1.1 1.9 1.9 4.9 0.2 0.0 35.8 14.8 50.8 0.6 167.52/11/2004 12.4 17.0 1.0 3.0 1.7 5.7 0.3 1.2 45.5 16.3 63.3 0.4 173.022/11/2004 14.8 16.0 0.5 3.5 1.7 5.7 0.0 0.2 37.8 10.8 48.8 0.5 149.015/12/2004 14.2 20.8 0.9 4.1 1.4 6.4 0.0 0.0 42.0 12.2 54.2 0.2 131.0<strong>Lake</strong> <strong>Taupo</strong> Long-<strong>term</strong> Monitoring Programme 2010 - 2011 87
<strong>Lake</strong> <strong>Taupo</strong> biannual nutrient database 2010-2011 Started 27 October 1994Collection date 10 November 2010Secchi depth = 11.5 mCode Depth pH EC @25oC Temp DO SS VSS Chlor_a DRP DOP PP TP NH 4 -N NO 3 -N DON UREA PN* TN DOC PC PN** SO 4m S cm -1 o C g m -3 g m -3 g m -3 mg m -3 mg m -3 mg m -3 mg m -3 mg m -3 mg m -3 mg m -3 mg m -3 mg m -3 mg m -3 mg m -3 mg m -3 mg m -3 mg m -3 g m -3KD1 1 7.8 121 14.12 9.4 1.0
<strong>Lake</strong> <strong>Taupo</strong> biannual nutrient database 2009-2010 Started 27 October 1994Collection date 9 October 2009 Secchi depth = 13.0 mCode Depth pH EC @25oC Temp DO SS VSS Chlor_a DRP DOP PP TP NH 4 -N NO 3 -N DON UREA PN* TN DOC PC PN**m mS cm -1 o C g m -3 g m -3 g m -3 mg m -3 mg m -3 mg m -3 mg m -3 mg m -3 mg m -3 mg m -3 mg m -3 mg m -3 mg m -3 mg m -3 mg m -3 mg m -3 mg m -3OT1 1 7.89 118 11.72 11.67 0.6
<strong>Lake</strong> <strong>Taupo</strong> biannual nutrient database 2008-2009 Started 27 October 1994Collection date 14 October 2008 Secchi depth = 12.2 mCode Depth pH EC @25oC Temp DO SS VSS Chlor_a DRP DOP PP TP NH 4 -N NO 3 -N DON UREA PN* TN DOC PC PN**m mS cm -1 o C g m -3 g m -3 g m -3 mg m -3 mg m -3 mg m -3 mg m -3 mg m -3 mg m -3 mg m -3 mg m -3 mg m -3 mg m -3 mg m -3 mg m -3 mg m -3 mg m -3SZ1 1 7.66 119 12.59 10.29 1.1
<strong>Lake</strong> <strong>Taupo</strong> biannual nutrient database 2007-2008 Started 27 October 1994Collection date 30 October 2007 Secchi depth = 12.8 mCode Depth pH EC @25oC Temp DO SS VSS Chlor_a DRP DOP PP TP NH 4 -N NO 3 -N DON UREA PN* TN DOC PC PN**m mS cm -1 o C g m -3 g m -3 g m -3 mg m -3 mg m -3 mg m -3 mg m -3 mg m -3 mg m -3 mg m -3 mg m -3 mg m -3 mg m -3 mg m -3 mg m -3 mg m -3 mg m -3ZA1 1 7.80 119 12.84 10.18 0.7
<strong>Lake</strong> <strong>Taupo</strong> biannual nutrient database 2006-2007 Started 27 October 1994Collection date 1 November 2006 Secchi depth = 14.5 mCode Depth pH EC @25oC Temp DO SS VSS Chlor_a DRP DOP PP TP NH 4 -N NO 3 -N DON UREA PN* TN DOC PC PN**m mS cm -1 o C g m -3 g m -3 g m -3 mg m -3 mg m -3 mg m -3 mg m -3 mg m -3 mg m -3 mg m -3 mg m -3 mg m -3 mg m -3 mg m -3 mg m -3 mg m -3 mg m -3HW1 1 7.79 118 12.43 10.2 0.5
<strong>Lake</strong> <strong>Taupo</strong> biannual nutrient database 2005-2006 Started 27 October 1994Collection date 25 October 2005 Secchi depth = 15.0 mCode Depth pH EC @25oC Temp DO SS VSS Chlor_a DRP DOP PP TP NH 4 -N NO 3 -N DON UREA PN* TN DOC PC PN**m mS cm -1 o C g m -3 g m -3 g m -3 mg m -3 mg m -3 mg m -3 mg m -3 mg m -3 mg m -3 mg m -3 mg m -3 mg m -3 mg m -3 mg m -3 mg m -3 mg m -3 mg m -3QD1 1 7.81 119 13.40 10.1
<strong>Lake</strong> <strong>Taupo</strong> biannual nutrient database 2004-2005 Started 27 October 1994Collection date 21 October 2004 Secchi depth = 15.0 mCode Depth pH EC @25oC Temp DO SS VSS Chlor_a DRP DOP PP TP NH 4 -N NO 3 -N DON UREA PN* TN DOC PC PN**m mS cm -1 o C g m -3 g m -3 g m -3 mg m -3 mg m -3 mg m -3 mg m -3 mg m -3 mg m -3 mg m -3 mg m -3 mg m -3 mg m -3 mg m -3 mg m -3 mg m -3 mg m -3VZ1 1 7.88 122 11.75 10.4 0.6 0.5 0.6 1.3 2.7 1.6 5.6 0.1 0.4 39.5 19 9.7 49.7 500 110.0 8VZ2 10 7.82 120 11.61 10.2 0.8 0.6 0.8 1.1 2.9 2.0 6.0 0.2 0.1 35.7 24 12.8 48.8 447 157.0 8.5VZ3 20 7.87 120 11.59 10.1 0.9 0.7 0.8 1.0 3.0 1.9 5.9 0.0 0.0 33.0 16 11.3 44.3 440 153.0 8.5VZ4 30 7.91 123 11.59 10.2 1.5 1.0 0.7 1.0 2.0 1.9 4.9 0.0 0.0 34.0 15 11.3 45.3 490 157.5 8VZ5 40 7.82 117 11.58 10.1 1.1 0.6 0.7 1.4 3.6 2.0 7.0 0.2 0.1 33.7 7 11.2 45.2 445 155.0 10VZ6 50 7.83 120 11.58 9.9 1.1 0.7 0.9 1.0 4.0 2.1 7.1 0.0 0.1 33.9 9 13.2 47.2 494 197.5 15VZ7 60 7.79 119 11.15 9.9 1.1 0.7 1.0 1.6 2.4 2.3 6.3 0.5 0.4 34.1 11 26.0 61.0 585 167.0 16VZ8 70 7.66 118 10.79 9.7 0.7 0.5 1.0 1.9 1.1 1.9 4.9 2.4 0.8 40.8 21 11.5 55.5 468 114.0 11.5VZ9 80 7.63 118 10.74 9.6 0.6
<strong>Lake</strong> <strong>Taupo</strong> biannual nutrient database 2003-2004 Started 27 October 1994Collection date 19 November 2003 Secchi depth = 16.0 mCode Depth pH EC @25oC Temp DO SS VSS Chlor_a DRP DOP PP TP NH 4 -N NO 3 -N DON UREA PN* TN DOC PC PN**m mS cm -1 o C g m -3 g m -3 g m -3 mg m -3 mg m -3 mg m -3 mg m -3 mg m -3 mg m -3 mg m -3 mg m -3 mg m -3 mg m -3 mg m -3 mg m -3 mg m -3 mg m -3EU1 1 7.84 119 13.96 9.9
<strong>Lake</strong> <strong>Taupo</strong> biannual nutrient 2002-2003 Started 27 October 1994Collection date 13 November 2002 Secchi depth = 18.0 mCode Depth pH EC @25oC Temp DO SS VSS Chlor_a DRP DOP PP TP NH 4 -N NO 3 -N DON UREA PN* TN DOC PC PN**m mS cm -1 o C g m -3 g m -3 g m -3 mg m -3 mg m -3 mg m -3 mg m -3 mg m -3 mg m -3 mg m -3 mg m -3 mg m -3 mg m -3 mg m -3 mg m -3 mg m -3 mg m -3NZ1 1 7.87 122 12.58 10.2 0.6
<strong>Lake</strong> <strong>Taupo</strong> biannual nutrient database 2001-2002 Started 27 October 1994Collection date 12 November 2001 Secchi depth = 15.5 mCode Depth pH EC @25oC Temp DO SS VSS Chlor_a DRP DOP PP TP NH4-N NO3-N DON UREA PN* TN DOC PC PN**mS cm -1 o C g m -3 g m -3 g m -3 mg m -3 mg m -3 mg m -3 mg m -3 mg m -3 mg m -3 mg m -3 mg m -3 mg m -3 mg m -3 mg m -3 mg m -3 mg m -3 mg m -3XH1 1 7.85 122 14.23 9.5 0.5
<strong>Lake</strong> <strong>Taupo</strong> biannual nutrient database 2000-2001 Started 27 October 1994Collection date 26 October 2000 Secchi depth = 11 mCode Depth pH EC @25 o C Temp DO SS VSS Chlor_a DRP DOP PP TP NH4-N NO3-N DON UREA PN* TN DOC PC PN**mS cm -1 o C g m -3 g m -3 g m -3 mg m -3 mg m -3 mg m -3 mg m -3 mg m -3 mg m -3 mg m -3 mg m -3 mg m -3 mg m -3 mg m -3 g m -3 mg m -3 mg m -3FX1 1 7.87 120 12.5 9.1 0.5
<strong>Lake</strong> <strong>Taupo</strong> biannual nutrient database 1999-2000 Started 27 October 1994Collection date 18 October 1999 Secchi depth = 14.9 mCode Depth pH EC @25oC Temp DO SS VSS Chlor_a ++ DRP DOP PP TP NH 4 -N NO 3 -N DON UREA PN* TN DOC PC PN**mS cm -1 o C g m -3 g m -3 g m -3 mg m -3 mg m -3 mg m -3 mg m -3 mg m -3 mg m -3 mg m -3 mg m -3 mg m -3 mg m -3 mg m -3 mg m -3 mg m -3 mg m -3PX1 1 7.71 119 12.8 8.9 0.5
<strong>Lake</strong> <strong>Taupo</strong> biannual nutrient database 1998-1999 Started 27 October 1994Collection date 1 November 1998 Secchi depth = 13.5 mCode Depth pH EC @25oC Temp DO SS VSS Chlor_a DRP DOP PP TP NH4-N NO3-N DON PN* TN DOC PC PN**m S cm -1 o C g m -3 g m -3 g m -3 mg m -3 mg m -3 mg m -3 mg m -3 mg m -3 mg m -3 mg m -3 mg m -3 mg m -3 mg m -3 g m -3 mg m -3 mg m -3DM1 1 7.91 118 13.6 10.4 0.8
<strong>Lake</strong> <strong>Taupo</strong> biannual nutrient database 1997-1998 Started 27 October 1994Collection Date 30 October 1997 Secchi depth = 12.5 mID Depth pH EC @25 o C Temp DO SS VSS Chlor_a DRP DOP PP TP NH 4 NO 3 DON UREA PN* TN DOC PC PN** SO 4m S cm -1 C g m -3 g m -3 g m -3 mg m -3 mg m -3 mg m -3 mg m -3 mg m -3 mg m -3 mg m -3 mg m -3 mg m -3 mg m -3 mg m -3 g m -3 mg m -3 mg m -3 g m -3TT1 1 7.70 116.9 12.2 10.7 0.61 0.30 1.28 1.0 1.3 1.5 3.8 2.1 2.9 36 1.1 14.3 55.3 0.71 168.3 17.2TT2 10 7.71 117.8 12.0 10.2 0.54 0.29 1.49 0.7 1.9 1.9 4.5 1.3 7.3 32 1.1 18.7 59.7 0.82 160.7 18.8TT3 20 7.65 118.1 11.5 10.2 0.59 0.32 1.58 0.8 1.6 1.7 4.0 1.6 0.7 36 1.1 14.0 52.0 0.60 133.0 16.5TT4 30 7.64 118.2 11.5 10.0 0.52 0.25 1.19 0.4 1.5 1.9 3.8 1.5 1.3 31 0.9 15.8 49.8 0.60 146.9 16.0TT5 40 7.62 117.1 11.4 10.0 0.55 0.28 1.31 0.6 1.5 1.6 3.7 1.7 0.3 33 1.0 14.1 49.1 0.62 126.3 13.4TT6 50 7.63 116.9 11.1 9.9 0.37 0.20 1.10 0.4 1.5 1.4 3.2 2.2 0.3 32 0.8 12.3 46.3 0.51 112.1 12.1TT7 60 7.54 117.7 11.1 9.8 0.21 0.10 0.93 1.4 0.7 1.5 3.5 3.3 0.7 34 1.6 14.3 52.3 0.74 80.6 9.0TT8 70 7.45 117.8 10.8 9.8 0.41 0.12 0.79 1.1 1.1 1.1 3.2 8.2 1.3 31 1.5 7.9 47.9 0.65 58.4 4.8TT9 80 7.36 118.3 10.7 9.9 0.31 0.04 0.54 1.5 1.1 0.8 3.3 6.1 2.3 31 0.6 6.0 45.0 0.57 57.6 9.0TT10 90 7.48 117.8 10.6 9.3 0.44 0.27 0.74 1.1 1.2 1.2 3.5 7.9 4.8 33 0.7 12.4 58.4 0.52 69.3 12.2TT11 100 7.29 118.5 10.5 9.2 0.25 0.11 0.40 2.0 1.2 0.8 4.1 8.4 5.0 30 1.1 5.7 48.7 0.63 64.5 8.3TT12 110 6.97 119.3 10.4 9.0 0.21 0.06 0.29 2.3 1.0 1.1 4.3 10.8 5.6 29 2.5 6.7 51.7 0.59 53.0 5.5TT13 120 7.00 119.1 10.5 9.0 0.29 0.26 0.27 2.0 1.2 1.0 4.1 9.9 6.7 31 6.1 5.8 53.8 0.58 37.5 5.3TT14 130 6.80 119.8 10.5 8.8 0.28 0.26 0.28 2.2 1.2 1.3 4.7 10.6 7.1 32 1.5 8.2 58.2 0.56 49.0 6.4TT15 140 7.23 117.9 10.4 8.8 0.25 0.20 0.26 2.7 1.4 1.1 5.2 10.8 9.5 37 2.0 10.9 67.9 0.63 66.0 8.5TT16 150 7.29 118.9 10.4 8.8 0.50 0.27 0.32 2.5 1.1 1.0 4.5 11.6 9.6 37 3.0 7.6 65.6 0.54 69.0 9.2Collection Date:- 7 April 1998 Secchi depth = 13.5 mID Depth pH EC @25 o C Temp DO SS VSS Chlor_a DRP DOP PP TP NH 4 NO 3 DON UREA PN* TN DOC PC PN** SO 4m S cm -1 C g m -3 g m -3 g m -3 mg m -3 mg m -3 mg m -3 mg m -3 mg m -3 mg m -3 mg m -3 mg m -3 mg m -3 mg m -3 mg m -3 g m -3 mg m -3 mg m -3 g m -3YE1 1 8.00 118 17.7 9.1 0.40 0.10 0.67 0.8 1.4 1.3 3.5 2.9 4.6 53 3.7 9.9 70.4 0.83 156.5 14.4 7.7YE2 10 7.99 119 17.7 9.1 0.49 0.12 1.04 0.9 1.4 1.8 4.1 1.9 2.5 52 4.6 13.7 70.1 0.78 179.5 16.0 8.1YE3 20 8.00 119 17.7 9.1 0.32 0.32 1.07 0.7 1.5 1.7 3.9 2.4 1.5 48 3.7 12.6 64.5 0.71 162.5 15.2 8.5YE4 30 7.99 120 17.5 9.1 0.30 0.20 1.06 0.7 1.7 1.6 4.0 2.0 1.2 48 3.7 12.7 63.9 0.78 138.5 14.5 8.0YE5 40 7.60 120 13.7 9.3 0.13 0.13 1.18 1.2 1.0 1.2 3.4 2.0 3.1 39 4.2 8.2 52.3 0.69 112.5 8.2 7.7YE6 50 7.50 120 11.5 9.3 0.34 0.00 0.75 2.4 0.9 0.9 4.2 2.5 4.5 52 3.2 6.5 65.5 0.65 88.0 6.7 7.8YE7 60 7.38 120 11.0 9.3 0.11 0.00 0.49 3.0 0.7 0.8 4.5 1.5 11.7 32 3.2 5.3 50.5 0.72 74.5 5.8 7.7YE8 70 7.32 121 10.8 9.2 0.20 0.00 0.33 3.1 0.9 0.6 4.6 1.0 17.7 38 3.7 4.0 60.7 0.78 57.5 4.1 7.9YE9 80 7.23 120 10.6 9.1 0.24 0.24 0.24 3.5 0.6 0.8 4.9 1.4 23.1 43 6.9 5.7 73.2 0.69 49.5 4.5 7.9YE10 90 7.27 121 10.6 9.1 0.31 0.21 0.17 4.4 0.6 0.7 5.7 1.3 24.1 41 6.5 5.6 72.0 0.68 47.5 4.9 7.9YE11 100 7.29 121 10.6 9.0 0.32 0.11 0.16 4.5 0.7 0.8 6.0 1.0 24.5 39 3.7 6.8 71.3 0.57 58.0 7.4 7.8YE12 110 7.29 121 10.5 8.9 0.35 0.35 0.12 4.8 0.7 0.5 6.0 1.3 25.1 40 5.5 6.5 72.9 0.63 52.5 2.6 7.8YE13 120 7.35 121 10.5 8.9 0.24 0.08 0.37 3.4 0.6 1.2 5.2 1.0 18.9 35 4.6 4.1 59.0 0.75 63.5 3.8 7.7YE14 130 7.24 122 10.5 8.8 0.32 0.16 0.11 5.7 0.6 0.7 7.0 1.0 27.0 39 6.0 3.5 70.5 0.63 52.0 3.9 7.9YE15 140 7.21 122 10.5 8.6 0.45 0.05 0.15 6.4 0.6 1.0 8.0 4.2 29.1 65 10.6 6.7 105.0 0.74 60.5 5.9 7.8YE16 150 7.49 121 10.5 8.4 0.80 0.15 0.62 3.3 1.1 1.6 6.0 2.5 13.0 62 9.7 14.2 91.7 0.70 135.5 13.6 7.9NH 4 , NO 3 , DON, Urea all as N Detection limits: DRP 0.5; NO 3 -N 0.5; NH 4 -N 1.0 mg m -3* = PN by wet digestion method, ** = PN by combustion furnace method.<strong>Lake</strong> <strong>Taupo</strong> Long-<strong>term</strong> Monitoring Programme 2010 - 2011 101
<strong>Lake</strong> <strong>Taupo</strong> biannual nutrient database 1996-1997 Started 27 October 1994Collection Date 24 October 1996 Secchi depth = 12.6 mID Depth pH EC @25 o C Temp DO SS VSS Chlor_a DRP DOP PP TP NH 4 NO 3 DON UREA PN* TN DOC PC PN** SO4m S cm -1 C g m -3 g m -3 g m -3 mg m -3 mg m -3 mg m -3 mg m -3 mg m -3 mg m -3 mg m -3 mg m -3 mg m -3 mg m -3 mg m -3 g m -3 mg m -3 mg m -3 g m -3IG1 1 12.4 10.3 0.45 0.34 0.27 0.6 2.1 1.7 4.4 3.0 0.5 59.3 1.4 13.9 76.7 0.86 171 14.5 7.82IG2 10 12.3 10.3 0.72 0.42 0.47 0.7 2.3 2.2 5.2 2.4 0.4 64.5 1.0 14.5 81.8 0.88 201 16.8 7.90IG3 20 12.3 10.2 0.67 0.40 0.45 0.8 2.8 2.9 6.5 2.6 0.4 75.8 0.6 18.7 97.5 0.91 232 19.8 7.87IG4 30 12.3 9.9 0.85 0.49 0.64 0.6 2.3 3.1 6.0 3.3 0.5 73.6 0.4 20.6 98.0 0.95 198 15.7 7.86IG5 40 11.9 9.9 0.71 0.46 0.56 0.5 1.8 2.5 4.8 2.6 1.2 64.8 0.3 14.6 83.2 0.80 183 12.8 7.84IG6 50 11.6 9.8 0.62 0.34 0.45 1.1 3.1 2.1 6.3 2.9 0.6 71.2 0.9 13.2 87.9 0.92 157 14.9 7.95IG7 60 11.1 9.7 0.77 0.32 0.70 0.9 1.8 2.3 5.0 4.4 13.2 175.4 3.5 14.3 207.3 1.29 151 14.1 10.67IG8 70 10.6 9.4 0.65 0.28 0.54 0.8 1.5 1.9 4.2 2.9 0.8 59.3 1.5 9.2 72.2 0.78 116 10.2 7.85IG9 80 10.5 9.3 0.51 0.27 0.55 0.9 2.5 1.8 5.2 3.0 3.0 76.1 1.3 9.8 91.9 0.95 103 10.8 7.80IG10 90 10.4 9.3 0.49 0.23 0.50 0.6 1.8 1.8 4.2 2.1 1.0 52.3 1.4 10.9 66.3 0.73 95 11.0 7.69IG11 100 10.4 9.2 0.50 0.21 0.51 0.5 1.5 1.8 3.8 1.8 3.6 53.9 4.5 9.6 68.9 1.04 106 12.8 7.85IG12 110 10.4 9.2 0.43 0.23 0.49 0.4 1.3 2.0 3.7 2.5 5.2 54.0 6.0 9.3 71.0 0.80 94 11.5 7.85IG13 120 10.4 9.0 0.47 0.21 0.47 0.8 1.4 1.8 4.0 3.7 9.6 61.9 6.9 8.0 83.2 0.78 78 9.7 7.97IG14 130 10.3 8.9 0.44 0.18 0.38 1.1 1.5 2.3 4.9 4.5 9.7 52.4 4.6 12.0 78.6 1.00 83 8.7 7.99IG15 140 10.3 8.9 0.49 0.22 0.51 1.5 1.6 2.5 5.6 4.3 12.9 57.8 5.0 10.4 85.4 0.99 80 8.9 8.14IG16 150 10.3 8.9 1.13 0.26 0.57 1.2 2.3 3.5 7.0 5.1 13.6 65.9 4.8 14.5 99.1 0.91 121 13.4 8.15Collection Date:- 2 April 1997 Secchi depth = 16.0 mID Depth pH EC @25 o C Temp DO SS VSS Chlor_a DRP DOP PP TP NH 4 NO 3 DON UREA PN* TN DOC PC PN** SO4m S cm -1 C g m -3 g m -3 g m -3 mg m -3 mg m -3 mg m -3 mg m -3 mg m -3 mg m -3 mg m -3 mg m -3 mg m -3 mg m -3 mg m -3 g m -3 mg m -3 mg m -3 g m -3NA1 1 8.02 118.4 17.3 9.4 0.30 0.30 0.63 0.9 2.2 1.5 4.6 4.0 0.6 67.4 4.9 18.1 90.1 0.82 186.5 17.3 7.80NA2 10 8.01 118.3 17.3 9.2 0.20 0.10 0.69 0.9 1.3 1.6 3.8 1.7 0.3 51.0 3.3 14.4 67.4 0.77 190.0 17.1 7.86NA3 20 8.03 118.2 17.2 8.9 0.40 0.30 0.63 0.6 1.2 1.6 3.4 1.8 0.3 51.8 2.2 17.6 71.5 0.75 192.0 19.1 7.85NA4 30 7.98 118.4 17.2 8.8 0.40 0.40 0.52 0.7 1.0 1.5 3.2 2.5 0.6 47.5 2.7 15.2 65.8 0.56 207.5 20.3 7.90NA5 40 7.52 118.5 14.2 8.8 0.20 0.20 0.72 0.8 1.8 1.4 4.0 2.7 0.3 53.2 4.1 13.3 69.5 0.69 158.0 15.2 7.91NA6 50 7.32 119.3 11.3 8.6 0.00 0.00 0.39 1.5 1.4 1.0 3.9 11.2 3.1 54.7 4.5 9.7 78.7 0.62 116.5 10.6 7.88NA7 60 7.18 120.2 10.9 8.6 0.20 0.20 0.16 1.7 1.3 0.8 3.8 3.7 10.1 48.9 2.1 10.5 73.2 0.86 100.0 13.8 7.88NA8 70 7.13 119.6 10.6 8.5 0.10 0.10 0.12 1.9 1.7 0.8 4.4 4.3 11.8 58.3 2.2 8.0 82.4 0.83 75.0 8.7 7.87NA9 80 7.12 120.1 10.5 8.5 0.10 0.10 0.05 3.3 1.4 0.7 5.4 6.9 26.9 82.4 16.9 6.7 122.9 0.98 77.5 9.9 7.90NA10 90 7.12 120.4 10.5 8.5 0.00 0.00 0.25 3.6 2.2 0.7 6.5 28.9 22.9 108.3 7.4 8.1 168.2 0.63 110.5 8.8 8.00NA11 100 7.10 120.4 10.5 8.4 0.20 0.20 0.04 4.4 1.2 0.8 6.4 10.7 22.5 72.0 5.2 7.1 112.3 0.85 71.0 8.3 7.97NA12 110 7.07 120.6 10.4 8.3 0.20 0.20 0.02 3.7 2.0 0.8 6.5 2.9 21.9 52.5 3.8 6.4 83.7 1.01 77.0 9.6 7.93NA13 120 7.07 120.5 10.4 8.2 0.30 0.20 0.02 3.3 2.4 0.8 6.5 6.4 22.8 56.4 4.2 13.0 98.6 0.70 113.5 15.4 7.88NA14 130 7.08 120.4 10.4 8.0 0.20 0.20 0.01 4.3 1.6 0.8 6.7 6.2 27.9 56.7 6.2 8.2 99.0 0.81 118.5 11.0 7.97NA15 140 7.10 121.1 10.4 7.6 0.40 0.40 0.04 4.5 1.7 1.2 7.4 3.9 28.9 58.5 7.9 24.7 116.0 0.80 212.5 28.8 7.91NA16 150 7.10 122.1 10.4 7.5 1.20 0.40 0.07 5.0 1.0 2.7 8.7 8.6 29.0 61.5 11.8 20.2 119.3 2.07 234.5 22.1 7.97NH 4 , NO 3 , DON, Urea all as N Detection limits: DRP 0.5; NO 3 -N 0.5; NH 4 -N 1.0 mg m -3* = analysed by wet digestion method, ** = analysed by CHN combustion furnace method.102 <strong>Lake</strong> <strong>Taupo</strong> Long-<strong>term</strong> Monitoring Programme 2010 - 2011
<strong>Lake</strong> <strong>Taupo</strong> biannual nutrient database 1995-1996Collection Date:- 30 October 1995 Secchi depth = 13.0 mID Depth pH EC @25 o C Temp DO BOD 5 SS VSS Chlor_a DRP DOP PP TP NH 4 NO 3 DON UREA PN* TN DOC PC PN**m S cm -1 C g m -3 g m -3 g m -3 g m -3 mg m -3 mg m -3 mg m -3 mg m -3 mg m -3 mg m -3 mg m -3 mg m -3 mg m -3 mg m -3 mg m -3 g m -3 mg m -3 mg m -3ZH1 1 7.40 115.1 13.7 10.3 0.80 0.60 0.38 0.45
<strong>Lake</strong> <strong>Taupo</strong> biannual nutrient database 1994-1995Collection date:- 27 October 1994 Secchi Depth = 11.7 mID Depth Temp DO BOD 5 SS VSS Chlor_a DRP DOP PP TP NH 4 NO 3 DON UREA PN* TN DOC PC PN** LEADm C g m -3 g m -3 g m -3 g m -3 mg m -3 mg m -3 mg m -3 mg m -3 mg m -3 mg m -3 mg m -3 mg m -3 mg m -3 mg m -3 mg m -3 g m -3 mg m -3 mg m -3 mg m -3MM1 1 11.7 10.5 0.30 0.93 0.55 1.16 1.6 0.7 2.5 4.8 1.1 0.2 61 0.1 16.6 78.9 0.67 193.3 20.3 0.22MM2 10 11.5 10.6 0.35 0.86 0.49 0.97 1.5 0.4 2.5 4.4 2.2 0.1 50
Appendix 5. Phytoplankton dataIn this report phytoplankton abundance is reported in cell counts per ml and biovolume perml. In the previous system reporting only algal dominance, “Dominance” (rank 1 = dominantto rank 10 = rare), was calculated from algal biovolume. For continuance of the Dominanceformat, the species composition is ranked by biovolume.Note: reporting counts as cells per ml rounded to a whole number may result in cell counts of“0” despite a large biovolume where the algal species is large or colonial e.g., BotryococcusbrauniiThe new algal data has been added to this report and the data from the previous yearretained to accumulate, as has been done with temperature, DO, and nutrient data.Note: Leptolyngbya sp. cells on 07/09/2009 (highlighted) are likely to have been washed offsomething rather than being local in 150 m of water.Name changes:Anabaena has changed to Dolichospermum as of August 2009. It will initially be referred toas follows: Dolichospermum sp. (formally; Anabaena sp.).Units of biomass are listed as “µm 3 ” in the following tables. The units are actually µm 3 /mL.From the 2010/11 <strong>monitoring</strong> period, phytoplankton data have been provided from a depth of50m, which generally coincides with the deep chlorophyll a maxima in the lake. This samplewas collected by van Dorne bottle and is distinguished from the 10-m tube sample by beingplaced in a separate table for the same dates as the 10-m tube sample.<strong>Lake</strong> <strong>Taupo</strong> Long-<strong>term</strong> Monitoring Programme 2010 - 2011 105
<strong>Lake</strong> <strong>Taupo</strong> phytoplankton enumeration (10-m tube) 2010-11Cell counts and biovolumeCells per ml numbers may be affected by roundingSample code FY1 FY1 FY5 FY5 HQ1 HQ1 IV4 IV4 KC1 KC1 KS1 KS1 LE1 LE1 LV1 LV1 MJ1 MJ1 MJ4 MJ4 OP1 OP1 PL1 PL1 QN1 QN1 RK1 RK1 TQ1 TQ1 UI1 UI1 UX1 UX1 UT1 UT1 WU1 WU1Sampling date 10/08/2010 10/08/2010 24/08/2010 24/08/2010 13/09/2010 13/09/2010 26/10/2010 26/10/2010 10/11/2010 10/11/2010 25/11/2010 25/11/2010 8/12/2010 8/12/2010 21/12/2010 21/12/2010 11/01/2011 11/01/2011 27/01/2011 27/01/2011 17/02/2011 17/02/2011 1/03/2011 1/03/2011 15/03/2011 15/03/2011 13/04/2011 13/04/2011 10/05/2011 10/05/2011 31/05/2011 31/05/2011 22/06/2011 22/06/2011 5/07/2011 5/07/2011 9/08/2011 9/08/2011composition by class Cell Biovolume Cell Biovolume Cell Biovolume Cell Biovolume Cell Biovolume Cell Biovolume Cell Biovolume Cell Biovolume Cell Biovolume Cell Biovolume Cell Biovolume Cell Biovolume Cell Biovolume Cell Biovolume Cell Biovolume Cell Biovolume Cell Biovolume Cell Biovolume Cell BiovolumeSpecies(per ml) (µm 3 ) (per ml) (µm 3 ) (per ml) (µm 3 ) (per ml) (µm 3 ) (per ml) (µm 3 ) (per ml) (µm 3 ) (per ml) (µm 3 ) (per ml) (µm 3 ) (per ml) (µm 3 ) (per ml) (µm 3 ) (per ml) (µm 3 ) (per ml) (µm 3 ) (per ml) (µm 3 ) (per ml) (µm 3 ) (per ml) (µm 3 ) (per ml) (µm 3 ) (per ml) (µm 3 ) (per ml) (µm 3 ) (per ml) (µm 3 )Blue greens (Cyanophyceae)Dolichospermum c.f. lemmermannii(formally; Anabaena c.f. lemmermannii) 0.8 87 0.8 90 17.1 1980 27.5 3195 44.0 5106 11.2 1299 0.9 100 3.4 398 0.8 94 9.6 1118 5.7 660 21.4 2482 12.2 1411 34.7 4021 26.5 3072 8.5 991 0.1 14 0.2 23 0.0 0Leptolyngbya sp. 1.3 14 0.0 0 0.0 0 0.0 0 0.0 0 0.0 0 0.0 0 0.0 0 0.0 0 0.7 7 1.2 13 0.0 0 0.0 0 0.0 0 0.0 0 0.0 0 0.0 0 0.0 0 0.0 0Anabaena planktonica/Dolichospermumplanctonicum 0.0 0 0.0 0 0.0 0 0.0 0 0.0 0 0.0 0 0.0 0 2.7 1057 0.0 0 0.0 0 0.0 0 0.0 0 0.0 0 0.0 0 0.0 0 0.0 0 0.0 0 0.0 0 0.0 0Anabaena flos-aquae 0.0 0 0.0 0 0.0 0 0.0 0 0.0 0 0.0 0 0.0 0 0.0 0 0.0 0 0.0 0 0.0 0 0.0 0 0.0 0 0.0 0 0.0 0 0.0 0 0.0 0 0.0 0Anabaena sp./ Dolichospermum sp. 0.0 0 0.0 0 0.0 0 0.0 0 0.0 0 0.0 0 0.0 0 0.0 0 0.0 0 0.0 0 0.0 0 0.0 0 0.0 0 0.0 0 0.0 0 0.0 0 0.0 0 1.1 99 0.0 0Anabaena circinalis / Dolichospermumcircinalis 0.3 67 0.0 0 0.0 0 0.0 0 0.0 0 0.0 0 0.0 0 0.0 0 0.0 0 0.0 0 0.0 0 0.0 0 0.0 0 0.0 0 0.0 0 0.0 0 1.4 287 0.0 0 0.0 0Chroococcus sp. 0.0 0 0.0 0 0.0 0 0.0 0 0.0 0 0.0 0 0.0 0 0.0 0 0.1 1 0.0 0 0.0 0 0.0 0 0.0 0 0.0 0 0.0 0 0.0 0 0.0 0 0.0 0 0.1 2Aphanocapsa sp. 1.0 9 0.0 0 0.5 5 0.9 8 0.6 5 0.0 0 0.0 0 0.0 0 0.0 0 0.0 0 0.0 0 0.0 0 0.0 0 3.6 32 0.0 0 0.0 0 0.0 0 16.4 148 3.4 31Heteroleibleinia sp.cf 0.0 0 0.0 0 0.0 0 0.0 0 0.0 0 0.0 0 0.0 0 0.0 0 0.0 0 22.7 409 0.0 0 0.0 0 0.0 0 0.0 0 0.0 0 0.0 0 0.0 0Microcystis sp. 0.4 8 0.0 0 0.0 0 0.0 0 0.0 0 0.0 0 1.5 32 0.0 0 0.0 0 0.0 0 0.0 0 0.0 0 0.0 0 0.0 0 0.0 0 0.0 0 0.0 0 0.0 0 1.8 37Snowella sp. 0.0 0 0.0 0 0.0 0 0.0 0 0.0 0 0.0 0 0.0 0 0.0 0 0.0 0 0.0 0 0.0 0 0.0 0 0.0 0 0.0 0 0.0 0 0.0 0 0.0 0 0.0 0 0.0 0Phormidium sp. 0.0 0 0.0 0 0.4 9 0.0 0 0.0 0 0.0 0 0.0 0 0.0 0 0.0 0 0.0 0 0.0 0 6.6 139 0.0 0 0.5 11 0.0 0 0.0 0 0.0 0 0.0 0 0.0 0Aphanothece sp. 0.0 0 0.0 0 0.0 0 0.0 0 0.0 0 0.0 0 0.0 0 0.0 0 0.0 0 0.0 0 0.0 0 0.0 0 0.0 0 0.0 0 0.0 0 0.0 0 0.0 0 0.0 0 0.0 0Aphanizomenon sp. 0.0 0 0.0 0 0.0 0 0.0 0 0.0 0 0.0 0 0.0 0 0.0 0 0.0 0 0.0 0 0.0 0 0.0 0 0.0 0 0.0 0 0.0 0 0.0 0 0.0 0 0.0 0 0.0 0Pseudanabaena sp. 0.0 0 0.1 3 1.2 23 0.0 0 0.0 0 0.0 0 0.0 0 0.0 0 0.8 15 1.3 25 0.0 0 2.4 46 0.7 13 1.8 35 0.0 0 0.0 0 0.0 0 0.0 0 0.3 5Greens (Chlorophyceae) 0.0 0Actinastrum hantschii 0 0 0 0 11 0 0 0 0 0 0 0 0 0 0 0 0 0 0 0 0 0 0 0 0 0 0 0 0 0 0 0 0 0 0 0 0 0Monoraphidium sp. / Ankistrodesmus falcatus 72 3022 128 5385 121 5090 151 6339 215 9043 77 3249 117 4931 50 2113 58 2431 105 4431 6 250 6 273 10 432 0 0 0 0 0 0 263 11043 184 7725 63 2636Stichococcus contortus 29 526 32 584 60 1071 0 0 15 273 0 0 0 0 0 0 14 253 0 0 0 0 0 0 2 39 0 0 0 0 0 0 4 78 0 0 14 253Kirchneriella contorta 0 0 0 0 0 0 0 0 0 0 0 0 0 0 0 0 0 0 0 0 0 0 0 0 0 0 0 0 0 0 3 107 2 71 0 0 0 0Botryococcus braunii (colonies) 0.0 6160 0.0 18946 0.0 0 0.0 0 0.0 3178 0.0 0 0.0 21852 0.0 0 0.0 0 0.0 0 0.0 0 0.0 36000 0.0 0 0.0 12008 0.0 4358 0.0 16933 0.0 0 0.0 2674 0.0 1462Chlamydomonas sp. 2 341 3 568 5 1022 0 0 0 0 0 0 0 0 0 0 2 341 0 0 0 0 0 0 0 0 0 0 0 0 0 0 0 0 0 0 0 0Crucigeniella sp 3 211 0 0 0 0 0 0 0 0 0 0 0 0 0 0 0 0 0 0 0 0 0 0 0 0 0 0 0 0 0 0 0 0 0 0 0 0Dictyosphaerium 9 506 0 0 33 1815 0 0 0 0 0 0 0 0 0 0 0 0 0 0 0 0 0 0 0 0 0 0 0 0 0 0 15 803 1 30 6 357Gloeocystis planctonica 0 0 0 0 0 0 0 0 0 0 0 0 0 0 0 0 0 0 0 0 0 0 0 0 0 0 0 0 0 0 0 0 0 0 0 0 0 0Elakotothrix gelatinosa 6 682 4 454 6 682 0 0 0 0 0 0 0 0 0 0 2 227 0 0 1 114 6 682 215 22552 2 227 0 0 0 0 2 227 2 227 13 1363Eudorina elegans 16 4155 6 1662 6 1662 0 92 0 0 0 0 0 0 0 0 0 0 0 10 0 0 0 0 0 0 0 18 0 36 0 31 0 20 0 0 15 3878Lagerheimia sp. 0 0 0 0 0 0 0 0 0 0 0 0 0 0 0 0 0 0 0 0 0 0 0 0 0 0 0 0 0 0 0 0 0 0 0 0 0 0Nephrocytium agardhianum 0 0 0 0 0 0 0 0 0 0 0 0 0 0 0 0 0 0 0 0 0 0 0 0 0 0 0 0 0 0 0 0 0 0 0 0 0 0Nephrocytium lunatum 0 0 0 0 0 0 0 0 0 0 0 0 0 0 0 0 0 0 0 0 0 0 0 0 0 0 0 0 0 0 0 0 0 0 0 0 0 0Oocytsis sp. 3 384 6 845 6 922 5 768 6 922 1 154 0 0 3 461 5 691 0 0 14 1997 38 5378 43 6146 44 6223 15 2074 14 1997 5 768 13 1844 4 615Planktosphaeria gelatinosa 0 0 0 0 0 0 0 0 0 0 0 0 0 0 0 0 0 0 0 0 0 0 0 0 0 0 0 0 0 0 0 0 0 0 0 0 0 0Quadrigula lacustrus 0 0 0 0 0 0 0 0 0 0 0 0 0 0 0 0 0 0 0 0 0 0 0 0 0 0 0 0 0 0 0 0 0 0 2 355 0 0Scenedesmus sp. 0 0 8 394 10 535 2 113 0 0 2 113 0 0 1 56 0 0 0 0 0 0 0 0 0 0 0 0 0 0 0 0 0 0 0 0 0 0Sphaerocystis schroeteri 0 0 0 0 0 0 5 0 0 0 0 0 0 0 0 0 0 0 0 0 0 0 0 0 0 0 0 0 0 0 0 0 0 0 0 0 0 0Tetraedon gracile 0 0 0 0 0 0 0 0 0 0 2 238 0 0 0 0 0 0 0 0 0 0 0 0 0 0 0 0 0 0 0 0 0 0 0 0 0 0Volvox aureus 0 0 0 0 0 0 0 0 0 0 0 0 0 0 0 0 0 0 0 0 0 0 0 0 0 0 0 0 0 0 0 0 0 0 0 0 0 0Westella botryoides 0 0 0 0 0 0 0 21 0 0 0 0 0 0 0 0 0 0 0 0 0 0 0 4 0 0 0 0 0 0 0 0 0 0 0 8 0 0Apiocystis sp. 0 0 0 0 0 0 0 0 0 0 0 0 0 0 0 0 0 0 0 0 0 0 0 0 0 0 0 0 0 0 0 0 0 0 0 0 0 0Paulschulzia sp. 0 0 0 0 0 0 0 0 0 0 0 0 0 0 0 0 0 0 0 0 1 0 0 0 0 0 0 0 0 0 0 0 0 0 0 0 0 0Diatoms (Bacillariophyceae) 0 0Asterionella formosa 155 43323 268 74983 319 89222 136 38173 68 19086 19 5302 16 4544 8 2272 6 1818 1 303 1 151 0 0 0 0 2 606 21 5756 35 9695 23 6362 17 4847 117 32871Aulacoseira granulata 52 16268 81 24989 113 34884 144 44611 90 28008 34 10566 12 3690 4 1174 0 0 0 0 0 0 0 0 0 0 9 2683 0 0 0 0 0 0 3 839 4 1174Aulacoseira granulata var. angustissima 57 14910 13 3376 14 3517 16 4079 16 4220 0 0 1 141 0 0 6 1688 5 1407 0 70 2 422 4 985 0 0 16 4220 13 3376 8 2110 10 2532 28 7174Aulacoseria sp. 0 0 0 0 0 0 0 0 0 0 0 0 0 0 0 0 0 0 0 0 0 0 0 0 0 0 0 0 0 0 0 0 0 0 2 0 0 0Cocconeis 5 2829 3 1415 2 849 0 0 2 849 0 0 2 1132 0 0 2 849 1 283 0 0 0 0 0 0 0 0 0 0 1 566 2 1132 0 0 1 566Cyclotella stelligera 11 1818 8 1212 5 779 10 1558 5 779 1 87 2 260 0 0 2 260 1 87 0 0 0 0 2 260 2 260 2 346 4 692 10 1645 4 606 2 260Fragilaria crotonensis 108 38542 122 43578 69 24597 2 775 25 8909 17 6004 0 0 1 194 14 5036 11 4067 3 968 0 0 0 0 9 3099 128 45902 36 12976 8 2711 4 1549 64 23048Fragilaria sp. 12 4261 0 0 0 0 0 0 0 0 0 0 0 0 0 0 0 0 2 775 0 0 0 0 0 0 5 1743 0 0Nitzschia sp. 3 1266 2 633 9 3587 12 4642 32 12659 6 2321 4 1477 3 1266 3 1055 1 211 1 211 1 211 2 844 1 422 1 422 2 844 2 844 3 1055 5 1899Synedra sp. 6 2345 11 4263 12 4903 1 426 3 1066 0 0 0 0 0 0 1 213 0 0 0 0 0 0 0 0 0 0 0 0 0 0 0 0 0 0 0 0Amphora sp. 0 0 0 0 1 283 0 0 0 0 0 0 0 0 0 0 0 0 0 0 0 0 0 0 0 0 1 283 0 0 0 0 1 566 0 0 0 0Eunotia sp. 0 0 0 0 0 0 0 0 0 0 0 0 1 0 0 0 0 0 0 0 0 0 0 0 0 0 0 0 0 0 0 0 0 0 0 0 0 0Selenastrum minutum 4 476 0 0 0 0 0 0 0 0 0 0 0 0 0 0 0 0 0 0 0 0 0 0 0 0 0 0 0 0Small unknown diatom sp. 4 417 1 60 13 1428 2 179 3 357 0 0 2 179 1 60 2 179 1 119 0 0 0 0 0 0 0 0 2 179 0 0 5 536 14 1547 4 417Desmids (Mesotaeniaceae, Desmidiaceae) 0 0 0 0Closterium aciculare 2 1296 0 0 0 0 0 0 0 0 0 0 0 0 0 0 0 0 0 0 0 0 0 0 0 0 0 0 0 0 0 0 0 0 1 324 0 0Closterium acutum var. variable 0 0 3 1020 4 1428 1 204 1 204 0 0 1 204 0 0 0 0 0 0 0 0 0 0 0 0 0 0 0 0 0 0 0 0 0 0 1 204Cerasterias staurastroides 0 0 0 0 0 0 0 0 0 0 0 0 0 0 0 0 0 0 0 0 0 0 0 0 0 0 0 0 0 0 0 0 0 0 0 0 0 0Mougeotia sp. 0 0 0 0 0 0 0 0 0 0 0 0 0 0 0 0 0 0 0 0 0 0 0 0 0 0 0 0 0 0 0 0 0 0 0 0 0 0Spirogyra sp. 0 0 0 0 0 0 0 0 0 0 0 0 0 0 0 0 0 0 0 0 0 0 0 0 0 0 0 0 0 0 0 0 0 0 0 0 0 0Staurastrum sp. 0 0 0 0 1 148 0 0 0 0 0 0 1 74 0 0 0 0 0 0 0 0 0 0 0 0 0 0 1 148 1 148 0 0 0 0 0 0Staurastrum tangaroaii 0 0 0 0 0 0 0 0 0 0 0 0 0 0 0 0 0 0 0 0 0 0 0 0 0 0 0 0 0 0 0 0 0 0 0 0 0 0Staurodesmus unicorns var. gracilis 0 0 0 0 0 0 0 0 0 0 0 0 0 0 0 0 0 0 0 0 0 0 0 0 0 0 0 0 0 0 0 0 0 0 0 0 0 0Chrysophtya (Chrysophyceae) 0 0Dinobryon sp. 5 287 0 0 37 2202 49 2873 173 10214 18 1053 4 255 2 96 0 0 0 0 4 255 13 766 32 1883 23 1341 0 0 0 0 8 479 0 0 0 0Cryptomonas sp. 3 390 4 545 3 390 0 0 0 0 0 0 1 78 0 0 0 0 0 0 0 0 0 0 1 78 0 0 0 0 1 156 0 0 0 0 0 0Synura sp. 0 0 0 0 0 0 0 0 0 0 0 0 0 0 0 0 0 0 0 0 0 0 0 0 0 0 0 0 0 0 0 0 0 0 0 0 0 0Dinoflagellates (Dinophyceae) 0 0Ceratium hirundinella 0 0 0 0 0 0 0 0 0 0 0 0 0 0 0 0 0 0 0 0 0 0 0 0 0 0 0 0 0 0 0 0 1 22722 0 3150 0 0Gymnodinium sp. 1 0 0 0 0 4 4166 2 1785 0 0 0 0 0 0 1 1190 1 1190 2 2380 1 595 1 595 1 595 1 595 0 0 0 0 0 0 0 0 0 0Gymnodinium sp. 2 0 0 0 0 0 0 1 10820 9 183940 0 0 0 0 1 10820 0 0 0 0 0 0 1 21640 0 0 0 0 0 0 0 0 0 0 0 800 0 0Peridinium sp. 0 0 1 2164 0 0 0 0 0 0 0 0 7 28132 1 2164 4 17312 6 25968 0 0 0 0 1 2164 0 0 0 0 1 2164 0 0 0 0 0 0Gonyaulax sp. 0 0 0 0 0 0 5 10820 0 0 24 47608 2 3246 4 8656 0 0 0 0 3 5410 0 0 0 0 0 0 0 0 0 0 0 0 0 0 0 0Flagellates 5µm 0 0Flagellates < 5µm/unicells 70 2443 84 2954 111 3901 105 3692 108 3787 181 6343 104 3654 102 3560 70 2462 65 2291 22 776 48 1685 39 1382 29 1004 30 1060 29 1004 36 1269 87 3049 47 1628106 <strong>Lake</strong> <strong>Taupo</strong> Long-<strong>term</strong> Monitoring Programme 2010 - 2011
<strong>Lake</strong> <strong>Taupo</strong> phytoplankton enumeration (50 m van Dorne) 2010-11Cell counts and biovolumeCells per ml numbers may be affected by roundingSample code FY3 FY3 FY7 FY7 HR1 HR1 IV6 IV6 KC3 KC3 KS3 KS3 LE3 LE3 LV3 LV3 MJ3 MJ3 MJ6 MJ6 OP3 OP3 PL3 PL3 QN3 QN3 RK3 RK3 TQ3 TQ3 UI3 UI3 UX3 UX3 UT3 UT3 WU3 WU3Sampling date 10/08/2010 10/08/2010 24/08/2010 24/08/2010 13/09/2010 13/09/2010 26/10/2010 26/10/2010 10/11/2010 10/11/2010 25/11/2010 25/11/2010 8/12/2010 8/12/2010 21/12/2010 21/12/2010 11/01/2011 11/01/2011 27/01/2011 27/01/2011 17/02/2011 17/02/2011 1/03/2011 1/03/2011 15/03/2011 15/03/2011 13/04/2011 13/04/2011 10/05/2011 10/05/2011 31/05/2011 31/05/2011 22/06/2011 22/06/2011 5/07/2011 5/07/2011 9/08/2011 9/08/2011composition by class Cell Biovolume Cell Biovolume Cell Biovolume Cell Biovolume Cell Biovolume Cell Biovolume Cell Biovolume Cell Biovolume Cell Biovolume Cell Biovolume Cell Biovolume Cell Biovolume Cell Biovolume Cell Biovolume Cell Biovolume Cell Biovolume Cell Biovolume Cell Biovolume Cell BiovolumeSpecies(per ml) (µm 3 ) (per ml) (µm 3 ) (per ml) (µm 3 ) (per ml) (µm 3 ) (per ml) (µm 3 ) (per ml) (µm 3 ) (per ml) (µm 3 ) (per ml) (µm 3 ) (per ml) (µm 3 ) (per ml) (µm 3 ) (per ml) (µm 3 ) (per ml) (µm 3 ) (per ml) (µm 3 ) (per ml) (µm 3 ) (per ml) (µm 3 ) (per ml) (µm 3 ) (per ml) (µm 3 ) (per ml) (µm 3 ) (per ml) (µm 3 )Blue greens (Cyanophyceae)Dolichospermum c.f. lemmermannii(formally; Anabaena c.f. lemmermannii) 0.9 101 0.5 53 0.0 0 15.5 1796 3.8 443 7.4 863 0.9 103 1.2 137 0.3 30 0.0 0 0.3 35 0.0 0 0.0 0 0.0 0 1.7 191 0.3 39 1.3 148 0.0 5 3.1 357Leptolyngbya sp. 0.0 0 0.0 0 0.0 0 0.0 0 0.0 0 0.0 0 0.0 0 0.0 0 0.0 0 0.0 0 0.0 0 0.0 0 0.0 0 0.0 0 0.0 0 0.0 0 0.0 0 0.0 0 0.0 0Anabaena planktonica/Dolichospermumplanctonicum 0.0 0 0.0 0 0.0 0 0.0 0 0.0 0 0.0 0 0.0 0 0.0 0 0.0 0 0.2 64 0.0 0 0.0 0 0.0 0 0.4 172 0.0 0 0.0 0 0.0 0 0.0 0 0.0 0Anabaena flos-aquae 0.0 0 0.0 0 0.0 0 0.0 0 0.0 0 0.0 0 0.0 0 0.0 0 0.0 0 0.0 0 0.0 0 0.0 0 0.0 0 0.0 0 0.0 0 0.0 0 0.0 0 0.0 0Anabaena sp./ Dolichospermum sp. 0.0 0 0.0 0 0.0 0 0.0 0 0.0 0 0.0 0 0.0 0 0.5 41 0.0 0 2.0 178 0.0 0 0.0 0 0.0 0 0.0 0 0.0 0 0.0 0 0.0 0 0.0 0 0.0 0Anabaena circinalis / Dolichospermumcircinalis 0.0 0 0.0 0 0.0 0 0.0 0 0.0 0 0.0 0 0.0 0 0.0 0 0.0 0 0.0 0 0.0 0 0.0 0 0.0 0 0.0 0 0.0 0 0.1 19 0.0 0 0.0 0 0.0 0Chroococcus sp. 0.0 0 0.0 0 0.0 0 0.0 0 0.0 0 0.0 0 0.0 0 0.0 0 0.0 0 0.0 0 0.0 0 0.0 0 0.0 0 0.0 0 0.0 0 0.0 0 0.0 0 0.0 0 0.0 0Aphanocapsa sp. 2.0 18 0.6 6 0.0 0 0.0 0 0.3 3 0.0 0 0.4 4 0.0 0 0.0 0 0.0 0 0.0 0 0.0 0 0.0 0 0.0 0 0.0 0 0.0 0 0.0 0 7.6 68 0.0 0Heteroleibleinia sp.cf 0.0 0 0.0 0 0.0 0 0.0 0 0.0 0 0.0 0 0.0 0 0.0 0 0.0 0 0.0 0 0.0 0 0.0 0 0.0 0 0.0 0 0.0 0 0.0 0 0.0 0Microcystis sp. 0.0 0 0.0 0 0.2 5 0.0 0 0.0 0 0.0 0 0.0 0 0.0 0 0.0 0 0.0 0 0.0 0 0.0 0 0.0 0 0.0 0 0.0 0 0.0 0 0.0 0 0.0 0 1.7 36Snowella sp. 0.0 0 0.0 0 0.0 0 0.0 0 0.0 0 0.0 0 0.0 0 0.6 14 0.0 0 0.0 0 0.0 0 0.0 0 0.0 0 0.0 0 0.0 0 0.0 0 0.0 0 0.0 0 0.0 0Phormidium sp. 0.0 0 0.0 0 0.0 1 0.0 0 0.0 0 0.0 0 0.0 0 0.0 0 0.0 0 0.0 0 0.0 0 0.0 0 0.0 0 0.0 0 0.0 0 0.0 0 0.0 0 0.0 0 0.0 0Aphanothece sp. 0.0 0 0.0 0 0.0 0 0.0 0 0.0 0 0.0 0 0.0 0 0.0 0 0.0 0 0.0 0 0.0 0 0.0 0 0.0 0 0.0 0 0.0 0 0.0 0 0.0 0 0.0 0 0.0 0Aphanizomenon sp. 0.0 0 0.0 0 0.0 0 0.0 0 0.0 0 0.0 0 0.0 0 0.0 0 0.0 0 0.0 0 0.0 0 0.0 0 0.0 0 0.0 0 0.0 0 0.0 0 0.0 0 0.0 0 0.0 0Pseudanabaena sp. 0.0 0 0.2 3 0.0 0 0.1 2 0.0 0 0.0 0 0.0 0 0.0 0 0.0 0 0.0 0 0.1 2 0.0 0 0.0 0 0.0 0 0.0 0 0.0 0 0.3 5 0.0 0 0.0 0Greens (Chlorophyceae) 0 0Actinastrum hantschii 0 0 0 0 4 0 0 0 0 0 0 0 0 0 0 0 0 0 0 0 0 0 0 0 4 0 4 0 0 0 0 0 0 0 0 0 0 0Monoraphidium sp. / Ankistrodesmus falcatus 60 2531 85 3587 100 4201 71 2998 74 3120 33 1400 107 4496 26 1106 97 4079 35 1450 7 295 55 2310 44 1867 30 1278 20 860 9 393 147 6167 159 6683 73 3071Stichococcus contortus 37 674 67 1200 51 916 11 200 23 421 11 190 16 295 0 0 18 326 9 168 0 0 6 116 0 0 7 126 0 0 0 0 5 84 0 0 13 232Kirchneriella contorta 0 0 0 0 2 77 0 0 0 0 0 0 0 0 0 0 0 0 0 0 0 0 0 0 0 0 0 0 0 0 0 0 0 0 0 0 0 0Botryococcus braunii (colonies) 0.0 10258 0.0 812 0.0 3448 0.0 3000 0.0 0 0.0 1200 0.0 0 0.0 200 0.0 0 0.0 0 0.0 600 0.0 52500 0.0 0 0.0 3069 0.0 9535 0.0 0 0.0 365 0.0 215 0.0 4753Chlamydomonas sp. 4 860 3 614 1 246 0 0 0 0 0 0 3 614 0 0 0 0 0 0 0 0 0 0 0 0 0 0 0 0 0 0 0 0 0 0 0 0Crucigeniella sp 0 0 0 0 0 0 0 0 0 0 0 0 0 0 0 0 0 0 0 0 0 0 0 0 0 0 0 0 0 0 0 0 0 0 0 0 0 0Dictyosphaerium 15 837 0 0 9 483 3 139 0 23 0 25 0 13 0 0 0 20 0 0 0 0 0 0 0 0 0 0 0 0 0 0 0 25 1 44 0 0Gloeocystis planctonica 0 0 0 0 0 0 0 0 0 0 0 0 0 0 0 0 0 0 0 0 0 0 0 0 0 0 0 0 0 0 0 0 0 0 0 0 0 0Elakotothrix gelatinosa 6 614 8 860 5 491 0 0 5 491 0 0 0 0 0 0 5 491 1 123 0 0 0 0 1 123 0 0 1 123 0 0 2 184 1 123 4 430Eudorina elegans 13 3444 9 2246 0 0 0 0 16 4193 18 4643 12 2995 0 0 10 2546 33 8387 1 300 0 0 6 1647 5 1198 9 2246 9 2246 0 0 0 0 4 1048Lagerheimia sp. 0 0 0 0 0 0 0 0 0 0 0 0 0 0 0 0 0 0 0 0 0 0 0 0 0 0 0 0 0 0 0 0 0 0 0 0 0 0Nephrocytium agardhianum 0 0 0 0 0 0 0 0 0 0 0 0 0 0 0 0 0 0 0 0 0 0 0 0 0 0 0 0 0 0 0 0 0 0 0 0 0 0Nephrocytium lunatum 0 0 0 0 0 0 0 0 0 0 0 0 0 0 0 0 0 0 0 0 0 0 0 0 0 0 0 0 0 0 0 0 0 0 0 0 0 0Oocytsis sp. 9 1329 9 1246 12 1661 11 1495 4 498 1 166 1 166 2 332 8 1163 2 332 2 332 8 1080 4 498 5 748 15 2077 7 997 22 3074 8 1163 8 1080Planktosphaeria gelatinosa 0 0 0 0 0 0 0 0 0 0 0 0 0 0 0 0 0 0 0 0 0 0 0 0 0 0 0 0 0 0 0 0 0 0 0 0 0 0Quadrigula lacustrus 0 0 0 0 0 0 0 0 0 0 0 0 0 0 0 0 0 0 0 0 0 0 0 0 0 0 0 0 0 0 0 0 0 0 2 384 0 0Scenedesmus sp. 5 243 18 943 4 183 0 0 6 304 0 0 0 0 0 0 0 0 2 122 0 0 0 0 0 0 0 0 0 0 0 0 0 0 2 122 0 0Sphaerocystis schroeteri 0 0 0 0 0 0 0 0 0 0 0 0 0 0 0 0 0 0 0 0 0 0 0 0 0 0 0 0 0 0 0 0 0 0 0 0 0 0Tetraedon gracile 0 0 0 0 0 0 0 0 0 0 0 0 0 0 0 0 0 0 0 0 0 0 0 0 0 0 0 0 0 0 0 0 0 0 0 0 0 0Volvox aureus 0 0 80 4774 94 5616 0 0 0 0 0 0 0 0 0 0 0 0 0 0 0 0 0 0 0 0 0 0 0 0 0 0 0 0 0 0 0 0Westella botryoides 0 0 0 0 0 0 0 0 0 0 0 0 0 0 0 0 0 0 0 0 0 0 0 0 0 0 0 0 0 0 0 0 0 0 9 608 0 0Apiocystis sp. 0 0 0 0 0 0 0 0 0 0 0 0 0 0 0 0 0 0 0 0 0 0 0 0 0 0 0 0 0 0 0 0 0 0 0 0 0 0Paulschulzia sp. 0 0 0 0 0 0 0 0 0 0 0 0 0 0 0 0 0 0 0 0 0 0 0 0 0 0 0 0 0 0 0 0 0 0 0 0 0 0Diatoms (Bacillariophyceae) 0 0Asterionella formosa 186 52088 309 86650 368 103030 163 45536 102 28665 50 14087 45 12613 82 22932 16 4586 7 1966 0 0 0 0 2 655 4 983 10 2785 8 2293 32 8845 23 6552 104 28993Aulacoseira granulata 85 26477 90 27747 113 35182 336 104095 207 64017 122 37721 71 21943 43 13420 35 10700 8 2539 12 3627 0 0 17 5259 16 4896 15 4534 12 3627 12 3627 8 2358 7 2176Aulacoseira granulata var. angustissima 21 5476 18 4715 20 5324 13 3498 25 6388 16 4107 12 3042 0 0 36 9430 10 2586 0 0 30 7909 15 3803 12 3194 16 4259 5 1217 22 5628 20 5171 35 9126Aulacoseria sp. 0 0 0 0 0 0 0 0 0 0 0 0 0 0 0 0 0 0 0 0 0 0 0 0 0 0 0 0 0 0 0 0 0 0 2 0 0 0Cocconeis 6 3366 4 1836 4 2142 0 0 1 612 2 918 1 306 0 0 3 1530 3 1530 0 0 0 0 0 0 1 306 0 0 1 612 0 0 0 0 2 1224Cyclotella stelligera 13 2153 5 842 4 562 11 1685 8 1217 6 936 6 936 5 842 10 1591 2 374 3 468 1 187 2 374 5 842 5 842 3 468 6 1030 9 1404 4 562Fragilaria crotonensis 124 44399 88 31624 27 9634 3 1047 18 6492 0 0 9 3351 1 209 0 0 6 2304 0 0 0 0 5 1675 0 0 108 38745 34 12147 0 0 33 11728 24 8587Fragilaria sp. 3 1047 0 0 0 0 0 0 0 0 6 2094 0 0 0 0 0 0 19 6702 0 0 0 0 0 0 9 3141 0 0Nitzschia sp. 2 684 2 913 3 1141 19 7301 20 7757 8 2966 4 1597 0 114 2 913 1 456 1 228 0 0 1 456 1 456 2 684 1 228 4 1369 4 1369 6 2282Synedra sp. 5 1844 9 3688 6 2535 0 0 5 1844 1 461 0 0 0 0 0 0 0 0 0 0 0 0 0 0 0 0 0 0 0 0 0 0 0 0 2 691Amphora sp. 1 306 0 0 0 0 0 0 0 0 1 612 1 612 0 0 0 0 0 0 1 306 0 0 0 0 0 0 0 0 1 306 1 612 0 0 1 306Eunotia sp. 0 0 0 0 0 0 0 0 1 0 0 0 0 0 0 0 0 0 0 0 0 0 0 0 0 0 1 0 0 0 0 0 0 0 0 0 0 0Selenastrum minutum 2 257 0 0 0 0 0 0 0 0 0 0 0 0 0 0 0 0 0 0 0 0 0 0 0 0 0 0 0 0Small unknown diatom sp. 1 129 2 257 6 708 0 0 2 257 0 0 1 64 0 0 2 193 2 193 1 129 0 0 0 0 2 193 2 257 0 0 2 257 11 1223 4 450Desmids (Mesotaeniaceae, Desmidiaceae) 0 0 0 0Closterium aciculare 0 0 0 0 0 0 0 0 0 0 0 0 0 0 0 0 0 0 0 0 0 0 0 0 0 0 0 0 0 0 0 0 0 0 1 420 0 0Closterium acutum var. variable 4 1323 3 1103 2 662 1 221 1 441 2 882 1 221 2 662 1 441 0 0 0 0 0 0 1 441 2 882 1 441 2 662 0 0 0 0 2 662Cerasterias staurastroides 0 0 0 0 0 0 0 0 0 0 0 0 0 0 0 0 0 0 0 0 0 0 0 0 0 0 0 0 0 0 0 0 0 0 0 0 0 0Mougeotia sp. 0 0 0 0 0 0 0 0 0 0 0 0 0 0 0 0 0 0 0 0 0 0 0 0 0 0 0 0 0 0 0 0 0 0 0 0 0 0Spirogyra sp. 0 0 0 0 0 0 0 0 0 0 0 0 0 0 0 0 0 0 0 0 0 0 0 0 0 0 0 0 0 0 0 0 0 0 0 0 0 0Staurastrum sp. 1 80 0 0 1 80 0 0 1 80 1 80 1 160 0 0 1 80 1 80 0 0 0 0 0 0 0 0 0 0 0 0 0 0 0 16 0 0Staurastrum tangaroaii 0 0 0 0 0 0 1 0 0 0 0 0 0 0 0 0 0 0 0 0 0 0 0 0 0 0 0 0 0 0 0 0 0 0 0 0 0 0Staurodesmus unicorns var. gracilis 0 0 0 0 0 0 0 0 0 0 0 0 0 0 0 0 0 0 0 0 0 0 0 0 0 0 0 0 0 0 0 0 0 0 0 0 0 0Chrysophtya (Chrysophyceae) 0 0 0 0Dinobryon sp. 14 828 0 0 25 1484 33 1933 0 0 6 345 0 0 0 0 0 0 4 207 0 0 3 173 1 69 7 414 0 0 0 0 18 1070 1 50 11 621Cryptomonas sp. 2 253 3 421 3 421 1 168 0 0 0 0 1 84 0 0 1 84 2 253 0 0 0 0 0 0 2 253 1 168 1 168 0 0 0 0 0 0Synura sp. 0 0 0 0 0 0 0 0 0 0 0 0 0 0 0 0 0 0 0 0 0 0 0 0 0 0 0 0 0 0 0 0 0 0 1 81 0 0Dinoflagellates (Dinophyceae) 0 0Ceratium hirundinella 0 0 0 0 0 0 0 0 0 0 0 0 0 0 0 0 0 0 0 0 0 0 0 0 0 0 0 0 0 0 0 0 1 12285 0 2100 0 0Gymnodinium sp. 1 0 0 0 0 0 0 0 0 0 0 0 0 0 0 0 0 0 0 0 0 0 0 0 0 0 0 1 644 0 0 0 0 0 0 0 0 0 0Gymnodinium sp. 2 0 0 0 0 0 0 0 0 0 0 0 0 0 0 0 0 0 0 0 0 1 11700 0 0 0 0 0 0 0 0 0 0 0 0 0 400 0 0Peridinium sp. 1 2340 0 0 0 0 0 0 0 0 0 0 0 0 0 0 0 0 0 0 0 0 0 0 0 0 0 0 0 0 0 0 0 0 0 0 0 0Gonyaulax sp. 0 0 0 0 0 0 0 0 0 0 0 0 0 0 0 0 0 0 0 0 0 0 0 0 0 0 0 0 0 0 0 0 0 0 0 0 0 0Flagellates 5µm 0 0Flagellates < 5µm/unicells 56 1966 58 2027 85 2989 161 5631 59 2068 78 2744 37 1310 144 5057 56 1945 31 1085 9 328 118 4136 21 737 27 942 43 1515 23 799 34 1188 128 4484 47 1658<strong>Lake</strong> <strong>Taupo</strong> Long-<strong>term</strong> Monitoring Programme 2010 - 2011 107
<strong>Lake</strong> <strong>Taupo</strong> phytoplankton enumeration (10-m tube) 2009-10Cell counts and biovolumeCells per ml numbers may be affected by roundingSample code PH1 PH1 QJ1 QJ1 TT1 TT1 VA1 VA1 VA3 VA3 XF1 XF1 ZD1 ZD1 BX1 BX1 CU1 CU1 CU3 CU3Sampling date 19/10/2009 19/10/2009 12/11/2009 12/11/2009 13/01/2010 13/01/2010 2/02/2010 2/02/2010 18/02/2010 18/02/2010 10/03/2010 10/03/2010 8/04/2010 8/04/2010 20/05/2010 20/05/2010 3/06/2010 3/06/2010 23/06/2010 23/06/2010Species composition by class Cell Biovolume Cell Biovolume Cell Biovolume Cell Biovolume Cell Biovolume Cell Biovolume Cell Biovolume Cell Biovolume Cell Biovolume Cell Biovolume(per ml) (µm 3 ) (per ml) (µm 3 ) (per ml) (µm 3 ) (per ml) (µm 3 ) (per ml) (µm 3 ) (per ml) (µm 3 ) (per ml) (µm 3 ) (per ml) (µm 3 ) (per ml) (µm 3 ) (per ml) (µm 3 )Blue greens (Cyanophyceae)Dolichospermum c.f. lemmermannii (formerly;Anabaena c.f. lemmermannii) 0.0 0 77.4 6964 3.0 270 17.6 1582 182.5 21172 4.2 492 5.6 652 3.6 418 4.6 531 1.9 218Dolichospermum planctonicum (formerly;Anabaena planktonica) 0.0 0 0.0 0 0.0 0 0.0 0 0.0 0 0.3 100 0.0 0 0.0 0 0.0 0 0.0 0Dolichospermum sp. (formerly;Anabaena sp.) 0.0 0 0.0 0 0.0 0 0.0 0 0.0 0 0.0 0 0.0 0 0.0 0 0.0 0 0.0 0Dolichospermum circinalis (formerly;Anabaena circinalis) 6.9 1429 0.0 0 0.0 0 0.0 0 0.0 0 0.0 0 0.0 0 0.0 0 0.0 0 0.0 0Chroococcus sp. 0.0 0 0.0 0 0.0 0 0.0 0 0.8 11 0.0 0 0.0 0 0.0 0 0.0 0 0.0 0Microcystis sp. 0.0 0 0.6 13 0.0 0 0.0 0 0.0 0 0.0 0 0.0 0 0.0 0 0.0 0 0.0 0Leptolyngbya sp. 17.1 188 0.0 0 0.0 0 0.0 0 0.0 0 0.0 0 0.0 0 0.6 7 0.0 0 0.0 0Snowella sp. 0.0 0 0.0 0 0.0 0 0.0 0 0.0 0 0.0 0 0.0 0 0.0 0 0.0 0 0.0 0Pseudanabaena sp. 0.7 14 0.0 0 0.2 4 0.0 0 0.0 0 0.1 2 0.1 1 0.8 15 0.0 0 0.4 7Phormidium sp. 0.0 0 0.0 0 0.0 0 0.0 0 0.2 5 0.0 0 0.0 0 0.0 0 0.0 0 0.0 0Aphanocapsa sp. 4.0 36 0.0 0 0.0 0 0.0 0 0.0 0 0.0 0 0.0 0 0.0 0 0.0 0 2.0 18Aphanothece sp. 0.0 0 0.0 0 0.0 0 0.0 0 0.0 0 0.0 0 0.0 0 0.0 0 0.0 0 0.0 0Aphanizomenon sp. 0.3 6 0.0 0 0.0 0 0.0 0 0.0 0 0.0 0 0.0 0 0.0 0 0.0 0 0.0 0Greens (Chlorophyceae)Monoraphidium sp. / Ankistrodesmus falcatus 67 2818 32 1341 5 227 21 863 0 0 2 68 18 750 14 591 27 1113 11 477Stichococcus contortus 11 204 0 0 0 0 9 166 0 0 0 0 0 0 0 0 0 0 0 0Botryococcus braunii (colonies) 0 0 0.002 3900 0.000 1950 0 0 0 0 0 0 0 0 0 0 0.0 3248 0.0 1570Chlamydomonas sp. 2 341 0 0 1 227 0 0 0 0 0 0 0 0 2 454 0 0 3 568Elakotothrix gelatinosa 4 454 3 341 1 114 4 454 0 0 1 114 0 0 15 1591 6 682 2 170Eudorina elegans 8 2077 0 0 0 0 0 0 0 0 0 0 0 0 0 0 0 0 0 0Nephrocytium lunatum 0 0 0 0 0 0 0 0 0 0 0 0 0 0 0 0 0 0 0 0Oocytsis sp. 9 1229 12 1690 22 3150 36 5070 45 6376 10 1383 34 4840 11 1613 11 1613 6 845Tetraedon gracile 0 0 0 0 0 0 0 0 0 0 0 0 0 0 0 0 0 0 0 0Paulschulzia sp. 0 0 0 0 0 0 0 0 1 0 0 0 0 0 0 0 0 0 0 0Dictyosphaerium 45 0 0 0 6 0 8 0 0 0 0 0 0 0 0 0 4 238 0 0Crucigeniella sp 17 1090 18 1160 77 4993 48 3095 8 492 0 0 0 0 0 0 1 70 0 0Kirchneriella contorta 10 321 0 0 0 0 0 0 0 0 0 0 0 0 0 0 6 214 0 0Planktosphaeria gelatinosa 0 0 0 0 0 0 0 0 0 0 0 0 2 0 0 0 0 0 0 0Scenedesmus sp. 0 0 0 0 4 225 0 0 0 0 0 0 0 0 0 0 4 225 0 0Volvox aureus 0 0 0 0 0 0 0 0 0 0 0 0 0 0 325 19476 173 10387 498 29863Diatoms (Bacillariophyceae)Asterionella formosa 186 51958 31 8786 3 757 0 0 0 0 4 1060 0 0 4 1212 10 2727 9 2575Aulacoseira granulata 21 6541 23 7044 6 2013 0 0 0 0 0 0 0 0 12 3857 9 2683 9 2851Aulacoseira granulata var. angustissima 54 13925 4 1125 1 281 0 0 0 0 0 0 0 0 0 0 0 0 0 0Aulacoseria sp. 0 0 0 0 0 0 0 0 0 0 0 0 0 0 0 0 0 0 0 0Cyclotella stelligera 10 1558 3 519 4 606 2 346 1 173 0 0 0 0 0 0 0 0 2 346Fragilaria crotonensis 158 56554 121 43190 60 21498 98 35249 8 2905 15 5229 12 4261 22 7941 57 20336 135 48226Nitzschia sp. 2 844 1 211 2 633 3 1266 0 0 1 211 2 844 7 2743 2 633 0 0Synedra sp. 1 426 0 0 1 213 0 0 0 0 0 0 0 0 0 0 0 0 0 0Amphora sp. 0 0 0 0 2 849 0 0 0 0 0 0 0 0 0 0 1 566 1 283Cocconeis 1 566 0 0 0 0 2 849 0 0 6 3112 0 0 6 3395 8 3961 7 3678Small unknown diatom sp. 0 0 0 0 0 0 0 0 0 0 0 0 0 0 2 238 1 60 1 119Desmids (Mesotaeniaceae, Desmidiaceae) 0 0Closterium aciculare 0 0 1 648 0 0 0 0 0 0 0 0 0 0 0 0 0 0 0 0Closterium acutum var. variable 1 408 0 0 0 0 0 0 0 0 0 0 0 0 0 0 1 204 1 408Staurastrum sp. 0 0 0 0 0 0 0 0 0 0 0 0 0 0 1 74 1 74 0 0Chrysophtya (Chrysophyceae)Dinobryon sp. 98 5809 289 17077 16 926 37 2202 29 1692 4 223 4 223 25 1468 0 0 6 383Cryptomonas sp. 1 78 0 0 1 78 0 0 0 0 1 156 0 0 1 78 2 234 1 156Dinoflagellates (Dinophyceae)Ceratium hirundinella 0 0 0 0 1 11361 1 22722 0 0 0 0 0 0 0 0 0 0 0 0Gymnodinium sp. 1 0 0 0 0 0 0 0 0 1 1190 0 0 0 0 1 595 1 595 0 0Gymnodinium sp. 2 0 0 0 0 2 40575 0 0 1 27050 0 0 0 5410 0 0 0 0 0 0Peridinium sp. 0 0 0 0 0 0 0 0 0 0 4 15148 0 0 3 12984 0 0 1 2164Gonyaulax sp. 0 0 0 0 0 0 0 0 1 2164 0 0 3 6492 0 0 0 0 0 0Flagellates 5µmFlagellates < 5µm/unicells 153 5340 61 2140 43 1496 42 1477 85 2973 34 1193 33 1155 29 1004 23 795 36 1269108 <strong>Lake</strong> <strong>Taupo</strong> Long-<strong>term</strong> Monitoring Programme 2010 - 2011
<strong>Lake</strong> <strong>Taupo</strong> phytoplankton enumeration (10-m tube) 2009-10 (continued)Cell counts and biovolumeCells per ml numbers may be affected by roundingSample code EX1 EX1 FY1 FY1Sampling date 13/07/2010 13/07/2010 10/08/2010 10/08/2010Species composition by class Cell Biovolume Cell Biovolume(per ml) (µm 3 ) (per ml) (µm 3 )Blue greens (Cyanophyceae)Dolichospermum c.f. lemmermannii (formerly;Anabaena c.f. lemmermannii) 0.2 22 0.8 87Dolichospermum planctonicum (formerly;Anabaena planktonica) 0.0 0 0.0 0Dolichospermum sp. (formerly;Anabaena sp.) 0.0 0 0.0 0Dolichospermum circinalis (formerly;Anabaena circinalis) 0.0 0 0.3 67Chroococcus sp. 0.0 0 0.0 0Microcystis sp. 0.0 0 0.4 8Leptolyngbya sp. 0.0 0 1.3 14Snowella sp. 0.0 0 0.0 0Pseudanabaena sp. 0.5 9 0.0 0Phormidium sp. 0.3 5 0.0 0Aphanocapsa sp. 2.4 22 1.0 9Aphanothece sp. 0.0 0 0.0 0Aphanizomenon sp. 0.0 0 0.0 0Greens (Chlorophyceae)Monoraphidium sp. / Ankistrodesmus falcatus 68 2863 72 3022Stichococcus contortus 0 0 29 526Botryococcus braunii (colonies) 0.0 0 0.0 6160Chlamydomonas sp. 0 0 2 341Elakotothrix gelatinosa 6 625 6 682Eudorina elegans 0 0 16 4155Nephrocytium lunatum 0 0 0 0Oocytsis sp. 4 538 3 384Tetraedon gracile 0 0 0 0Paulschulzia sp. 0 0 0 0Dictyosphaerium 0 0 9 506Crucigeniella sp 0 0 3 211Kirchneriella contorta 0 0 0 0Planktosphaeria gelatinosa 0 0 0 0Scenedesmus sp. 2 113 0 0Volvox aureus 87 5194 0 0Diatoms (Bacillariophyceae)Asterionella formosa 39 11058 155 43323Aulacoseira granulata 23 7044 52 16268Aulacoseira granulata var. angustissima 0 0 57 14910Aulacoseria sp. 17 0 0 0Cyclotella stelligera 8 1212 11 1818Fragilaria crotonensis 62 22273 108 38542Nitzschia sp. 1 422 3 1266Synedra sp. 1 213 6 2345Amphora sp. 0 0 0 0Cocconeis 4 2264 5 28294 417 4 417Desmids (Mesotaeniaceae, Desmidiaceae)Closterium aciculare 0 0 2 1296Closterium acutum var. variable 0 0 0 0Staurastrum sp. 0 0 0 0Chrysophtya (Chrysophyceae)Dinobryon sp. 0 0 5 287Cryptomonas sp. 4 623 3 390Dinoflagellates (Dinophyceae)Ceratium hirundinella 0 0 0 0Gymnodinium sp. 1 1 595 0 0Gymnodinium sp. 2 0 0 0 0Peridinium sp. 0 0 0 0Gonyaulax sp. 0 0 0 0Flagellates 5µmFlagellates < 5µm/unicells 59 2064 70 2443<strong>Lake</strong> <strong>Taupo</strong> Long-<strong>term</strong> Monitoring Programme 2010 - 2011 109
<strong>Lake</strong> <strong>Taupo</strong> phytoplankton enumeration (10-m tube) 2008-09Cell counts and biovolumeCells per ml numbers may be affected by roundingSample code RL4 RL4 SV2 SV2 UP4 UP4 XE2 XE2 XZ2 XZ2 XZ1 XZ1 AH2 AH2 AH4 AH4 DU1 DU1 EW2 EW2 GV2 GV2Sampling date 16/09/2008 16/09/2008 14/10/2008 14/10/2008 26/11/2008 26/11/2008 22/12/2008 22/12/2008 13/01/2009 13/01/2009 28/01/2009 28/01/2009 11/02/2009 11/02/2009 25/02/2009 25/02/2009 26/03/2009 26/03/2009 15/04/2009 15/04/2009 7/05/2009 7/05/2009Species composition by class Cell Biovolume Cell Biovolume Cell Biovolume Cell Biovolume Cell Biovolume Cell Biovolume Cell Biovolume Cell Biovolume Cell Biovolume Cell Biovolume Cell BiovolumeBlue greens (Cyanophyceae)(per ml) (µm 3 ) (per ml) (µm 3 ) (per ml) (µm 3 ) (per ml) (µm 3 ) (per ml) (µm 3 ) (per ml) (µm 3 ) (per ml) (µm 3 ) (per ml) (µm 3 ) (per ml) (µm 3 ) (per ml) (µm 3 ) (per ml) (µm 3 )Anabaena lemmermannii 0.0 0 0.0 0 46.5 1905 16.3 670 1.3 116 1.3 120 7.4 669 75.6 41 1.4 126 27.7 2495 13.6 1226Pseudanabaena limnetica 0.0 0 0.0 0 0.0 0 0.0 0 0.0 0 0.0 0 0.1 2 0.0 0 4.4 83 0.0 0 0.0 0Anabaena planktonica 0.0 0 0.0 0 0.0 0 0.0 0 0.8 299 0.0 0 0.0 0 0.0 0 0.0 0 0.0 0 0.0 0Anabaena sp. 0.0 0 0.0 0 0.0 0 0.0 0 0.0 0 0.0 0 0.0 0 0.0 0 0.0 0 0.0 0 0.0 0Greens (Chlorophyceae)Anabaena circinalis 0.0 0 8.9 581 0.0 0 0.0 0 0.0 0 0.0 0 0.0 0 0.0 0 0.0 0 0.0 0 0.0 0Chroococcus sp. 0.0 0 0.0 0 0.0 0 0.0 0 0.0 0 0.0 0 0.0 0 0.0 0 0.0 0 0.0 0 0.3 4Microcystis sp. 0.0 0 0.0 0 0.0 0 0.0 0 0.0 0 0.0 0 0.0 0 0.0 0 0.0 0 0.0 0Leptolyngbya sp. 0.0 0 0.0 0 0.0 0 0.0 0 0.0 0 0.0 0 0.0 0 0.0 0 0.0 0 0.0 0 2.1 23Snowella sp. 0.0 0 0.0 0 0.0 0Monoraphidium sp. / Ankistrodesmus falcatus 94 3956 4 172 4 172 16 688 53 2236 139 5848 56 2359 0 0 0 0 1 49 5 221Stichococcus contortus 12 211 0 0 0 0 0 0 0 0 0 0 0 0 0 0 0 0 0 0 0 0Botryococcus braunii 0.0 218 0.0 0 0.0 8877 0.0 127636 0.0 0 0.0 1908 0.0 0 0.0 543 0 0 0.0 4213 0.0 6058Chlamydomonas sp. 0 0 1 123 0 0 0 0 0 0 0 0 0 0 0 0 0 0 0 0 0 0Elakotothrix gelatinosa 4 369 0 0 0 0 0 0 5 491 12 1229 16 1720 18 1843 0 0 1 114 0 0Eudorina elegans 0 0 0 0 0 0 0 0 6 1647 0 0 0 0 0 0 0 0 3 674 0 0Nephrocytium lunatum 0 0 0 0 0 0 0 0 4 0 0 0 0 0 0 0 0 0 0 0 0 0Oocytsis sp. 14 1994 8 1163 5 748 5 665 0 0 2 249 5 665 0 0 0 0 5 748 4 498Tetraedon gracile 0 0 0 0 0 0 20 2252 9 1030 1 64 0 0 0 0 0 0 0 0 0 0Paulschulzia sp. 0 0 0 0 0 0 0 0 18 0 7 0 0 0 0 0 0 0 0 0 0 0Dictyosphaerium sp. 0 0 0 0 0 0 0 0 0 0 0 5 0 0 0Crucigeniella sp 0 0 0 7 456 4 228 2 152 0 0 0 0 0 0 0 0 30 1969 53 3422Diatoms (Bacillariophyceae)Asterionella formosa 64 18018 42 11794 29 8190 3 819 22 6061 35 9828 5 1310 1 328 4 1147 11 3112 19 5242Aulacoseira granulata 15 4534 0 0 0 0 0 0 0 0 0 0 0 0 0 0 8 2539 0 0 0 0Aulacoseira granulata var. angustissima 0 0 1 304 0 0 0 0 0 0 0 0 0 0 0 0 0 0 0 0 0 0Aulacoseria sp. 12 0 0 0 0 0 0 0 0 0 0 0 0 0 0 0 0 0 0 0 0 0Cyclotella stelligera 15 2340 2 374 7 1123 0 0 1 187 1 187 1 187 0 0 1 187 1 187 4 655Fragilaria crotonensis 37 13194 33 11728 99 35603 66 23456 70 25132 21 7539 48 17173 16 5864 2 838 21 7539 8 2723Nitzschia sp. 0 0 0 0 0 0 4 1369 0 0 4 1597 2 913 2 913 0 0 0 0 0 0Synedra sp. 1 230 0 0 0 0 2 691 0 0 0 0 0 0 0 0 1 230 0 0 0 0Amphora sp. 0 0 0 0 0 0 1 306 0 0 0 0 0 0 0 0 0 0 0 0 0 0Cocconeis 1 306 0 0 0 0 0 0 0 0 0 0 0 0 0 0 0 0 0 0 0Desmids (Mesotaeniaceae, Desmidiaceae)Closterium aciculare 0 0 0 0 0 0 0 0 0 0 0 0 0 0 0 0 0 0 0 0 0 0Closterium acutum var. variable 1 441 0 0 0 0 0 0 0 0 0 0 0 0 0 0 0 0 0 0 0 0Chrysophtya (Chrysophyceae)Dinobryon sp. 0 0 53 3106 313 18466 23 1381 0 0 2 104 38 2243 53 3141 0 0 11 621 13 794Cryptomonas sp. 0 0 0 0 1 168 0 0 0 0 0 0 1 84 0 0 0 0 0 0 0 0Dinoflagellates (Dinophyceae)Ceratium hirundinella 0 0 0 0 0 0 0 0 0 0 0 0 0 0 0 0 0 0 0 0 0 0Gymnodinium sp. 1 0 0 0 0 1 205 1 205 1 205 4 4505 4 4505 3 3218 0 0 1 1287 1 644Gymnodinium sp. 2 0 0 0 0 1 14625 0 0 0 0 0 0 0 0 0 0 0 150 0 50 0 25Peridinium sp. 0 0 0 0 0 0 0 0 0 0 2 4680 1 2340 0 0 0 0 1 2340 0 0Gonyaulax sp. 1 1170 1 1170 0 0Flagellates 5µmFlagellates < 5µm/unicells 113 3972 68 2375 78 2723 249 8722 182 6368 57 2007 51 1781 83 2907 37 1290 51 1781 145 5078110 <strong>Lake</strong> <strong>Taupo</strong> Long-<strong>term</strong> Monitoring Programme 2010 - 2011
<strong>Lake</strong> <strong>Taupo</strong> phytoplankton enumeration (10-m tube) 2008-09 continuedSample code GV4 GV4 JO1 JO1 KI1 KI1 NEW NAMES INTRODUCED LT1 LT1 ND1 ND1Sampling date 27/05/2009 27/05/2009 18/06/2009 18/06/2009 6/07/2009 6/07/2009 August 2009 13/08/2009 13/08/2009 7/09/2009 7/09/2009Species composition by class Cell Biovolume Cell Biovolume Cell Biovolume Cell Biovolume Cell Biovolume(per ml) (µm 3 ) (per ml) (µm 3 ) (per ml) (µm 3 ) (per ml) (µm 3 ) (per ml) (µm 3 )Blue greens (Cyanophyceae)Blue greens (Cyanophyceae)Anabaena lemmermannii 9.4 849 5.8 41 0.3 28Dolichospermum c.f. lemmermannii (formerly;Anabaena c.f. lemmermannii) 0.1 10 0.1 11Pseudanabaena limnetica 0.0 0 0.0 0 1.0 19 Pseudanabaena sp. 0.0 0 0.0 0Anabaena planktonica 0.2 88 0.0 0 0.0 0Dolichospermum planctonicum (formerly;Anabaena planktonica) 0.0 0 0.0 0Anabaena sp. 2.1 188 0.3 23 0.5 46Dolichospermum sp. (formerly; Anabaenasp.) 0.0 0 0.0 0Anabaena circinalis 0.0 0 0.0 0 0.0 0Dolichospermum circinalis (formerly;Anabaena circinalis) 0.0 0 0.0 0Chroococcus sp. 0.1 1 0.0 0 0.0 0 Chroococcus sp. 0.2 2 0.8 11Microcystis sp. 0.0 0 0.0 0 0.0 0 Microcystis sp. 0.0 0 2.5 53Leptolyngbya sp. 0.6 6 0.1 2 0.0 0 Leptolyngbya sp. 0.0 0 120.0 1320Snowella sp. 0.1 3 0.0 0 0.0 0 Snowella sp. 3.3 83 222.9 5572Greens (Chlorophyceae) Greens (Chlorophyceae) 0.0 0Monoraphidium sp. / Ankistrodesmus falcatus 14 590 42 1744 42 1750 Monoraphidium sp. / Ankistrodesmus falcatus 24 1022 225 9459Stichococcus contortus 0 0 3 53 0 0 Stichococcus contortus 19 351 63 1141Botryococcus braunii 0.0 15954 0.0 14315 0.0 30946 Botryococcus braunii (colonies) 0.0 0 0.0 205716Chlamydomonas sp. 0 0 0 0 0 0 Chlamydomonas sp. 0 0 0 0Elakotothrix gelatinosa 0 0 0 0 0 0 Elakotothrix gelatinosa 1 114 8 819Eudorina elegans 0 0 0 0 0 0 Eudorina elegans 0 0 0 0Nephrocytium lunatum 0 0 0 0 0 0 Nephrocytium lunatum 0 0 0 0Oocytsis sp. 0 0 4 498 0 0 Oocytsis sp. 15 2151 0 0Tetraedon gracile 0 0 0 0 0 0 Tetraedon gracile 0 0 0 0Paulschulzia sp. 0 0 0 0 0 0 Paulschulzia sp. 0 0 0 0Dictyosphaerium sp. 0 0 0 0 0 Dictyosphaerium 0 0 12 295Crucigeniella sp 36 2358 11 722 9 598 Crucigeniella sp 2 141 0 0Diatoms (Bacillariophyceae)Diatoms (Bacillariophyceae)Asterionella formosa 10 2785 22 6143 55 15299 Asterionella formosa 366 102400 215 60333Aulacoseira granulata 7 2176 0 0 102 31529 Aulacoseira granulata 30 9392 18 5441Aulacoseira granulata var. angustissima 0 0 15 3955 0 0 Aulacoseira granulata var. angustissima 0 0 4 1014Aulacoseria sp. 0 0 0 0 0 0 Aulacoseria sp. 0 0 0 0Cyclotella stelligera 1 187 9 1404 2 346 Cyclotella stelligera 5 866 21 3432Fragilaria crotonensis 18 6492 35 12566 24 8716 Fragilaria crotonensis 0 0 34 12217Nitzschia sp. 1 456 2 913 2 844 Nitzschia sp. 5 2110 1 380Synedra sp. 0 0 0 0 0 0 Synedra sp. 1 213 0 0Amphora sp. 0 0 0 0 0 0 Amphora sp. 0 0 0 0Cocconeis 0 1 306 0 0 Cocconeis 0 0 0 0Desmids (Mesotaeniaceae, Desmidiaceae)Desmids (Mesotaeniaceae, Desmidiaceae)Closterium aciculare 0 0 1 350 0 0 Closterium aciculare 0 0 0 0Closterium acutum var. variable 0 0 0 0 1 204 Closterium acutum var. variable 0 0 1 368Chrysophtya (Chrysophyceae) Chrysophtya (Chrysophyceae) 0 0Dinobryon sp. 8 449 0 0 0 0 Dinobryon sp. 0 0 0 0Cryptomonas sp. 0 0 1 84 1 78 Cryptomonas sp. 0 0 0 0Dinoflagellates (Dinophyceae)Dinoflagellates (Dinophyceae)Ceratium hirundinella 0 0 0 0 0 0 Ceratium hirundinella 0 0 0 0Gymnodinium sp. 1 1 1287 1 644 2 1785 Gymnodinium sp. 1 0 0 0 0Gymnodinium sp. 2 0 0 0 2925 0 0 Gymnodinium sp. 2 0 0 0 0Peridinium sp. 0 0 0 0 0 0 Peridinium sp. 0 0 0 0Gonyaulax sp. 1 2340 1 1170 0 0 Gonyaulax sp. 0 0 0 0Flagellates 5µm Flagellates 5µm 0 0Flagellates < 5µm/unicells 67 2334 51 1781 76 2651 Flagellates < 5µm/unicells 328 11494 193 6757<strong>Lake</strong> <strong>Taupo</strong> Long-<strong>term</strong> Monitoring Programme 2010 - 2011 111
<strong>Lake</strong> <strong>Taupo</strong> phytoplankton enumeration (10-m tube) 2007-08Cell counts and biovolumeCells per ml numbers may be affected by roundingSample code TZ2 TZ2 TZ4 TZ4 WF2 WF2 XX1 XX1 XX4 XX4 AM1 AM1 BM1 BM1 BM3 BM3 DT1 DT1 EO1 EO1 EO3 EO3 EO5 EO5Sampling date 8/08/2007 8/08/2007 23/08/2007 23/08/2007 11/09/2007 11/09/2007 9/10/2007 9/10/2007 30/10/2007 30/10/2007 15/11/2007 15/11/2007 4/12/2007 4/12/2007 20/12/2007 20/12/2007 17/01/2008 17/01/2008 31/01/2008 31/01/2008 14/02/2008 14/02/2008 27/02/2008 27/02/2008Species composition by class Cell Biovolume Cell Biovolume Cell Biovolume Cell Biovolume Cell Biovolume Cell Biovolume Cell Biovolume Cell Biovolume Cell Biovolume Cell Biovolume Cell Biovolume Cell Biovolume(per ml) (µm 3 ) (per ml) (µm 3 ) (per ml) (µm 3 ) (per ml) (µm 3 ) (per ml) (µm 3 ) (per ml) (µm 3 ) (per ml) (µm 3 ) (per ml) (µm 3 ) (per ml) (µm 3 ) (per ml) (µm 3 ) (per ml) (µm 3 ) (per ml) (µm 3 )Blue greens (Cyanophyceae)Anabaena lemmermannii 2 64 3 108 1 27 17 696 51 2100 18 725 1 27 29 1175 28.7 1175 21.3 875 25.0 1025 85.8 3518Pseudanabaena limnetica 0 0 0 0 0 0 0 0 0 0 0 0 0 0 0 0 0.1 2 0.0 0 0.0 0 0.5 9Chroococcus sp. 0 0 1 6 0 0 0 0 0 0 0 0 0 0 0 0 0.0 0 0.0 0 0.0 0 0.0 0Microcystis sp. 0 0 0 0 0 7 0 0 0 0 0 0 0 0 0 0 0.0 0 0.0 0 0.0 0 0.0 0c.f Rivularia sp. 0 0 0 0 1 19 0 0 0 0 0 0 0 0 0 0 0 0 0 0 0 0 0 0Aphanothece sp. 0 0 1 15 0 1 0 0 0 0 0 0 0 0 0 0 0.0 0 0.0 0 0.0 0 0.0 0Aphanizomenon sp. 2 30 0 0 0 0 0 0 0 0 2 32 3 48 4 78 0.0 0 0.0 0 0.0 0 4.0 76Leptolyngbya sp. 0 0 0 0 0 0 0 0 0 0 0 0 0 0 1 8 0.0 0 0.0 0 0.0 0 0.0 0Greens (Chlorophyceae)Monoraphidium sp. / Ankistrodesmus falcatus 20 839 17 695 3 123 6 247 10 418 28 1189 18 737 114 4785 66 2764 0 0 0 0 0 0Stichococcus contortus 175 0 97 1749 25 453 0 0 0 0 0 0 3 53 0 0 0 0 0 0 0 0 0 0Kirchneriella contorta 0 0 0 0 56 1853 0 0 0 0 0 0 0 0 0 0 0 0 0 0 0 0 0 0Botryococcus braunii 0 0 0 4800 0 0 0 0 0 0 0 0 0 1100 1 92840 0 0 0 0 0 0 0 259720Chlamydomonas sp. 0 0 0 0 0 0 0 0 0 0 0 0 0 0 0 0 0 0 0 0 0 0 0 0Elakotothrix gelatinosa 0 0 0 0 0 0 0 0 0 0 0 0 0 0 5 532 0 0 0 0 0 0 2 246Eudorina elegans 0 0 0 0 0 0 0 0 1 300 0 0 0 0 0 0 2 624 4 1108 0 0 3 749Lagerheimia sp. 0 0 0 0 0 0 0 0 0 0 0 0 0 0 0 0 0 0 0 0 0 0 0 0Oocytsis sp. 0 0 0 0 1 166 5 758 5 665 0 0 1 166 6 839 2 277 0 0 0 0 0 0Planktosphaeria gelatinosa 0 0 0 0 0 0 0 0 0 0 0 0 0 0 0 0 0 0 0 0 0 0 0 0Quadrigula lacustrus 0 0 5 788 3 480 0 0 0 0 0 0 0 0 3 554 0 0 0 0 0 0 0 0Westella botryoides 10 634 29 1909 0 0 0 0 9 608 0 0 0 0 0 0 17 1077 0 0 0 0 0 0Paulschulzia sp. 0 0 0 0 0 0 0 0 0 0 0 0 0 0 0 0 0 0 0 0 0 0 0 0Diatoms (Bacillariophyceae)Asterionella formosa 275 77123 292 81787 753 210974 124 34838 62 17363 15 4187 4 983 2 473 50 14060 11 3181 0 0 2 655Aulacoseira granulata 0 0 0 0 13 3990 0 0 16 5078 3 993 0 0 0 0 0 0 0 0 0 0 0 0Aulacoseira granulata var. angustissima 52 13436 11 2777 0 0 0 0 3 761 0 0 0 0 0 0 2 507 0 0 0 0 0 0Cyclotella stelligera 14 2184 11 1709 8 1310 9 1452 11 1685 0 0 0 0 0 0 1 156 0 0 0 0 0 0Fragilaria crotonensis 57 20419 27 9750 0 0 0 0 0 0 2 574 1 209 9 3324 19 6806 5 1743 0 0 13 4607Nitzschia sp. 0 0 5 2083 1 228 0 0 0 0 0 0 1 456 14 5596 1 380 0 0 0 0 2 684Synedra sp. 1 0 0 0 1 1638 0 0 1 0 0 0 0 0 0 0 0 0 0 0 0 0 0 0Small unknown diatom sp. 0 0 0 0 0 0 0 0 0 0 0 0 0 0 0 0 0 0 1 60 0 0 0 0Desmids (Mesotaeniaceae, Desmidiaceae)Closterium aciculare 0 0 0 0 0 0 0 160 0 0 1 320 1 350 1 506 0 0 0 0 0 0 0 0Closterium acutum var. variable 1 551 1 201 1 221 0 0 0 0 0 0 0 0 0 0 0 0 0 0 0 0 0 0Chrysophtya (Chrysophyceae)Dinobryon sp. 21 1266 2 126 0 0 146 8633 297 17534 81 4789 76 4487 8 448 7 431 6 383 32 1915 73 4314Cryptomonas sp. 0 0 1 77 0 0 1 77 0 0 0 0 0 0 0 0 0 0 0 0 0 0 0 0Mallomonas sp. 0 0 0 0 0 0 0 0 0 0 0 0 0 0 0 0 0 0 0 0 0 0 0 0Dinoflagellates (Dinophyceae)Gymnodinium sp. 1 0 1463 0 0 0 0 1 3204 1 1755 0 0 1 1755 1 2532 0 0 6 17853 4 10820 16 49140Gymnodinium sp. 2 0 12188 1 13350 0 0 0 6675 0 0 0 0 0 7313 3 63300 0 6094 0 0 0 0 3 73125Flagellates 5µmFlagellates < 5µm/unicells 153 6582 296 10354 112 3911 129 4504 93 3256 78 2729 125 4382 526 18403 83 2901 99 3465 39 1373 60 2109112 <strong>Lake</strong> <strong>Taupo</strong> Long-<strong>term</strong> Monitoring Programme 2010 - 2011
Sample code HT1 HT1 HT3 HT3 KB1 KB1 LB1 LB1 LB3 LB3 MW1 MW1 MW3 MW3 OL1 OL1 OL3 OL3 QA2 QA2 QA4 QA4 RL2 RL2Sampling date 13/03/2008 13/03/2008 26/03/2008 26/03/2008 17/04/2008 17/04/2008 7/05/2008 7/05/2008 22/05/2008 22/05/2008 5/06/2008 5/06/2008 18/06/2008 18/06/2008 1/07/2008 1/07/2008 15/07/2008 15/07/2008 7/08/2008 7/08/2008 20/08/2008 20/08/2008 4/09/2008 4/09/2008Species composition by class Cell Biovolume Cell Biovolume Cell Biovolume Cell Biovolume Cell Biovolume Cell Biovolume Cell Biovolume Cell Biovolume Cell Biovolume Cell Biovolume Cell Biovolume Cell Biovolume(per ml) (µm 3 ) (per ml) (µm 3 ) (per ml) (µm 3 ) (per ml) (µm 3 ) (per ml) (µm 3 ) (per ml) (µm 3 ) (per ml) (µm 3 ) (per ml) (µm 3 ) (per ml) (µm 3 ) (per ml) (µm 3 ) (per ml) (µm 3 ) (per ml) (µm 3 )Blue greens (Cyanophyceae)Anabaena lemmermannii 92 3778 7.0 288 56.6 2319 120.6 4946 2.2 91 1.1 46 1.7 71 12.2 500 9.8 403 0.8 32 0.2 7 0.9 37Pseudanabaena limnetica 0.0 0 0.0 0 0.0 0 0.0 0 0.0 0 0.0 0 0.0 0 0.0 0 2.8 53 0.3 5 0.0 0 0.0 0Chroococcus sp. 0.0 0 0.0 0 0.0 0 0.0 0 0.0 0 0.0 0 0.0 0 0.0 0 0.0 0 0.0 0 0.0 0 0.0 0Microcystis sp. 0.0 0 0.0 0 0.0 0 0.0 0 0.0 0 0.0 0 0.0 0 0.0 0 0.0 0 0.0 0 0.0 0 0.0 0c.f Rivularia sp. 0 0 0 0 0 0 0 0 0 0 0 0 0 0 0 0 0 0 0 0 0 0 0 0Aphanothece sp. 0.0 0 0.0 0 0.0 0 0.0 0 0.0 0 0.0 0 0.0 0 0.0 0 0.0 0 0.0 0 0.0 0 0.0 0Aphanizomenon sp. 0.0 0 0.0 0 0.0 0 0.0 0 0.0 0 0.0 0 0.0 0 0.0 0 0.0 0 0.0 0 0.0 0 0.0 0Leptolyngbya sp. 0.0 0 0.0 0 0.0 0 0.0 0 0.0 0 0.0 0 0.0 0 0.0 0 0.0 0 0.0 0 1.4 16 0.0 0Greens (Chlorophyceae)Monoraphidium sp. / Ankistrodesmus falcatus 0 0 0 0 0 0 5 197 0 0 0 0 0.0 0 188 7907 0 0 73 3047 73 3071 130 5479Stichococcus contortus 0 0 0 0 0 0 0 0 0 0 0 0 0.0 0 0 0 0 0 0.0 0 0 0 26 474Kirchneriella contorta 0 0 0 0 0 0 0 0 0 0 0 0 0.0 0 0 0 0 0 0.0 0 0 0 0 0Botryococcus braunii 0.1 469151 0 14435 0.04 259837 0 104870 0 28871 0 132806 0.0 3609 0 5774 0.1 226456 0.0 5413 0 0 0.0 17746Chlamydomonas sp. 0 0 0 0 0 0 0 0 0 0 0 0 0 0 0 0 0 0 0 0 0 0 0 0Elakotothrix gelatinosa 2 246 6 676 1 123 4 369 2 246 1 123 0 0 1 114 0 0 0 0 0 0 0 0Eudorina elegans 8 2097 0 0 0 0 0 0 0 0 11 2696 0 0 0 0 0 0 0 0 9 2246 0 0Lagerheimia sp. 0 0 0 0 0 0 0 0 0 0 0 0 0 0 0 0 0 0 0 0 0 0 7 1797Oocytsis sp. 0 0 0 0 1 166 5 665 2 332 0 0 0 0 6 914 0 0 5 665 7 997 0 0Planktosphaeria gelatinosa 0 0 0 0 0 0 0 0 0 0 0 0 0 0 0 0 0 0 0 0 0 0 10 1412Quadrigula lacustrus 0 0 0 0 0 0 0 0 0 0 0 0 0 0 0 0 0 0 0 0 0 0 0 0Westella botryoides 0 0 0 0 0 0 15 951 0 0 0 0 0 0 0 0 0 0 0 0 0 0 0 0Paulschulzia sp. 0 0 0 0 0 0 9 0 0 0 0 0 0 0 0 0 0 0 0 0 0 0 0 0Diatoms (Bacillariophyceae)Asterionella formosa 19 5242 12 3276 5 1310 10 2785 28 7862 25 6880 22 6061 25 7043 102 28501 191 53399 79 22113 94 26208Aulacoseira granulata 0 0 0 0 0 0 2 725 12 3808 13 4171 2 725 0 0 35 10700 151 46788 0 0 18 5622Aulacoseira granulata var. angustissima 0 0 0 0 0 0 4 913 0 0 0 0 0 0 25 6388 0 0 0 0 57 14754 0 0Cyclotella stelligera 0 0 0 0 0 0 3 468 1 187 2 374 1 94 4 562 1 94 1 187 12 1872 18 2902Fragilaria crotonensis 0 0 15 5445 4 1466 0 0 57 20315 61 21781 84 29948 46 16545 30 10890 18 6283 49 17592 59 20943Nitzschia sp. 1 228 1 342 3 1141 2 684 2 913 0 0 1 228 4 1369 4 1597 1 456 0 0 2 684Synedra sp. 0 0 0 0 0 0 0 0 0 0 0 0 0 0 0 0 0 0 0 0 0 0 0 0Small unknown diatom sp. 0 0 0 0 0 0 0 0 0 0 0 0 0 0 0 0 0 0 0 0 0 0 0 0Desmids (Mesotaeniaceae, Desmidiaceae)Closterium aciculare 0 0 0 0 0 0 0 0 0 0 0 0 0 0 0 0 0 0 0 0 0 0 2 1051Closterium acutum var. variable 0 0 0 0 0 0 0 0 0 0 0 0 0 0 1 221 0 0 1 441 0 0 0 0Chrysophtya (Chrysophyceae)Dinobryon sp. 26 1519 2 104 4 242 8 483 8 466 9 518 0 0 9 518 0 0 0 0 0 0 20 1208Dinoflagellates (Dinophyceae)Flagellates 5µmCryptomonas sp. 1 84 0 0 1 84 1 168 1 84 1 84 2 337 0 0 2 337 0 0 0 0 0 0Mallomonas sp. 0 0 0 0 0 0 0 0 0 0 0 0 0 0 3 1053 0 0 0 0 0 0 0 0Gymnodinium sp. 1 6 19305 42 126360 12 36855 5 1843 35 12285 5 1638 4 1229 0 0 6 2048 0 0 0 0 0 0Gymnodinium sp. 2 0 0 0 0 0 0 0 0 0 0 1 29250 0 7313 0 0 1 14625 0 0 0 0 0 0Flagellates < 5µm/unicells 57 1986 56 1945 73 2539 131 4586 47 1638 63 2191 111 3890 121 4238 115 4013 87 3030 207 7228 104 3645<strong>Lake</strong> <strong>Taupo</strong> Long-<strong>term</strong> Monitoring Programme 2010 - 2011 113
<strong>Lake</strong> <strong>Taupo</strong> phytoplankton dominance plus enumeration (10-m tube) 2006-07Dominance by biovolume (rank 1 = dominant,…rank 10 = rare), plus cell counts and biovolume from May 2007Sample code EM8 EM10 EM13 EM17 EM20 EM23 EM27 EM29 EM31 EM34 EM36 EM38 EM40 EM40 EM40 EM42 EM42 EM42 RY2 RY2 RY2 RY5 RY5 RY5Sampling date 26/09/2006 18/10/2006 1/11/2006 5/12/2007 14/12/2007 9/01/2007 8/02/2007 21/02/2007 21/03/2007 3/04/2007 19/04/2007 8/05/2007 22/05/07 22/05/07 22/05/07 14/06/07 14/06/07 14/06/07 27/06/07 27/06/07 27/06/07 18/07/2007 18/07/2007 18/07/2007Species composition by class Rank Rank Rank Rank Rank Rank Rank Rank Rank Rank Rank Rank Rank Biovolume cell Rank Biovolume cell Rank Biovolume cell Rank Biovolume cellBlue greens (Cyanophyceae) (µm 3 ) (per ml) (µm 3 ) (per ml) (µm 3 ) (per ml) (µm 3 ) (per ml)Anabaena lemmermannii 5 5 5 5 9 5 9 9 3 4 5 4 6 303 10 8 450 15 5 1091 36 4 3652 17Anabaena sp. 0 0 0 0 10 29 0 0 0Aphanizomenon sp. 8 8 7 7 9 9 10 5 0 0 0 0 0 10 27 1Phormidium sp. 10 10 10 0 0 0 0 0 0 0 0Greens (Chlorophyceae)Ankistrodesmus falcatus/ Schroederia sp. 9 120 5 0 0Botryococcus braunii 7 2 2 3 3 1 1 1 1 1 5 3 1 1014600 0 1 38448 1 8 438 0 0 0Chlorosarcinopsis sp. 10 10Elakotothrix gelatinosa 6 342 4 0 0 0 0 0 0Eudorina elegans 9 9 10 10 10 10 10 10 10 10 0 0 0 0 0 0 0 0Kirchneriella contorta 0 0 10 157 7 0 0 10 21 1Monoraphidium sp/ Ankistrodesmus falcatus 10 10 10 10 10 10 10 10 8 8 9 7 5 561 19 2 20456 259 2 5061 46 5 2574 12Oocytsis sp. 7 8 9 9 9 10 7 7 10 10 10 9 43 1 6 3210 11 4 1605 5 9 293 1Quadrigula lacustrus 9 0 0 0 0 0 0 0 0Stichococcus contortus 0 0 0 0 7 534 4 6 1073 5Westella botryoides 9 9 9 10 10 10 10 10 0 0 0 0 0 0 0 0Diatoms (Bacillariophyceae) 0Asterionella formosa 2 2 6 4 4 4 5 0 0 6 3173 10 3 4414 14 2 25087 81Aulacoseira granulata 3 1 1 1 2 9 6 2 2 2 1 0 0 4 6760 22 1 7863 25 2 29167 94Aulacoseira granulata var. angustissima 2 3 5590 8 0 0 0 0 0 0Cyclotella stelligera 5 5 9 7 6 6 5 6 0 0 8 427 3 10 71 0 8 468 3Fragilaria crotonensis 1 4 7 6 7 6 6 7 4 2294 6 3 13382 37 10 33 0 1 109152 107Gomphonema sp. 5 5559 14 5 1042 3 7 952 2Nitzschia sp. 10 10 10 10 10 10 10 10 10 10 7 8 155 1unknown diatom sp. 8 0 0 0 0 0 0 0 0Desmids (Mesotaeniaceae, Desmidiaceae)Closterium acutum 9 10 10 9 9 7 8 8 10 10 0 0 7 1335 3 6 668 1 0 0Closterium acutum var. variable 10 10 10 9 8 8 8 8 0 0 0 0 0 0 7 731 1Mougeotia sp. 10 0 0 0 0 0 0 0 0Staurastrum sp. 10 10 10 9 6 0 0 0 0 0 0 0 0Chrysophtya (Chrysophyceae)Cryptomonas sp. 10 10 10 10 10 10 10 10 0 0 9 267 1 9 196 1 9 293 1Dinobryon sp. 9 3 3 2 1 2 6 8 3 5 2 1 7 256 1 0 0 0 0 0 0Dinoflagellates (Dinophyceae)Ceratium hirundinella 10 10 10 10 4 1 3 0 0 0 0 0 0 0 0Gymnodinium sp. 5 7 4 3 5 7 3 3 4 6 4 2 11748 1 0 0 0 0 0 0Gymnodinium sp. 2 8 0 0 0 0 3 4450 0 0 0Flagellates 5µmFlagellates < 5µm/unicells 3 6 8 6 6 6 2 4 5 4 3 4 4 2138 50 3 16227 381 1 7521 177 3 4133 97114 <strong>Lake</strong> <strong>Taupo</strong> Long-<strong>term</strong> Monitoring Programme 2010 - 2011
<strong>Lake</strong> <strong>Taupo</strong> phytoplankton species composition and biovolume (μm 3 ) 2010-2011From Site A (Mid <strong>Lake</strong>) 10/11/2010Sample code KD1 KD2 KD3 KD6 KD11 KD16 KD1 KD2 KD3 KD6 KD11 KD16Depth Surface 10m 20m 50m 100m 150m Surface 10m 20m 50m 100m 150m10/11/2010 10/11/2010 10/11/2010 10/11/2010 10/11/2010 10/11/2010 10/11/2010 10/11/2010 10/11/2010 10/11/2010 10/11/2010 10/11/2010Cells/ml Cells/ml Cells/ml Cells/ml Cells/ml Cells/ml µm3 µm3 µm3 µm3 µm3 µm3Blue greens (Cyanophyceae)Anabaena c.f. lemmermannii 11.4 48.7 25.5 6.1 0.0 0.0 1023 4387 2293 547 0 0Aphanocapsa sp. 0.0 0.0 0.0 0.0 0.0 8.2 0 0 0 0 0 74Pseudanabaena sp. 0.0 0.0 0.0 0.0 0.1 40.6 0 0 0 0 3 772Greens (Chlorophyceae)Actinastrum hantschii 0 0 0.0 0 0 0.2 0 0 0 0 0 0Monoraphidium sp. / Ankistrodesmus falcatus 382 539 235 115 38 0.4 16042 22631 9884 4817 1593 15Stichococcus contortus 0 0 0 18 9 0.0 0 0 0 321 160 0Botryococcus braunii (colonies) 0.0 0 0 0 0 0 0 0 0 0 110 0Dictyosphaerium sp. 1 20 2 9 0 0 0 0 0 0 0 0Eudorina elegans 1 1 1 1 0 0 277 150 138 300 0 0Oocytsis sp. 4 2 2 9 2 0 615 332 307 1246 229 0Scenedesmus sp. 0 2 0 2 0 10 0 122 0 122 0 504Diatoms (Bacillariophyceae)Asterionella formosa 102 129 73 104 10 6 28630 36036 20450 29156 2711 1582Aulacoseira granulata 18 137 76 235 88 140 5534 42436 23479 72903 27390 43274Aulacoseira granulata var. angustissima 0 0 0 18 5 0 0 0 0 4715 1259 0Cyclotella stelligera 2 2 2 4 0 4 346 374 346 655 0 581Fragilaria crotonensis 16 15 6 4 0 0 5810 5236 2130 1257 0 0Nitzschia sp. 0 5 3 2 4 4 0 1825 1266 684 1573 1731Synedra sp. 3 0 0 1 1 0 1279 0 0 461 318 0Desmids (Mesotaeniaceae, Desmidiaceae)Closterium acutum var. variable 0 0 0 2 0 1 0 0 0 662 152 456Mougeotia sp. 0 0 0 2 0 0 0 0 0 0 0 0Staurastrum tangaroaii 0 1 1 0 0 0 0 0 0 0 0 0Chrysophtya (Chrysophyceae)Dinobryon sp. 62 191 145 13 0 0 3639 11252 8554 759 0 0Cryptomonas sp. 0 0 0 1 1 0 0 0 0 168 116 0Dinoflagellates (Dinophyceae)Gymnodinium sp. 1 0 1 1 0 0 1 0 644 1190 0 0 888Gymnodinium sp. 2 0 0 1 1 0 0 0 0 27050 14625 0 0Gonyaulax sp. 207 2 4 0 0 0 413324 4680 7574 0 0 0Flagellates 5µmFlagellates < 5µm/unicells 214 205 188 147 26 28 7498 7166 6589 5160 918 988<strong>Lake</strong> <strong>Taupo</strong> Long-<strong>term</strong> Monitoring Programme 2010 - 2011 115
<strong>Lake</strong> <strong>Taupo</strong> phytoplankton species composition and biovolume (μm 3 ) 2010-2011From Site A (Mid <strong>Lake</strong>) 13/04/2011Sample code RL1 RL2 RL6 RL11 RL16 RL1 RL2 RL6 RL11 RL16Depth 0m 10m 50m 100m 150m 0m 10m 50m 100m 150m13/04/2011 13/04/2011 13/04/2011 13/04/2011 13/04/2011 13/04/2011 13/04/2011 13/04/2011 13/04/2011 13/04/2011Cells/ml Cells/ml Cells/ml Cells/ml Cells/ml µm3 µm3 µm3 µm3 µm3Blue greens (Cyanophyceae)Dolichospermum c.f. lemmermannii(formally; Anabaena c.f. lemmermannii) 16.7 5.0 0.4 0.0 0.0 1933 580 42 0 0Gloeocapsa sp. 0.0 0.0 0.2 0.0 0.0 0 0 2 0 0Snowella sp. 0.0 0.0 0.0 0.2 0.0 0 0 0 5 0Pseudanabaena sp. 2.8 0.0 0.0 0.0 0.0 54 0 0 0 0Greens (Chlorophyceae)Monoraphidium sp. / Ankistrodesmus falcatus 2 1 5 1 2 74 49 217 49 74Botryococcus braunii (colonies) 0 1 0 0 0 8760 512447 0 0 0Dictyosphaerium 2 2 2 0 0 97 97 97 0 0Elakotothrix gelatinosa 2 0 0 0 0 227 0 0 0 0Eudorina elegans 0 0 0 0 0 18 0 0 0 0Oocytsis sp. 44 55 1 0 0 6223 7808 166 0 0Diatoms (Bacillariophyceae)Asterionella formosa 3 3 2 1 2 746 819 655 328 655Aulacoseira granulata 6 1 4 2 2 1753 363 1088 544 725Aulacoseira granulata var. angustissima 0 3 18 19 15 0 760 4563 4867 3802Cyclotella stelligera 3 2 1 2 1 420 374 187 281 94Fragilaria crotonensis 14 23 0 0 0 4889 8377 0 0 0Fragilaria sp. 0 0 1 0 0 0 0 209 0 0Nitzschia sp. 0 0 1 0 0 0 0 228 0 0Synedra sp. 0 1 0 0 0 0 230 0 0 0Rhoicosphenia sp. 0 0 1 0 0 0 0 306 0 0Small unknown diatom sp. 0 0 1 0 0 0 0 129 0 0Desmids (Mesotaeniaceae, Desmidiaceae)Closterium acutum var. variable 0 1 1 0 0 0 221 221 0 0Chrysophtya (Chrysophyceae) 0Dinobryon sp. 13 13 0 1 1 751 794 0 35 35Cryptomonas sp. 0 1 2 0 0 0 84 253 0 0Dinoflagellates (Dinophyceae) 0Gymnodinium sp. 1 1 1 0 0 0 595 643 0 0 0Flagellates 5µm 0Flagellates < 5µm/unicells 35 32 28 6 3 1214 1106 983 225 102116 <strong>Lake</strong> <strong>Taupo</strong> Long-<strong>term</strong> Monitoring Programme 2010 - 2011
<strong>Lake</strong> <strong>Taupo</strong> phytoplankton species composition and biovolume (μm 3 ) 2009-2010From Site A (Mid <strong>Lake</strong>) 19/10/2009Sample code OT1 OT2 OT3 OT6 OT8 OT11 OT16 OT1 OT2 OT3 OT6 OT8 OT11 OT16Depth Surface 10m 20m 50m 70m 100m 150m Surface 10m 20m 50m 70m 100m 150mCell Cell Cell Cell Cell Cell Cell Biovolume Biovolume Biovolume Biovolume Biovolume Biovolume Biovolume(per ml) (per ml) (per ml) (per ml) (per ml) (per ml) (per ml) (µm 3 ) (µm 3 ) (µm 3 ) (µm 3 ) (µm 3 ) (µm 3 ) (µm 3 )Blue greens (Cyanophyceae)Dolichospermum c.f. lemmermannii(formally; Anabaena c.f. lemmermannii) 27.4 6.8 1.1 0.4 0.0 0.0 0.1 2470 610 99 40 0 0 9Chroococcus sp. 0.2 0.0 0.0 0.0 0.0 0.0 0.0 2 0 0 0 0 0 0Microcystis sp. 0.0 0.9 0.0 0.0 0.0 0.0 0.0 0 19 0 0 0 0 0Dictyosphaerium sp. 18.0 31.6 31.3 7.4 2.7 0.4 0.0 451 789 782 186 67 11 0Phormidium sp. 0.0 0.0 0.0 0.0 0.0 0.0 0.0 0 0 0 0 0 0 0Pseudanabaena sp. 0.0 0.0 0.0 0.0 0.2 0.0 0.0 0 0 0 0 4 0 0Greens (Chlorophyceae)Monoraphidium sp. / Ankistrodesmus falcatus2 4 0 0 12 0 0 68 147 0 0 491 0 0Botryococcus braunii (colonies) 0.0 0 0 0 0 0 0 30946 0 950 0 0 0 1900Crucigeniella sp 4 8 0 0 0 2 0 281 494 0 0 0 152 0Dictyosphaerium sp. 0 0 0 0 0 0 9 0 0 0 0 0 0 658Eudorina elegans 0 0 0 11 0 0 0 0 0 0 2696 0 0 0Nephrocytium agardhianum 0 11 5 0 0 0 0 0 790 351 0 0 0 0Oocytsis sp. 0 7 5 0 2 2 0 0 997 665 0 332 332 0Westella botryoides 0 0 0 0 0 0 0 0 0 0 0 0 0 0Paulschulzia sp. 0 0 0 0 0 0 0 0 0 0 0 0 0 0Diatoms (Bacillariophyceae)Asterionella formosa 128 218 97 78 26 4 43 35749 60934 27191 21785 7207 983 12121Aulacoseira granulata var. angustissima 17 49 43 21 65 40 36 4360 12624 11103 5476 16883 10343 9278Cyclotella stelligera 4 5 1 2 11 15 18 692 842 187 374 1778 2340 2808Fragilaria crotonensis 267 467 352 153 76 32 47 95677 167335 126077 54871 27226 11519 16754Nitzschia sp. 1 0 1 0 0 0 0 422 0 228 0 0 0 0Synedra sp. 1 2 0 0 0 0 2 213 922 0 0 0 0 691Desmids (Mesotaeniaceae, Desmidiaceae)Closterium aciculare 0 1 1 0 0 0 0 0 350 350 0 0 0 0Closterium acutum var. variable 2 1 0 1 2 1 1 612 441 0 441 662 221 441Chrysophtya (Chrysophyceae)Dinobryon sp. 23 70 140 89 3 0 0 1373 4142 8284 5246 173 0 0Cryptomonas sp. 0 0 0 1 1 0 0 0 0 0 84 168 0 0Dinoflagellates (Dinophyceae)Gymnodinium sp. 1 1 0 0 0 0 0 0 595 0 0 0 0 0 0Gymnodinium sp. 2 0 0 0 0 0 0 0 0 0 2925 2925 0 0 0Peridinium sp. 0 0 0 0 0 0 0 0 0 0 1170 0 0 0Gonyaulax sp. 0 0 0 0 0 0 0 0 0 0 0 0 0 0Flagellates 5µmFlagellates < 5µm/unicells 144 294 211 172 159 79 102 5037 10299 7371 6020 5569 2764 3583<strong>Lake</strong> <strong>Taupo</strong> Long-<strong>term</strong> Monitoring Programme 2010 - 2011 117
<strong>Lake</strong> <strong>Taupo</strong> phytoplankton species composition and biovolume (μm 3 ) 2009-2010From Site A (Mid <strong>Lake</strong>) 7/04/2010Sample code YZ1 YZ2 YZ3 YZ6 YZ11 YZ16 YZ1 YZ2 YZ3 YZ6 YZ11 YZ16Depth Surface 10m 20m 50m 100m 150m Surface 10m 20m 50m 100m 150mCell Cell Cell Cell Cell Cell Biovolume Biovolume Biovolume Biovolume Biovolume Biovolume(per ml) (per ml) (per ml) (per ml) (per ml) (per ml) (µm 3 ) (µm 3 ) (µm 3 ) (µm 3 ) (µm 3 ) (µm 3 )Blue greens (Cyanophyceae)Anabaena c.f. lemmermannii 10.2 27.6 15.4 5.3 0.3 0.6 921 2482 1390 475 27 53Dolichospermum planctonicum (formerly;Anabaena planktonica) 0.6 0.0 0.0 0.0 0.0 0.0 242 0 0 0 0 0Aphanocapsa sp. 0.0 0.0 0.0 0.0 0.4 0.0 0 0 0 0 4 0cf Heteroleibleinia sp. 0.0 0.0 0.3 0.0 0.0 0.0 0 0 5 0 0 0Phormidium sp. 0.0 0.0 0.0 0.0 0.0 0.4 0 0 0 0 0 8Pseudanabaena sp. 0.0 0.0 0.0 0.0 2.3 0.3 0 0 0 0 44 6Greens (Chlorophyceae)Monoraphidium sp. / Ankistrodesmus falcatus0 0 0 111 0 0 0 0 0 4643 0 0Botryococcus braunii (colonies) 0.0 0 0 0 0 0 1200 76 6621 0 76 76Elakotothrix gelatinosa 1 0 0 0 0 0 157 0 0 0 0 0Eudorina elegans 0 0 4 0 0 0 96 0 930 0 0 0Nephrocytium agardhianum 10 2 2 2 0 0 182 0 0 0 0Nephrocytium lunatum 0 5 0 0 0 0 784 387 121 121 0 0Oocytsis sp. 16 28 12 23 2 15 2225 4010 1719 3208 344 2177Quadrigula lacustrus 1 0 0 0 0 0 245 0 0 0 0 0Scenedesmus sp. 0 2 0 3 0 0 0 84 0 168 0 0Diatoms (Bacillariophyceae)Asterionella formosa 0 0 0 0 1 0 0 0 0 0 226 0Aulacoseira granulata 0 0 0 0 0 8 116 0 0 0 0 2626Aulacoseira granulata var. angustissima 0 0 0 1 5 0 0 0 0 210 1259 0Cocconeis 0 0 0 0 0 0 0 0 211 0 0 0Cyclotella stelligera 4 0 0 2 0 1 716 0 0 323 0 194Fragilaria crotonensis 0 23 7 8 2 1 134 8088 2600 2744 578 433Nitzschia sp. 2 4 4 0 1 0 873 1416 1416 0 315 0Eunotia sp. 4 0 0 0 0 0 0 0 0 0 0 0Desmids (Mesotaeniaceae, Desmidiaceae)Closterium acutum var. variable 0 0 0 1 1 0 0 0 0 304 456 152Staurastrum sp. 0 0 0 0 0 0 0 0 0 1 0 0Chrysophtya (Chrysophyceae)Dinobryon sp. 42 13 61 6 0 0 2487 738 3618 381 0 0Cryptomonas sp. 0 0 0 2 0 0 0 0 58 232 0 0Dinoflagellates (Dinophyceae)Ceratium hirundinella 0 0 2 4 0 0 126 147 246 369 0 0Gymnodinium sp. 1 0 1 0 0 0 0 0 888 0 0 444 0Gymnodinium sp. 2 0 1 0 0 0 0 0 20172 0 0 0 0Gonyaulax sp. 6 5 3 0 0 0 12686 10490 5648 0 0 0Flagellates 5µmFlagellates < 5µm/unicells 47 59 56 40 11 19 1658 2062 1949 1384 395 650118 <strong>Lake</strong> <strong>Taupo</strong> Long-<strong>term</strong> Monitoring Programme 2010 - 2011
<strong>Lake</strong> <strong>Taupo</strong> phytoplankton species composition and biovolume (μm 3 ) 2008-2009From Site A (Mid <strong>Lake</strong>) 15/04/2009Sample code SZ1 SZ2 SZ3 SZ6 SZ11 SZ16 SZ1 SZ2 SZ3 SZ6 SZ11 SZ16Depth Surface 10m 20m 50m 100m 150m Surface 10m 20m 50m 100m 150mCell Cell Cell Cell Cell Cell Biovolume Biovolume Biovolume Biovolume Biovolume Biovolume(per ml) (per ml) (per ml) (per ml) (per ml) (per ml) (µm 3 ) (µm 3 ) (µm 3 ) (µm 3 ) (µm 3 ) (µm 3 )Species composition by classBlue greens (Cyanophyceae)Dolichospermum c.f. lemmermannii(formally; Anabaena c.f. lemmermannii) 0.0 1.3 0.0 0.8 0.0 0.0 0 51 0 31 0 0Aphanothece sp. 0.0 0.0 0.0 0.0 7.3 0.0 0 0 0 0 66 0Pseudanabaena sp. 0.0 0 0.0 0.0 22.2 5.3 0 0 0 0 422 100Greens (Chlorophyceae)Monoraphidium sp. / Ankistrodesmus falcatus 68 71 0.5 55 13 6 2875 2998 22 2318 545 273Stichococcus contortus 0 0 0.0 0 17 15 0 0 0 0 302 263Kirchneriella contorta 0 0 0.0 1 0 0 0 0 0 36 0 0Botryococcus braunii (colonies) 0.0 0 0.0 0.0 0 0 0 0 21653 16240 76507.95 0Elakotothrix gelatinosa 5 10 2 2 0 0 491 1044 227 227 0 0Nephrocytium agardhianum 2 0 0 0 0 0 0 0 0 0 0 0Oocytsis sp. 6 1 4 1 4 1 831 166 581 166 498 166Quadrigula lacustrus 2 0 0 0 0 0 384 0 0 0 0 0Diatoms (Bacillariophyceae)Asterionella formosa 94 71 102 71 6 2 26372 19820 28501 19984 1802 655Aulacoseira granulata 0 0 0 1 3 1 0 0 0 363 907 363Aulacoseira granulata var. angustissima 1 22 8 8 0 0 304 5628 2129 1977 0 0Cyclotella stelligera 5 4 11 4 2 2 842 562 1685 562 374 281Fragilaria crotonensis 151 42 9 183 15 7 54033 14870 3141 65552 5236 2513Synedra sp. 1 0 0 0 0 0 0 0 0 0 0 0Eunotia sp. 0 1 0 0 0 0 0 0 0 0 0 0Desmids (Mesotaeniaceae, Desmidiaceae)Closterium aciculare 1 1 0 1 0 0 701 701 0 701 0 0Closterium acutum var. variable 0 0 1 0 1 1 0 0 221 0 221 221Chrysophtya (Chrysophyceae)Dinobryon sp. 1 0 32 3 0 0 69 0 1898 173 0 0Cryptomonas sp. 0 1 0 1 0 0 0 84 0 84 0 0Dinoflagellates (Dinophyceae)Gymnodinium sp. 2 1 0 1 0 0 0 14625 0 14625 0 0 0Flagellates 5µmFlagellates < 5µm/unicells 132 201 111 140 24 13 4607 7023 3870 4914 839 450<strong>Lake</strong> <strong>Taupo</strong> Long-<strong>term</strong> Monitoring Programme 2010 - 2011 119
<strong>Lake</strong> <strong>Taupo</strong> phytoplankton species composition and biovolume (μm 3 ) 2008-2009From Site A (Mid <strong>Lake</strong>) 14/10/2008Sample code EU1 EU2 EU6 EU8 EU11 EU16 EU1 EU2 EU6 EU8 EU11 EU16Depth Surface 10m 50m 70m 100m 150m Surface 10m 50m 70m 100m 150mCell Cell Cell Cell Cell Cell Biovolume Biovolume Biovolume Biovolume Biovolume Biovolume(per ml) (per ml) (per ml) (per ml) (per ml) (per ml) (µm 3 ) (µm 3 ) (µm 3 ) (µm 3 ) (µm 3 ) (µm 3 )Species composition by classBlue greens (Cyanophyceae)Dolichospermum c.f. lemmermannii (formally;Anabaena c.f. lemmermannii) 1.2 8.5 1.6 0.0 0.0 0.0 104 767 143 4 0 0Dolichospermum sp. (formally; Anabaena sp.) 0.5 0.9 0.0 0.0 0.0 0.0 49 83 0 0 0 0Pseudanabaena sp. 0.0 0.0 0.0 1.7 0.3 0.6 0 0 0 33 5 11Greens (Chlorophyceae)Monoraphidium sp. / Ankistrodesmus falcatus 0 0 54 2 19 2 0 0 2260 66 786 82Botryococcus braunii (colonies) 0.0 1 0 0 1 0 123784 1111500 370500 0 741000 0Crucigeniella sp 52 53 5 3 0 0 3399 3448 304 203 0 0Elakotothrix gelatinosa 1 0 0 0 0 0 76 0 0 0 0 0Eudorina elegans 0 11 2 0 0 0 0 2796 599 0 0 0Oocytsis sp. 3 0 2 0 1 0 410 0 222 0 111 0Westella botryoides 0 5 3 2 0 0 0 304 203 152 0 0Paulschulzia sp. 2 0 0 0 0 0 0 0 0 0 0 0Diatoms (Bacillariophyceae)Asterionella formosa 3 6 4 4 1 1 707 1638 1201 1092 218 218Aulacoseira granulata 0 2 4 9 5 1 0 605 1209 2660 1693 242Aulacoseira granulata var. angustissima 0 2 6 0 0 2 0 507 1622 0 0 406Cyclotella stelligera 1 1 4 1 0 0 115 187 686 125 62 62Fragilaria crotonensis 6 10 0 0 0 1 2066 3630 0 0 0 419Nitzschia sp. 0 0 0 0 0 0 70 152 0 0 0 152Desmids (Mesotaeniaceae, Desmidiaceae)Closterium aciculare 0 0 0 0 0 0 0 0 117 0 0 0Closterium acutum var. variable 0 0 0 2 0 0 0 0 147 735 0 0Chrysophtya (Chrysophyceae)Dinobryon sp. 7 2 0 0 0 0 426 138 0 0 0 0Cryptomonas sp. 0 0 1 0 0 0 0 0 168 0 0 0Dinoflagellates (Dinophyceae)Gymnodinium sp. 1 0 2 0 0 0 0 0 2145 0 0 0 0Gymnodinium sp. 2 0 1 0 0 0 0 0 19500 0 0 0 0Gonyaulax sp. 1 1 0 0 0 0 2164 1560 0 0 0 0Flagellates 5µmFlagellates < 5µm/unicells 34 46 27 22 10 9 1174 1611 956 778 355 300120 <strong>Lake</strong> <strong>Taupo</strong> Long-<strong>term</strong> Monitoring Programme 2010 - 2011
<strong>Lake</strong> <strong>Taupo</strong> phytoplankton species composition and biovolume (μm 3 ) 2007-2008From Site A (Mid <strong>Lake</strong>) 30/10/2007Sample code ZA1 ZA2 ZA3 ZA6 ZA8 ZA11 ZA16 ZA1 ZA2 ZA3 ZA6 ZA8 ZA11 ZA16Depth Surface 10m 20m 50m 70m 100m 150m Surface 10m 20m 50m 70m 100m 150mSpecies composition by class cell cell cell cell cell cell cell Biovolume Biovolume Biovolume Biovolume Biovolume Biovolume Biovolume(per ml) (per ml) (per ml) (per ml) (per ml) (per ml) (per ml) (µm 3 ) (µm 3 ) (µm 3 ) (µm 3 ) (µm 3 ) (µm 3 ) (µm 3 )Blue greens (Cyanophyceae)Anabaena lemmermannii 18.7 22.0 2.9 0.4 0.0 0.0 1.6 1683 1976 257 33 0 0 140Chroococcus sp. 0.0 0.0 0.0 0.1 0.0 0.0 0.0 0 0 0 1 0 0 0Aphanocapsa sp. 0.0 0.0 0.0 6.9 0.0 5.8 6.6 0 0 0 62 0 52 59Planktolyngbya sp. 21.3 0.0 0.0 0.0 0.0 0.0 0.0 192 0 0 0 0 0 0Pseudanabaena sp. 0.0 0.0 0.0 0.0 0.0 4.9 0.3 0 0 0 0 0 94 6Greens (Chlorophyceae)Monoraphidium sp. / Ankistrodesmus falcatus 52 21 29 15 6 0 0 2187 885 1229 614 270 0 0Stichococcus contortus 39 6 13 15 6 2 4 706 116 242 274 116 42 63Botryococcus braunii (colonies) 0 0 0 1 0 0 0 0 0 0 235139 0 804 0Eudorina elegans 13 3 7 0 0 0 0 3295 749 1797 0 0 0 0Crucigeniella sp. 0 2 8 5 5 0 0 0 152 532 304 304 0 0Nephrocytium agardhianum 0 0 0 0 0 0 0 0 0 0 0 0 0 0Oocytsis sp. 9 4 0 1 0 9 1 1246 498 0 166 0 1246 166Diatoms (Bacillariophyceae)Asterionella formosa 33 73 102 62 34 4 14 9173 20311 28665 17363 9500 983 3931Aulacoseira granulata 15 37 91 25 9 25 13 4715 11606 28109 7617 2902 7617 4171Aulacoseira granulata var. angustissima 0 0 0 0 0 3 0 0 0 0 0 0 761 0Cyclotella stelligera 6 8 22 9 5 9 10 1030 1217 3557 1404 842 1404 1591Fragilaria crotonensis 11 14 22 7 7 20 2 3770 5026 7958 2513 2513 7330 838Nitzschia sp. 0 0 0 0 0 1 0 0 0 0 0 0 228 0Desmids (Mesotaeniaceae, Desmidiaceae)Closterium aciculare 1 1 0 1 1 1 1 701 350 0 526 526 350 350Closterium acutum var. variable 1 1 0 0 0 0 0 221 265 0 44 0 0 0Chrysophtya (Chrysophyceae)Dinobryon sp. 275 182 227 135 108 1 0 16222 10734 13392 7938 6351 69 0Cryptomonas sp. 0 0 1 1 0 0 0 0 0 168 168 0 0 0Dinoflagellates (Dinophyceae)Gymnodinium sp. 1 0 1 1 1 1 0 0 0 3510 3510 1755 1755 0 0Gymnodinium sp. 2 0 1 0 1 0 0 0 0 14044 26750 1463 0 0 0Flagellates 5µmFlagellates < 5µm/unicells 139 404 406 243 144 25 13 4853 14148 14210 8497 5037 860 450<strong>Lake</strong> <strong>Taupo</strong> Long-<strong>term</strong> Monitoring Programme 2010 - 2011 121
<strong>Lake</strong> <strong>Taupo</strong> phytoplankton species composition and biovolume (μm 3 ) 2007-2008From Site A (Mid <strong>Lake</strong>) 17/04/2008Sample code KA1 KA2 KA3 KA6 KA11 KA16 KA1 KA2 KA3 KA6 KA11 KA16Depth Surface 10m 20m 50m 100m 150m Surface 10m 20m 50m 100m 150mSpecies composition by class cell cell cell cell cell cell Biovolume Biovolume Biovolume Biovolume Biovolume Biovolume(per ml) (per ml) (per ml) (per ml) (per ml) (per ml) (µm 3 ) (µm 3 ) (µm 3 ) (µm 3 ) (µm 3 ) (µm 3 )Blue greens (Cyanophyceae)Anabaena lemmermannii 44.8 46.9 24.3 0.0 6.5 1.4 4031 4220 2183 0 584 16Pseudanabaena sp. 0.0 0.0 0.0 0.0 0.0 17.4 0 0 0 0 0 331Greens (Chlorophyceae)Monoraphidium sp. / Ankistrodesmus falcatus 14 3 8 8 0 1 590 123 344 344 0 49Stichococcus contortus 6 26 6 0 0 0 116 463 116 0 0 0Botryococcus braunii (colonies) 0 0 0 0 0 1 54 31352 6431 26908 1608 156759Elakotothrix gelatinosa 0 1 1 0 1 0 0 154 123 0 123 0Eudorina elegans 0 6 0 0 0 0 75 1498 75 0 0 0Crucigeniella sp. 0 0 0 1 0 0 0 0 0 76 0 0Oocytsis sp. 2 10 2 0 2 1 332 1412 332 0 332 83Westella botryoides 0 0 0 0 0 0 0 0 0 8 0 0Diatoms (Bacillariophyceae)Asterionella formosa 12 23 32 12 3 4 3276 6552 8935 3276 819 983Aulacoseira granulata 5 16 5 12 5 9 1484 4946 1484 3808 1632 2720Cyclotella stelligera 2 6 2 5 1 1 340 936 340 749 94 94Fragilaria crotonensis 4 10 39 1 1 1 1523 3427 14089 419 419 209Nitzschia sp. 0 0 22 0 0 0 0 0 8442 0 0 0Small unknown diatom sp. 0 0 0 0 1 0 0 0 0 0 64 0Desmids (Mesotaeniaceae, Desmidiaceae)Closterium aciculare 0 1 0 0 1 0 105 701 105 0 350 4Closterium acutum var. variable 0 1 2 2 0 0 0 221 662 662 0 22Chrysophtya (Chrysophyceae)Dinobryon sp. 64 164 101 0 0 0 3797 9664 5971 0 0 0Cryptomonas sp. 1 1 1 3 0 0 84 84 84 421 0 0Dinoflagellates (Dinophyceae)Gymnodinium sp. 1 1 1 1 0 0 0 3191 3191 3191 0 0 0Gymnodinium sp. 2 0 0 0 0 0 0 0 0 0 146 134 0Flagellates 5µmFlagellates < 5µm/unicells 46 126 196 37 7 3 1619 4411 6850 1290 246 102122 <strong>Lake</strong> <strong>Taupo</strong> Long-<strong>term</strong> Monitoring Programme 2010 - 2011
<strong>Lake</strong> <strong>Taupo</strong> phytoplankton species composition and biovolume (μm3) 2006-2007From Site A (Mid <strong>Lake</strong>) 1/11/2006Sample code HW1 HW3 HW6 HW11 HW16 HW1 HW3 HW6 HW11 HW16Depth surface 20 m 50 m 100 m 150 m surface 20 m 50 m 100 m 150 mcell cell cell cell cell Biovolume Biovolume Biovolume Biovolume Biovolume(per ml) (per ml) (per ml) (per ml) (per ml) (µm 3 ) (µm 3 ) (µm 3 ) (µm 3 ) (µm 3 )Species composition by classBlue greens (Cyanophyceae)Anabaena lemmermannii 63 25 0 0 0 3488.1 1367 25 15 0Aphanocapsa sp. 0 0 2 3 0 0 0 14 31 0Greens (Chlorophyceae)Botryococcus braunii (colonies) 0 0 0 0 0 5151 5901 7321 0 0Chlorosarcinopsis sp. 3 0 2 2 0 259 0 182 208 0Eudorina elegans 2 5 6 0 0 621 1198 1498 0 0Kirchneriella contorta 5 4 0 0 0 176 116 0 0 0Lagerheimia sp. 0 1 1 0 0 0 125 166 0 0Monoraphidium sp. / Ankistrodesmus falcatus 3 0 0 0 0 143 0 0 0 0Oocytsis sp. 7 6 6 6 3 1034 872 831 831 415Westella botryoides 0 0 7 0 0 0 0 0 0 0Diatoms (Bacillariophyceae)Asterionella formosa 14 8 7 8 2 3806 2129 1884 2211 573Aulacoseira granulata 63 54 49 47 54 19413 16866 15052 14689 16594Aulacoseira granulata var. angustissima 0 0 2 3 0 0 0 456 837 0Cyclotella stelligera 46 8 4 7 4 7301 1264 562 1123 655Fragilaria crotonensis 5 0 2 8 3 1912 0 628 2723 1047Nitzschia sp. 2 1 1 0 0 947 342 342 0 0Desmids (Mesotaeniaceae, Desmidiaceae)Closterium aciculare 0 0 0 0 0 0 35 175 0 0Closterium acutum var. variable 0 0 0 0 0 0 0 110 0 0Chrysophtya (Chrysophyceae)Dinobryon sp. 8 4 6 0 0 458 242 362 0 0Dinoflagellates (Dinophyceae)Gymnodinium sp. 1 0 1 0 0 0 0 2633 1316 0 88Gymnodinium sp. 2 0 0 0 0 0 6068 0 0 0 0Flagellates 5µmFlagellates < 5µm/unicells 50 19 31 23 4 1750 676 1085 788 143<strong>Lake</strong> <strong>Taupo</strong> Long-<strong>term</strong> Monitoring Programme 2010 - 2011 123
<strong>Lake</strong> <strong>Taupo</strong> phytoplankton species composition and biovolume (μm3) 2006-2007From Site A (Mid <strong>Lake</strong>) 2/04/2007Sample code HW17 HW18 HW19 HW22 HW27 HW32 HW17 HW18 HW19 HW22 HW27 HW32Depth surface 10 m 20 m 50 m 100 m 150 m surface 10 m 20 m 50 m 100 m 150 mcell cell cell cell cell cell Biovolume Biovolume Biovolume Biovolume Biovolume Biovolume(per ml) (per ml) (per ml) (per ml) (per ml) (per ml) (µm 3 ) (µm 3 ) (µm 3 ) (µm 3 ) (µm 3 ) (µm 3 )Species composition by classBlue greens (Cyanophyceae)Anabaena lemmermannii 36 65 56 0 2 0 1493 2655 2286 5 86 10Greens (Chlorophyceae)Botryococcus braunii (colonies) 1 0 0 0 0 0 27630 0 0 41446 0 0Monoraphidium sp. / Ankistrodesmus falcatus 49 17 17 0 1 0 2064 725 725 0 25 0Oocytsis sp. 2 1 1 0 1 0 332 166 125 0 166 0Stichococcus contortus 0 0 0 0 0 1 0 0 0 0 0 21Diatoms (Bacillariophyceae)Asterionella formosa 0 0 1 0 0 1 0 82 246 0 0 164Aulacoseira granulata 2 0 0 5 11 8 544 0 0 1541 3264 2630Aulacoseira granulata var. angustissima 0 0 0 0 7 2 0 0 0 76 1901 608Cyclotella stelligera 1 1 1 1 2 1 168 94 94 234 374 140Eunotia sp. 0 0 0 0 4 0 0 0 0 0 0 0Fragilaria crotonensis 0 0 0 0 0 1 0 0 0 0 0 209Nitzschia sp. 2 0 1 0 0 0 799 114 228 0 0 0Small unknown diatom sp. 0 0 0 0 1 0 0 0 0 0 64 0Desmids (Mesotaeniaceae, Desmidiaceae)Closterium aciculare 0 0 0 1 4 0 0 0 0 350 2453 0Closterium acutum var. variable 0 0 0 1 0 0 0 0 0 331 0 0Chrysophtya (Chrysophyceae)Cryptomonas sp. 0 1 1 4 0 0 0 211 126 590 0 0Dinobryon sp. 0 0 0 1 0 0 0 0 0 86 0 0Dinoflagellates (Dinophyceae)Gymnodinium sp. 1 1 0 0 0 0 0 2106 878 878 176 0 0Gymnodinium sp. 2 1 1 1 0 0 0 14625 21938 14625 0 0 0Flagellates 5µmFlagellates < 5µm/unicells 185 97 84 127 16 10 6470 3389 2928 4433 573 338124 <strong>Lake</strong> <strong>Taupo</strong> Long-<strong>term</strong> Monitoring Programme 2010 - 2011
Appendix 6. Historical dataHistorical data held by NIWA has frequently been referred to and included in some analysisor comparison of the data from the <strong>long</strong>-<strong>term</strong> <strong>monitoring</strong> <strong>programme</strong>. To ensure that thesedata are always readily available, copies of the relevant historical data are included in thisreport. These data are the spring and autumn profiles of NO 3 -N and DRP from 1974 to 1990extracted from archived data books. The nitrate data for 27 September 1979 was taken fromVincent (1983). Subsequent data can be found in the previous appendices.Note that the profiles given are aligned with the spring data above the corresponding autumndata, by date. Note also that the early profiles were to a depth of 110 m rather than 150 m.Also, as there was no March or April data collected in 1976, for completeness, the last validprofile in that series (12 January 1976) has been included.The elapsed time given is the number of days between the spring profile in about Octoberand the autumn profile in March/April of the following year. The average elapsed timebetween the two samplings across all data from 1974 to 2006 is 165 days.The historical data also include an un-paired profile from July 1987. As there were no datafor April 1987 and the lake was still stratified in July, when the next period of <strong>monitoring</strong>began, the July 1987 may be used as an indication of the total mass of nutrient accumulationin that year. Because these data are for an un-paired profile in July and not April, if the dataare converted to rate estimates the assumption must be made that there was no springcarryover and the elapsed time is <strong>long</strong>er, being estimated as the average elapsed time plusthree months.Because the 1976 and 1987 data are for periods other than spring (October/November) toautumn (March/April), these data points have been excluded from any regression analysis oftime-series data although the data points have been plotted as an indication of levels/ratesfor those years.<strong>Lake</strong> <strong>Taupo</strong> Long-<strong>term</strong> Monitoring Programme 2010 - 2011 125
Historical data from Site A in <strong>Lake</strong> <strong>Taupo</strong>Nitrate concentrations (mg m -3 )SpringDate 18/11/1974 16/10/1975 4/10/1977 10/10/1978 27/09/1979 5/10/1987 17/10/1988 6/10/1989Depth (m)0 0.8 0.3 1.1 0.0 0.0 0.3 2.6 1.210 0.3 0.4 1.2 1.4 0.0 0.4 2.7 1.820 0.0 0.0 0.6 0.8 0.5 0.5 2.8 1.030 0.3 0.4 0.0 0.7 0.5 0.4 2.8 1.440 0.8 0.0 0.1 0.6 1.0 0.6 3.0 1.350 2.1 0.3 0.6 0.7 1.0 0.8 2.9 1.060 4.9 0.0 1.0 0.8 0.5 1.2 2.5 0.870 4.1 0.4 1.1 0.8 1.0 1.0 2.9 1.680 5.3 0.0 3.2 1.2 1.5 1.4 2.9 1.690 5.4 0.0 1.3 1.2 1.0 1.5 2.5 1.7100 8.4 1.8 3.3 1.4 1.5 1.2 2.6 1.7110 12.0 4.1 2.8 1.4 1.5 6.0 2.4 0.8120 2.8 1.7 2.5 0.7 2.7 1.6130 2.7 2.1 5.0 1.2 2.7 1.1140 1.7 2.1 6.0 1.2 3.1 1.1150 1.4 2.5 7.0 1.1 2.4 0.3AutumnDate 14/04/1975 12/01/1976 14/03/1978 10/04/1979 10/03/1980 7/07/1987 5/04/1988 4/04/1989 10/04/1990Depth (m)0 0.8 0.5 0.0 0.3 0.0 2.0 1.1 2.1 0.110 0.4 1 0.0 0.0 0.3 1.6 1.3 2.5 0.620 0.2 0.2 0.0 0.0 0.0 1.0 1.3 2.4 1.330 0.1 0 0.0 0.0 0.0 0.2 1.1 2.5 1.240 0.3 0.2 0.0 0.3 0.2 0.9 2.2 2.4 1.750 0.5 0.3 0.0 1.0 0.8 1.1 4.0 4.9 4.960 4.2 1.3 0.0 7.3 4.9 14.5 12.3 5.2 3.470 5.6 1.5 2.2 11.1 6.2 16.4 14.6 5.1 12.080 9.2 8.3 4.9 12.7 9.4 16.1 16.9 10.9 11.290 11.2 11.1 5.8 13.5 13.5 18.5 19.0 13.5 12.4100 12.4 14 7.4 15.0 14.4 19.8 20.7 17.1 17.1110 16.0 9.2 14.8 15.7 20.2 19.1 20.4 16.2120 10.1 15.0 16.7 20.9 18.6 23.3 18.2130 8.0 16.6 18.9 21.9 21.5 24.2 17.9140 11.0 17.3 19.4 22.1 25.4 27.1 22.4150 14.2 19.7 19.9 21.5 27.0 28.6 24.2DRP concentrations (mg m -3 )SpringDate 18/11/1974 16/10/1975 4/10/1977 10/10/1978 5/10/1987 17/10/1988 6/10/1989Depth (m) ???0 8.7 1.1 0.3 0.6 0.2 0.2 0.010 8.0 1.2 0.0 0.6 0.1 0.1 0.220 8.3 1.1 0.1 0.5 0.2 0.0 0.130 7.5 0.9 0.0 0.3 0.3 0.1 0.040 8.4 0.8 0.3 0.2 0.2 0.1 0.050 7.6 0.8 0.2 0.3 0.4 0.1 0.060 8.3 0.7 0.0 0.3 0.3 0.2 0.070 7.7 0.7 1.1 0.4 0.3 0.2 0.080 8.1 0.8 0.7 0.5 0.3 0.2 0.390 7.9 1.0 0.8 0.4 0.2 0.3 0.1100 8.5 1.7 0.4 0.4 0.2 0.3 0.1110 9.8 1.6 0.4 0.4 0.4 0.5 0.1120 0.5 0.4 0.4 0.4 0.0130 0.4 0.3 0.4 0.4 0.2140 0.6 0.3 0.4 0.5 0.3150 0.5 0.4 0.3 0.5 0.2AutumnDate 14/04/1975 12/01/1976 14/03/1978 10/04/1979 10/03/1980 7/07/1987 5/04/1988 4/04/1989 10/04/1990Depth (m)0 0.8 1.4 0.2 0.1 0.7 1.9 0.1 0.0 0.210 0.5 1.4 0.2 0.1 0.4 2.2 0.1 0.0 0.020 0.5 7.0 0.2 0.1 0.3 0.9 0.2 0.0 0.130 0.5 2.5 0.2 0.1 0.2 1.0 0.2 0.0 0.240 0.5 0.2 0.2 0.4 0.5 0.9 0.6 0.2 0.550 0.5 0.9 0.7 1.0 0.7 0.7 1.1 0.5 1.160 1.0 0.1 0.7 1.6 1.0 3.4 2.0 0.6 0.970 1.0 0.8 1.0 2.0 1.1 3.7 2.2 0.9 1.980 1.7 1.2 1.5 2.2 1.6 3.6 2.7 1.1 1.790 2.0 2.0 1.8 2.4 2.2 4.1 2.9 1.3 1.8100 2.2 3.3 1.9 2.7 2.4 4.6 3.1 1.9 2.6110 2.9 2.4 2.8 2.6 4.5 2.9 2.7 2.1120 2.7 2.9 2.7 4.7 3.0 3.4 2.5130 2.1 3.0 3.7 5.1 3.4 3.8 2.4140 2.8 3.6 3.6 5.3 4.4 4.5 3.5150 0.9 3.8 3.8 5.0 4.6 4.8 4.0Elapsed period (days)147 88 161 182 165 270* 183 169 186??? = possible analytical problem (e.g., Si interference)* = average period of 165 days plus 3 months126 <strong>Lake</strong> <strong>Taupo</strong> Long-<strong>term</strong> Monitoring Programme 2010 - 2011
<strong>Lake</strong> <strong>Taupo</strong> Long-<strong>term</strong> Monitoring Programme 2010 - 2011 127