Investor Presentation - KPIT
Investor Presentation - KPIT
Investor Presentation - KPIT
- No tags were found...

You also want an ePaper? Increase the reach of your titles
YUMPU automatically turns print PDFs into web optimized ePapers that Google loves.
<strong>KPIT</strong> CUMMINSMay, 2012© 2005 <strong>KPIT</strong> Cummins Infosystems LimitedOne Team – One Goal – Zero SurprisesSlide 1Version 1.0Presenter: Sunil P
Safe Harbor StatementSome of the statements in this update that are not historical facts are forwardlookingstatements. These forward-looking statements include our financial andgrowth projections as well as statements concerning our plans, strategies, intentionsand beliefs concerning our business and the markets in which we operate. Thesestatements are based on information currently available to us, and we assume noobligation to update these statements as circumstances change. There are risks anduncertainties that could cause actual events to differ materially from these forwardlookingstatements. These risks include, but are not limited to, the level of marketdemand for our services, the highly- competitive market for the types of servicesthat we offer, market conditions that could cause our customers to reduce theirspending for our services, our ability to create, acquire and build new businesses andto grow our existing businesses, our ability to attract and retain qualified personnel,currency fluctuations and market conditions in India and elsewhere around the world,and other risks not specifically mentioned herein but those that are common toindustry.5/7/2012 2
ContentsWhat we AreAreas of FocusSBU PositioningThe Way AheadInnovation at <strong>KPIT</strong>Back-up Slides5/7/2012 3
What we are5/7/2012 4
<strong>KPIT</strong> CumminsTechnologyCompany38 Global Patents filed in the last 18monthsIndustry VerticalFocusedAutomotive & TransportationDiscrete ManufacturingEnergy & UtilitiesHigh GrowthCAGR of 50% from 2003 to 200941% Growth in 201143% Growth in 20121,4001,2001,000800600400200-PAT Growth120 +3503002502001501005001098765432108.6 10.52 15.91 27.72 56.57 72.93 102.520.02 0.15 0.220.592 Decades of Growth1.192.06174.1145.24 153.762.943.725.75216.197.453092001 2002 2003 2004 2005 2006 2007 2008 2009 2010 2011 20121991 1992 1993 1994 1995 1996 1997 1998 1999 2000 20018.65/7/2012 5
About usBACKGROUNDLineage from Kirtane & Pandit, Chartered Accountants(KPCA) a well respected accountancy firm in businessfor 50+ yrs.Incorporated in 1990, IPO in 1999, issueoversubscribed 42 timesCMMi Level 5, Auto Spice Level 5, ISO/IEC270001:2005, ISO 9001, BS25999:2007 certifiedOracle Platinum Partner, SAP Gold Partner, MicrosoftGold Partner, IBM Business Partner, AUTOSAR & JASPARPremium MemberMISSION & STRATEGYOur Mission is to be a Global Partner of FirstChoice for our customers with leadership inselect areasFocus on three verticals :StrategyOfFocus1) Automotive & Transportation2) Discrete Manufacturing3) Energy & UtilitiesTHE CONSTANT IN ANY VOLATILE ENVIRONMENTTHE COMPANY WE KEEPFounders – 26.44%FIIs – 21.90%DIIs – 18.40%Cummins 11.38% 10+ yrs.Chrys Capital 9.55% 1+ yrs.ICICI Prudential Life Insurance 6.66% 8+ yrs.SBI Mutual Fund 2.29% 8+ yrs.DSP Blackrock Mutual Fund 4.28% 2+ yrs.Fidelity 0.53% 5+ yrs.Birla Sun Life Insurance 1.89% 1+ yrs.Ruane Cunniff & Goldfrab 5.62% 1+ yrs.Reliance Mutual Fund 0.88% 3+ yrs.Cargill 1.65% 6+ yrs.Alta Vista Capital 1.10% Recent5/7/20126
Recognized Credentials………….<strong>KPIT</strong> CIO, Shrikant Kulkarni, selected amongst the top 50 most respected CIO’s in India.<strong>KPIT</strong> CFO, Anil Patwardhan, selected for ICAI’s award for Best CFO in Information Technology Sector 2010.Among the top 25 companies to demonstrate excellence in Corporate Governance (fourth year in a row) - Institute ofCompany Secretaries of India5/7/20127
The Journey (Improved Metrics)6050403020100$ 1+ MN CUSTOMERS403223202008 2009 2010 2011 2012599.008.007.006.005.004.003.002.001.000.00EARNING PER SHARE8.195.49 5.584.223.34FY08 FY09 FY10 FY11 FY12Stock Return CAGR since IPO(1999) – 31%35%30%25%20%18%FP REVENUES30%31%28%Stock Return CAGR last 10 years(2002) – 43%15%10%5%0%12%FY 08 FY 09 FY 10 FY 11 FY 125/7/2012Previous years EPS has been adjusted as per Bonus issue8
<strong>KPIT</strong> Cummins - StructureAutomotive &TransportationDiscreteManufacturingEnergy &UtilitiesAutomotive &EngineeringSBU(A&E)30%IntegratedEnterpriseSolutions SBU(IES)39%MaturedSAPSBU(SAP)31%Nascent37% 35% 12%5/7/2012 9
Our Focus Verticals – MajorOpportunities5/7/2012 10
The Automotive Industry – Huge Growth PotentialGrowth in ElectronicsAggressive Model Launches2000 20152011 2012 2013SoftwareHardwareInnovation300% Growth200870% Growth200890% ofinnovationsin cars inElectronics1 MnLoC20ECUs2% S/wCost12% ElecCost100 MnLoC50 – 100ECUs13% S/wCost30% ElecCost1 4 24 8 85 4 43 3 42 3 5Electrification of Vehicles By 2025, New Vehicles will have≈ 40% Hybrids and 10% EVs2020 EU Emission Targets require6% annual reduction in emissionsConnected Cars Communication from and to avehicle will be more prevalent Mobility Solutions, Traffic Mgmt,Warranty, regulations & complianceMega Cities Avg Commute of 3 hrs daily with avgspeed of 6 mph Bulk buying, Car sharing and rentals,multi modal and long commuteAging Population By 2025,median age in developedworld 43 yrs and 31 yrs in developing Strong Need for vision based solutions –night vision, blind spot, anti glare etc5/7/2012 11
Automotive Industry – Areas of Growth16.014.00.70.61.0CAGR2016Share2010ShareChassis 7.9% 4% 4%Full Vehicle 5.3% 7% 8%12.010.08.06.04.00.40.81.12.52.10.50.91.22.92.60.50.91.33.02.90.50.91.33.03.10.70.91.33.03.31.01.33.33.81.43.34.1Interior 4.3% 9% 12%Body/ExteriorElectronics/Electrical4.8% 22% 27%11.9% 27% 22%2.02.53.03.4 3.6 3.84.34.7Powertrain 10.9% 31% 27%-2010 2011 2012 2013 2014 2015 2016Source: Company information; Thomson Financials; Market interviews; Roland Berger AnalysisPowertrain & Infotainment(Electronics/Electrical) arethe largest practices for <strong>KPIT</strong>in the A&E SBU5/7/2012 13
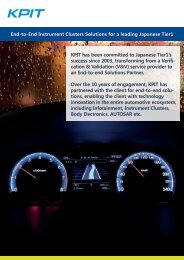
What we do in Automotive Industry - EngineeringPOWERTRAIN• Engine platform based onsoftware product line architecture• Fault memory management foron-board diagnostics II• Analytical diesel engine modeling• Battery management systemINTERIOR4• Power seat module• Interior lighting• Heating/ventilation/airconditioningSAFETY, CHASSISINFOTAINMENTBODY1 2 3• ABS for a hybrid vehicle• 4-wheel drive steering, electronicpower-assisted steering• Brakes• Car radio HMI application• 3-D HMI console• Infotainment platform• Bluetooth & iPod integration• Instrument cluster softwaredevelopment• Power window module• Door lock• Central locking• Anti-theft alarm• Exterior lighting• Mirror managementNETWORKING5 6• AUTOSAR conformance test specs• AUTOSAR basic software testedfor cruise control ECU• Microcontroller abstraction layerfor two micro control units• >60 eNOS based ECUsTELE/DIAGNOSTICS 7 MECHANICAL ENGG 8 SEMICONDUCTOR 9• On board diagnostics• OBX• Remote diagnostics• Engine housing, crankshaft andpiston design• Thermal, structural and NVH analysisof engine components• Seating System Design development• Door Trim Design & Verification• Instrument Panel Crash Analysis• HVAC analysis• System software5/7/2012 14
ERPWhat we do in Automotive Industry – Business IT• SAP, Oracle and J DEdwards• TransformationalImplementations andSupport MaintenanceContracts• Templatized SAP Solutionsfor the Auto ComponentsIndustry• SAP and Oracle CertifiedIndustry Specific SolutionsTRACKINGeBIZ1 2 3• Oracle TransportationManagement• OnTrack – Vehicle Trackingand Asset Management• Mobility Solutions• Enterprise Web ApplicationDevelopment• Enterprise ApplicationIntegration• Enterprise ContentManagement• Business IntelligenceCONSULTING4• MES• PLM• SCMAFTER MARKET4• Warranty Management• Lease Management• Dealer Networking5/7/2012 15
Strongest Automotive Focus and CompetenceHighPractice FocusDOMAIN-SPECIFICCOMPETENCESLowHorizontal SoftwarecapabilitiesLow< 10 customersAUTOMOTIVE INDUSTRY FOCUSHigh> 50 customersIndependent Assessment done by Roland BergerAll the logos are service/ trade mark of respective companies5/7/2012 16
<strong>KPIT</strong> Positioning in Customer’s MindCOMPLETE VEHICLE PRODUCTION CAPABILITIESCOMPONENT PRODUCTION CAPABILITIESEngineeringMECHANICALENGINEERING SERVICESELECTRONICSEngineeringIndependent Assessment done by Roland BergerAll the logos are service/ trade mark of respective companies5/7/2012 17
The Energy & Utilities Industry – Huge Growth PotentialEnvironmental Concerns Rising Concerns onenvironmental issues andclimate change More investments in newinfrastructure and sustainableEnergy SourcesIT Services Market for Customer InformationSystems (CIS) and Billing Solutions onthe verge of transformation presentingan additional opportunity of $ 4.5 Bn S/w & services market for smart griddata analytics will increase from USD356 Mn in 2010 to USD 4.2 Bn by 2015(rev/yr). It will represent one of thelargest growth opportunities in Utilities.Heavy Spending and Growth 5 yr CAGR of 4.8% in utilities vs.3.6% for other industries US Utilities expected to spend $8.25 Bn between 2011-15 in 3 areas– grid operations, customermanagement and business services Europe Utilities IT spend of $ 9.1Bn in 2011, growing at 6.2%Engineering Opportunities Smart meters will representmajority of all installed electricalmeters by 2018 and the penetrationrate would be 59% by 2020 Increased embedded softwareopportunities with the number ofintelligent ECUs increasing5/7/2012 18
160140120100806040200Utilities IT SpendingIT Spending Worldwide US $ Bn152.55157.95134.78140.79127.38120.742009 2010 2011 2012 2013 2014Total IT Spending - 2012WesternEurope30%NorthAmerica40%Asia/Pacific12%Total IT Spending Growth(CAGR 2010 - 2015)EasternEurope3% Japan3%LatinAmerica8%MiddleEast &Africa4% North America is the highest spender on IT inUtilities – this is where we have the strongestpresence Latin America and Asia Pacific are twogeographies where the growth is expected to befaster – we will invest in these markets in theutilities vertical12.0%10.0%8.0%6.0%4.0%2.0%0.0%9.6%4.4%1.8%5.4%6.8%3.7%2.9%Source: Gartner - Forecast: Enterprise IT Spending in Utilities , Worldwide, 2009-2015, 3Q11 Update5/7/201219
What we do in the Utilities VerticalThe NewEra of PowerProductionTheSmart GridDisruptionTheNew RetailParadigmThe InformationTechnologyConvergence3rd Dimension ofCustomerInteractionThe SustainabilityChallengeEnterprise AssetManagementAMI Integration forUtilitiesCIS & CRMMobilityCustomer OnlineServicesWater UtilitiesSolutionEnterpriseResourcePlanningMeter DataManagementCustomerFinancialManagementOn-DemandAnalyticsCustomerMobility SolutionGovernance, Riskand ComplianceFuel SupplyChainManagementSCADAComplex BillingProductizedSolutionsSocial MediaSolutions forWaste andRecyclingProcess Control/MonitoringDemand ResponseLoad Forecasting/ProfilingIn MemoryComputingBuilder/HomeEnergy Mngt. Sys.Solution forSustainabilityCurrent andupcomingOfferingsNo capabilities(may be planned)5/7/201220
SBU Snapshot5/7/2012 21
A&E SBU – Our PositioningIndustryFocusConsortiumsStrongProcessOrientationCutting EdgeTechnologySystemCapabilities Auto OEMs Tier I Vendors Semicon Companies focused on Automotive Premium Member AUTOSAR & JASPAR GENIVI ASAM AUTOSPICE Level 5 CCMi Level 5 AUTOSAR Infotainment Vision Systems Hybrid Powertrain Chassis 16+ OEMs(8 of Top10) 50 Tier I Vendors 2500+ Engineers 1500+ Projects 300+ Production Program 34 PatentsLargest 3 rd Party Vendor for5/7/2012 Automotive Electronics in India….. 22
IES SBU - Building Integrated BUSINESS Solutions Global Platinum Partner to Oracle 3 rd Largest Partner to Oracle in North America in Industrial Manufacturing 8 th Overall Largest Partner to Oracle in North AmericaMIDDBusiness IntelligenceSCMCore ERPLETransportation & LogisticsERWACRMPLM & MESUser InterfaceThus Working withthe Customers’Products, Suppliers &Customers5/7/201223
SAP SBU – Our PositioningRanked #4 in internal SAP CRM system after IBM, Deloitte,and Accenture for value created for SAP ecosystemChosen as the first Strategic Value Added Reseller for SAP'sSME business in North AmericaReceived 2012 SAP North American Partner Impact AwardSAP Market growth Relentless focus on SAP, with stronger relationships with keySAP Management$43 B Stimulus forUtilities Large Investment in Utilities - Industry Specific Solutions IP Development EffortBI Market Expansion BI is the largest practice in the SAP SBUStrong Growth in AMS Templatized Solutions for AMS with focus on portfoliorationalization5/7/201224
The Way Ahead5/7/2012 25
Stated Goal$ 500 Mn Company by 2013Goal stated in FY10 – Revenues $ 153 Mn41% Growth in FY11 – Revenues $ 216 Mn43%+ Growth in FY12 – Revenues $ 309 MnGuided for a 34% growth in FY13Endeavor to achieve a Run Rate of $ 500 Mn by 4QFY135/7/201226
VisionUSD 1 Bn by 2017BEST IN CLASSPRACTICESAutoEmbeddedSAPOracleNICHEVERTICALFOCUSAutomotiveTransportationManufacturingEnergy &UtilitiesKEYGEOGRAPHYPRESENCEEmergingMarkets alongwith US &EuropeNON LINEARGROWTHR&DInvestmentsMore IP LedRevenuesINORGANICGROWTHTechnologyLeadershipDomainExpertisePartnership5/7/201227
Innovation at <strong>KPIT</strong>5/7/2012 28
R&D (CREST) @ <strong>KPIT</strong>38 patents filed till dateResearch onCustomer’schallenges,DevelopadvancedsolutionsExplore NewTechnologiesandDefineTechnologyRoadmapCRESTDesign & developnew productsCreate IP/PatentsPublish ResearchpapersCapabilitybuildingInService OfferingsFocus on monetization…….5/7/2012 29
REVOLO - An Innovative Solution• Over 40% savings in energy expense in city driving• Over 35% CO 2 emission reduction• Can be retrofitted on a large range of vehicles• Gasoline as well as Diesel vehicles• Vehicles with up to 3 liter engines• From brand new vehicles with advanced electronics to extremely old vehicles withcompletely mechanical power-trains• Retro fitment time of only 4 to 6 hours• Plug-in hybrid – hence benefits of the grid available, both of lowered cost andreduced emissions• Battery chemistry agnostic solution – Revolo works with Lead Acidbatteries as well as Lithium Ion batteries5/7/2012 30
Details on REVOLO• 14 global patents filed till date• No interaction / interference with existing Engine Management System (EMS)• The load sharing between the motor and engine is seamless also no userintervention required• Opportunity based regeneration and regenerative braking present in Revolo• Inbuilt Stop-Start feature• Starter-motor, alternator and original battery can be avoided when factoryfitted• Key technologies• Proprietary motor design• Proprietary software logic and control algorithms• Off the shelf motor controller• Proprietary intelligent battery management system5/7/2012 31
THANK YOU !!120 +W i t h 6 5 0 0 + e n g i n e e r s a n d g r o w i n g … … … g r o w i n g p r e t t y f a s tTHANK YOU !!5/7/2012 32
BACK UP SLIDES120 +W i t h 6 5 0 0 + e n g i n e e r s a n d g r o w i n g … … … g r o w i n g p r e t t y f a s tBACK UP SLIDES5/7/2012 33
<strong>KPIT</strong> Cummins – The Journey (M&A Progress)NameYear ofM&ASize at time ofM&A ($ Mn)FY12($ Mn)Cummins Infotech 2002 $ 1.0 Mn $ 66 MnPanex Consulting 2003 $ 7.2 Mn $ 25 MnSolvCentral.com 2005 $ 3.5 Mn $ 20 MnPivolis 2005 $ 1.5 Mn $ 5 MnCG Smith Software 2006 $ 6.25 Mn $ 45 MnRationaleAnchor Customer – CumminsVertical Focus - ManufacturingSAP PracticeAnchor CustomerBI PracticeAnchor CustomerDirect Presence in FranceGeographyAuto Electronics DomainAuto OEM & Tier I CustomersHarita TVS 2008 $ 1.0 Mn $ 8 Mn MEDS PracticeSparta Consulting 2009 $ 25 Mn $ 72 MnIn2Soft 2010 $ 4 Mn $ 6 MnSAP PracticeUS Geography presence in SAPVehicle Diagnostic & Telematics,German FrontlineCPG 2010 $11 Mn $ 15 Mn Oracle ConsultingSYSTIME 2011 $ 50 Mn $ 53 MnOracle Consulting, JDESpecialist5/7/2012 34
Q4FY12 Highlights‣ USD Revenue grew by 29.9% Q-o-Q and 45.61% Y-o-Y to USD 95.38 Million.‣ In organic terms, USD revenue growth of 11.95% Q-o-Q.‣ INR Revenue stood at INR 4,800 Million, a Q-o-Q growth of 26. 7% and Y-o-Ygrowth of 61.5%.‣ Q4 FY2012 PAT grew by 66.02% Y-o-Y to INR 437.15 Million.‣ Signed a large enterprise consulting deal worth more than USD 20 Million.5/7/2012 35
Financials – Q4 FY2012Income Statement (INR Mn) Q4 FY12 Q3 FY12Growth(Q-o-Q)Q4 FY11Growth(Y-o-Y)Revenue 4,800.09 3,788.54 26.70% 2,972.02 61.51%Gross Profit 1,614.56 1,295.84 24.60% 1,090.41 48.07%SG&A 854.25 715.98 19.31% 657.32 29.96%EBITDA 760.31 579.86 31.12% 433.09 75.55%Interest 39.00 15.92 144.98% 10.44 273.46%Depreciation 101.70 133.25 (23.67%) 162.10 (37.26%)Other Income (112.92) 108.39 (204.18%) 45.33 (349.07%)PAT 437.15 410.70 6.44% 263.31 66.02%Margins Q4 FY12 Q3 FY12Growth(Q-o-Q)Q4FY11Growth(Y-o-Y)Gross Margin 33.64% 34.20% (0.57%) 36.69% (3.05%)SG&A/ Revenue 17.80% 18.90% (1.10%) 22.12% (4.32%)EBITDA Margin 15.84% 15.31% 0.53% 14.57% 1.27%PAT Margin 9.11% 10.84% (1.73%) 8.86% 0.25%5/7/2012 36
Performance Metrics as on Q4 FY2012Customer Details Q4 FY12 Q3 FY12Q-o-QGrowthQ4 FY11Y-o-YGrowthNo of Customers Added 4 2 - 3 -No of Active Customers 169 165 - 155 -Customer with run rate of>1Mn 59 54 - 40 -Top Client- Cummins 19.49% 23.92% 3.24% 21.06% 49.45%Top 5 Clients 33.01% 37.39% 11.88% 40.65% 31.16%Top 10 Clients 42.22% 46.98% 13.87% 50.77% 34.31%Onsite/ Offshore SplitOnsite Revenues 51.54% 47.79% 36.64% 42.96% 93.75%Offshore Revenues 48.46% 52.21% 17.60% 57.04% 37.22%Revenues By Contract TypeTime & Material Basis 73.55% 74.20% 25.59% 68.03% 74.61%Fixed Price/ Time Basis 26.45% 25.80% 29.88% 31.97% 33.62%Total Headcount(at Qtr end) 7,719 6,707 - 6,514 -5/7/201237
FY12 Highlights‣ Outperforms top end of upward revised revenue guidance.‣ USD revenue for FY2012 increased 43.06% Y-o-Y to reach USD 309.29 Million.‣ Organically USD Revenue grew by 36.97% Y-o-Y.‣ In INR terms, revenue for the year stood at INR 15,000.12 Million, a Y-o-Ygrowth of 51.97%.‣ PAT for the year exceeded guidance with 53.68% Y-o-Y growth to INR 1,453.54Million.5/7/2012 38
FY12 PerformanceIncome Statement (Rs. Mn) FY2012 FY2011 GrowthRevenue 15,000.12 9,870.48 51.97%Gross Profit 5,065.69 3,622.34 39.85%SG&A 2,884.76 2,100.26 37.35%EBITDA 2,180.93 1,522.08 43.29%Interest 78.12 44.70 74.78%Depreciation 444.86 411.25 8.17%Other Income 127.95 36.45 251.05%PAT 1,453.54 945.82 53.68%Margins FY2012 FY2011 GrowthGross Margin 33.77% 36.70% (2.93%)SG&A / Revenue 19.23% 21.28% (2.05%)EBITDA Margin 14.54% 15.42% (0.88%)PAT Margin 9.69% 9.58% 0.11%5/7/2012 39
Performance Metrics as on FY12Customer Details FY2012 FY2011 Y-o-Y GrowthNo of Customers Added 14 14 -No of Active Customers 169 155 -Customer with run rate of>1Mn 59 40 -Top Client- Cummins 21.51% 23.53% 38.87%Top 5 Clients 35.02% 42.07% 26.50%Top 10 Clients 43.61% 51.70% 28.18%Onsite/ Offshore SplitOnsite Revenues 48.64% 40.64% 81.90%Offshore Revenues 51.36% 59.36% 31.48%Revenues By Contract TypeTime & Material Basis 72.13% 68.69% 59.57%Fixed Price/ Time Basis 27.87% 31.31% 35.30%Total Headcount(at Qtr end) 7,719 6,514 -5/7/2012 40
P&L Snapshot (Equivalent USD Financials)Income Statement (USD Mn) FY2012 Q4 FY2012Revenue 309.29 95.38Gross Profit 104.45 32.08EBITDA 44.97 15.11PAT 29.97 8.69MarginsGross Margin 33.77% 33.64%EBITDA Margin 14.54% 15.84%PAT Margin 9.69% 9.11%5/7/2012 41
Balance Sheet Snapshot (Equivalent USD Financials)Income Statement (USD Mn) FY2012 FY2011Shareholder’s Funds 149.90 132.11Minority Interest 6.72 0.19Non Current Liabilities 24.68 7.23Current Liabilities 94.22 59.50Total Equity & Liabilities 275.53 199.03Non Current Assets 131.53 80.23Current Assets 143.99 118.80Total Assets 275.53 199.03‣ The cash balance as at March 2012 stood at USD 37.89 Million.‣ As on March 2012, our total debt was USD 47.18 Million.5/7/2012 42
THANK YOU !!120 +W i t h 6 5 0 0 + e n g i n e e r s a n d g r o w i n g … … … g r o w i n g p r e t t y f a s tTHANK YOU !!5/7/2012 43