Lahore Electric Supply Company Limited
Lahore Electric Supply Company Limited
Lahore Electric Supply Company Limited
- No tags were found...

Create successful ePaper yourself
Turn your PDF publications into a flip-book with our unique Google optimized e-Paper software.
<strong>Lahore</strong> <strong>Electric</strong> <strong>Supply</strong> <strong>Company</strong> <strong>Limited</strong>Business Plan FY 2010-1111Workshop on Power Sector Reforms5 th October | 2010
Scheme of PresentationVisionMissionCore ValuesOperational & Business OverviewTechnical OverviewStakeholdersSWOT AnalysisObjectivesForecasting AssumptionsFinancials<strong>Lahore</strong> <strong>Electric</strong> <strong>Supply</strong> <strong>Company</strong> <strong>Limited</strong>
VisionTo Transform and Develop the <strong>Company</strong>into Sustainable <strong>Electric</strong> Utility<strong>Lahore</strong> <strong>Electric</strong> <strong>Supply</strong> <strong>Company</strong> <strong>Limited</strong>
MissionTo provide reliable electricity in the regulatoryregime, transform the company into a viableelectric utility by employing emergingtechnologies and motivating human resources tosupport economic activities in the service territory<strong>Lahore</strong> <strong>Electric</strong> <strong>Supply</strong> <strong>Company</strong> <strong>Limited</strong>
LESCO Core ValuesTeam WorkSimplicityitFlexibilityTransparency<strong>Lahore</strong> <strong>Electric</strong> <strong>Supply</strong> <strong>Company</strong> <strong>Limited</strong>
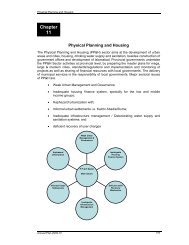
Service TerritoryFESCONankanaGEPCO041M0.41 MEPCO0.38 M
Category wise ComparisonEnding JUN‐2010ConsumersRevenue<strong>Lahore</strong> <strong>Electric</strong> <strong>Supply</strong> <strong>Company</strong> <strong>Limited</strong>
Category wise ComparisonEnding JUN‐2010ConsumptionRevenue<strong>Lahore</strong> <strong>Electric</strong> <strong>Supply</strong> <strong>Company</strong> <strong>Limited</strong>
Operational OverviewDescriptionDistricts (<strong>Lahore</strong>, Sheikhupura, Okara, Kasur, Nankana) 05 Nos.Area (<strong>Lahore</strong>, Sheikhupura, Okara, Kasur, Nankana) 19,064 KM 2Circles 7(OP), 1(GSO), 1(Const), 2(M&T), 1(GSC) 12 Nos.Operation Divisions (32 Operation + 1 Industrial) 33 Nos.Operation Subdivisions (168 + 1) 169 Nos.Construction Divisions 06 Nos.Construction Subdivisions 20 Nos.M&T Divisions 07 Nos.Employees (538 Officer + 19639 Others) 20,177 Nos.No. of Consumers 3.2 Mln<strong>Lahore</strong> <strong>Electric</strong> <strong>Supply</strong> <strong>Company</strong> <strong>Limited</strong>
Technical OverviewDescriptionGrid Stations 89 Nos.Grids feeding <strong>Lahore</strong> City 41 Nos.NTDC Grid Stations Feeding LESCO 6 Nos.Grid feeding Individual Consumers 15 Nos.IPPs feeding LESCO 8 Nos.SPPs feeding LESCO 16 Nos.Small Hydel Power Stations Feeding LESCO 2 Nos.No. of 11kV Feeders 1,249 Nos.Length of HT Line 24,910 KMLength of LT Line 14,425 KMDistribution Transformers81,289 Nos5764 MVA.Peak Demand LESCO (2009-2010) Summer 3916 MW<strong>Lahore</strong> <strong>Electric</strong> <strong>Supply</strong> <strong>Company</strong> <strong>Limited</strong>
StakeholdersCustomersEmployeesSuppliersContractorsRegulatorGovernmentLendersCommunity
SWOTStrengthsExclusive service territoryExperienced Human ResourcesSupportive Board of DirectorsERP implementation (PartlyCompleted)WeaknessesAdministrative lossesLack of Automation of Business Processes.Unsatisfied EmployeesNon-aligned Rules & Regulations withRegulatory RegimeOpportunityIncrease in Sales GrowthIntroduction of New TechnologiesAutonomyThreatsPower ShortageLack of involvement in Power PlanningPolitical Interference in the Business MattersPoor Governance System in Power SectorEntitiesConsumers’ AffordabilityNon‐payment culture of government agenciesDelayed determination / notification of tariffs<strong>Lahore</strong> <strong>Electric</strong> <strong>Supply</strong> <strong>Company</strong> <strong>Limited</strong>
Profile of Board Members# NAME OF OFFICER DESIGNATION QUALIFI CATION TOTAL EXP:YEAR WITHLESCO1 Syed Yawar Ali ChairmanBE B.E. (Chem.), Master (Mgmt.Sc.), Advanced ManagementProgram (Harvard)36-Y 06-Y2 Mr. Shahzad Alam Director MBA, USA 28 -Y 06-Y3 Mr. Khalid Saeed DirectorBSC (Engineering) UK. FIET,P.Eng (Canada)35-Y 11-Y4 Mr. Munawar Ahmad Malik Director B.Sc (<strong>Electric</strong>al Engg.) 36-Y 1.8-Y5Mr. Muhammad IshaqBhattiDirector MSC (Engineering) 35-YRecentlyJoined6 Mr.Saleem Akhtar CEO B.Sc (<strong>Electric</strong>al Engg.) 34-Y 15-Y7 Raiz Ahmad Khan Director Nominee of MOW&P<strong>Lahore</strong> <strong>Electric</strong> <strong>Supply</strong> <strong>Company</strong> <strong>Limited</strong>
Profile fl of Senior Management# NAME OF OFFICER DESIGNATION QUALIFI CATION TOTAL EXP:1 Saleem AkhtarRana Muhammad Ajmal2 Khan3 S. Javed HashmiCEOTechnical DirectorOperation Director4 Farasat ZamanCS Director5 Abid Latif Lodhi6 Saghir Ahmed7 S. Mubashar MasoodFinance DirectorHR&AdmnDirectorLegal DirectorB.Sc (<strong>Electric</strong>alEngg.)B.Sc (<strong>Electric</strong>alEngg.)B.Sc (<strong>Electric</strong>alEngg.)B.Sc (<strong>Electric</strong>alEngg.)YEAR WITHLESCO34-Y 15-Y34-Y 24-Y36-Y 6-M33-Y 01-YFCMA 21-Y 02-YMPA & Diplomain HRM24-Y 25Y2.5 B.A, LLB 15-Y 05-Y8 Imtiaz Ahmed ButtManager (MIS)M.Sc 28-Y 16-Y<strong>Lahore</strong> <strong>Electric</strong> <strong>Supply</strong> <strong>Company</strong> <strong>Limited</strong>
ObjectivesTo Be Profitable Within Regulated TariffReduction In T & D LossesReduced TrippingCost Reduction By Improving ProductivityImprovement In RecoveryExcellence In Customer ServicesKnowledge Workers Through Continuous Trainings<strong>Lahore</strong> <strong>Electric</strong> <strong>Supply</strong> <strong>Company</strong> <strong>Limited</strong>
Key InitiativesCascading of Performance Contract down to Individual EmployeeDevelopment of Strategic t Business PlansCapacity Building Plan for Operation Circles / Divisions as SBUDistribution Management System based on SCADA and GISImplementation of ERP ProjectImplementation of AMR Pilot ProjectEstablishment of Call Center (118)Initiative for Demand Side Management<strong>Lahore</strong> <strong>Electric</strong> <strong>Supply</strong> <strong>Company</strong> <strong>Limited</strong>
Forecasting AssumptionsDescription FY 08* FY 09* FY 10* FY 11 FY 12 FY13Sales Growth -1.30% -4.34% 5.42% 13.06% 7.00% 7.40%T & D Losses 0.15% 0.43% 0.50% -0.7% -0.50% -0.52%Maximum Demand 1.9% -2.4% 15.5% 5.9% 7.0% 7.4%Collection 98.45% 95.90% 93.22% 99.00% 99.00% 99.00%A/R Turnover (in days) 43 39 55 40 37 34Tariff Subsidy Collection 134% 46% 39% 100% - -<strong>Lahore</strong> <strong>Electric</strong> <strong>Supply</strong> <strong>Company</strong> <strong>Limited</strong>
Investment PlanFY 2010‐11Mln. RsDescription FY 08 FY 09 FY 10 FY11 FY 12 FY 13STG 4,621 2,884 3,661 4,918 6,639 4,208DOP 400 500 400 500 550 600ELR 500 500 500 500 700 700SCADA - - - - 1500 1399Others 318 602 561 561 586 520STG - Secondary Transmission and GridDOP - Development of PowerELR - Energy Loss Reduction<strong>Lahore</strong> <strong>Electric</strong> <strong>Supply</strong> <strong>Company</strong> <strong>Limited</strong>
GOPEnergy Pol licyergy PlanGas Pricin ngEnOil &GST, ED,Ptv Fee, NJSOGRAPlanIntegrat ted PowerGOP Guidelines1.33NEPRAPower Market StagesAs per NTDC LicenseGeneration LicenseesAfter 2009 / COMDGeneration Licensees2004 – 09 /Single Buyer PlusGeneration LicenseesBefore 2004 / Single BuyerMarket / Consumers/Service TerritoryConsumer Eligibility CriteriaRegulato ory ContractsPPAsPPAsDistr ribution Lice ensees7.44GOP Notified TariffSubsidies1.83(9.27) Regulated Tariff(1.0 + 8.17) DM + PPPInvestment ProgramConsumer Service ManualPerformance StandardPower Acquisition ProgramGOPAppointmentBODsCEO & EM MTPPAsEnergy <strong>Supply</strong> AgreementsTransmission Licensee / NGC(TNO,SO,MO& O& CRPEA) - CPPAPPAs<strong>Lahore</strong> <strong>Electric</strong> <strong>Supply</strong> <strong>Company</strong> <strong>Limited</strong>
Key Performance IndicatorsDescription FY 08 FY 09 FY 10 FY11* FY12* FY13*No. of Consumer (Mln.) 2.9 3.0 3.18 3.31 3.47 3.64Avg. Peak Demand, MW 3,440 3,158 4,069 4,307 4,608 4,949Units Purchased, GWh 15,795 15,184 16,100 18,044 19,196 20,495Units Sold , GWh 13,766 13,168 13,881 15,694 16,792 18,035Losses, % 12.85% 13.28% 13.78% 13.02% 12.52% 12.00%NEPRA Target 12.50% 12.30% 12.00% N/A N/A N/AVariance from NEPRA -0.35% -0.98% -1.78% N/A N/A N/ACollection Ratio % 98.45% 95.92% 93.22% 99.00% 99.00% 99.00%AT&C Losses 86% 83% 80% 86% 87% 87%NEPRA Target 88% 88% 88% N/A N/A N/AVar. from NEPRA 2% 5% 8% N/A N/A N/ARevenue lost for the Var. 1,161 4,067 9,817 N/A N/A N/ASAIFI (Nos.) 67 100 39 38 35 33SAIDI (Minutes) 3,960 6,847 2,745 2,600 2,450 2,300<strong>Lahore</strong> <strong>Electric</strong> <strong>Supply</strong> <strong>Company</strong> <strong>Limited</strong>
Break Down of Revenue RequirementDescriptionAO&MB DepreciationCRORBD Gross DM (A+B+C)E Other IncomeFNet DM (D–E)RORB - Return on Regulatory Assets BaseDM – Distribution Margin<strong>Lahore</strong> <strong>Electric</strong> <strong>Supply</strong> <strong>Company</strong> <strong>Limited</strong>
Cost Behavior of PPP + DMCost Component Nature RemarksPower Purchase PriceCapacity Transfer Charge Fixed MDI, Capacity Costs of Generation systemEnergy Transfer Charge Variable Plant Availability, GWh, Fuel Mix, Fuel PricesUse of System Charge Fixed MDI, Transmission Costs of NTDCDistribution MarginO&M Fixed Presently 5% of total Revenue RequirementDepreciationFixedis allowed to be recovered through fixedcomponent (MDI x Rs / kW / Month) of tariffRORBFixed and 95% through variable component (Rs. /Other IncomeSemi-VariablekWh). This needs to be rationalized.<strong>Lahore</strong> <strong>Electric</strong> <strong>Supply</strong> <strong>Company</strong> <strong>Limited</strong>
Key Performance IndicatorsContinuedDescription FY 08 FY 09 FY 10 FY11* FY12* FY13*RORB, Mln. Rs. (with PYA) (9,643) 106 5,312 2,546 3,875 5,123RORB, % -120.46% 1.17% 50.10% 17.79% 17.79% 17.79%RORB by NEPRA (with PYA) - 12,379 15,080 N/A N/A N/AO&M, Mln. Rs. 7,270 10,304 9,364 11,448 12,754 14,366O&M, Rs/kWh 0.53 0.78 0.67 0.73 0.76 0.80O&M by NEPRA - 8,002 9,041 N/A N/A N/AOther Income, Mln. Rs. 2,834 3,765 4,211 4,510 5,018 5,589Other Income,% of sales 4.15% 4.18% 3.27% 3.23% 2.89% 2.67%Other Income by NEPRA - 2,890 4,177 N/A N/A N/ADM, Mln. Rs. (with PYA) (4,172) 7,809 12,137 17,349 13,946 16,650DM as % of sales -6.11% 611% 6.96% 9.43% 12.44% 8.04% 7.95%DM by NEPRA (with PYA) - 18,652 21,305 N/A N/A N/ASales Rev., Mln. Rs. 68,277 90,006 128,669 145,492 173,398 209,406Sales Rev., Rs/kWh 4.96 6.84 9.27 9.27 10.24 11.61Sales Rev. by NEPRA - 99,421 132,461 N/A N/A N/APYA – Prior Period Adjustment (Due delay Tariff Determination & Notification<strong>Lahore</strong> <strong>Electric</strong> <strong>Supply</strong> <strong>Company</strong> <strong>Limited</strong>
Key Performance IndicatorsContinuedDescription FY 08 FY 09 FY 10 FY11* FY12* FY13*RORB, Mln. Rs. (with PYA) (9,643) 106 5,312 2,546 3,875 5,123RORB by NEPRA (with PYA) - 12,379 15,080 N/A N/A N/AO&M, Mln. Rs. 7,270 10,304 9,364 11,448 12,754 14,366O&M, Rs/kWh 0.53 0.78 0.67 0.73 0.76 0.80O&M by NEPRA - 8,002 9,041 N/A N/A N/AOther Income, Mln. Rs. 2,834 3,765 4,211 4,510 5,018 5,589Other Income,% of sales 4.15% 4.18% 3.27% 3.23% 2.89% 2.67%Other Income by NEPRA - 2,890 4,177 N/A N/A N/ADM, Mln. Rs. (with PYA) (4,172) 7,809 12,137 17,349 13,946 16,650DM as % of sales -6.11% 6.96% 9.43% 12.44% 8.04% 7.95%DM by NEPRA (with PYA) - 18,652 21,305 N/A N/A N/ASales Rev., Mln. Rs. 68,277 90,006 128,669 145,492 173,398 209,406Sales Rev., Rs/kWh 4.96 6.84 9.27 9.27 10.24 11.61Sales Rev. by NEPRA - 99,421 132,461 N/A N/A N/APYA – Prior Period Adjustment (Due delay Tariff Determination & Notification<strong>Lahore</strong> <strong>Electric</strong> <strong>Supply</strong> <strong>Company</strong> <strong>Limited</strong>
Rs./kWhFinancial Summary (1/3)Description FY 08* FY 09* FY 10* FY 11 FY 12 FY 13PPP – Adjusted 5.26 6.24 8.40 8.17 9.50 10.69PPP – Unadjusted 4.59 5.41 7.24 7.10 8.31 9.41Distribution Margin 0.50 0.71 0.63 0.72 0.83 0.92Prior Period Adj. - - 0.84 0.38 - -Total 5.77 6.95 9.86 9.27 10.33 11.61Actual Revenue 496 4.96 684 6.84 927 9.27 927 9.27 10.33 11.61Variance, Rs/kWh (0.81) (0.12) (0.59) - - -Income Statement Summary (Mln Rs.)Sales Revenue 65,612612 75,185 95,154 116,772 173,398398 209,406+ GOP Subsidy 2,665 4,821 33,516 28720 - -+ Other Operating Inc. 845 946 877 958 1,085 1,214- PPP 72,449 82,197 116,532 128,142 159,452 192,757- Operating Expenses 7,270 10,304 9,364 11,448 12,754 14,366+ Non-operating Inc. 1,989 2,819 3,334 3,552 3,934 4,375- Fin. & other Exp. 2,411 1,421 1,877 2,207 3,397 4,015EBT (with PYA) (11,020) (151) 5,108 8,203 2,813 3,859Taxes - - - - - -Net Income (11,020) (151) 5,108 8,203 2,813 3,859<strong>Lahore</strong> <strong>Electric</strong> <strong>Supply</strong> <strong>Company</strong> <strong>Limited</strong>
Financial Summary (2/3)Description FY 08* FY 09* FY 10* FY 11 FY 12 FY 13Balance Sheet SummaryNet Fixed Assets 21,311 26,092 29,836 37,666 47,716716 56,350Work-in-Progress 2,130 2,645 2,371 4,162 5,308 4,879Other LT Assets 51 75 85 96 109 122Trade Debts 7,686 8,113 14,400 15,855 17,589 19,683Subsidy Receivables - 11,026 23,745 - - -Other Current Assets 19,731 19,507 24,111 23,596 29,224 35,264Total Assets 50,908 67,458 94,549 81,376 99,946 116,298Long-term debt 1,337 1,140 1,443 2,712 5,985 7,113Other long-termLiabilities40,910 48,566 45,785 47,727 50,626 53,381Current Liabilities 10,385 19,629 44,090 19,502 29,087 37,698Total Liabilities 52,633 69,334 91,317 69,941 85,699 98,192Equity (1,725) (1,876) 3,231 11,435 14,247 18,106Liabilities + Equity 50,908 67,458 94,549 81,376 99,946946 116,298<strong>Lahore</strong> <strong>Electric</strong> <strong>Supply</strong> <strong>Company</strong> <strong>Limited</strong>
Financial Summary (3/3)Description FY 08* FY 09* FY 10* FY 11 FY 12 FY 13Cash-flows SummaryCF Operating Activities (5,286) 860 11,138 6,927 4,800 4,574Capital Expenditure 4,704 6,461 5,143 11,503 13,531 10,955CF Investing Activities (4,702) (6,485) (5,153) (11,515) (13,543) (10,968)Debt Repayment (2,281) (58) (233) (233) (233) (235)New Long-term Loans 1,029 35 535 1,502 3,508 1,399CF Financing Activities 15,229 5,276 (4,021) 1,351 6,686 5,574Key RatiosOperating Profit Margin -16.14% -0.17% 4.36% 5.88% 1.62% 1.84%Operating Expense as % ofSales10.65% 9.73% 8.00% 8.21% 7.36% 6.86%Interest Coverage Ratio (with PYA) (7.00) 0.41 26.00 7.85 3.65 4.05Self-financing Ratio % (1.32) 0.17 2.05 0.90 0.48 0.38Trade Debt Turnover 9.77 11.39 11.43 9.22 10.37 11.24Fixed Asset Turnover 3.20 3.45 4.31 3.70 3.63 3.72Long Term Debt to Equity (0.81) (0.73) 0.52 0.26 0.44 0.41Total Liabilities to Assets 083 0.83 074 0.74 050 0.50 062 0.62 057 0.57 052 0.52<strong>Lahore</strong> <strong>Electric</strong> <strong>Supply</strong> <strong>Company</strong> <strong>Limited</strong>
Business Plan 2010‐11Snap ShotCustomer, Tariff and Sales StructureDescriptionResidential Industrial CommercialOthers(Agri, etc)TotalAnnual MkWh 6011 6,011 6,568 1,282 1,833 15,694% MkWh 38% 42% 8% 12% 100%Number of customers (Mlns) 2.69 0.07 0.49 0.05 3.31Average Tariff - Business Plan(Rs/kWh)9.32 8.90 12.71 8.02 9.27Average Notified Tariff (Rs/kWh) 6.23 7.91 11.30 7.08 7.44GOP Tariff Subsidy (Rs/kWh) 3.09 0.99 1.40 0.94 1.83<strong>Lahore</strong> <strong>Electric</strong> <strong>Supply</strong> <strong>Company</strong> <strong>Limited</strong>
Tariff Petitions & Determinations HistoryDescription 2004 -05 2005-06 2006-07 2007-08 2008-09 2009-10 2009-10Petition filing Jun-03 29-04-05 No No 16-06-08 09-04-09 31-12-2010datePetition PetitionPetition Period Annual Multi-Year N/A N/A Annual Annual 2 nd , 3 rd , 4 th(MYT)QtrsDate of 02-07-04 No 23-02-07 10-01-08 29-09-08 & 10-12-09 19-04-10Determination04-09-09 (1 st Qtr) (2 nd Qtr)Basis ofPetitionN/AMYTReviewPetitionPetitionPetitionDetermination 2003Petition dt. Motion 2008-09 2009-10 2009-1029-04-05 2006-07Review Motion Filed N/A Filed No No Filed NONotification Date No N/A 24-02-07 07 No 12-11-0811 21-12-200912 2009 NOEffectiveNotificationAvailableRecovery PeriodSRO1064 of2003NoRecoveryof DRRSRO 1064of 2003NoRecoveryof DRRSRO 1064of 2003 &SRO 157f 2007SRO 157of 2007SRO 157 of2007 &SRO 1180f 2008SRO 1180of 2008 &SRO 1129f 2009of 2007 of 2008 of 20094 Monthsforrecoveryof DRRNoRecoveryof DRR7.5 Monthsforrecovery ofDRRNoRecovery ofDRR in 1 stQtrSRO 1129of 2009NoRecovery ofDRRNote: - The DRR could only be recovered for a period of 11.5 months against total period of 66 months (2004 to 2 ndQtr 2010)
Thanks<strong>Lahore</strong> <strong>Electric</strong> <strong>Supply</strong> <strong>Company</strong> <strong>Limited</strong>
Investment PlanFY 2010‐11Description FY 08 FY 09 FY 10 FY11 FY 12 FY 13STG- Budget, RsMln. 4,621 2,884 3,661 4,918 6,639 4,208Capitalized-% 22% 67% 64% 90% 90% 90%Physical Target 64 29 43 90 87 71Achievement -% 25% 76% 73% 86% (Qtr-1)DOP- Budget, Rs Mln. 400 500 400 500 550 600Capitalized-% 100% 107% 97% 90% 90% 90%Physical Target 270 270 370 780 385 440Achievement -% 200% 93% 93% 80% (Qtr-1ELR-Budget, Rs Mln. 500 500 500 500 700 700Capitalized-% 106% 102% 83% 90% 90% 90%Physical Target 1,790 1,790 630 1,350 1,210 1,220Achievement -% 94% 72% 97% 80%(Qtr-1)SCADA- Budget, Rs Mln. - - - - 1500 1399<strong>Lahore</strong> <strong>Electric</strong> <strong>Supply</strong> <strong>Company</strong> <strong>Limited</strong>
Forecasting AssumptionsDescription Baseline FY 11 FY 12 FY13O & M Expenses 22% 11% 13%DepreciationDistributionEquipment3.50% 3.50% 3.50%Office Buildings 02.00% 00% 02.00% 00% 02.00% 00%Vehicles 10.00% 10.00% 10.00%Office Equipments 10.00% 10.00% 10.00%Collection fromCustomers55 days 40 days 37 days 34 daysPayable to CPPA 107 days 25 days 36 days 41 daysOther Income 7% 11% 11%Interest Rates15% for Local & 17% for Foreign LoanBorrowing Terms7 Years for Local Loan and 15 Years for ForeignLoan<strong>Lahore</strong> <strong>Electric</strong> <strong>Supply</strong> <strong>Company</strong> <strong>Limited</strong>
Business Plan 2010‐11Snap ShotA. MkWh Purchased (NTDC)12 month 2009-2010 2010-2011DescriptionAug-10averageActualGoalMkWh 1,793 1,342 16,100 18,044% Growth in MkWh 4.1% 6.03% 6.03% 12.1%B. MkWh Served to CustomersDescriptionAug-1012 monthaverage2009-2010Actual2010-2011GoalMWh 1,777 1,341 16,089 17,863% Growth in MWh 4.1% 6.54% 6.55% 11.0%<strong>Lahore</strong> <strong>Electric</strong> <strong>Supply</strong> <strong>Company</strong> <strong>Limited</strong>
Business Plan 2010‐11Snap ShotC. Billed to CustomersDescriptionAug-1012 monthaverage2009-2010Actual2010-2011GoalMkWh 1,514 1,157 13,881 15,694% Growth (MkWh) 4.5% 5.4% 5.42% 13.1%Rupees Million 12,712 7,921 95,055 116,850% Growth (Rs ‘Mln.) 44.9% 28.0% 28.0% 22.9%D. Collected from CustomersDescriptionAug-1012 month 2009-2010 2010-2011averageActualGoalMkWh 1,394 1,078 12,940 15,537537% Growth (MkWh) 14.6% 0.90% 0.90% 20.1%Rupees Million 12,0487 7,530 90,359 115,682% Growth (Rs '000) 61.5% 23.39% 39% 23.39% 39% 28.0%<strong>Lahore</strong> <strong>Electric</strong> <strong>Supply</strong> <strong>Company</strong> <strong>Limited</strong>
E. Collection RatioDescriptionBusiness Plan 2010‐11Snap ShotAug-1012 month 2009-2010 2010 2010-20112011average Actual GoalMWh collected (D)/MWh Purchased (A) - %age 77.75% 80.36% 80.37% 86.11%Rs. collected (D)/Rs Billed (C) - %age 94.8% 95.1% 95.1% 99.0%F. Energy LossesDescriptionAug-1012 monthaverage2009-2010Actual2010-2011GoalTechnical Losses 12.12% 10.12% 10.15% 10.0%Non-Technical Losses 3.48% 3.68% 3.65% 3.0%Total Losses 15.6% 13.8% 13.8% 13.0%G. Financial HealthDescriptionAug-1012 month 2009-2010 2010-2011average Actual GoalNet Margin (Rs.Million) 2,458 426 5,107 8,203Margin per kWh 1.62 0.37 0.37 0.52O&M Costs (Rs/kWh) 0.55 0.67 0.67 0.73Cash In Transit<strong>Lahore</strong> <strong>Electric</strong> <strong>Supply</strong> <strong>Company</strong> <strong>Limited</strong>
H. ReliabilityBusiness Plan 2010‐11Snap ShotDescriptionAug-1012 month2009-20102010 2010-20112011averageActualGoalDEC (duration of outages) – SAIDI 245.80 234.90 2,744.52 2,607.00FEC (frequency of outages) - SAIFI 3.90 3.30 39.41 37.43I. ProductivityDescriptionAug-1012 monthaverageMkWh Billed/employee l 075 0.75 075 0.75Customers Billed/employee 164 164J. Customer SatisfactionDescriptionAug-1012 monthaverageNumbers of customers served 3.2 Mln. 3.2 Mln.Claims/Customers 001 0.01 001 0.01<strong>Lahore</strong> <strong>Electric</strong> <strong>Supply</strong> <strong>Company</strong> <strong>Limited</strong>
Performance ContractIndicators & Targets for 2010‐11Operational & CommercialKPIs 2009-10Target2009-10Actual2010-11GoalLine Losses 13.7% 13.8% 13.0%Collection Ratio 100.0% 93.2% 99.0%Transformer Failure Rate 4.00% 3.73% 3.75%Line Failure Rate < 20 Minutes 250.0 232.1 225Line Failure Rate > 20 Minutes 46.0 47.5 45.0Defective Meters (7-12 months as % of total) 50% 5.0% 14.3% 50% 5.0%<strong>Lahore</strong> <strong>Electric</strong> <strong>Supply</strong> <strong>Company</strong> <strong>Limited</strong>
Performance ContractIndicators & TargetsFinancial PerformanceKPIs2009-102009-102010-1111TargetActualGoalCash In Transit (Monthly Average) 10.0% 5.91% 9.0%O & M Expenses (Rs./ /kWh) 081 0.81 067 0.67 077 0.77Capital Expenditure Project ImplementationKPIs 2009-10 2009-10 2010-11Target Actual GoalCapitalization (Completion of A-90) 70% 79% 80%Capital ExpenditureSecondary Transmission & Grids 90% 50% 90%Distribution of Power 90% 97% 90%Energy Loss Reduction 90% 99% 90%Rural Electrification 90% 99% 90%<strong>Lahore</strong> <strong>Electric</strong> <strong>Supply</strong> <strong>Company</strong> <strong>Limited</strong>
Performance ContractIndicators & TargetsCustomer Relations ManagementKPIs 2009-10Target2009-10Actual2010-11GoalNew Connection 100.00% 00% 85.42% 100.00% 00%Customer Facilitation 95.00% 95.00% 96.00%Efficiency of <strong>Supply</strong> CompliantResolutionEfficiency of Billing ComplaintResolution100.00% 95.57% 100.00%100.00% 100.00% 100.00%<strong>Lahore</strong> <strong>Electric</strong> <strong>Supply</strong> <strong>Company</strong> <strong>Limited</strong>
Performance ContractIndicators & TargetsHuman Resource ManagementKPIs 2009-10TargetOfficers’ Strength – OccupancyRatio2009-10Actual2010-11Goal98.18% 95.25% 95.33%Staff Strength – Occupancy Ratio 85.22% 83.01% 79.33%Resolution of Disciplinary Cases 54.15% 58.36% 80.00%% of Officers Trained 69.23% 58.06% 24.86%% of Staff Trained 15.95% 15.03% 12.28%Employee SafetyKPIs 2009-10Target2009-10Actual2010-11GoalNo. of Accidents – Fatal 0 12 0No. of Accidents – Non Fatal 24 26 24<strong>Lahore</strong> <strong>Electric</strong> <strong>Supply</strong> <strong>Company</strong> <strong>Limited</strong>
Thanks<strong>Lahore</strong> <strong>Electric</strong> <strong>Supply</strong> <strong>Company</strong> <strong>Limited</strong>
Components of Power Purchase PriceRs. / kWh Sold
Action Plan For Enhancement of Recovery2010 ‐ 11Figures in bn. Rs.FY Billing Recovery %age2010-11 175 173 99Action Plan to Achieve the Target94% of Billing 165.0080% of GovtArrear 390 3.9010% of Disconnected Arrear 0.2070% of Running Defaulters 2.1780% of Govt. Subsidy (Agri.+GST) 1.8910% of Deferred Amount 0.18Total 173.32<strong>Lahore</strong> <strong>Electric</strong> <strong>Supply</strong> <strong>Company</strong> <strong>Limited</strong>
Forecasting AssumptionsDescription FY 08* FY 09* FY 10* FY 11 FY 12 FY13Sales Growth -1.30% -4.34% 5.42% 13.06% 7.00% 7.40%T & D Losses 0.15% 0.43% 0.50% -0.7% -0.50% -0.52%Maximum Demand 1.9% -2.4% 15.5% 5.9% 7.0% 7.4%Collection 98.45% 95.90% 90% 93.22% 99.00% 99.00% 99.00%A/R Turnover (in days) 43 39 55 40 37 34WACC/RORB (with PYA) -120.46% 1.17% 17% 50.10% 17.79% 79% 17.79% 79% 17.79% 79%Tariff Subsidy Collection 134% 46% 39% 100% - -<strong>Lahore</strong> <strong>Electric</strong> <strong>Supply</strong> <strong>Company</strong> <strong>Limited</strong>
Growth of Units SoldUnits Sold GWh and Growth %13 .1%15,6946.5%‐1.3%10.6 %13,947 13,766 ‐4.3%13,08913,1685.4%13,8812006 2007 2008 2009 2010 2011
Sale of Power to Taxes & Duties(Historical Trend 2006-2010)2010095,15420,876100% 22%116,030 (Mill)200975,185100%16,83122%92,016 (Mill)20082007200665,612 10,961100%17%61,823 10,168100% 16%55,381 9,765100% 18%76,574 (Mill)71,991 (Mill)65,146 (Mill)‐ 20,000 40,000 60,000 80,000 100,000 120,000 140,000SoP BillingTaxes & Duties
Sale of Power to Taxes & Duties2011 139,50930,919 170,429 (Mill)100%22%2010 95,15420,876116,030 (Mill)100%22%2009 75,185 16,83192,016 (Mill)100% 22%200865,612 10,961100% 17%76,574 (Mill)200761,823 10,16871,991 (Mill)100%16%2006 55,381 9,76565,146 (Mill)100% 18%‐ 20,000 40,000 60,000 80,000 100,000 120,000 140,000 160,000 180,000SoP BillingTaxes & Duties
TOGATTIMPBEMCOFROMREWATG.VIEWDESCONLAHORERACHNATOWNSHAHDARASCARPSHAHDARAP/HRUSTAMNEWSHAHDARAUISBHATIGATETO K.S.KAKUS.WALAGATETO SHAMKEYFORTRAVIB.BAGHKHOKHARROADWASANPURACHAHMIRANBHOGIWALSHALIMARSHALIMAR-IIL A H O R ERINGDAROGHAWALA /(M.PURA-II)PRESSCOLONYNEW SHALIMAR220kVMOMINPURABATAPURSAGGIANMOCHIGATEFATEHGARHSANDARIWAZGARDENM.ROADSUNNYVIEWP.W.RGULSHAN RAVIQARTABASHADMANGHAZIROADNEWCHUNGBALLOKIP/H(SUKH CHAIN)MULTAN RDBAHRIATOWNEMEJUBLITOWNAWT(KOTBAGH)COCA COLATHOKKARFIZAIAH / SJOHARTOWN-IISABZAZARSAIDPURJOHARTOWNP. UNIV.H. S.WAPDATOWNCHINARBAGHDHAREHBARIQBAL TOWNJAPAN P/HBAGHRIANLAHORENEWPUNJABUNIV.NEW G. TOWNMODELTOWNMODELTOWNSOCITYTOWNSHIPKAKEZAITOWN(AUD & ACC)K.E MEDICALH / STO LULYANILEFOFEROZPUR RD.OLD KOTLAKHPATNEW KOT LAKHPATKAHNANAUCENTRALPARKGULBERGREHMANPARKPACKAGESDWND.MC.EG.MWALTON ROAD(AIR PORT)LAHORECANTTSHAHIDMAHMOODM. WASEEMYOUNUSJAVID IQBALABDUL MAJIDMALIKWALLINGTONMALL500KV220KV132KV66KVHYDEL STATIONTHERMAL STATIONAIRPORTINAYAT PURA(STATE LIFE H/S)DHAPH-VIIRIAGOLFSPRINGMEDOWSLEGENDEXISTING PROPOSEDGRIDSLINESGRIDSN. T. D. CG. M. PLANNING POWERL E S C OELECTRICAL NETWORK(Geographical)DRG# GMPP/Geog/L/004BBARKIDHA PH-VILINESDATE03-07-09
JURISDICTION CONSUMERSJurisdiction & Consumers5 Districts, i t 32Milli 3.2 Millions ConsumersNANKANA0.41 M0.38 MTotal Consumers<strong>Lahore</strong> <strong>Electric</strong> <strong>Supply</strong> 3.21 <strong>Company</strong> Millions<strong>Limited</strong>
Customer SatisfactionRegional Customer Services Centers1LESCO HQ <strong>Lahore</strong>6Town Ship <strong>Lahore</strong>2Ravi Road <strong>Lahore</strong>7A.I.Town <strong>Lahore</strong>3Ichhra <strong>Lahore</strong>8Kasur4Shalamar <strong>Lahore</strong>9Okara5Defence <strong>Lahore</strong>10Sheikhupura<strong>Lahore</strong> <strong>Electric</strong> <strong>Supply</strong> <strong>Company</strong> <strong>Limited</strong>
Customer SatisfactionPrime Functions of Customer Services CenterCorrection and Adjustments of BillsImmediate Correction of Wrong ReadingExtension in Due Date of <strong>Electric</strong>ity BillsInstallments of BillsDuplicate BillsNew Application Forms<strong>Lahore</strong> <strong>Electric</strong> <strong>Supply</strong> <strong>Company</strong> <strong>Limited</strong>
TO NISHATABADTO JARANWALA/MOHLANSANGLAHILLTO SITTARA TXT./NISHATABADTO JARANWALA /BUCHEKITO JARANWALAALI JAJJSADARGOGERAQADIRABAD(MEPCO)SUKHEKIMOHLANCHAK - 29OKARACITY-ISAFDARABADSHAHKOTMANAWALATHATTAISMAILBUCHEKIRENALAKHURDK.K.DOGRANSABAP/H(W/SOHAIL)FEROZWATTWANNANKANASAHIBDOULACHOCHAKSHERGARHMACHIKAYHABIBABAD(WRR)WARBURTONJANDIALASHER KHANFAROOQABAD225MWORIENTRENTALJUMBERCHUNIANPATTOKIBHAIPHERUSKP(Indst)CKMMURIDKESAPHIRE225MWAYESHAICI I.C.IPUBY.ST.TOG.H.RDP/HASSOCIATEDGROUPSHARQPURSARFRAZNAGARNISHAT 200MWCHUNIANNISHAT POWER200MWKANGANPURCKMCCPPZTMTHIANG MORE(ELLAHABAD)FROMMANGLAATTABADMANGA225MWMANDIUSMAN WALA200MWFATEH PURI /MURIDKEYKHUDIANITHAD.CSUNDERKASUR-IIPAKAGES-IINARANGK.K.RD.TO NAROWALK.NOOR P/HKASURLAHORERINGSEPCOLP/HLULYANITO ARIFWALADARBARISMAILOKARACANTTBONGA HAYAT(MEPCO)O.CITY-II225MWSAIFCHAK -40 - DBASIRPURMANDIAHMADABAD500KVEXISTINGGRIDSLEGENDLINESPROPOSEDGRIDSLINESHAVALIDWND.MC.EG.M220KV132KV66KVHYDEL STATIONTHERMAL STATIONN. T. D. CG. M. PLANNING POWERSHAHIDMAHMOODM. WASEEMYOUNUSJAVID IQBALABDUL MAJIDMALIKL E S C OELECTRICAL NETWORK(Geographical)DRG# GMPP/Geog/L/004ADATE03-07-09
Customer SatisfactionTelephonic Contact Round The ClockCall Centre (118)Regional Customer Services Centre, all SubDivisionsToll Free 0800‐00118 (Free Calls)Telephone Numbers of DMOs & AMOs onBills<strong>Lahore</strong> <strong>Electric</strong> <strong>Supply</strong> <strong>Company</strong> <strong>Limited</strong>
Customer Satisfaction7 Mobile Customer Services Center 4 MOBILE CUSTOMER SERVICESCENTRES FOR LHR. 3 MOBILE CUSTOMER SERVICECENTRES FOR SKP, OKARA & KASUR<strong>Lahore</strong> <strong>Electric</strong> <strong>Supply</strong> <strong>Company</strong> <strong>Limited</strong>
Customer SatisfactionLESCO Official WebsiteURL: http://www.lesco.gov.pk<strong>Lahore</strong> <strong>Electric</strong> <strong>Supply</strong> <strong>Company</strong> <strong>Limited</strong>
Customer SatisfactionTelephonic Contact Round The ClockDEFECTIVE METER REPLACEMENT 2009‐10SINGLE PHASE(Nos)THREE PHASE(Nos)139305 12140DETECTION AND RECOVERY 2009‐10UnitsNO ofFIR’s ChargedDetection(Mkwh)AmountCharged (MRs.)AmountRecovered(MRs.)51022 6766 110.32 930.52 374.66<strong>Lahore</strong> <strong>Electric</strong> <strong>Supply</strong> <strong>Company</strong> <strong>Limited</strong>
DEFECTIVE METER REPLACEMENT 2009‐10SINGLE PHASE(Nos)THREE PHASE(Nos)139305 12140DETECTION AND RECOVERY 2009‐10NO ofDetectionFIR’sUnits Charged(Mkwh)Amount Charged(MRs.)Amount Recovered(MRs.)51022 6766 110.32 930.52 374.66
Backup Slides<strong>Lahore</strong> <strong>Electric</strong> <strong>Supply</strong> <strong>Company</strong> <strong>Limited</strong>
Grid Station Works of 6 th STGCompleted During Year 2009‐10Sr. No Type of Work Capacity Nos MVA Added26 MVA 31 5 New Grid Stations13 MVA 315740MVA 126 MVA 42 5 Extensions 13 MVA104L/Bay 140 MVA 183 21 Augmentation26 MVA 329113 MVA -4 1 Conversion 26MVA 1 13Total 32 Works Completed - 34 565Cost of Grid Stations Works Completed In 2009-10From Own Resources (In Million Rs.) 1669From ADB Financing (In Million Rs.) 244Total Cost 1913<strong>Lahore</strong> <strong>Electric</strong> <strong>Supply</strong> <strong>Company</strong> <strong>Limited</strong>
Transmission Lines Works of 6 th STGCompleted During Year 2009‐10# Type of Work Length In Km1 132 kV New Line 392 Re-Conductoring of Lines 33Total 72Cost of Transmission Lines Completed in 2009‐10 fromOwn Resources (In Million Rs.)421<strong>Lahore</strong> <strong>Electric</strong> <strong>Supply</strong> <strong>Company</strong> <strong>Limited</strong>
S.NoGrid Station Works Of 6 th STGPlanned In Year 2010-11No. of Transformers addedType of WorkCapacity NosMVAAdded40MVA 41 10 New Grid Stations26 MVA 15 56313 MVA 12 43 Extensions26 MVA 12L/Bay 3131240 MVA 183 37 Augmentation 26 MVA 1951913 MVA -Total 90 Works - 99 1394Cost of Grid Stations Works Proposed In 2010‐11In Million Rs.From Own Resources 1892From ADB Financing 1000From World Bank Financing 440Total Cost 3332
Transmission Lines Works Of 6 th STGPlanned In Year 2010-1111S.No Type of Work Length In Km1 132 kV New Line 672 Re‐Conductoring of Lines 245Total 312Cost of Transmission Lines Planned in 2010‐1111(In Million Rs.)From Own Resources 1524From ADB Financing 0From World Bank Financing 62Total Cost 1586Grand Total for Grid Stations + T/Lines Planned in 2010‐11 4918
Grid Stations Works Of 6 th STGCompleted During Year 2010-11 to dateS.NoType of WorkNo. of Transformers added MVACapacity Nos Added1 1 New Grid Stations ti 26 MVA 1 2626 MVA 12 3 Extensions15 MVA 1 5413 MVA 140 MVA 103 14 Augmentations26 MVA 4 19213 MVA -Total 18 Works Completed - 18 272Cost of Grid Stations Works Completed In 2010‐11 11 to DateFrom Own Resources (In Million Rs.) 451From ADB Financing (In Million Rs.) 390From W.B Financing (In Million Rs.) 130Total Cost 971
11 & 132 kV Capacitors‣ 11kV Capacitors Installed During 2009-10 = 151.55 MVAR‣11kV Capacitors already in the Stock under Installation ti = 304 MVAR‣ Capacitors to be Procured under ADB (2010-11) = 96 MVAR of132kV and 450 MVAR of 11kV.
NEW TECHNIQUES OF THEFT OF ELECTRICITYIn the recent year, the following new techniques of theft of electricity have beendetected in LESCO particularly in steel re‐rolling Industry and AC premises:• Manipulating CT/PT circuits of CT operated LT MDI metering equipment by insertingRemote Control Signal devices operative on 433 MHz frequency bandwidth.• Vanishing/damaging LCD display of electrostatic meters.• Erasing data of EPROM of electrostatic meter by applying high voltage from externalsource.• Direct hooking from 11KV feeder by laying underground 11KV cables and utilizing ownTransformers.• Direct hooking from Transformer through concealed cables (underground / under wall).• Burning of meters through external source to eliminate the evidence of theft.Only in 3 rd <strong>Lahore</strong> Circle 29.817 Million units worth Rs.235 Million were detectedduring last t14 months.
NEW TECHNIQUES OF THEFT OF ELECTRICITYDifficulties faced during detection and recovery of detected amount charged.• Political Interference• Non‐cooperation of Police Department during investigation regarding FIRs against thestealers of electricity (In most of the cases investigating officers were hesitant to sendchallan to the courts due to “different reasons”)• Undue relief to the electricity it stealers from the Civilil Courts and in most of the casesthehigher courts were approached to get the decision in favor of LESCO• Lenient punishments in <strong>Electric</strong>ity ActSuggestions to Curb theft of <strong>Electric</strong>ity• Revision of Penalties under <strong>Electric</strong>ity Act regarding theft of electricity.• Setting up of LESCO’s police stations by hiring manpower from Police Department likeCustoms and Railways.• Establishment of more Courts for speedy trials of thieves of <strong>Electric</strong>ity.• In case of FIR against stealers of electricity under section 39 A, the investigation reportg y , g pshould be signed jointly by I.O. (Investigating Officer) from Police Department andconcerned XEN as Technical Expert.
Forecasting AssumptionsDescription FY 11 FY 12 FY13ExpensesSalaries & Wages50% Increase & 5% 15% Increase & 5% 15% Increase & 5%Increments Effect Increments Effect Increments EffectHouse Acquisition 10% 5% 5%Utility Allowance 20% 11% 11%Repair & Maintenance 3.50% 3.50% 3.50%Management Fees 10% 10% 10%NEPRA Fee 15% 15% 15%Vehicle Running 15% 31% 31%All Other ExpensesAvg. of Yearly Increase for Avg. of Yearly Increase for Avg. of Yearly Increase forlast 3 Yearslast 3 Yearslast 3 YearsOther IncomeSale of Scrap 20% 20% 20%Meter & Service Rentals 15% 15% 15%Ammortization of DeferredIncome3.5% of Deferred Credtis 3.5% of Deferred Credtis 3.5% of Deferred CredtisMiscellaneousAvg. of Yearly Increase forAvg. of Yearly Increase for Avg. of Yearly Increase forInterest RatesBorrowing TermsIncome taxlast 3 Years15% for Local & 17% forForeign Loanlast 3 Years15% for Local & 17% forForeign Loanlast 3 Years15% for Local & 17% forForeign Loan7 Years for Local Loan and 7 Years for Local Loan and 7 Years for Local Loan and15 Years for Foreign Loan 15 Years for Foreign Loan 15 Years for Foreign Loan<strong>Lahore</strong> <strong>Electric</strong> <strong>Supply</strong> <strong>Company</strong> <strong>Limited</strong>
Stakeholders AnalysisCustomersMeeting needsConsistent <strong>Supply</strong> at Low PricesHigh Quality & Reliable ServiceTimely Provision of ConnectionsTimely BillingQuick Response to ComplaintsContractorsSuppliersTimely & steady supply of productCommunicate future needsArrive at a fair & reasonable priceEnsure timely paymentsDevelop partnering relationshipsRegulatorStandard Operating ProceduresTransparent tContract Management age e License Obligations CompliantGood GovernanceTimely PaymentsMeet with Performance andDisputes Settled Without DelaysOperating StandardsEasy Access to Work SiteCompliance with information andDevelop Partnering Relationshipregulatory requirementsInvestorsReturn on InvestmentPredictable Regulatory StrategyFreedom to Pursue BusinessObjectivesEmployeesPerformance based Reward SystemProfessional growth & careerdevelopmentSafe Working EnvironmentProperly Defined OrganizationalStructure & RolesJob securityGovernmentSupport a Broader Economic agendaRealize e high value auefor its assetsProvide infrastructure to attractinvestorsDemonstrate good citizenshipCommunityProtect the EnvironmentPublic SafetyProvide Support in Terms of:ProjectsLocal SourcingEducation<strong>Lahore</strong> <strong>Electric</strong> <strong>Supply</strong> <strong>Company</strong> <strong>Limited</strong>
TOP 3 BEST CIRCLES (Losses)CirclesUnitsReceivedUnits Billed% Age LossSKP 2547.36 2272.75 10.8EASTERN 2083.50 1822.2727 12.5NORTHERN 2633.05 2291.54 13.0TOP 3 WORST CIRCLES (Losses)KASUR 1708.70 1366.75 20.00OKARA 1214.83 1009.32 16.9CENTRAL 2771.17 2334.05 15.8
TOP 3 BEST DIVISIONS (Losses)DivisionsUnitsReceivedUnits BilledMkWh% Age LossCITY SKP 626.44 584.81 6.6GULBERG 770.92 707.0909 83 8.3MCLEOD ROAD 357.23 324.25 9.2TOP 3 WORST DIVISIONS (Losses)K.R. KISHAN 152.62 115.00 24.6KASUR RURAL 419.70 325.22 22.5CHUNIAN 376.02 292.49 22.2
TOP 3 BEST CIRCLES (Recovery)Circles Billing Collection% AgeCollectionSKP 17577.56 16646.36 94.70SOUTHERN 19939.20 18877.90 94.68CENTRAL 21195.23 19735.72 93.11TOP 3 WORST CIRCLES (Recovery)OKARA 7113.69 6476.29 91.04KASUR 10069.05 9201.49 91.38EASTERN 16235.91 14917.32 91.88
TOP 3 BEST DIVISIONS (Recovery)Divisions Billing Collection% AgeCollectionDefence Road 5336.53 5232.69 98.05Muridke 4393.79 4302.52 97.9292Shahkot 1391.60 1332.25 95.74TOP 3 WORST DIVISIONS (Recovery)Chunian 1984.78 1739.65 87.65Hujra 1493.91 1317.14 88.17Depalpur 1755.92 1554.88 88.55