V - Leif and Vera Svalgaard's
V - Leif and Vera Svalgaard's
V - Leif and Vera Svalgaard's
- No tags were found...

You also want an ePaper? Increase the reach of your titles
YUMPU automatically turns print PDFs into web optimized ePapers that Google loves.
XIII IAGA Observatory WorkshopGolden, 17 June, 2008Observatory Data: a 170-year Sun-Earth Connection<strong>Leif</strong> SvalgaardAbstract: The discovery of the sunspot cycle <strong>and</strong> the first results of the ‘Magnetic Crusade’ together made it clear that solar <strong>and</strong>geomagnetic activity are intimately related <strong>and</strong> that observing one is learning about the other [both ways]. Underst<strong>and</strong>ing of thismagnificent relationship had to await more than a century of progress in both physics <strong>and</strong> observations, <strong>and</strong> only in the last fewdecades have we achieved the elucidation that in the middle of the 19 th Century was so fervently hoped for: The lack of rapid progressso frustrated the observers [<strong>and</strong> their funding agencies] that many observatories were shut down or had operations severely curtailed,because as von Humboldt remarked in vol. 4 of his Cosmos: “they have yielded so little return in proportion to the labor that had goneinto collecting the material”. The confirmation by spacecraft measurements of what workers in solar-terrestrial relations had so longsuspected namely that a solar wind connects the magnetic regimes of the Sun <strong>and</strong> the Earth has finally brought about an underst<strong>and</strong>ingof one half of the relationship [activity] while the discovery of the ionosphere <strong>and</strong> measurements of solar ultraviolet <strong>and</strong> X-rayemissions have brought underst<strong>and</strong>ing of the other half [regular diurnal variation]. We now have a quantitative underst<strong>and</strong>ing of thesephenomena [although the microphysics is still debated] allowing us to model quantitatively the geomagnetic response to solar <strong>and</strong>interplanetary conditions. The immense complexity of geomagnetic variations becomes tractable by the introduction of suitablegeomagnetic indices on a variety of time scales. Because different indices respond to different combinations of solar wind parameterswe can invert the response <strong>and</strong> determine solar wind speed <strong>and</strong> density <strong>and</strong> interplanetary magnetic field strength from simple hourlymean values as far back as these are available, as we will show in this talk. In addition, the underst<strong>and</strong>ing of the ionospheric responseto solar Far UltraViolet, allows us to infer FUV in the past as well, with the possibility of checking [<strong>and</strong> correcting] the sunspotnumber <strong>and</strong> calculating the Total Solar Irradiance. As geomagnetic variations have been monitored for ~170 years with [for thispurpose] constant calibration, we have a data set of immense value for underst<strong>and</strong>ing long-term changes in the Sun. We argue that allefforts must be expended to preserve <strong>and</strong> digitize these national <strong>and</strong> scientific treasure troves.
In Memoriam: Emil Kring Lauridsen
The Central Problem of Geomagnetic VariationsThe geomagnetic record shows a mixture of signatures from different physical processes:the regular daily variation (1), irregular short duration [1-3 hours] variations (2), <strong>and</strong>‘storms’ typically lasting a day or more (3). Geomagnetic indices have been devised tocharacterize <strong>and</strong> quantify these three types [ignoring special effects like pulsations,eclipse effects, etc]. An experienced observer can usually distinguish the various typesfrom the general character of the curves <strong>and</strong> from hers/his knowledge of the typicalvariations at the observatory. Various computer algorithms more or less successfullyattempt to supplant the need for a human, experienced observer, but in any case the highfrequencypart of the record is the necessary ingredient in the process:213
The Difficulty with the Regular Daily VariationRecognizing <strong>and</strong> quantifying the regular daily variation, what Mayaud called SR, .is themain problem. The amplitude of this variation varies from day to day; near the focus ofthe current system, even the type of the variation changes from day to day. In derivingboth the Dst index <strong>and</strong> the K range index, SR must be recognized <strong>and</strong> removed. We allknow the problems associated with that, with the insufficiency of using the ‘5 QuietDays’ as the basis for determining SR , with the error of using an average ‘iron curve’,etc. The pattern-recognition capabilities of the experienced observer can not betransferred to successors.Long-Term Geomagnetic IndicesMayaud’s heroic construction of the aa-index (back to 1868) is unlikely to be duplicated.The international cooperation <strong>and</strong> effort that are providing us with the ap (1932-), am(1959-), <strong>and</strong> Dst (1957-) indices cannot be replicated or extended into the past. It isdifficult to gauge the long-term stability of the calibration of the range indices. The vastcollection of 19 th century yearbook data seems useless to many people to the point wherethe data is not being preserved or digitized for modern processing methods.In this talk, I’ll show how these problems can be overcome <strong>and</strong> provide a rationale forthe preservation <strong>and</strong> digitization of the yearbook data.
1.00.80.60.40.20.0IHV-index: Use of Night Hours OnlyRed boxes: Local night.IHV-index (InterHourlyVariability): sum of thesix absolute differencesbetween hourly values ofany of the geomagneticcomponents [initially forH] for the seven hoursspanning local midnight[falling within the 4 thhour].Correlation BV o2 - KAK IHV(H) 1965-2006adoptedHours from 0 UT to skip0 3 6 9 12 15 18 21 24In practice, we determine the number of hoursto skip from 0 h UT, before beginning to sum thefollowing six hourly absolute differences. Localmidnight is also the time where the correlationwith interplanetary parameters BV 2 maximizes.
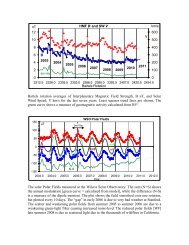
IHV is Strongly Correlated with the Am-index7060100Monthly means of IHV FRD <strong>and</strong> Am2504030200.7475*IHVAm21970 1971 1972 1973 1974 1975 1976 1977YearIHVAm = 0.2375 IHV 1.2892R 2 = 0.9595Index value (nT)806040200The Am indexcorrelated withComposite IHVindex for theinterval 1959-2003 on a timescale of Bartels27-day rotations.There is a strong correlationbetween IHV [blue] <strong>and</strong> theam-index [red]. For monthlymeans for FRD we cancalculate amfrom IHV:mamcalculated = 0.7475 IHV.mThe am-index[pink] is a good proxy foram using the same six-hourinterval [00-06 UT] as wasused in the calculation ofIHV.Using several stations atdifferent longitudes a globalAmRotation Means 1959-2003composite IHV can now beconstructed. The correlationwith am is very high, whichmeans that we can constructthe am-index as far back aswe can get IHV.0 20 40 IHV 60 80 100
Variation of IHV with Latitude1000 1996-2003100IHV (log-scale)SN10-90 -75 -60 -45 -30 -15 0 15 30 45 60 75 90Corrected Geomagnetic LatitudeFor all (~120) stations that had [essentially complete] data during 1996-2003, wecalculated the average IHV over that interval <strong>and</strong> plotted it against corrected geomagneticlatitude. The auroral zones are clearly visible <strong>and</strong> we limit ourselves now to stationsbelow 55° corrected geomagnetic latitude, for which the variation with latitude is slight.
Stations Used for Construction of IHV-indexWe use 12 independent longitude [<strong>and</strong> North/South] “boxes” plus an Equatorial b<strong>and</strong>[blue station symbols]. For each box, a reference station is shown in pink. All otherstations in the box are normalized to the reference station <strong>and</strong> the average is computed forthe box. Finally, each box is normalized to the European box [Ref: Niemegk].
Composite Box IHV-indicesIHV15N80IHV604020NGK-WNG-WIT-CLF-ABN-RSV-HAD01950 1951 1952 1953 1954 1955 1956 1957 1958 1959 1960 1961 1962IHV130N80IHV6040200KAK-SSH-MMB-KNY1950 1951 1952 1953 1954 1955 1956 1957 1958 1959 1960 1961 1962IHV290N80IHV6040200CLH-SJG-FRD1950 1951 1952 1953 1954 1955 1956 1957 1958 1959 1960 1961 1962
Semiannual Variation of (Raw) IHVS(Ψ) = 1/(1 + 3 cos 2 (Ψ)) 2/3Ψ is ‘dipole tilt’ against thesolar wind direction.IHV exhibits the ‘usual’ equinoctial semiannual variation. We plot here the seasonalvariation of IHV for all stations [during 1996-2003] below 55° corr. geomagnetic latitudeas a function of the Universal Time of local midnight for each station. This variation iswell described by the ‘S’-function of the Earth’s dipole tilt, Ψ, against the solar winddirection. We remove this purely terrestrial effect simply by dividing the raw IHV foreach station by the S-function for that station.
Composite Global IHV-indexIHV Composite80 IHVNorthSouth60402001990 1991 1992 1993 1994 1995 1996 1997 1998 1999 2000 2001 2002IHV Composite80IHV60402001880 1890 1900 1910 1920 1930 1940 1950 1960 1970 1980 1990 2000By averaging [with equal weight] all the normalized ‘box’ composites we arrive at aglobal composite IHV-index that covers all UT hours. The graphs show Bartels 27-dayrotation averages [with a 13-rotation running mean]. Note that there is no clear seasonaldifference between North <strong>and</strong> South. Arrows show years with strong high-speed streams.
8060Am obs.Am calc40201955 1960 1965 1970 1975 1980 1985 1990 1995 2000 200540Ap obs.Ap calc2001930 1935 1940 1945 1950 1955 1960 1965 1970 1975 1980 1985 1990 1995 2000 200580706050Comparison Aa observed <strong>and</strong> calculated from IHVAa obsAa calcAa is too low here4030201001890 1900 1910 1920 1930 1940 1950 1960 1970 1980 1990 2000It would seem that the aa-index is in need of a recalibration before 1957.0
60nT50IHV for Helsinki (HKI) normalized to Aa (North, night, true)HKI Aa N40302010IDV01845 1850 1855 1860 1865 1870 1875 1880 1885 1890 1895 190060IHV for Nurmajarvi ((NUR) normalized to Aa (North, night, true)50NUR Aa N40302010IDV01955 1960 1965 1970 1975 1980 1985 1990 1995 2000 2005 2010Here is an example of what can be done using Helsinki back to 1844. [using apreliminarily corrected aa-index]
Physical Meaning of IHV (<strong>and</strong> am, aa, ap)Geomagnetic activity as given by thethree-hour am-index has been found[Svalgaard 1978] to depend on solar windparameters <strong>and</strong> the geometry of theirinteraction with the Earth as this:[Momentum, Reconnection, Modulations]am = k (nV 2 ) 1/3 (BV) q(α, f) S(Ψ)B = Interplanetary Magnetic Field strengthV = Solar Wind Speedq = function of angle α between IMF <strong>and</strong>Earth’s magnetic fieldf = variability =√(σBx 2 + σBy 2 + σBz 2 )/σBHere we show how very good the fit is forindividual three-hour intervals [red curves= calculated; note the log-scale]. Only forvery small values of am [
For intervals longer than three hours the variables are weakly correlated <strong>and</strong> the relationbecomes slightly modified to am ~ BV 2 . We would therefore expect a similar relationshipfor IHV. This is indeed what is observed:4003002BV oRotation MeansVo = V/100 km/sB <strong>and</strong> IHV in nT20010002BV o = 4.34 (IHV - 6.5)R 2 = 0.760 20 40 IHV 60 80 100All data 1963-200527-day Bartels rotation means400BVo 2 obs300BVo 2 calc20010001980 1981 1982 1983 1984 1985 1986 1987 1988 1989 1990 1991 1992And here is a sample of how well the calculated values match the observed. IHV is thus agood proxy for BV 2 . It is somewhat remarkable that am [conceived long ago] also is.
Power Input to the IonosphereDuring geomagnetic activity, magnetospheric particles are accelerated <strong>and</strong> precipitateinto the upper atmosphere over the polar regions where the energy thus deposited can bedirectly measured by polar-orbiting satellites (POES). From the satellite data, the totalenergy input (in Gigawatt) to each hemisphere can be estimated. Such estimates existback to 1978:7027-Day Averages of Calibrated Hp60504030201001980 2000 2020 2040 2060 2080 2100 2120 2140 2160 2180 2200 2220 2240 2260 2280 2300 2320 2340 2360 2380 2400Different colors denote the different satellites used. The abscissa is Bartels rotationnumbers from the year 1978 to the present. There is some ongoing discussion about thecorrect calibration of Hp. The above is my own.
IHV is directly proportional to the powerinput (Hp) to the upper atmosphere:605040Relation between Hp <strong>and</strong> IHVHpHp = 0.6029 IHVR 2 = 0.8859302010IHV00 20 40 60 80 1007060504027-Day Averages of (Scaled) am, Hp, <strong>and</strong> IHVamHpIHV302010Year01978 1980 1982 1984 1986 1988 1990 1992 1994 1996 1998 2000 2002 2004 2006 2008
Correcting IHV from Hourly Values to the Level of Hourly Means807060504030201001996.0 1997.0 1998.0 1999.0 2000.0 2001.0 2002.0 2003.06050403020100IHVNGK 01NGK 60IHV 60NGK 60 = 0.7065 NGK 01R 2 = 0.8052IHV 010 10 20 30 40 50 60 70 80The thin red curve is the blue [IHV from oneminutevalues] multiplied by the slope of thecorrelation plot. The thick red curve is IHVfrom the published hourly means.Starting in 1905 Adolf Schmidtbegan to use Hourly Meansinstead of the Hourly pointvaluesbeenthat had traditionallyreported in yearbooks.And soon most observatoriesadopted the new practice.[Some waited long, e.g. theFrench who held out to 1972,before making the switch]. Theinstantaneous values read onceevery hour have larger variancewhich results in larger IHV.This is easily corrected for, e.g.by calculating IHV from hourlymeans [from the 60 one-minutevalues] <strong>and</strong> from hourly pointvalues <strong>and</strong> comparing the twoIHVs. All early observatorydata must be so corrected.
The IDV-Index, a Modern Version of Bartels’ u-measureThe IHV-index captures activity on a time scale of hours. How about on a time scale ofdays? Julius Bartels defined his u-measure as the monthly (or yearly) mean of theunsigned differences between the mean values of the H-component on two successivedays. We found that you get essentially the same result using the mean over the wholeday, a few hours, or only one hour. Our InterDiurnal Variability index (IDV) is thensimply the average u-measure (in nT, not the original 10 nT units) using only one hour(preferably the midnight hour if available) for as many stations as possible below 51°corr. geomagnetic latitude:18161412108642010u Yearly averagesIDV (H)1870 1880 1890 1900 1910 1920 1930 1940 1950 1960 1970 1980 1990 2000Note that u <strong>and</strong> IDV did not register the strong high-speed streams in 1910, 1930, 1952,1974, 1994, <strong>and</strong> 2003. This (especially 1930) was a deadly blow to the u-measure.
109876543210BnTWhat is the IDV-index Measuring? IMF Strength !IMF B <strong>and</strong> Solar Wind Speed V as a Function of IDVB = 0.44 IDV + 2.15R 2 = 0.8832V = 1.46 IDV + 431R 2 = 0.0096Vkm/s120010008006004002002015105nTIDVBIDV Independent of Solar Wind SpeedV600500400300200100(yearly averages)0 5 10 15 20IDV IndexnT0001960 1970 1980 1990 2000 2010109876543210B obsB calc from IDVB obs medianObserved <strong>and</strong> Calculated IMF B100% =>B std.devCoverage01960 1965 1970 1975 1980 1985 1990 1995 2000 2005 201010987654321IDV does not ‘see’ the highspeedsolar wind. But thereis a robust correlation withthe IMF magnitude, B.So instead of the u-measurebeing a failure, its modernequivalent [IDV] has a veryuseful property: response toB only.
IDV measures the same as the Negative part of Dst IndexCoronal Mass Ejections (CMEs) add (closed) magnetic flux to the IMF. CMEs hitting theEarth create magnetic storms feeding energy into the inner magnetosphere (“ringcurrent”). The Dst-index is aimed at describing this same phenomenon, but only thenegative contribution to Dst on the nightside is effectively involved. We therefore expect(negative) Dst <strong>and</strong> IDV to be strongly related, <strong>and</strong> they are:IHV = -0.40 Dst(
Here are both time series (IDV <strong>and</strong> IDV calculated from Dst (< 0)):181614121086420IDV1909IDV calc. from Dst(
Can we go further back in time? Bartels had determined the u-measure from 1836 on, butwith less confidence before 1872. Here is what we get if we infer IDV (<strong>and</strong> then B) fromu back to 1836:109876543210B nTInferred IMF B since 1836From Bartels u-measure From sqrt(Rz)From IDVIMF B obs S/C1830 1840 1850 1860 1870 1880 1890 1900 1910 1920 1930 1940 1950 1960 1970 1980 1990 2000Year121086420B nTIMF B inferred from IDVB = 0.445 IDV + 2.21R 2 = 0.891870 1890 1910 1930 1950 1970 1990 2010YearThe smooth curve is a 4 th -order polynomial fit. Onecan also just fit the values at solar minima (toeliminate most solar activity) with essentially the sameresult. We may be approaching another minimum inthe Gleissberg cycle. The IMF B for 2008 (so far) isthe lowest in the last 107 years.
Polar Cap Current <strong>and</strong> Polar Cap PotentialAcross the Earth’s polar capsflows a current in theionosphere. This is a Hallcurrent basically flowingtowards the sun. The Earthrotates under this currentcausing the magnetic effect ofthe current to rotate once in 24hours. This rotating dailyeffect is readily (<strong>and</strong> has beensince 1883) observed at polarcap magnetic observatories.Ritter et al. 2001The current derives from the Polar Cap Electric Potential which is basically the electricfield (E = VxB) in the solar wind mapped down to the ionosphere.
Vector Variation of Horizontal Components 1980-200410080BLCALE6040200-100 -80 -60 -40 -20 0 20 40 60 80CBB-20RES-40-60THL-801882-1883The radius of the circle traced out byvariation of horizontal componentsisa measure of the polar cappotential. For stations near the polarcap boundary the circle is onlypartial.
500040003000200010000VB (km/s * nT)VB = 50.597 THLR 2 = 0.88561965-2004Amplitude (nT)VB = 50.146 RESR 2 = 0.85940 20 40 60 80 100Here we show for each year of1965-2004 how the average radiusdepends on the product of B <strong>and</strong> Vfor Thule (THL) <strong>and</strong> Resolute Bay(RES). The radius of the circularvariation is the same for all stationsin the cap.We can then estimate BV:50004000VB (km/s * nT)3000200010000Observed S/CRES (Resolute Bay)THL (Thule)1965 1970 1975 1980 1985 1990 1995 2000 2005We now have three independent ways of estimating solar wind <strong>and</strong> IMF parameters:
An Over-determined System:1. The IHV-index, estimating BV 22. The IDV-index, estimating B3. Polar Cap Potential index, estimating BVThese indices are readily computed from simple hourly means (or values) for which wehave measurements stretching back well into the 19 th century. We can thus estimate V =√[(BV 2 ) / B] <strong>and</strong> use that value to calculate BV for comparison with the estimated BV.1098 B from IDV765432 V o from IHV Observed in situ101890 1900 1910 1920 1930 1940 1950 1960 1970 1980 1990 20005040BV o calc. from IDV <strong>and</strong> IHV302010BV o calc. from Polar CapBV o observed01890 1900 1910 1920 1930 1940 1950 1960 1970 1980 1990 2000
We can even do the analysis for a time scale of solar rotations:14IMF B Inferred from IDV-Index (Rotation Avg.)nT12B = 1.67 IDV 0.6B obs108642Floor01880 1890 1900 1910 1920 1930 1940 1950 1960 1970 1980 1990 2000Solar Wind Speed Inferred from IHV <strong>and</strong> IDV7V6 o 100 km/s5432V o = 1.6 [(IHV - 5) / IDV 0.6 ] 1/2V o obs101880 1890 1900 1910 1920 1930 1940 1950 1960 1970 1980 1990 2000Note the ‘floor’ under which IMF B does not seem to fall.
Using the Dayside Data86420-2-4-6-8-10dD' 1957-19591964-1965Diurnal Variation of Declination at Praha (Pruhonice)Jan Feb Mar Apr May Jun Jul Aug Sep Oct Nov Dec Year910Diurnal Variation of Declination at Praha86 dD' 1840-18494rD20-2-4-6-8-10Jan Feb Mar Apr May Jun Jul Aug Sep Oct Nov Dec YearThe Declination can be converted to the East component using Y = H sin (D).
Using several stations we can construct a composite series of the amplitude, rY, of thedaily variation of Y:60rY (nT)Global Daily Range of Variation of East component for each Year Since 18415040302010ObservedCorrected for TrendTrend = 0.0245 nT/yearR 2 = 0.7901840 1850 1860 1870 1880 1890 1900 1910 1920 1930 1940 1950 1960 1970 1980 1990 2000Year250200150100500F10.7y = 5.9511x - 127.74R 2 = 0.97261947-20050 10 20 30 40 50 60 70rYIt is well-known that the strength of theSR current system is a sensitive functionof the conductivity of the ionospherewhich in turn can be well-described bythe 10.7 cm solar radio flux. So, we cantranslate rY directly into an equivalentf10.7 flux:
25020015010050F10.7 obs.F10.7 calc from rY1940 1945 1950 1955 1960 1965 1970 1975 1980 1985 1990 1995 2000 2005 2010200150100R calcRz,iRg5018192021222301940 1945 1950 1955 1960 1965 1970 1975 1980 1985 1990 1995 2000 2005 2010200150100R calcRzRg5013 14151617181901890 1895 1900 1905 1910 1915 1920 1925 1930 1935 1940 1945 1950 1955 1960200150100R calcRzRg509101112131401840 1845 1850 1855 1860 1865 1870 1875 1880 1885 1890 1895 1900 1905 1910Because the f10.7radio flux depends onthe sunspot numberwe can turn thecalculated f10.7 fluxinto an equivalentsunspot number <strong>and</strong>discover that there areindications that thecalibration of eventhe venerable sunspotnumber before ~1947is questionable.This is ongoing work<strong>and</strong> the conclusionsare still preliminary.0
Conclusions1: The hourly values in yearbooks are an extremely valuable data sourcethat allows us to calibrate our long-term geomagnetic <strong>and</strong> solar indices asfar back as the geomagnetic record reaches.2: By combinations of newly derived geomagnetic indices we can infer thephysical properties of the solar wind in the past.3: Every effort should be expended to preserve <strong>and</strong> digitize the treasuretrove of 19 th century hourly data.
![When the Heliospheric Current Sheet [Figure 1] - Leif and Vera ...](https://img.yumpu.com/51383897/1/190x245/when-the-heliospheric-current-sheet-figure-1-leif-and-vera-.jpg?quality=85)


![The sum of two COSine waves is equal to [twice] the product of two ...](https://img.yumpu.com/32653111/1/190x245/the-sum-of-two-cosine-waves-is-equal-to-twice-the-product-of-two-.jpg?quality=85)