IIHS Status Report newsletter, Vol. 47, No. 9, November 20, 2012
IIHS Status Report newsletter, Vol. 47, No. 9, November 20, 2012
IIHS Status Report newsletter, Vol. 47, No. 9, November 20, 2012
- No tags were found...

You also want an ePaper? Increase the reach of your titles
YUMPU automatically turns print PDFs into web optimized ePapers that Google loves.
<strong>Status</strong> <strong>Report</strong>Insurance Institute for Highway Safety | Highway Loss Data InstituteChangingmixDespite worries, aging populationwon’t push up nation’s crash rateAlso Inthis issue<strong>Vol</strong>. <strong>47</strong>, <strong>No</strong>. 9<strong>No</strong>vember <strong>20</strong>, <strong>20</strong>124Research suggests guidelines forcredible camera enforcement4Intelligent speed adaptationdevices can reduce speeding4Deer crashes jump in <strong>No</strong>vember
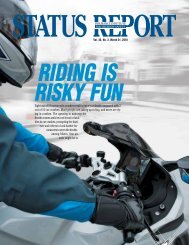
It’s known as the “silver tsunami,” but don’t expect the coming waveof older Americans to cause a calamity on the nation’s roads.The Highway Loss Data Institute (HLDI) recently took a lookat the country’s changing demographics to see how insurance claimrates might be affected. Despite the fact that drivers in their 70sand 80s have higher claim rates than those in their 50s and 60s, theanalysis shows that the growth of the older population won’t causean increase in collision claim rates overall. That is in part because,even with a large increase, the number of older drivers is predictedto remain relatively small. In addition, the increase in the proportionof older drivers will be accompanied by a decrease in the proportionof drivers under 30, who have the highest claim rates of all.“Age-related impairments can affect a person’s driving, so concernover the country’s changing demographic makeup is understandable,”says HLDI Vice President Matt Moore. “However, whenwe look at the overall number of claims, this isn’t the looming crisissome have made it out to be.”Crashes in which elderly drivers apparently lose control of theirvehicles grab headlines from time to time. In one recent example,a 100-year-old man in Los Angeles backed into a crowd outside aschool in August, injuring 11 children and three adults. Such incidentscreate an impression of older drivers as a menace, but contraryto expectations, older drivers aren’t causing more crashesthan they used to (see <strong>Status</strong> <strong>Report</strong>, June 19, <strong>20</strong>10, at iihs.org).Per mile traveled, rates of fatal crashes and all police-reportedcrashes begin rising around age 70. However, in recent years olderdrivers’ crash rates have fallen faster than the crash rates of middleagedrivers. The rate of fatal crashes perlicensed driver 70 and older fellabout 37 percent from 1997to <strong>20</strong>08, a <strong>20</strong>10 study by the Insurance Institute for Highway Safety(<strong>IIHS</strong>) showed. The reasons aren’t well understood, but there is evidencethat older drivers tend to limit the amount they drive, particularlyat night or in other situations they find challenging.For the latest analysis, HLDI looked at claim rates by age groupunder collision insurance, which covers damage to an at-fault driver’svehicle caused by a crash. Claim frequency is the number of claimsrelative to the number of insured vehicle years. An insured vehicleyear is one vehicle insured for one year, two for six months each, etc.Analysts calculated the relationship between the population ineach age group and the number of rated drivers of that age in HLDI’sdatabase. (A rated driver is the person assigned to a vehicle for insurancepurposes, usually the one most likely to be driving the vehicle.)That allowed them to estimate how the population of insured driverswill change, given the predicted shifts in the nation’s overall demographicmakeup. They then combined the information on claim ratesby age with the predicted changes in the insured driver population toestimate what the overall claim frequency would look like in 30 years.HLDI’s database includes vehicles from the 10 most current modelyears insured by companies that supply data to HLDI. Nearly half ofall registered vehicles are from the past 10 model years, according toR.L. Polk & Co. Insurers that provide data to HLDI make up morethan 80 percent of the market for private passenger automobile insurance.It is possible that crash rates and the effect of demographicchanges on them will be different for the wider population that includesdrivers of older vehicles or vehicles without collision insurance.Owners of those vehicles may drive differently from the people in thestudy, and some types of drivers, including olderones, may be more likely to have older vehicles.The U.S. driving-age population (15 andolder) is expected to increase byAge-related impairments can affect driving, so concernunderstandable. But looking at the overall number of cla2 |<strong>Status</strong> <strong>Report</strong> — <strong>Vol</strong>. <strong>47</strong>, <strong>No</strong>. 9
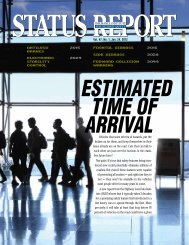
nearly one-fifth from <strong>20</strong>10 to <strong>20</strong>30, when it is predictedto reach 291 million. As it grows, its makeup will change.Specifically, as the baby boom generation ages, the populationis skewing older. Each five-year age group from 15 to64 will make up a smaller portion of the total driving-agepopulation in <strong>20</strong>30 than in <strong>20</strong>10. In contrast, the 65-69,70-74, 75-79, 80-84 and 85-plus age groups are all expectedto account for larger percentages.<strong>No</strong>t everyone who can legally drive chooses to get a licenseor own a car, and age is a factor in that. The ratio of rateddrivers in HLDI’s database to population, referred to as theinsured driver rate, starts out low and peaks at 60-64, with aratio of more than 0.4. By 85 plus, it has declined to 0.15.The frequency of collision claims in HLDI’s database ishighest for drivers ages 15-19, at nearly 70 percent aboveaverage. Frequency steadily declines with age, reaching itslowest level in the 60-64 group, so that the people mostlikely to be rated drivers are least likely to file collisionclaims. Frequency then begins to climb again but neverapproaches the level of teenagers.Assuming the insured driver rate and claim frequencyin each age group remain the same, the changing demographicmakeup will have virtually no effect on the overallcollision claim frequency during the next two decades, theanalysis shows. Claim frequency will hover between 6.12claims per 100 insured vehicle years and 6.16 — essentiallyflat. In absolute numbers, there still may be morecrashes in the future, but that is becausemore people will be driving, not becausemore of the drivers are older.<strong>20</strong>%15%10%5%0%15-19<strong>20</strong>-2425-2930-3940-4950-5960-6465-6970-7<strong>47</strong>5-7980-841801601401<strong>20</strong>100806040<strong>20</strong>0Age group proportions in U.S. driving agepopulation, <strong>20</strong>10 and <strong>20</strong>30Relative claim frequencies by rated driver age,calendar year <strong>20</strong>10, model years <strong>20</strong>02-11<strong>20</strong>10<strong>20</strong>3085+15-19<strong>20</strong>-2425-2930-3940-4950-5960-6465-6970-7<strong>47</strong>5-7980-8485+876543210<strong>20</strong>10<strong>20</strong>15<strong>20</strong><strong>20</strong><strong>20</strong>25<strong>20</strong>30100=6.16 claims per 100 insured vehicle yearsabout the changing U.S. demographic makeup isims, this isn’t the looming crisis some make it out to be.<strong>No</strong>vember <strong>20</strong>, <strong>20</strong>12 |3
The study looks only at collision claims, the majorityof which are for low-severity crashes. It doesn’toffer any predictions about serious crashes or fatalities.Older drivers have higher rates of fatal crashesin large part because their fragility makes them morelikely than other drivers to die when a crash occurs.It is possible that the coming demographic changescould result in a higher overall rate of fatal crashes.On the other hand, improvements in the health ofolder drivers might make them less likely to be killedin crashes than they are now. Previous research by<strong>IIHS</strong> found that older drivers are not only less likelyto be involved in crashes than they used to be, theyPredicted collision claim frequencieswith changing age distribution, <strong>20</strong>10 to <strong>20</strong>30876543210<strong>20</strong>10 <strong>20</strong>15 <strong>20</strong><strong>20</strong> <strong>20</strong>25 <strong>20</strong>30are less likely to be killed or seriously injured whenthey do crash (see <strong>Status</strong> <strong>Report</strong>, June 19, <strong>20</strong>10).HLDI analysts considered what would happen tocollision claims if more older people continue drivingas a result of improved health and mobility. Increasingthe insured driver rate <strong>20</strong> percent for people65 and older didn’t change overall claim frequency.Even under an extreme scenario in which the 75 andolder group has an insured driver rate of 99 percent,claim frequency combined across all ages would increaseonly 2 percent to 6.29. Meanwhile, a <strong>20</strong> percentincrease in claim frequency for drivers 75 andolder also would result in only a tiny increase inoverall claim frequency.Current trends in HLDI data have the overallclaim rate decreasing. If this trend is factored intothe calculations looking at age distribution, claim frequencyactually will be lower in <strong>20</strong>30 than in <strong>20</strong>10.“On an individual level, aging drivers presentchallenges for their families and state licensing officials,but overall they aren’t really changing the highwaysafety landscape,” says Adrian Lund, presidentof HLDI and <strong>IIHS</strong>. “Society needs to consider howto deal with age-related impairments among drivers,but major reductions in crash and injury risk willcome from road and vehicle engineering improvementsthat can bring increased safety for everyone,young and old.” nResearch suggestsguidelines for crediblecameraenforcementAutomated enforcement can improve safety by cutting down on red light runningand speeding, but controversy surrounding the technology has hinderedsome programs. A new report provides guidance on how to set up andoperate camera programs to make them both effective and less likely to come infor criticism. A separate review of Australian camera programs highlights the needfor good communication to maintain community support.The guidelines were published by the National Cooperative Highway ResearchProgram (NCHRP), which is funded by state departments of transportation andadministered by the Transportation Research Board. The authors surveyed communitieswith camera programs and studied several programs in-depth to developtheir recommendations.Among the key points:4The purpose of cameras is to improve safety, so they should be installed at locationswhere a red light running or speeding problem has been identified. Assafety programs, they should be run by police.4Money from citations should be used to pay for the cameras, and any excessshould go to other highway safety programs. “This should be communicatedto the public so automated enforcement is not seen as a tax feeding the generalcoffers,” the authors note.4Before a program is launched, there should be a public information campaignto explain the dangers of red light running and how the camera program willwork. For the first 30 days of the cameras’ operation, only warnings shouldbe issued.4The camera vendor should be paid based on equipment and services providedand not based solely on the number of citations issued. A flat fee is “themost acceptable arrangement from the public’s perspective,” the report states.“Automated enforcement is an effective safety tool that saves lives and can befunded by the fines violators pay. Following common-sense guidelines can help4 |<strong>Status</strong> <strong>Report</strong> — <strong>Vol</strong>. <strong>47</strong>, <strong>No</strong>. 9
keep these programs from falling victim to politics,” says Anne Mc-Cartt, senior vice president for research at the Insurance Institutefor Highway Safety.“Police and transportation officials may believe their communityhas a safety problem that cameras can help solve, but they have tohelp the public understand that, too. That’s why it’s important to laythe groundwork and make sure these programs are transparent.”Red light cameras have broad support in many cities where driversare familiar with them. A <strong>20</strong>11 Institute survey found that twothirdsof drivers in 14 big cities with longstanding camera programssupport their use (see <strong>Status</strong> <strong>Report</strong>, July 19, <strong>20</strong>11, iihs.org). Nevertheless,opponents of automated enforcement in a few jurisdictionshave succeeded in banning the devices through ballot initiatives.For red light cameras, the NCHRP report emphasizes the importanceof a thorough engineering study of each intersection tomake sure the red light running problem is not the result of poorsignal timing or visibility. Signals must have an adequate yellowtime and, if allowed under state law, an all-red phase. Camera opponentsoften make accusations about inadequate or even manipulatedsignal timing, insinuating that drivers are being tricked intorunning red lights so that more tickets can be issued.The report also touches on red light running grace periods andspeed tolerances. For red light cameras, the authors recommend agrace period of at least 0.1 second, meaning citations aren’t issued ifthe violation occurs within that period after the light has changed.Speed tolerances — typically from 4 to 11 mph over the postedlimit — should be the same for traditional and automated enforcement,the report recommends. Grace periods and speed tolerancesAutomated enforcement shouldn’t replacetraditional police enforcement, and programsshould be evaluated regularly for their impacton crashes, the TRB report recommends.should be publicized so that the programs are seen as fair, the authorsrecommend.Finally, the report emphasizes that automated enforcementshouldn’t take the place of traditional police enforcement, and programsshould be evaluated regularly for their impact on crashes.Meanwhile, the Australian paper, written by researchers fromQueensland University of Technology, is based on <strong>20</strong>11 audits ofspeed camera programs in New South Wales and Victoria. The reviewswere prompted by a perceived lack of community confidence.Both reviews were positive, finding that the programs had safetybenefits and that officials were choosing camera locations appropriatelyand not to maximize revenue. Those findings should be used totout the advantages of automated enforcement, the authors note. Oneof the few problems highlighted in the audits was a need to dispelmisconceptions about speeding and speed enforcement in Victoria.“Automated enforcement for speeding and red light running” byK.A. Eccles et al., is available at trb.org. “Automated speed enforcementin Australia: recent examples of the influence of public opinionon program sustainability” by J.J. Fleiter and B. Watson appearsin the August <strong>20</strong>12 issue of the Journal of the Australasian Collegeof Road Safety. n<strong>No</strong>vember <strong>20</strong>, <strong>20</strong>12 |5
Speed-alert devicesplus incentivescan curb speedingAs crash avoidance features make their way into mainstreamvehicles, one advanced technology to help drivers avoidspeeding-related crashes is still on the sidelines. It’s calledintelligent speed adaptation (ISA), and research indicates that itcould help drivers keep their speeds in check.ISA systems use GPS to link a vehicle’s position to digital mapsthat include speed limits to determine if a vehicle is exceeding themby a preset amount, which drivers can specify in some cases. Somenewer systems use cameras to read speed limit signs. What happensnext depends on the ISA. The most common scenario involves anTo promote the technology, the European New Car AssessmentProgramme (Euro NCAP) counts ISA systems as one of the safetyfeatures automakers can use to qualify vehicles for Euro NCAP Advanced.Models that have earned the designation so far haven’t beenfitted with an ISA (go to www.euroncap.com/rewards.aspx). In theUnited States, the National Highway Traffic Safety Administration(NHTSA) doesn’t include the technology among the crash avoidancefeatures it recommends in the New Car Assessment Program.Although ISA systems haven’t been deployed on a large scale onprivate vehicles in the United States or Europe, the devices havebeen studied for more than <strong>20</strong> years. Several studies, including tworecently published ones, point to potential benefits.Warnings and financial incentivesIn field studies, advisory ISA systems are sometimescoupled with economic incentives to notspeed. Researchers who conducted the first naturalisticdriving study of ISAs in the U.S. concluded thatdrivers who received modest cash incentives for notaudible or visual alert telling the driver to slow down. Some ISA systemsgive a haptic alert via the accelerator that makes it increasinglyharder for the driver to depress the pedal. Intervention systems canreduce engine throttle to automatically decelerate a vehicle.ISA differs from the more familiar speed limiters on commercialvehicles and buses. Speed limiters, or governors, prevent a vehiclefrom traveling faster than a predetermined maximum speed. Withan ISA, drivers can specify the warning threshold depending on aroad’s speed limit and can switch off the devices.speeding were more likely to abide by posted limits than drivers ofvehicles with ISAs limited to providing speed alerts.The study by researchers at NHTSA, Old Dominion University andWestern Michigan University involved 50 drivers ages 24-39 with atleast five years of driving experience. Participants drove study-providedvehicles fitted with an ISA for four weeks. Forty drivers receivedspeed alerts. A subset of these were paid as much as $25 todrive within 4 mph of the speed limit in weeks 2-3. They lost moneyif they sped. A control group of 10 drivers didn’t get alerts or cash.6 |<strong>Status</strong> <strong>Report</strong> — <strong>Vol</strong>. <strong>47</strong>, <strong>No</strong>. 9
Drivers in the incentive group reduced the percentageof time they drove 9 mph or more over thelimit to less than 1 percent, compared with about 5percent in the baseline period. Drivers in the controland warning-only groups traveled 9 mph or moreover the speed limit as much as 9 percent of the time.“The findings have implications for the use of intelligentspeed adaptation systems in conjunctionwith insurance premiums to significantly improvetraffic safety,” the authors conclude. They note that alimitation of the study was its short duration.In Denmark, researchers from Aalborg Universityand Copenhagen University evaluated an ISA combiningspeed advisories with insurance discounts andfound that linking an ISA to incentives can reducespeeding. The greatest reductions were on roads with80 kph (50 mph) limits. The calculated proportionof distance above the speed limit dropped from 13percent in the baseline period to just below 4 percentin the study period. When drivers turned off thesystem, speeding relapsed to the baseline level. The<strong>20</strong>07-09 field trial included 153 drivers ages 18-81who drove their own vehicles fitted with an ISA.Technologies to reduce speedingOther technologies can help drivers stay withinspeed limits. Some GPS navigation systems andcellphone applications can provide real-time speedalerts. Roadside electronic signs that display vehiclespeeds serve a similar function and have beenshown to reduce speeding. Drivers also can use a vehicle’scruise control settings to avoid speeding.Although not marketed as ISA systems, a few aftermarketin-vehicle monitoring devices that useGPS data to provide speed alerts are available in theU.S. Most are used by commercial fleets. Tiwi is onesystem available to consumers. The device providesverbal feedback to drivers who speed, don’t buckle upor drive aggressively.A <strong>20</strong>09 Institute study found that equipping thecars teens drive with monitoring devices that providereal-time feedback can reduce their risks behind thewheel (see <strong>Status</strong> <strong>Report</strong>, May 7, <strong>20</strong>09, at iihs.org).A number of U.S. insurers offer policyholders discountsfor using various types of monitoring devices.Specifics differ in terms of what kinds of data getcollected and whether a vehicle’s location is tracked.“The effects of external motivation and real-timeautomated feedback on speeding behavior in a naturalisticsetting” by I.J. Reagan et al. appears in theMay 31, <strong>20</strong>12, online issue of Human Factors: TheJournal of the Human Factors and Ergonomics Society.“Pay as you speed, ISA with incentives for not speeding:results and interpretation of speed data” by H.Lahrmann et al. is in the September <strong>20</strong>12 issue of AccidentAnalysis and Prevention. nRisk of collisions with deeris highest during <strong>No</strong>vemberFor drivers on their way to Thanksgiving dinner or just making the daily commute,deer on the move are a common highway hazard this time of year. Vehicledamage from hitting an animal is more than 3 ½ times as common in <strong>No</strong>vemberas in August, a report from the Highway Loss Data Institute (HLDI) shows.Insurance claims for damage from collisions with animals rise sharply each fall.The high claim period coincides with deer mating season when bucks are likely tobe roaming. Claims are most common in West Virginia, Iowa, Pennsylvania andKentucky, HLDI found.Damage to a vehicle caused by striking an animal is covered under comprehensiveinsurance. Of the 33 companies that provide HLDI with data on comprehensivecoverage and claims, 18 provide information specifying whether the claimwas for an animal strike or something else. Only data from those 18 insurers wereincluded in the analysis. <strong>No</strong> data were available for Massachusetts.National comprehensive claim frequenciesfor animal strikes, January <strong>20</strong>06 to December <strong>20</strong>111512963JanFebMarAprMayJunJulFrom <strong>20</strong>06 to <strong>20</strong>11, there were an average of 6.5 animal strike claims per 1,000insured vehicle years. An insured vehicle year is one vehicle insured for one year,two for six months each, etc. Each year there was a consistent pattern, with claimfrequency rising dramatically in October, peaking in <strong>No</strong>vember and dropping offin December and January. Averaged over the six-year period, monthly frequenciesranged from 3.9 in August to 14.1 in <strong>No</strong>vember.Of all the states, West Virginia had by far the highest frequency of animal strikeclaims, reaching a <strong>No</strong>vember average of 51.2 claims per 1,000 insured vehicle years.It was followed by Iowa at 30.6, Pennsylvania at 28.9 and Kentucky at 26.4. nAugSepOct<strong>No</strong>vDec<strong>No</strong>vember <strong>20</strong>, <strong>20</strong>12 |7
<strong>Status</strong> <strong>Report</strong>Older drivers won't push up crashes42Automated enforcement guidelines44ISA systems can reduce speeding46Deer strike crashes rise in <strong>No</strong>vember<strong>47</strong>The Insurance Institute for Highway Safety is an independent, nonprofit scientific and educational organization dedicatedto reducing the losses — deaths, injuries and property damage — from crashes on the nation’s roads.The Highway Loss Data Institute shares and supports this mission through scientific studies of insurance data representingthe human and economic losses resulting from the ownership and operation of different types of vehicles and by publishinginsurance loss results by vehicle make and model.Both organizations are wholly supported by the following auto insurers and funding associations:<strong>Vol</strong>. <strong>47</strong>, <strong>No</strong>. 9<strong>No</strong>vember <strong>20</strong>, <strong>20</strong>121005 N. Glebe RoadArlington, VA 22<strong>20</strong>1 USAt 703/2<strong>47</strong>-1500f 703/2<strong>47</strong>-1588Inquiries/print subscriptions:<strong>Status</strong><strong>Report</strong>@iihs.orgCopy may be republished withattribution. Images requirepermission to use.Editor: Kim StewartWriter: Sarah KarushArt Director: Steve Ewenswww.iihs.orgiihs.org/rssyoutube.com/iihs@<strong>IIHS</strong>_autosafetym.iihs.orgThis publication is printed on recycled paper.Member groupsAcceptance InsuranceACE Private Risk ServicesAffirmative InsuranceAgency Insurance Company of MarylandAlfa Alliance Insurance CorporationAlfa InsuranceAllstate Insurance GroupAmerican Family Mutual InsuranceAmerican National Family of CompaniesAmeriprise Auto & HomeAmica Mutual Insurance CompanyARI Insurance CompaniesAuto Club EnterprisesAuto Club GroupBankers Insurance GroupBituminous Insurance CompaniesCalifornia Casualty GroupCalifornia State Auto GroupCapital Insurance GroupChubb & SonColorado Farm Bureau Mutual Insurance CompanyCommonwealth Mutual Insurance Company of AmericaConcord Group Insurance CompaniesCotton States InsuranceCOUNTRY FinancialDallas National Insurance CompanyDirect General CorporationDiscovery Insurance CompanyDriver’s Insurance GroupErie Insurance GroupEsuranceFarm Bureau Financial ServicesFarm Bureau Insurance of MichiganFarm Bureau Mutual Insurance Company of IdahoFarmers Insurance Group of CompaniesFarmers Mutual Hail Insurance Company of IowaFarmers Mutual of NebraskaFireman’s Fund Insurance CompanyFlorida Farm Bureau Insurance CompaniesFrankenmuth InsuranceGainsco InsuranceGEICO GroupGeorgia Farm Bureau Mutual Insurance CompanyGMAC Personal Lines InsuranceGoodville Mutual Casualty CompanyGrange InsuranceHallmark Insurance CompanyHanover Insurance GroupThe HartfordHaulers Insurance Company, Inc.Homeowners of America Insurance CompanyHorace Mann Insurance CompaniesICW GroupImperial Fire & Casualty Insurance CompanyIndiana Farmers Mutual Insurance CompanyInfinity Property & CasualtyKemper PreferredKentucky Farm Bureau InsuranceLiberty Mutual Insurance CompanyLouisiana Farm Bureau Mutual Insurance CompanyMaryland Automobile Insurance FundMercury Insurance GroupMetLife Auto & HomeMiddleOakMississippi Farm Bureau Casualty Insurance CompanyMMG InsuranceMutual of Enumclaw Insurance CompanyNationwideNew Jersey Manufacturers Insurance GroupNLC Insurance Companies, Inc.<strong>No</strong>dak Mutual Insurance Company<strong>No</strong>rfolk & Dedham Group<strong>No</strong>rth Carolina Farm Bureau Mutual Insurance Company<strong>No</strong>rthern Neck Insurance CompanyOld American County Mutual Fire InsuranceOld American Indemnity CompanyOregon Mutual InsurancePekin InsurancePEMCO InsurancePlymouth Rock AssuranceProgressive CorporationThe Responsive Auto Insurance CompanyRockingham GroupSafeco InsuranceSamsung Fire & Marine Insurance CompanySECURA InsuranceSentry InsuranceShelter InsuranceSompo Japan Insurance Company of AmericaSouth Carolina Farm Bureau Mutual Insurance CompanySouthern Farm Bureau Casualty Insurance CompanyState Auto Insurance CompaniesState FarmTennessee Farmers Mutual Insurance CompanyTexas Farm Bureau Insurance CompaniesTower Group CompaniesThe Travelers CompaniesUnited EducatorsUSAAUtica National Insurance GroupVirginia Farm Bureau Mutual InsuranceWest Bend Mutual Insurance CompanyYoung America Insurance CompanyZurich <strong>No</strong>rth AmericaFunding associationsAmerican Insurance AssociationNational Association of Mutual Insurance CompaniesProperty Casualty Insurers Association of America