xPlore Performance Checklist - EMC Community Network
xPlore Performance Checklist - EMC Community Network
xPlore Performance Checklist - EMC Community Network
- No tags were found...

You also want an ePaper? Increase the reach of your titles
YUMPU automatically turns print PDFs into web optimized ePapers that Google loves.
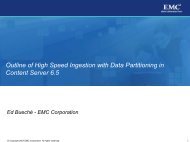
<strong>xPlore</strong> <strong>Performance</strong> <strong>Checklist</strong>Esmail FahimiEd BuechéJune 28, 2011Introduction _________________________________________________________________ 2General Assessment ___________________________________________________________ 2Operation Assessment _________________________________________________________ 2Log Inspection ________________________________________________________________ 3Common causes for query timeouts ______________________________________________ 3Query time out troubleshooting techniques ________________________________________ 4Inspect the logs for ‘exceptions’ _________________________________________________ 7Inspect auditRecords.xml _______________________________________________________ 9Use Search Admin Reports _____________________________________________________ 11System Logs ________________________________________________________________ 11<strong>xPlore</strong> Tuning _______________________________________________________________ 12What to collect ______________________________________________________________ 12Is the system sized correctly____________________________________________________ 12Hard to read queries ______________________________________________________________ 13Read the query plan _______________________________________________________________ 14Profile __________________________________________________________________________ 15Check the profile result ____________________________________________________________ 15Details __________________________________________________________________________ 16Test _______________________________________________________________________ 16Backup ____________________________________________________________________ 16Links ______________________________________________________________________ 161
IntroductionTroubleshooting performance issues are complex in nature, but a methodical approach can significantlyreduce the time to resolution.There are reference to many OS, third-party and open source tools in this checklist. I will not documentthose here since there is ample documentation for those elsewhere. The intention of this checklist is tokeep it easy to read.For <strong>xPlore</strong>, following below guidelines can lead to faster diagnosis, however many exchanges may still berequired to get to resolve a problem.General AssessmentSometimes a perceived benign change can lead to hours or days of investigation just to circle back tothat supposedly benign change.Assess if any of the following has been done:1) Any patches has been applied to the OS2) Any patches has been applied to xPLore3) Any new hardware added4) Any new software installed (competing resources)5) Any piece of hardware malfunctioningOperation AssessmentIdentify when/how the problem shows up:1) after lunch (sudden burst of requests)2) end of months processing3) end of quarter processing4) after added more users to the system5) after added more load to the system6) after a system reboot (caches are not filled)2
Log InspectionThere is almost always something in the log files when there is a functional issue, but for performance,that is not always the case. However if the log level is set to INFO, it could help to see if there is usagepattern that leads to the performance issue.By default, <strong>xPlore</strong> log files contain errors and warnings. The log files are kept underXPLORE_ROOT/jboss4.3.0/server/DctmServer_PrimaryDsearch/logs path.XPLORE_ROOT is where you install <strong>xPlore</strong>. I used slashes (/) for path as separators for clarity. If you areusing Windows, change them with backslashes (\).Common causes for query timeoutsTimeouts can occur under several conditions such as:System is un-warmedThe I/O subsystem has insufficient capacityThe system is large and the clean-merge activity is overwhelming the I/O subsystemQuery is wildcard causing lots of matchesQuery is not boundedQuery performs a sortThe timed out queries are logged in dsearch.log. To find out do:Linux: grep –i “timed out” *.logWindows: findstr /i “timed out” dsearch.log*3
Query time out troubleshooting techniquesIf a query has timed out, find out why.Do the queries timeout on the first try and then do they run fast on the second try?o If so, then the warmup utility will help much. Seehttps://community.emc.com/docs/DOC-8922o Using the Admin reports (Top N slowest query report) such a scenario might look asfollows:The first query, in the above example, took over 11+ secs to run, while the second (took 2+secs).Do even simple queries timeout periodically and then at other times run very fast? (nodiscernable pattern?)o If yes, then the too frequent clean merge activity is likely. Obtaining disk I/O statistics isrecommended:• Enable query auditing in <strong>xPlore</strong>• On linux run sar for a day:nohup sar –d 10 8000 > d.sar.txt 2>&1 &nohup sar –u 10 8000 > u.sar.txt 2>&1 &• On Windows enable perfmon logging with CPU and disk stats Collect this data on 10 sec intervals for a 24 hour period Csv format• Look for large prolonged I/O spikes to identify this.• Look for queries that were delayed during the long io spike (from audit orreports based on audit)o Customer should tune these parameters to be longer and also setup the blackoutperiod.• See pages 24 - 26 on pdf that can be found at:https://community.emc.com/people/Ed_Bueche/blog/2011/06/19/tuningdocumentum-xploreo Also, some additional diagnostics can be helpful at times;• Set the loglevel to fine in logging.properties filecom.xhive.index.multipath.merging.level = FINEcom.xhive.index.multipath.index.level = FINE• Rerun and search for “Merge” in the dsearch.log4
I/O's per secresp (secs)• If the timestamp of the clean merge coincides with some searches, then thiswas further proof of the impactIf you plot the I/O from sar –d then and then match that to the query response timethen you get something that looks as in the following. Note the I/O spike that happenedafter every 4 hour period.I/O load vs. warmup response timedefault final merge activity with an index that is 100's of GB60005000400030004 hrs betweenstarts of high i/o400350300250200tpsresp200010000150100500Is the query a wildcard query?o The default behavior of wildcard search is “contains_word” (no fragment search).Ensure the default hasn’t been overridden by mistake.oif the wildcard is on a metadata field then the <strong>xPlore</strong> 1.1 can offer some improvementwith the “leading_wildcard” property on a metadata field. This should be set on the dataprior to indexing or the customer can use the <strong>xPlore</strong> 1.1 online index rebuild feature.o <strong>xPlore</strong> 1.1 fuzzy search might also be more appropriate for use-cases in which peopleuse wildcards to compensate for a lack of spelling correctiono Suspect wildcard usage by applications as a solution• http://java.dzone.com/articles/wild-card-clause-searches-areo Large time-to-first result as seen from Top N Slowest query report:5
Is the disk very busy when one or several large queries are run?o If so, then the I/O subsystem may be weak. Testing with bonnie tool (linux) could bevery helpful. See:• https://community.emc.com/docs/DOC-8922 and• https://community.emc.com/community/edn/documentum/blog/2010/12/02/debugging-an-io-capacity-issue-with-xploreo If the underlying device is a NAS device then the bonnie utility (on linux) can be used todiscern how well it compares with local drives and/or SANs.o Also see https://community.emc.com/docs/DOC-9179 for case studyIs the query result bounded?o Unbounded queries are a common source of response time issues.o This can be easily seen through the admin reports to see if a large number of results arebeing fetched. The default Webtop pulls only 350 results. At times, some applicationswill pull all results.o Custom applications recommended to leverage DQL hint RETURN_TOP.Is the user under-privileged and the query unselective?o If the query is unselective, then it will by default generate many resultso If the user under-privileged then many results will get discarded.o Possible solutions:o User to attempt to make query more selective. To do this, extra criteria must be addedto the query.o If user part of a small department surrounded by a ton of data from other groups, thenit may make sense to place the department’s data into a separate collection andcustomize the user query to hit that collection by default. There are several ways tocustomize the search API’s to do this including the fds_collection DQL hint.o Again, the admin reports provide the best look into this with the Top N slowest queryreport. If the tech support provides this to us we can load it directly into our system andsee this immediately.In the above example 3 queries ran slow as the security filter denied 14,000 to 50,000+ resultsdue to the lack of security.6
Is the query a range query?o Issue number #1 with range queries: the range is very large. This can go slow.o Issue number #2 with range queries: type mismatch. A custom date type inDocumentum is indexed as a string in <strong>xPlore</strong>’s index.Is the lucene index too fragmented?o Then we note that this can happen when merging doesn’t happen fast enough relativeto the ingest rate. Normally lots of little indexes merge into fewer larger indexes.o To get additional diagnostic data:• Execute: “ls –lR $xplore/data” on Linux and,• Execute “ dir /S %xplore%\data” on windowso You could also use “querygen.sh or querygen.bat with –q” option to get a nicelyformatted and analyzed list. The tool can be found athttps://community.emc.com/docs/DOC-8704.Inspect the logs for ‘exceptions’Typically exceptions signal functional issues, but occasionally they could point to resource limitationissues and resource limitations lead to poor performance.How to inspect:Linux: grep –i exceptin dsearch.log*Windows: findstr /I exception *.logOnce you found a match, use your favorite editor to inspect the details.No time outs and no errors, but response is slow1) Is the system undersized?a. If <strong>xPlore</strong> host CPU is running at over 85% capacity, most likely you need additional CPUi. How to check?1. Windows: perfmon2. Linux: topb. If disks are being pounded, most likely you need additional I/O capacityi. How to check?1. Windows: perfmon2. Linux: sarc. Is memory too limited, you’ll see heavy page faults and/or context switchingi. How to check?1. Windows: check for excessive page faults2. Linux: vmstat, sar7
2) Do we have sufficient I/O?a. How to check?i. Use bonnie (see https://community.emc.com/docs/DOC-8978)3) Is <strong>xPlore</strong> tunned?a. Have you allocated enough memory to JVM?i. The default (out of the box) setting may not be enough for your operationii. How to check?1. Many ways:a. jconsole, jvisualvmb. Check the startup commandb. Are JVM flags works well?i. By default the JVM flags are optimized for the set of tests conducted by usii. You should gauge this for your workloadiii. How to check?1. Many tools: jconsole, jvisualvm4) System tuned?a. Will deadline scheduler help ( Linux)b. Will /dev/urandom help (Linux)8
Inspect auditRecords.xmlThere is almost no better source of information on query response. These can be downloaded from thecustomer environment and loaded into your own version of <strong>xPlore</strong> for a more detailed analysis.Engineering will need to look at this data to diagnose performance issues.Now the file can be located though the admin tool but do not try to download in this fashion (using the<strong>xPlore</strong> admin tool) because they can be rather large (easily 100MB).A better strategy is to use the XHCommand utility:cd $xplorehome/dsearch/xhive/admincreate a file that has this as contents :---- start of file ---cat /SystemData/AuditDB/PrimaryDsearch/auditRecords.xml---- end of file ---Note that the path in this file is the xDB library path, not the file system path.Then redirect that file into the following command (tailored for your env):XHCommand -u Administrator -p pass -d xhivedb < yourfile.xq > yourfile.txtwhere pass = your passwordand yourfile.xq is the file you created with the cat commandand yourfile.txt is the outputNote that the file could be called auditrecords.xml. It will have a couple of non-XML format lines in thefront of the file and the ending of the file. These should be stripped off before loading this into xDB.This same XHCommand utility can be used to load the XML file into an Engineering or tech supportinstallation of <strong>xPlore</strong>. This allows the engineer to run reports or even more in-depth queries offline.9
The following example illustrates how you can import some audit records from a customer environmentinto your own <strong>xPlore</strong> environment. Note that the <strong>xPlore</strong> reports will work even if the original file name isnot the same as what it was in the customer environment. In this example, we have changed the namefrom auditRecords.xml to auditRecords.customer.xml.C:\<strong>xPlore</strong>\dsearch\xhive\admin>XHCommand -u Administrator -p pass -d xhivedbxDB 10_0@811423 command line client (c) 1999-2010 <strong>EMC</strong> CorporationType 'help' for a list of commands and options, type 'exit' to leave the shell.xdb> import C:\temp\dm_notes\auditRecords_1.xml /SystemData/AuditDB/PrimaryDsearchStoring XML document C:\temp\dm_notes\auditRecords_1.xml as/SystemData/AuditDB/PrimaryDsearch/auditrecords.customer.xmlStored 1 file(s).xdb>Once this is complete the <strong>xPlore</strong> reports (as seen from the Admin tool will work on this data).10
Use Search Admin ReportsThere are varieties of reports to help you with issues.System LogsInspect system log files for clues.1) /var/logs/message (linux)2) dmesg (Linux)3) Event Log (Windows)11
<strong>xPlore</strong> TuningThe base <strong>xPlore</strong> is composed two processes. The part that runs under the JVM and the native codeprocess called CPSDaemon. Search EDN for “xplore performance” and you’ll find many matches to helpguide you.What to collectTo reduce the back and forth exchanges, provide the following when entering a support request:1) The version of the <strong>xPlore</strong> you are using2) The hardware info (Memory, CPU, SAN/NAS/NFS, etc)3) All log files in XPLORE_ROOT/jboss4.3.0/server/DctmServer_PrimaryDsearch/logs4) The indexserverconfig.xml in XPLORE_ROOT/config5) The xdb.properties inXPLORE_ROOT/jboss4.3.0/server/DctmServer_PrimaryDsearch/deploy/dsearch.war/WEB-INF/classes6) The PrimaryDsearch_local_configuration.xml in XPLORE_ROOT /dsearch/cps/cps_daemon7) AuditRecords.xml and the metrics.xml files from the <strong>xPlore</strong> that are in the /SystemData xDBlibraryIs the system sized correctlyUse the <strong>xPlore</strong> sizing tool to size your system. Search for “xplore sizing” on Powerlink.12
Analyze QueriesHard to read queriesYou can copy the queries from dsearch.log (when INFO logging is on) and paste it to xDB for analysis.The xQueries are hard to read as shown in log file. Use the XDB Admin tool to format the query.The <strong>xPlore</strong> admin tool also supports the ability to run and analyze the queries. This can be found in the“Execute XQuery” button that is shown when navigating to the Data Management >> Domain area (inthe example below the domain name = ‘test’).Check these to enable the generationof the query plan13
Read the query plan14
ProfileCheck the profile result15
DetailsTestThough we have tested <strong>xPlore</strong> extensively, your workload, number of users, groups, folders, securitymeasures, data composition and hardware is always different from ours. Make sure to allocate time totest before going production.BackupCreate a sound backup strategy. Disaster happens when least expected.LinksHere are some good links.16
http://www.psc.edu/networking/projects/tcptune/http://www.performancewiki.com/windows-tuning.htmlhttp://fasterdata.es.net/fasterdata/host-tuning/linux/http://fasterdata.es.net/fasterdata/host-tuning/nic-tuning/http://www.performancewiki.com/linux-tuning.htmlhttp://people.redhat.com/alikins/system_tuning.htmlhttp://www.eslim.co.kr/pds/pds/2/5/RHEL_Tuning_Guide.pdfhttps://community.emc.com/docs/DOC-917917