Quantitative XRD phase analysis in.pdf - UNAIR | E-Book Collection
Quantitative XRD phase analysis in.pdf - UNAIR | E-Book Collection
Quantitative XRD phase analysis in.pdf - UNAIR | E-Book Collection
- No tags were found...

Create successful ePaper yourself
Turn your PDF publications into a flip-book with our unique Google optimized e-Paper software.
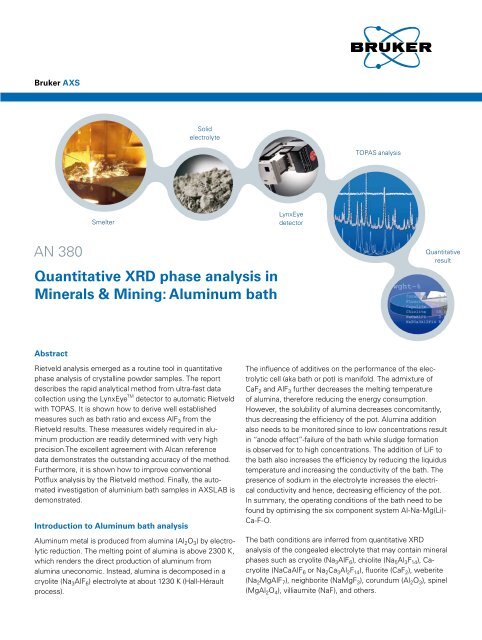
Bruker AXSSolidelectrolyteTOPAS <strong>analysis</strong>SmelterLynxEyedetectorAN 380<strong>Quantitative</strong> <strong>XRD</strong> <strong>phase</strong> <strong>analysis</strong> <strong>in</strong>M<strong>in</strong>erals & M<strong>in</strong><strong>in</strong>g: Alum<strong>in</strong>um bath<strong>Quantitative</strong>resultAbstractRietveld <strong>analysis</strong> emerged as a rout<strong>in</strong>e tool <strong>in</strong> quantitative<strong>phase</strong> <strong>analysis</strong> of crystall<strong>in</strong>e powder samples. The reportdescribes the rapid analytical method from ultra-fast datacollection us<strong>in</strong>g the LynxEye TM detector to automatic Rietveldwith TOPAS. It is shown how to derive well establishedmeasures such as bath ratio and excess AlF 3 from theRietveld results. These measures widely required <strong>in</strong> alum<strong>in</strong>umproduction are readily determ<strong>in</strong>ed with very highprecision.The excellent agreement with Alcan referencedata demonstrates the outstand<strong>in</strong>g accuracy of the method.Furthermore, it is shown how to improve conventionalPotflux <strong>analysis</strong> by the Rietveld method. F<strong>in</strong>ally, the automated<strong>in</strong>vestigation of alum<strong>in</strong>ium bath samples <strong>in</strong> AXSLAB isdemonstrated.Introduction to Alum<strong>in</strong>um bath <strong>analysis</strong>Alum<strong>in</strong>um metal is produced from alum<strong>in</strong>a (Al 2 O 3 ) by electrolyticreduction. The melt<strong>in</strong>g po<strong>in</strong>t of alum<strong>in</strong>a is above 2300 K,which renders the direct production of alum<strong>in</strong>um fromalum<strong>in</strong>a uneconomic. Instead, alum<strong>in</strong>a is decomposed <strong>in</strong> acryolite (Na 3 AlF 6 ) electrolyte at about 1230 K (Hall-Héraultprocess).The <strong>in</strong>fluence of additives on the performance of the electrolyticcell (aka bath or pot) is manifold. The admixture ofCaF 2 and AlF 3 further decreases the melt<strong>in</strong>g temperatureof alum<strong>in</strong>a, therefore reduc<strong>in</strong>g the energy consumption.However, the solubility of alum<strong>in</strong>a decreases concomitantly,thus decreas<strong>in</strong>g the efficiency of the pot. Alum<strong>in</strong>a additionalso needs to be monitored s<strong>in</strong>ce to low concentrations result<strong>in</strong> “anode effect”-failure of the bath while sludge formationis observed for to high concentrations. The addition of LiF tothe bath also <strong>in</strong>creases the efficiency by reduc<strong>in</strong>g the liquidustemperature and <strong>in</strong>creas<strong>in</strong>g the conductivity of the bath. Thepresence of sodium <strong>in</strong> the electrolyte <strong>in</strong>creases the electricalconductivity and hence, decreas<strong>in</strong>g efficiency of the pot.In summary, the operat<strong>in</strong>g conditions of the bath need to befound by optimis<strong>in</strong>g the six component system Al-Na-Mg(Li)-Ca-F-O.The bath conditions are <strong>in</strong>ferred from quantitative <strong>XRD</strong><strong>analysis</strong> of the congealed electrolyte that may conta<strong>in</strong> m<strong>in</strong>eral<strong>phase</strong>s such as cryolite (Na 3 AlF 6 ), chiolite (Na 5 Al 3 F 14 ), Cacryolite(NaCaAlF 6 or Na 2 Ca 3 Al 2 F 14 ), fluorite (CaF 2 ), weberite(N a 2 MgAlF 7 ), neighborite (NaMgF 3 ), corundum (Al 2 O 3 ), sp<strong>in</strong>el(MgAl 2 O 4 ), villiaumite (NaF), and others.
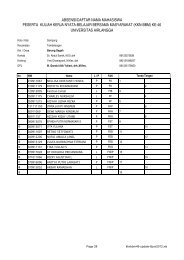
Two traditionally used measures for controll<strong>in</strong>g the compositionof the bath are the bath ratio BR (def<strong>in</strong>ed as the weightratio NaF/AlF 3 ) and excess AlF 3 , ExAlF 3 . The ratios of some<strong>phase</strong>s <strong>in</strong> the crystallized electrolyte are shown <strong>in</strong> Fig. 1.Once the chiolite (Na 5 Al 3 F 14 ) l<strong>in</strong>es disappear the bath isdepleted of alum<strong>in</strong>ium ions and alum<strong>in</strong>a (Al 2 O 3 ) has to beadded. Typically, alum<strong>in</strong>um is deposited with<strong>in</strong> the BR range1.1 — 1.4. For pure cryolite (BR = 1.5) ExAlF 3 is 0 % and forpure chiolite (BR = 0.833) the ExAlF 3 value is 24.24 %.Fig. 1:Crystall<strong>in</strong>e <strong>phase</strong>s appear<strong>in</strong>g <strong>in</strong> the congealed alum<strong>in</strong>umelectrolyte dur<strong>in</strong>g electrolysis.Experimental requirementsThe determ<strong>in</strong>ation of the bath concentration <strong>in</strong> the plant istypically repeated every two to three days. S<strong>in</strong>ce there arehundreds to thousands of baths, the available time for themeasurement and data <strong>analysis</strong> is just several m<strong>in</strong>utes.In order to obta<strong>in</strong> reproducible quantitative results the samplepreparation needs to be standardized. Typically, the congealedsample is roughly crushed <strong>in</strong> a small crusher and thesample is automatically screened for pure metal parts thatmay disturb the subsequent automated mill and press process.The whole procedure takes about 3 m<strong>in</strong>. The pressedsamples are either transported via conveyor belt to the diffractometeror collected at a sample tray.Traditional quantitative <strong>analysis</strong> based on s<strong>in</strong>gle diffractionpeaks is fast with measurement times below 100 seconds.However, bath <strong>analysis</strong> based on s<strong>in</strong>gle peak <strong>analysis</strong> ishampered by peak overlap of several <strong>phase</strong>s, texture etc.Therefore latest developments aim at full pattern <strong>analysis</strong>.Here, the challenge is comb<strong>in</strong><strong>in</strong>g rapid data acquisition withthe count<strong>in</strong>g statistics necessary for obta<strong>in</strong><strong>in</strong>g statisticallysound Rietveld results. The LynxEye is a 1-dimensional detectorbased on compound silicon strip technology. It allows forquick data collection without compromis<strong>in</strong>g the data quality.The <strong>in</strong>tensity ga<strong>in</strong> compared to a standard sc<strong>in</strong>tillation counteris almost a factor of 200, allow<strong>in</strong>g extremely fast measurementswith the resolution and the peak profile virtuallyidentical to po<strong>in</strong>t detector measurements.Diffraction data for Alu-bath full pattern <strong>analysis</strong> with TOPASare collected with the D4 ENDEAVOR, Cu radiation and theLynxEye 1-dimensional detector plus an additional sealedproportional Ca-channel for fluorescence <strong>analysis</strong>. Thetotal scan time is about 94 sec for the angular range 11° to65° 2Theta. The fluorescence data are simultaneously collected.Therefore, the quality of the Ca-channel data is largelyimproved compared to s<strong>in</strong>gle peak measurements. The completemeasurement time <strong>in</strong>clud<strong>in</strong>g sample transfer is about2:30 m<strong>in</strong>.The diffraction data are analysed by the Rietveld methodus<strong>in</strong>g DIFFRAC plus TOPAS. The process relevant parameterssuch as ExAlF 3 , BR, or total CaF 2 are adjacently computedwith DIFFRAC plus DQUANT. Furthermore, DQUANT allows<strong>in</strong>clud<strong>in</strong>g additional <strong>in</strong>formation from the Ca-channel measurement.DIFFRAC plus TOPAS quantitative Rietveld <strong>phase</strong><strong>analysis</strong><strong>XRD</strong> is the most direct and accurate analytical method fordeterm<strong>in</strong><strong>in</strong>g the presence and the absolute amounts ofm<strong>in</strong>eral species <strong>in</strong> a sample. There are several advantages ofRietveld <strong>phase</strong> <strong>analysis</strong> over conventional methods:• Full pattern quantitative <strong>phase</strong> <strong>analysis</strong> apply<strong>in</strong>g theRietveld method does generally not require time consum<strong>in</strong>gcalibration.• Multi-<strong>phase</strong> samples are easily analyzed without be<strong>in</strong>gconstra<strong>in</strong>ed by peak overlap.• The add<strong>in</strong>g of new <strong>phase</strong>s found <strong>in</strong> qualitative <strong>XRD</strong> isstraightforward.• Additionally, crystall<strong>in</strong>ity and crystallite size that <strong>in</strong>fluencethe reactivity of the m<strong>in</strong>eral components can simultaneouslybe derived from the peak profiles.Fast and reliable Rietveld based quantitative <strong>analysis</strong> becamerout<strong>in</strong>ely possible by comb<strong>in</strong><strong>in</strong>g fast modern computertechnology and optimised mathematical algorithms withthe fundamental parameters approach [1] <strong>in</strong> the DIFFRAC plusTOPAS software.
How to calculate free AlF 3 , bath ratio and the total CaF 2 amount from the Rietveld resultsThe amount of free AlF 3 (ExAlF 3 ) is conventionally def<strong>in</strong>ed as the %-amount of AlF 3 <strong>in</strong> solution not bound as cryolite, Na 3 AlF 6 .Apart from cryolite other <strong>phase</strong>s as chiolite or Ca-cryolites may be found <strong>in</strong> the congealed electrolyte.Conventionally, ExAlF 3 is calculated from the comb<strong>in</strong>ation of the amounts of chiolite and CaF 2 determ<strong>in</strong>ed by quantitative <strong>phase</strong><strong>analysis</strong> and the total Ca content (Ca tot ) from the fluorescence channel, e.g. [2].(1)ExAlF 0.2429w CaFactor Ca wtot3 chiolite CaF2The CaFactor is the ratio Ex j AlF 3 to the mass fraction m j CaF 2 per formula unit of the j-th CaF 2 bear<strong>in</strong>g <strong>phase</strong>. The CaFactor is0.717 for pure NaCaAlF 6 and 0.487 for pure Na 2 Ca 3 Al 2 F 14 . Traditional quantitative <strong>analysis</strong> that is based on s<strong>in</strong>gle peak evaluationcan hardly determ<strong>in</strong>e the amount of NaCaAlF 6 and Na 2 Ca 3 Al 2 F 14 due to strong peak overlap of the two <strong>phase</strong>s. That0.2744w10.2303w2 w1w2totprevents a precise ExAlF 3 determ<strong>in</strong>ation. 0.2429wchiolite Therefore, the result is always biased by guess<strong>in</strong>g Cathe wCaFreal 2 <strong>phase</strong> content, which isw1w2 0.3826w10.4818w2essentially dependent on the cool<strong>in</strong>g rate of the electrolyte. Typically, an <strong>in</strong>termediate CaFactor of 0.6 is assumed [2].0.2744w10.2303w2tot totEx 0.2429 AlF3 w0.2429 chiolitewchiolite CaFactor CaCa wwCaF CaF20.3826w210.4818w2<strong>Quantitative</strong> <strong>phase</strong> <strong>analysis</strong> by the Rietveld method gives the <strong>phase</strong> content for all crystall<strong>in</strong>e <strong>phase</strong>s <strong>in</strong> the sample. Consequently,the CaFactor can exactly be calculated by weight<strong>in</strong>g Ex j AlF 3 and the m j CaF 2 with the weight fractions w j of NaCaAlF 6and Na 2 Ca 3 Al 2 F 14 , respectively:(2) tot0.2744w 0.2303w w wExAlF AlF 0.2429w ExAlFCa wj1 2 1 2tot33 jchiolite 3CaF2jw1w2 0.3826w10.4818w20.2744w 0.2303w1 2 tot0.2429wchiolite Ca 0.3826w10.4818w2w2CaFtotExAlF The Ex j 30.2429wchiolite CaFactor Ca wCaF2AlF 3 (Tab. 1) are total derived NaFBR from the factors A and C <strong>in</strong> the decomposition of the respective <strong>phase</strong>s <strong>in</strong>to cryolite, AlF 3 andCaF 2 accord<strong>in</strong>g to the stoichiometry total AlF3given by the general formulatotjEx 0.6 AlF wCryolite 3 w 0.454jExwChiolite AlF 0.172 wCaCryo1 0.2wCaCryo23j0.4w A <strong>phase</strong> ↔ B cryolite + C AlF 3 + D CaF 2 ,Cryolite0.546wChiolite 0.2744 0.345 wCaCryo1 10.2303 0.411w wCaCryo22w1w2totExAlF 30.2429 chiolite totCawCaFExAlF 230.2429wchiolite CaFactor w1Ca w w2 CaF 20.3826w10.4818w2the mass per formula unit m j of <strong>phase</strong> j, and the mass of AlF 3 (83.98). tot0.2744 ExAlF w130.23030.2429 wwchiolite CaFactor Ca wtotCaF 220.2429wStraightforward, total Ex chiolite CawCaF2total AlF NaF 3 can0.3826directly w1be 0.4818calculated w2from the Rietveld results without the need for a separate Ca-channel,BR tottotaljust by summation Ex over AlF CaFtotal the 32 0.2429 AlFwtheoreticallyCaF w0.4817 chiolitedeterm<strong>in</strong>ed CaFactor w CaEx j 3AlF 2CaCryo2 0.3826wCaCryo1CaF 3 of 2 the j <strong>phase</strong>s weighted by the amount of the <strong>phase</strong>s (w j ) <strong>in</strong> themixture, obta<strong>in</strong>ed through 0.6w the Rietveld quantitative0.2744w1<strong>phase</strong>0.2303w <strong>analysis</strong>:2w1w2totExAlF Cryolite0.454wChiolite 0.172wCaCryo1 0.2w30.2429wchiolite CaCryo2CawCaF2w1w2 0.2744 0.3826 w1w0.230310.4818w2 w2w1w2tot0.4wCryolite 0.546wExAlF Chiolite0.345 30.2429 w wCaCryo1chiolite 0.411 wCawCaCryo2CaF 2totj(3)Ex AlF3 w0.2744 jExAlF w130.2303ww2 tot1w2 0.3826w10.4818w20.2429wchiolite CawjCaF 20.3826w0.2744 10.4818 w w10.2303 20.2744 ww2 10.2303w21wtot2totExAlF 30.2429w 0.2429 chiolite wchiolite CawCaF2Table 1: Selected parameters of bath constituents.CawCaF2w1w0.3826w2 10.4818 0.3826w210.4818w2Phase name Formula m j0.2744wA B C D m j CaF 2 Ex j 10.2303w2totAlFtotal 0.2429 CaFw32chiolitew CaF0.4817w 2CaCryo2 0.3826 CawwCaCryo1CaF2Chiolite Na 5 Al 3 F 14total NaF461.87 0.3826w3 10.4818 5 w4 2 0 0.0 0.2429totjEx BR AlF 3Ca-cryolite 1 NaCaAlFtotal 6AlF 204.04w jExAlF331 2 3 0.3826 0.2745j 3totjEx AlF3 Ca-cryolite 2 Na 2 Ca0.6 3 Alw 2 F 14 486.15 3 2 w jExAlF34 9 0.4818 0.2303Cryolite0.454wChiolite 0.172 j wCaCryo1 0.2wCaCryo2tot 0.4wCryolite 0.546wChiolite j 0.345wCaCryo1 0.411wCaCryo2Furthermore, bath Ex ratio AlF and 3the total wjExamount AlF3of CaF 2 can directly be calculated from the quantitative Rietveld results. The bathjratio BR is def<strong>in</strong>ed as the total weight NaF ratio NaF/AlF 3 <strong>in</strong> the electrolyte. As a result of the Rietveld ref<strong>in</strong>ement the amount of theBR m<strong>in</strong>eral <strong>phase</strong>s (w j ) <strong>in</strong> the total congealed AlF electrolyte is obta<strong>in</strong>ed. Apply<strong>in</strong>g the known stoichiometry of the m<strong>in</strong>eral <strong>phase</strong>s BR is3total NaFBR determ<strong>in</strong>ed by: 0.6wCryolite 0.454w totalChiolite0.172 AlFw30.2wCaCryo2total CaF2 wCaF 0.4817w 2CaCryo2 0.3826wCaCryo10.4wtotal NaFCryolite0.546w 0.6Chiolitew0.345 Cryolitew0.454 CaCryo1w0.411Chiolitew0.172 wCaCryo2CaCryo10.2wCaCryo2(4)BR total AlF30.4wCryolite 0.546wChiolite 0.345wCaCryo1 0.411wCaCryo2The total amount of CaF 0.6w 2Cryolite <strong>in</strong> the electrolyte 0.454wChiolite is 0.172wCaCryo1 0.2wCaCryo20.4wCryolite 0.546wChiolite 0.345wCaCryo1 0.411wCaCryo2(5)total CaF2 wCaF 0.4817w 2CaCryo2 0.3826wCaCryo1total CaF2 wCaF 0.4817w 2CaCryo2 0.3826wCaCryo1that can be compared to total-Ca from the fluorescence measurement.total CaF w 0.4817w 0.3826w2 CaF2CaCryo2 CaCryo1
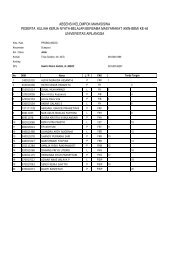
Bruker AXS Alu-bath solution: electrolytic bath <strong>analysis</strong> us<strong>in</strong>g TOPAS RietveldFigure 2 shows a typical powder diffraction pattern from Alu-bath <strong>analysis</strong> together with the results from the TOPAS Rietveldquantitative <strong>analysis</strong>. The congealed electrolyte conta<strong>in</strong>s fluorite, corundum, cryolite [3], chiolite [4] and Ca-cryolite of two differentcompositions [5,6]. Data from a TOPAS Rietveld ref<strong>in</strong>ement are exemplarily given <strong>in</strong> table 2.Fig. 2:Typical powder <strong>XRD</strong> pattern of an Alu-bath sample together with the results from Rietveld <strong>analysis</strong>employ<strong>in</strong>g TOPAS V4. The measurement time is 90 sec, the agreement parameters of the modelcalculation and the experiment data are Rwp = 7.14 and GoF = 1.7.PrecisionThe repeatability for 90 sec measurements was <strong>in</strong>vestigatedfor the Alcan reference samples BA-01 to BA-11. For eachof the runs the sample was unloaded and reloaded to thediffractometer. Table 2 conta<strong>in</strong>s typical results averaged fromthe <strong>analysis</strong> of 12 scans. The wt%-quantity of the m<strong>in</strong>eral<strong>phase</strong>s, derived values such as the bath ratio BR, Ex tot AlF 3 ,total CaF 2 , and the respective standard deviations are given.The reproducibility is very good with absolute standard deviationsof the concentrations below 0.2%. The relative standarddeviations of m<strong>in</strong>or <strong>phase</strong>s (amount of <strong>phase</strong> below 1%)seem large. However, this simply implies that the method isclose to its detection limits.Table 2: Average values of 12 measurements and their absoluteand relative s<strong>in</strong>gle standard deviations (SD).Value /wt-%SD Rel. SD /%Corundum a-Al 2 O 3 0.24 0.03 15.00Fluorite CaF 2 0.08 0.03 40.00Cryolite Na 3 AlF 6 59.01 0.15 0.25Chiolite Na 5 Al 3 F 14 31.08 0.19 0.62Ca-cryolite NaCaAlF 6 0.78 0.11 14.00Na 2 Ca 3 Al 2 F 14 8.80 0.09 1.09Total CaF 2 TOPAS 4.62 0.05 1.21Ex tot AlF 3 TOPAS 9.76 0.04 0.44BR TOPAS 1.156 0.001 0.10
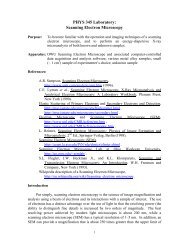
Accuracy1.51152TOPAS1.41.31.2Bruker AXS / %105y = 0.9377xR 2 = 0.99761.111 1.1 1.2 1.3 1.4 1.5Alcan standard00 5 10 15Alcan standard / %TOPAS / %1284030 4 8 12Alcan standard / %Fig. 3:Accuracy plot for (1) bath ratio BR,(2) Ex tot AlF 3 , and (3) total CaF 2 and a-Al 2 O 3 .All standard deviations are smaller than thesymbols. The symbols <strong>in</strong> (1) represent theTOPAS results (Eq. 4) plotted versus theAlcan reference data, the l<strong>in</strong>e representsthe fit of a l<strong>in</strong>ear trend l<strong>in</strong>e. Filled circles <strong>in</strong>panel (2) represent values derived by theoptimized Ca-channel method (Eq. 2) whileopen squares stand for the Rietveld TOPASderived data (Eq. 3), the trend l<strong>in</strong>e for theRietveld TOPAS data is also given. In panel(3), total CaF 2 (Eq. 5) is given by filled squaresand circles represent a-Al 2 O 3 . The l<strong>in</strong>e is therespective l<strong>in</strong>ear trend.The Rietveld <strong>analysis</strong> with TOPAS was checked us<strong>in</strong>g eleven Alcanreference samples [7]. The excellent agreement between the TOPASresults and the reference values directly follows from figure 3. Thescatter of the data po<strong>in</strong>ts around the trend l<strong>in</strong>es is very small. Thereis a strong l<strong>in</strong>ear correlation for the here determ<strong>in</strong>ed concentrations,ExAlF 3 and BR with the <strong>in</strong>dependently determ<strong>in</strong>ed reference values.For the group of reference samples <strong>in</strong>vestigated here, the average differencebetween the certified free CaF 2 and the Rietveld determ<strong>in</strong>edvalues is below 0.5% which is just excellent.The Ex tot AlF 3 values calculated accord<strong>in</strong>g to Eq. 3 from the Rietvelddeterm<strong>in</strong>ed quantities of chiolite and the two different types of Cacryolitealso agree extremely well with the reference values. The averagedeviation from the l<strong>in</strong>ear trend l<strong>in</strong>e is about 0.25 %. Conventionalvalues derived from the Ca-channel but weighted with the properconcentrations for the Ca-cryolite closely resemble the pure TOPASdata. This proves the high reliability of the results derived from theRietveld method. F<strong>in</strong>ally, the bath ratio BR shows a brilliant agreementwith reference data hav<strong>in</strong>g a mean deviation as low as 0.02.The Bruker AXS Alu-bathsolution• Automated push-button AXSLAB• High-speed <strong>XRD</strong> data collectionus<strong>in</strong>g LynxEye detector• Full profile calculation (TOPASRietveld) as a new primarymethod <strong>in</strong> bath <strong>analysis</strong>Derivation of <strong>in</strong>dustry standard•control parameters: Bath ratio,total CaF 2 , Excess AlF 3
Fig. 4:Flow of an Alu-bath <strong>analysis</strong> <strong>in</strong> AXSLAB. The schematic arrangement of the cells (A) is mapped with<strong>in</strong> theLabControlCenter, where unambiguous sample names are def<strong>in</strong>ed from the hall, raw and cell numbers,shift label and the day of the year. The measurement method is taken from a simple drop-down list (B) anda job list is created that is automatically executed (C). The result<strong>in</strong>g <strong>XRD</strong> patterns are analysed with TOPASand results, stored <strong>in</strong> a database, are statistically evaluated (D), before the validated data are send to theelectrolysis operator (E).
Automation with AXSLAB andD I F F R AC plus TOPAS BBQThe large amount of samples <strong>in</strong> an alum<strong>in</strong>umelectrolysis plant calls for a high throughputsolution with a maximum degree of automation.AXSLAB provides the respectivepush-button solutions that may range fromoperat<strong>in</strong>g a standalone diffractometer upto the <strong>in</strong>tegration of automated preparationsystems, sample transport, control of several<strong>XRD</strong> diffractometers and/or XRF spectrometers— <strong>in</strong>clud<strong>in</strong>g data <strong>analysis</strong> — <strong>in</strong>to alaboratory <strong>in</strong>formation system.The AXSLAB <strong>in</strong>terface (Fig. 4) graphicallymaps the number of production halls, l<strong>in</strong>esand cells at the customer site and therefore,allows to unambiguously assign the probedbath to a particular sample. The prob<strong>in</strong>g plansare stored as batches and can be repeated atany time.The whole preparation, measurementand <strong>analysis</strong> process is controlled throughAXSLAB. The calculated <strong>analysis</strong> data arestored <strong>in</strong> a SQL database and may automaticallybe limit checked or analyzed otherwise,accord<strong>in</strong>g to the customer needs. Beforethe results are transferred to the electrolysisoperator a validation procedure allowsidentify<strong>in</strong>g outliers due to difficulties with thesample collection from the bath. The respectivecells can be re-probed and AXSLAB’shigh-priority measurement of these samplesallow fast process decisions by the electrolysisoperator.AXSLAB is easy to use and designed fornon-technicians. Consequently, only m<strong>in</strong>imumoperator tra<strong>in</strong><strong>in</strong>g is needed. The highthroughput reduces the costs per <strong>analysis</strong>.The automated sample preparation ensuresconstant quality of the samples, which is theprerequisite for the quality of the results.ConclusionsThe LynxEye detector makes rapid data collection of completediffraction patterns with<strong>in</strong> just a few seconds possible.The <strong>in</strong>tensity ga<strong>in</strong> of the detector facilitates the high samplethroughput be<strong>in</strong>g <strong>in</strong>dispensable for Rietveld quantitative<strong>analysis</strong> <strong>in</strong> alum<strong>in</strong>um <strong>in</strong>dustries. While the setup of theRietveld <strong>analysis</strong> needs expert knowledge, the <strong>in</strong>tegrationof preparation, measurement and data <strong>analysis</strong> <strong>in</strong> AXSLABallows rout<strong>in</strong>e operation of the whole <strong>analysis</strong> process bynon-specialists <strong>in</strong> the plant.Standardless TOPAS <strong>analysis</strong> appears as the new primarystandard method for the determ<strong>in</strong>ation of electrolytic bathcompositions. This breakthrough <strong>in</strong> Alu-bath <strong>analysis</strong> becamepossible by means of the fast and robust TOPAS algorithms.Consistent and most reliable results are obta<strong>in</strong>ed, irrespectiveof tube age<strong>in</strong>g, prob<strong>in</strong>g and preparation issues. Bath parameterssuch as ExAlF 3 , BR or total CaF 2 are calculated fromthe concentrations of the different crystall<strong>in</strong>e <strong>phase</strong>s <strong>in</strong> theelectrolyte with outstand<strong>in</strong>g accuracy and precision. Furthermore,TOPAS <strong>analysis</strong> facilitates the quantification of calciummixed-crystal <strong>phase</strong>s <strong>in</strong> the electrolyte and sample propertiessuch as preferred orientation or crystallite size are entirelyconsidered.The importance of the here presented bath <strong>analysis</strong> for themanufacturers was recently summarized by Frank R. Ferret ofAlcan Int. Ltd., one of the world lead<strong>in</strong>g alum<strong>in</strong>um producers:“The new methodology is seen as applicable to alltypes of bath; it is the most accurate and able toconsistently produce the same result <strong>in</strong>dependentlyof the operator’s skill and the sample history.… fast X-ray diffraction coupled with Rietveld <strong>in</strong>terpretationwill most likely constitute the future <strong>in</strong> bath<strong>analysis</strong> […].” [8]In addition, TOPAS quantitative <strong>phase</strong> <strong>analysis</strong> improves thetraditional determ<strong>in</strong>ation of ExAlF 3 from Ca-channel data.The data of the ExAlF 3 <strong>analysis</strong> are redundant if the weight<strong>in</strong>gscheme proposed <strong>in</strong> Eq. 2 is applied. In pr<strong>in</strong>cipal, theTOPAS method supersedes the use of the Ca-channel andf<strong>in</strong>ally, overcomes uncerta<strong>in</strong>ties <strong>in</strong>troduced by the operatorat sample tak<strong>in</strong>g by proper determ<strong>in</strong>ation of the Ca-cryoliteconcentrations.
Keywords<strong>XRD</strong> / quantitative <strong>phase</strong> <strong>analysis</strong> / TOPAS / Alum<strong>in</strong>umbath<strong>analysis</strong>AuthorsKarsten Knorr, Elke Schwöbel, He<strong>in</strong>z-Günter Granacher;Bruker AXSReferences[1] Cheary, R. W.; Coelho, A. A. & Cl<strong>in</strong>e, J. P.: Fundamentalparameters l<strong>in</strong>e profile fitt<strong>in</strong>g <strong>in</strong> laboratory diffractometersJournal of Research of the National Institute of Standardsand Technology, 2004, 109, 1-25[2] Lossius, L. P.; Hoie, H.; Pedersen, H. H. & Foosnaes, T.:Analysis of excess AlF 3 - Harmonization <strong>in</strong> Hydro Alum<strong>in</strong>ium.Peterson, R. D. (ed.)TMS 2000: Annual Meet<strong>in</strong>g and Exhibition, TMS: TheM<strong>in</strong>erals, Metals and Materials Society, 2000, 265-270[3] Hawthorne, F. C. & Ferguson, R. B.: Ref<strong>in</strong>ement of thecrystal structure of cryolite. Canadian M<strong>in</strong>eralogist, 1975,13, 377-382[4] Brosset, C.: Die Kristallstruktur des Chioliths. Zeitschriftfür Anorganische und Allgeme<strong>in</strong>e Chemie, 1938, 238,201-208[5] Courbion, G. & Ferey, G.: Na 2 Ca 3 Al 2 F 14 : A New Exampleof a Structure with "Independent F – " A New Method ofComparison between Fluorides and Oxides of DifferentFormula. Journal of Solid State Chemistry, 1988, 76,426-431[6] LeBail, A.; Hemon-Ribaud, A. & Courbion, G.: Structureof a-NaCaAlF 6 determ<strong>in</strong>ed ab <strong>in</strong>itio from conventionalpowder diffraction data. European Journal of Solid Stateand Inorganic Chemistry, 1998, 35, 265-272[7] Electrolytic Bath Standards, Alcan International Ltd.,Quebec, Canada (2005)[8] Ferret, F. R.: Breakthrough <strong>in</strong> Analysis of Electrolytic BathUs<strong>in</strong>g Rietveld-<strong>XRD</strong> Method.TMS2008: Annual Meet<strong>in</strong>g & Exhibition of the M<strong>in</strong>erals,Metals & Materials Society, 2008All configurations and specifications are subject tochange without notice. Order No. DOC-A88-EXS020.© 2008 Bruker AXS. Pr<strong>in</strong>ted <strong>in</strong> Germany.Bruker AXS GmbHKarlsruhe, GermanyPhone +49 (7 21) 5 95-28 88Fax +49 (7 21) 5 95-45 87<strong>in</strong>fo@bruker-axs.dewww.bruker-axs.deBruker AXS Inc.Madison, WI, USAPhone +1 (800) 234-XRAYPhone +1 (608) 276-3000Fax +1 (608) 276-3006<strong>in</strong>fo@bruker-axs.comwww.bruker-axs.com