

Archstone Chelsea - Open Hosting
Archstone Chelsea - Open Hosting
Archstone Chelsea - Open Hosting
- No tags were found...

Create successful ePaper yourself
Turn your PDF publications into a flip-book with our unique Google optimized e-Paper software.
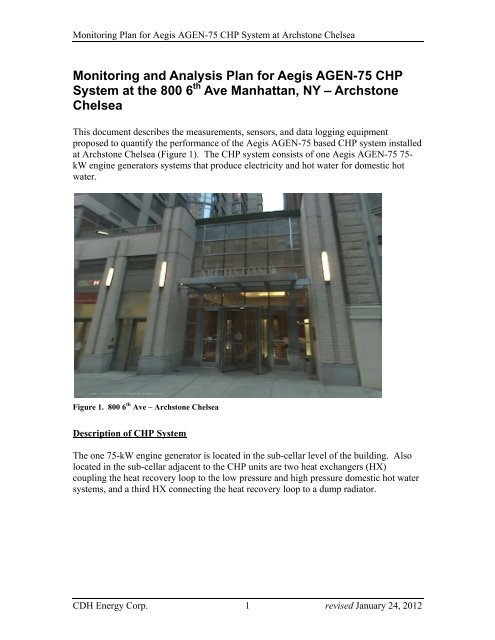
Monitoring Plan for Aegis AGEN-75 CHP System at <strong>Archstone</strong> <strong>Chelsea</strong>Monitoring and Analysis Plan for Aegis AGEN-75 CHPSystem at the 800 6 th Ave Manhattan, NY – <strong>Archstone</strong><strong>Chelsea</strong>This document describes the measurements, sensors, and data logging equipmentproposed to quantify the performance of the Aegis AGEN-75 based CHP system installedat <strong>Archstone</strong> <strong>Chelsea</strong> (Figure 1). The CHP system consists of one Aegis AGEN-75 75-kW engine generators systems that produce electricity and hot water for domestic hotwater.Figure 1. 800 6 th Ave – <strong>Archstone</strong> <strong>Chelsea</strong>Description of CHP SystemThe one 75-kW engine generator is located in the sub-cellar level of the building. Alsolocated in the sub-cellar adjacent to the CHP units are two heat exchangers (HX)coupling the heat recovery loop to the low pressure and high pressure domestic hot watersystems, and a third HX connecting the heat recovery loop to a dump radiator.CDH Energy Corp. 1 revised January 24, 2012
Monitoring Plan for Aegis AGEN-75 CHP System at <strong>Archstone</strong> <strong>Chelsea</strong>AGEN 75-kW Engine GeneratorHX-3 Dump RadiatorHX-1 and HX-2 Low and High Pressure HXFigure 2. <strong>Archstone</strong> <strong>Chelsea</strong> CHP SystemCDH Energy Corp. 2 revised January 24, 2012
Monitoring Plan for Aegis AGEN-75 CHP System at <strong>Archstone</strong> <strong>Chelsea</strong>Description of Monitored Data PointsTable 1 lists the monitored points required to characterize the performance of the CHPsystem. Each point is accompanied by the respective sensor and engineering unitmeasured.Table 1. Data Point ListNo. Data Point Description Units Sensor Output Notes1 WG1 Generator #1 Power/Energy kW/kWh Veris H8035‐0800‐3 Modbus Provided and Installed by CDH Energy2 FG Generator Gas Use CF Utility pulse output Pulse 1000 CF/pulse3 FL Heat Recovery Loop Flowrate GPM Onicon F1110 4‐20 mA Read from BPL Modicon PLC4 TLS Heat Recovery Loop Supply Temperature deg F BPL RTD TT173 n/a Read from BPL Modicon PLC5 TLR1 Heat Recovery Loop Return Temperature Leaving Load HXs deg F BPL RTD TT174 n/a Read from BPL Modicon PLC6 TLR2 Heat Recovery Loop Return Temperature Entering Dump HX deg F BPL RTD TT175 n/a Read from BPL Modicon PLC7 TLR3 Heat Recovery Loop Return Temperature Leaving Dump HX deg F BPL RTD TT176 n/a Read from BPL Modicon PLCPower Meters (WG1, WPAR)A power transducer measuring the gross engine electrical output is installed inside theengine control compartment. The power transducer takes the place of the powermonitoring from the Beckwith protection relay performed by the BPL Global PLC. Thegenerator power meter (WG1) is a Veris H8035-300, which provides a Modbus dataconnection to the data logger for continuous reporting of system power (kW) andaccumulated produced energy (kWh).Figure 3. Veris H8035-300 Power Meter Installed on Disconnect in Engine Control CabinetCDH Energy Corp. 3 revised January 24, 2012
Monitoring Plan for Aegis AGEN-75 CHP System at <strong>Archstone</strong> <strong>Chelsea</strong>No parasitic power (WPAR) power transducer is installed. One time readings of theparasitic loads were performed at the time of data system commissioning.Natural Gas Flow (FG)The natural gas meter for the CHP system is located in the sub-cellar level in a meteringroom. The CHP system gas consumption (FG) will be read using a utility supplied pulseinterface that provides a dry-contact switch closure for a fixed volume of gas at 1,000CF/pulse. The gas meter pulse output uses a dedicated twisted pair signal wire back todata logger.Figure 4. Utility Gas Pulse Output DemarcationHeat Recovery Calculations (FL, TLS, TLR1, TLR2, TLR3)The recovered heat from the CHP system is measured using a single flow meter (FL),and a series of cascading temperature differences, allowing for multiple heat transferstreams to be calculated.The flow meter output and temperature readings are all read by the BPL Global ModiconPLC (Modicon), and transferred via Modbus/TCP to the data logger every second. Thedata logger then averages the 1-second scan data and records 1-minute averages for flowand temperature readings, to be used for calculation of heat transfer offline. TheModicon is connected to the data logger via a CAT5e cable, through the router. Flow andtemperature sensors are wired directly to the Modicon.Temperature sensors TLS and TLR1 are insertion style probes inside thermowell fittings.Temperature sensors TLR2 and TLR3 are surface mount probes installed afterconstruction.Locations of the thermal metering equipment are shown on the piping diagram in Figure5.CDH Energy Corp. 4 revised January 24, 2012
Monitoring Plan for Aegis AGEN-75 CHP System at <strong>Archstone</strong> <strong>Chelsea</strong>TLSTLR1TLR2TLR3Useful Heat Recovery Temperature Sensors (TLS, TLR1)Dump HX Temperature Sensors (TLR2, TLR3)FLHeat Recovery Loop Flow Meter (FL)Figure 6. Heat Recovery SensorsCDH Energy Corp. 6 revised January 24, 2012
Monitoring Plan for Aegis AGEN-75 CHP System at <strong>Archstone</strong> <strong>Chelsea</strong>Data Logger Location and CommunicationThe data logger is an existing logger supplied by Constellation Energy, and has beenrepurposed for performance monitoring of the CHP system. The data loggercommunicates with the installed sensors via a mixture of Modbus RS-485, Modbus/TCP,and direct field point wiring.To facilitate the use of the Modicon PLC using Modbus/TCP, a router was installed tocreate a local network that also could communicate with internet connection provided by<strong>Archstone</strong>. The Modbus communication loop was configured for the following Modbusslave address on each device.Table 2. Modbus Communication Loop Device NumbersData Point Sensor Modbus Device NumberWG1 Veris H8035‐0300‐3 5 (Modbus RS‐485)FL Onicon F‐1110TLS BPL RTD TT173TLR1 BPL RTD TT174TLR2 BPL RTD TT175TLR3 BPL RTD TT176Note: Modbus device 1 is Beckwith relay at engine (not used)3(Modicon Modbus/TCP)A diagram of the system communication configuration is shown in Figure 7.CDH Energy Corp. 7 revised January 24, 2012
Monitoring Plan for Aegis AGEN-75 CHP System at <strong>Archstone</strong> <strong>Chelsea</strong><strong>Archstone</strong> Network/InternetCAT-5eBelkin RouterExternal IP: 10.136.13.133Internal IP: 10.0.116.1CAT-5eCAT-5eObvius AcqusuiteA881210.0.116.10BPL Modicon10.0.116.15MB/TCP #3Field Point WiringMB RS-485FGUtility Gas Pulser1000 CF/pulseInput #1Veris H8035-300MB #5WG1Onicon F1110Flowmeter4-20 mAFLBeckwith #1MB #1RTD TT173TLSRTD TT174TLR1RTD TT175TLR2RTD TT176TLR3Figure 7. Datalogger Communication ConfigurationCDH Energy Corp. 8 revised January 24, 2012
Monitoring Plan for Aegis AGEN-75 CHP System at <strong>Archstone</strong> <strong>Chelsea</strong>Data AnalysisThe collected data will be used to determine the net power output of the system as well asthe fuel conversion efficiency (FCE).Peak Demand or Peak kWThe peak electric output or demand for each power reading will be taken as the averagekW in a 1-minute interval, orGross Power (WG1) kW = kWh = kWh per intervalt1/60 hHeat Recovery RatesThe heat recovery rates will be calculated based on the 1-minute data recorded by thedata logger. The piping arrangement at this site requires uses a cascading temperaturedifference on a common loop flow for separate heat transfer rates to be determined withfour temperature sensors and one flow reading:Useful heat recovery (QHU) = K [FL(TLS-TLR1)] / nDumped heat recovery (QHD) = K [FL(TLR2-TLR3)] / nThe loop fluid is expected to be glycol water mixture, (K ~ 480 Btu/h-gpm-°F). ‘n’ is thenumber of scan intervals included in each recording interval (e.g., with 1-minute data,n=60).Parasitic LoadsThe parasitic electric loads on this system consists of six circulation pumps (four pumpsare redundant) and one dump radiator fan. No parasitic power transducer is installed.Parasitic power for the system is based on the following relation, developed from onetime handheld readings.Parasitic Energy (WPAR) = 1.17 kW continuously + 1.785 W / MBtu/h dumped at HXCalculated QuantitiesThe net power output from the CHP system will be defined as the power from the enginegenerators minus the parasitic power.The fuel conversion efficiency of the CHP system, based on the lower heating value ofthe fuel, will be defined as:CDH Energy Corp. 9 revised January 24, 2012
Monitoring Plan for Aegis AGEN-75 CHP System at <strong>Archstone</strong> <strong>Chelsea</strong>QHU t 3.412(WG WPAR)FCE LHV FGgas where: QHU - Useful heat recovery (Btu/h)WG - Engine generator gross output (kWh)WPAR - Parasitic energy (kWh)FG - Generator gas consumption (Std CF)t - 1/60 for 1-minute dataLHV gas - Lower heating value for natural gas (~920 Btu per CF).The FCE can be calculated for any time interval. When converting to daily, monthly, orannual values, each value is summed and then the following formula is applied:FCE NQHU t 3.412 LHVgasNN( WG WPAR)Where N is equal to the number of intervals in the period of interest.Data Logging EquipmentFGThe data logging system will be based around the Obvius AquiSuite A8812 data logger.The logger has eight analog or digital inputs on the main board, and monitoringcapabilities can be extended using expansion boards. The primary sensor connectionconfiguration for the logger is a two-wire twisted pair network, that reduces the numberof low voltage sensor wire runs. The logger has 32 MB of onboard RAM for dataretention. The logger is equipped with both a 10/100 LAN port and an analog phonemodem for remote data retrieval.LoggerRouterModiconObvius AcquiSuiteFigure 8. Obvious AcquiSuite Data LoggerCDH Energy Corp. 10 revised January 24, 2012
Monitoring Plan for Aegis AGEN-75 CHP System at <strong>Archstone</strong> <strong>Chelsea</strong>The data logger is configured to supply data to the CDH Energy servers, as well as to theConstellation Energy C-Power servers, every 15-minutes. The internet connectionprovided by <strong>Archstone</strong> is not configured to allow inbound connections to the data loggerfrom the internet at large. CDH Energy is not able to access the logger for remoteconfiguration purposes.Each night CDH Energy collects the data provided and data are automatically loaded intothe database system here at CDH Energy, where a number of automated data verificationroutines will identify any suspect data. Verification routines will consist of range checks,where the data are compared to a preset range of value, and data exceeding these valueswill be flagged; and/or relational checks, where the data are compared to the operationalstate of the unit for validity, such as “Are the engines consuming gas while producingpower?” Data that fails the verification routines will be checked manually by CDHpersonnel on a daily basis, and corrupt data will be removed from the database.All data collected are converted to hourly data in a comma delimited CSV formatconsistent with the requirements for inclusion into the NYSERDA integrated data systemwebsite.All sensors are scanned on the order of once per second, and these samples will becombined into 1-minute averages (for analog data) and totals (for digital data). Thelogger has sufficient memory to hold up to 30-days of data without overwriting the loggermemory.All data logging equipment is installed in or at the Connected Energy/BPL Globalenclosure mounted inside the sub-cellar mechanical room, adjacent to the enginegenerator.Other Monitoring Requirements and IssuesThe data logger itself is provided by Constellation Energy. Any failure of the logger willbe directed to NYSERDA and Constellation within 48-hours of detection.The Modicon PLC is provided by BPL Global. If the Modicon fails, the flow meter canbe wired directly on the data logger inputs, but the temperature sensors will need to bereplaced with thermistors compatible with the Obvius datalogger. Existing wire pulls forthe temperature sensors can be reused.CDH Energy will not provide service on the data logger hardware itself, or any sensors orthe Modicon PLC installed by BPL Global.Sensor SelectionCut sheets for the known data logging equipment and sensors are attached. Noinformation is available on the RTDs used by BPL Global.CDH Energy Corp. 11 revised January 24, 2012
Monitoring Plan for Aegis AGEN-75 CHP System at <strong>Archstone</strong> <strong>Chelsea</strong>Sensor VerificationDuring the January 11, 2012 site visit, system temperatures were verified for location onthe system piping as well as for accuracy against a Fluke Model 51II F handheldtemperature probe. All temperature sensors were on the order of ±2° from the handheldprobe, and with the location of the temperature sensors established via tracing wires, thereadings from the Modicon were deemed accurate.Table 3. Temperature Verification – Modicon Readout vs HandheldData Modicon Fluke DifferencePoint (F) (F) (F)TLS 217.0 216.8 0.2TLR1 200.8 198.7 2.1TLR2 186.1 187.3 ‐1.2TLR3 166.5 168.9 ‐2.4250<strong>Archstone</strong> <strong>Chelsea</strong> - Heat Recovery Temperatures200Temperature (F)15010050Supply (TLS)Return (TLR1)00: 12: 0: 12: 0: 12: 0: 12: 0: 12: 0: 12:11 12 13 14 15 16January2012Figure 9. Heat Recovery Temperature Trend – Load HXsCDH Energy Corp. 12 revised January 24, 2012
Monitoring Plan for Aegis AGEN-75 CHP System at <strong>Archstone</strong> <strong>Chelsea</strong>250<strong>Archstone</strong> <strong>Chelsea</strong> - Heat Recovery Temperatures200Temperature (F)15010050Return Entering Dump HX (TLR2)Return Leaving Dump HX (TLR3)00: 12: 0: 12: 0: 12: 0: 12: 0: 12: 0: 12:11 12 13 14 15 16January2012Figure 10. Heat Recovery Temperature Trend – Dump HXHeat recovery flow rate was not verified, but the rate observed appeared reasonable basedon the high heat recovery supply temperatures observed (approximately 230°F). Heatrecovery flow is typically 14 GPM during engine operation, and the signal drops off to 10GPM and below when the engine shuts down.15<strong>Archstone</strong> <strong>Chelsea</strong> - Heat Recovery Flow (FL)10Flow (gpm)500: 12: 0: 12: 0: 12: 0: 12: 0: 12: 0: 12:11 12 13 14 15 16January2012Figure 11. Heat Recovery Flow TrendGas use data from the utility pulse output appears reasonable given the coarse resolutionof the data (1,000 CF/pulse). The typical rate when the engine is operating is 1,000 CFH,consistent with the approximately nominal rating of the engine (865 CFH).CDH Energy Corp. 13 revised January 24, 2012
Monitoring Plan for Aegis AGEN-75 CHP System at <strong>Archstone</strong> <strong>Chelsea</strong>2000<strong>Archstone</strong> <strong>Chelsea</strong> - Gas Use Trend1500Gas Use (CF/h)100050000: 12: 0: 12: 0: 12: 0: 12: 0: 12: 0: 12:11 12 13 14 15 16January2012Figure 12. Engine Gas Use TrendParasitic power was measured for all pump and dump radiator fan loads on the AegisCogen Control Panel (CCP-1) main electrical service. Power was measured with, andwithout, the dump radiator running using an Extech 380940 power meter.Figure 13. CCP-1 Containing All Parasitic LoadsCDH Energy Corp. 14 revised January 24, 2012
Monitoring Plan for Aegis AGEN-75 CHP System at <strong>Archstone</strong> <strong>Chelsea</strong>Table 4. Parasitic Power ReadingsCCP-1 PanelPumps ON,Dump HX Fan OffPumps ON,Dump HX Fan @ 40%, 50°Ftemperature difference acrossdump HXAmps @ 208 VAC(A/B/C)Power(kW)3.6 / 3.7 / 3.6 1.17 kW5.8 / 5.9 / 6.0 1.79 kWHeat rejection at time of 0.480 x 14 GPM x 50°F = 336 MBtu/h dumpedreadingsEstimated Fan Power 1.79 kW – 1.17 kW = 600 W / 336 MBtu/h= 1.785 W / MBtu/h dumpedEngine power was verified using a Fluke 39 hand held probe, and the output from theBeckwith relay installed in the engine generator control compartment. The Beckwithrelay can be accessed on the front serial port using the IPScom software.Table 5. Engine Power VerificationEngine PowerReadingAmps @ 208 VAC(A/B/C)Power(kW)Fluke 3948 + 22 = 70 kW (L → L)225 / 224 / 22123 + 23 + 23 = 69 kW (L → N)Veris H8035 n/a 70.8 kWBeckwith(Serial port reading usingIPScom software)71.3 kWThe power transducer was installed at 9:00 AM on January 23, 2012. The generatorgross output was observed to vary from its set point of 70 kW down to 40 kW. Thegenerator is scheduled to shut down at 11:00 PM and restart at 4:30 AM.CDH Energy Corp. 15 revised January 24, 2012
Monitoring Plan for Aegis AGEN-75 CHP System at <strong>Archstone</strong> <strong>Chelsea</strong>80<strong>Archstone</strong> <strong>Chelsea</strong> - Generator Gross Power Trend60Power (kW)4020020: 0: 4: 8: 12: 16: 20: 0: 4: 8: 12: 16: 20: 0:22 23 24 25January2012Figure 14. Generator Gross Power TrendSystem Energy FlowsSystem energy and thermal flows documented in data analysis section.Data Collection StatusThe data logger system was configured on January 11, 2012 and is providing data toCDH Energy. The power transducer for the engine generator was installed January 23,2012.CDH Energy Corp. 16 revised January 24, 2012
Ae g e n Th e r m o Po w e r TP-75The AEGEN THERMOPOWER 75 is a compact, modular combined heat andpower (CHP) system producing 75 kW of power and 5.23 therms of heat per hour. Athree-way non-selective catalyst reduction (NSCR) emissions control package includes acatalytic converter and temperature and oxygen controls designed to reduce emissionsof nitrogen oxide, carbon monoxide, and hydrocarbons. The CHP module has a naturalgas-fired reciprocating engine, an induction generator, heat recovery system, a soundattenuating enclosure, electrical switchgear, and solid-state controls for automatic andunattended operation. High efficiency heat recovery components consist of oil cooler,engine jacket for heat transfer, marine type exhaust gas manifolds and exhaust gas heatexchangers. The AEGEN THERMOPOWER 75 operates in parallel with existing mechanical andelectrical systems in the facility. The module includes an advanced utility-grade relay (U.L., C.S.A.,and C.E. listed or certified) for electrical protection and redundancy as standard equipment.Features7 Reliable, proven technology7 Highly efficient7 Environmentally sound with low emissions7 Quiet operation7 Modular – scaleable into larger systems7 Compact – easily fits in most buildings7 Indoor or outdoor installation7 Ease of installation – no business disruption7 U. L. listed7 Remote monitoring and control7 Digital display and user-friendly interface7 Infinite system life with maintenance program7 Electric and thermal load following7 Modbus compatible for networking with building automation systemsAEGIS GENERATOR COMPANYGENCOAEGIS GENERATOR COMPANY55 Jackson Street, Holyoke, MA 01040 • (413) 536-1156 • (413) 536-1104 (fax)Website: www.AegisEnergyServices.com • Email: Aegis@AegisEnergyServices.com
MODELSInductionSynchronousCharacteristicTP-75TP-75 LETPS-75TPS-75 LEElectrical Power Output75 kW75 kW75 kW75 kWThermal Output484,000 Btus/hour523,000 Btus/hour484,000 Btus/hour523,000 Btus/hourG as Input865 standard cubic feet per hour (scfh) 930 standard cubic feet per hour (scfh) 865 standard cubic feet per hour (scfh) 9 30 standard cubic feet per hour (scfh)Required Gas pressure 4 to 10 inches water column 10 to 14 inches water column 4 to 10 inches water column 10 to 14 inches water columnE fficiency83.9%. at HHV of 1,020 Btus/scf82.1%. at HHV of 1,020 Btus/scf83.9%. at HHV of 1,020 Btus/scf82.1%. at HHV of 1,020 Btus/scfMax Output Water Temperature230° FWeight3,050 poundsSuspensionVibration isolation mountsDimension46" width x 89' length x 49" heightAcoustic Level (enclosed)70 decibels (dba) from 20 feet awayOutput Voltage208V or 460V nominal, 3 Phase, 3-wireEmissionsEach Aegen Thermo power model meets stringent air quality standards and requirmentsAEGIS GENERATOR COMPANYGENCOAEGIS GENERATOR COMPANY55 Jackson Street, Holyoke, MA 01040 • (413) 536-1156 • (413) 536-1104 (fax)Website: www.AegisEnergyServices.com • Email: Aegis@AegisEnergyServices.com
Monitoring Plan for Aegis AGEN-75 CHP System at <strong>Archstone</strong> <strong>Chelsea</strong>APPENDIX A – Data Logger and Sensor Cut SheetsCDH Energy Corp. 17 revised January 24, 2012
A8812 AcquiSuite DR Data Acquisition ServerApplications• Demand response program control and reporting• Cost allocation to tenants and third parties• Measurement & verification of energy savings• Data center branch circuit monitoring• Monitoring performance of building systems (e.g., chillers,boilers, fans)Easy installation saves time and moneyDescriptionObvius, the leader in cost effective data acquisition andwireless metering solutions introduces the all-new A8812-xAcquiSuite DR data acquisition server, providing highperformance and low cost for:• Demand response programs• Benchmarking building operations performance• Verification of energy savings and utility costs• Cost allocation to departments or tenants• Internet based supervisory control outputsThe system combines the flexibility of choosing LAN,modem or cellular communication paths with the lowesttotal installed cost for logging building data such as:• Electrical, gas and water usage and costs• Indoor and outdoor temperatures• Pressure, humidity, CO2• Industry standard pulse or analog inputsAcquiSuite brings “plug and play” capability to the dataacquisition market, dramatically reducing the time andtraining required to put a typical building on line. In mostapplications, the installation can be done by the buildingengineer or contractor in less than 2 hours. The systemautomatically detects and configures Modbus devices in justseconds reducing installation time and costs.• Simple “plug and play” connectivity to standard Modbusmeters minimizes installation time and costs• “Flex” I/O inputs provide easy connections for analog, pulseand resistance sensors• Integrated relay outputs allow supervisory control from anylocation for load shedding or local generation• Integrated web server provides setup and configuration usingany industry standard web browser (i.e., Netscape orInternet Explorer)AcquiSuite Framework lets users add Modbus devices• Allows users a simple means to add Modbus devices notsupported by AcquiSuite plug and play drivers• Driver templates can be stored and shared with multipleAcquiSuites• Simple web-based interface makes the process easyInternet display of key building parameters• Buildingmanageronline.com allows authorized users to seebuilding performance data in an easy to use graphical format• BMO site provides storage, display and downloads ofhistorical data in a secure SQL database• Users can be notified of alarm conditions in any or allmonitored points• <strong>Open</strong> protocols provide connectivity to any energymanagement or building automation softwareFlexible communications and wireless connectivity• All data is stored at the site in nonvolatile memory, insuringprotection of valuable information in the event of power loss• Optional on-board ModHopper (R9120-x) for wireless RS485 communications (consult factory)• A8812-1 provides two communication options: Local AreaNetwork (LAN) or phone line• A8812-GSM replaces the standard phone modem with aGSM/GPRS modem for cellular data transfer
SPECIFICATIONSProcessor Main processor: ARM 9 ; I/O co-processor: ARM 7Operating System Linux 2.6Flash ROM16 MB NOR Flash (expandable with USB memory device)Memory32 MB RAMLED8x pulse input, 4 modem activity, Modbus TX/RX, power statusConsole2 x 16 LCD character, two buttonsLAN10/100, Auto crossover detectionModem (phone) V.34 bis, 33,600 bps (Part number A8812-1)Modem (cellular) GSM/GPRS Class10, 85 kbps (Part number A8812-GSM)ProtocolsModbus/RTU, Modbus/TCP, TCP/IP, PPP, HTTP/HTML, FTP,SNMP, SMTP, XMLPower Supply24 VDC, includedSerial PortRS-485 ModbusApprovalsCE; FCC Part 15, Class AUSB portUSB memory expansion portPower Requirement 110-120VACInterval recording User selectable 1-60 minutes. Default 15 minute interval.OutputsInputs2x, Dry contact 30 VDC, 150 mA max8x, user selectable:• 0-10 V - Min/Max/Ave/Instantaneous• 4-20 mA - Min/Max/Ave/Instantaneous• Pulse - Consumption, Rate• Resistance - Min/Max/Ave/Instantaneous• Runtime - Runtime, Status
• F-1110 SINGLE TURBINE •INSERTION FLOW METERANALOG OUTPUTMade in the USADESCRIPTIONONICON insertion turbine flow meters aresuitable for measuring electrically conductivewater-based liquids. The F-1110 model providesnon-isolated 4-20 mA and 0-10 V analog outputsignals that are linear with the flow rate.APPLICATIONS• Closed loop chilled water, hot water, condenserwater & water/glycol/brine solutions for HVAC• Process water & water mixtures• Domestic waterGENERAL SPECIFICATIONSACCURACY± 0.5% of reading at calibrated velocity± 1% of reading from 3 to 30 ft/s (10:1 range)± 2% of reading from 0.4 to 20 ft/s (50:1 range)SENSING METHODElectronic impedance sensing(non-magnetic and non-photoelectric)PIPE SIZE RANGE1¼” through 72” nominal diameterSUPPLY VOLTAGE24 ± 4 V AC/DC at 50 mALIQUID TEMPERATURE RANGEStandard: 180° F continuous, 200° F peakHigh Temp: 280° F continuous, 300° F peakMeters operating above 250° F require 316 SSconstruction optionAMBIENT TEMPERATURE RANGE-5° to 160° F (-20° to 70° C)OPERATING PRESSURE400 PSI maximumPRESSURE DROPLess than 1 PSI at 20 ft/s in 1½” pipe,decreasing in larger pipes and lower velocitiesOUTPUT SIGNALS PROVIDEDAnalog Outputs (non-isolated)Voltage output: 0-10 V (0-5 V available)Current output: 4-20 mAFrequency Output0 – 15 V peak pulse, typically less than 300 Hz(continued on back)CALIBRATIONEvery ONICON flow meter is wet calibratedin a flow laboratory against primary volumetricstandards that are directly traceable to N.I.S.T.A certificate of calibration accompanies everymeter.FEATURESUnmatched Price vs. Performance - Customcalibrated, highly accurate instrumentationat very competitive prices.Excellent Long-term Reliability - Patentedelectronic sensing is resistant to scale andparticulate matter. Low mass turbines withengineered jewel bearing systems provide amechanical system that virtually does notwear.Industry Leading Two-year “No-fault” Warranty -Reduces start-up costs with extended coverageto include accidental installation damage(miswiring, etc.) Certain exclusions apply. Seeour complete warranty statement for details.Simplified Hot Tap Insertion Design -Standard on every insertion flow meter.Allows for insertion and removal by handwithout system shutdown.OPERATING RANGE FORCOMMON PIPE SIZES0.17 TO 20 ft/s±2% accuracy begins at 0.4 ft/sPipe Size (Inches) Flow Rate (GPM)1 ¼ 0.8 - 951 ½ 1 - 1302 2 - 2102 ½ 2.5 - 2303 4 - 4604 8 - 8006 15 - 1,8008 26 - 3,10010 42 - 4,90012 60 - 7,05014 72 - 8,60016 98 - 11,40018 120 - 14,60020 150 - 18,10024 230 - 26,50030 360 - 41,90036 510 - 60,9001500 North Belcher Road, Clearwater, FL 33765 • Tel (727) 447-6140 • Fax (727) 442-56990213-1 www.onicon.com • sales@onicon.com09-09
SCROLL RESET PROGRAMF-1110 SPECIFICATIONS cont.MATERIALWetted metal components:Standard: Electroless nickel plated brassOptional: 316 stainless steelELECTRONICS ENCLOSUREStandard: Weathertight aluminum enclosureOptional: Submersible enclosureELECTRICAL CONNECTIONS3-wire for frequency outputStandard: 10’ of cable with ½” NPTconduit connectionOptional: Indoor DIN connector with 10’of plenum rated cableALSO AVAILABLEF-1110 Wiring InformationWIRE COLOR DESCRIPTION NOTESREDBLACKGREENBLUEBROWN(+) 24 V AC/DCsupply voltage, 50 mA(-) Common ground(Common with pipe ground)(+) Frequency output signal:0-15 V peak pulse(+) Analog signal:4-20 mA (non-isolated)(+) Analog signal:0-10 V (non-isolated)Connect to power supplypositiveConnect to power supplynegative & analog inputgroundRequired when meter isconnected to local displayor Btu meterBoth signals may be usedindependently.F-1110 Wiring DiagramFlow meter into control system (no display or Btu meter)10 3/4”REDBLACK••PowerSource• + 24 V• COMBLUEBROWN•• ORControl System• SIGNAL GROUND• ANALOG SIGNAL INPUTDisplay Modules6”Btu MeasurementSystemsNOTE:1. Black wire is common with the pipe ground(typically earth ground).2. Frequency output required for ONICON display moduleor Btu meter, refer to wiring diagram for peripheral device.Typical Meter Installation(New construction or scheduled shutdown)• Acceptable to install in vertical pipe• Position meter anywhere in upper 240°for horizontal pipeTHIS AREA ACCEPTABLEHorizontal Run PipeOptional To control outputsignal(s) systemtocontrol systemONICONdisplay orBTU meter(Optional)Connect factory wiresto field wires in appropriatejunction box.NOTE: Installation kits vary basedon pipe material and application.For installations in pressurized(live) systems, use “hot tap”1¼” installation kit and drill holeusing a 1” wet tap drill.½” FNPTconduit connectionInsertion depthgage providedwith each meterMinimum hole size = 1”Must be centeredDetail of hot tap adapterwith turbine assemblywithdrawnStandard installationkit for steel pipe1” full port ball valve1” close nipple1” branch outletFLOW1¼” forhot tapCLEARANCEREQUIREDFOR INSTALLATIONTypically30” - 36”depending on pipesize and height ofvalve assembly.0213-11500 North Belcher Road, Clearwater, FL 33765 • Tel (727) 447-6140 • Fax (727) 442-5699www.onicon.com • sales@onicon.com 09-09
POWER/ENERGY MONITORINGEnercept® Networked PowerTransducers (Modbus® RTU)Integral Monitoring Solution Eliminates TheNeed For Separate EnclosuresAPPLICATIONS Energy managing & performance contracting Monitoring for commercial tenants Activity-based costing in commercial and industrial facilities Real-time power monitoringFEATURESThe world’s most cost-effective power transducer Monitor energy parameters (kW, kWh, kVAR, PF, Amps, Volts) at up to 63 locationson a single RS-485 network...greatly reduces wiring time and cost Fast split-core installation eliminates the need to remove conductors...savestime and labor Precision electronics and current transformers in a single package...reduces thenumber of installed components...huge labor savings Smart electronics eliminate CT orientation concerns...fast trouble-free installationHigh accuracy ±1% total system accuracy, (10% to 100% of CT rating)DESCRIPTIONU.S. Patent No. 6,373,238H8035Year5 WarrantyThe Enercept H8035/8036 are innovative three-phase networked (Modbus RTU)power transducers that combine measurement electronics and high accuracyindustrial grade CTs in a single package. The need for external electrical enclosures iseliminated, greatly reducing installation time and cost.There are two application-specific platforms to choose from. The Basic Enerceptenergy transducers (H8035) are ideal for applications where only kW and kWh arerequired. The Enercept Enhanced power transducers (H8036) output 26 variablesincluding kW, kWh, volts, amps, and power factor, making them ideal for monitoringand diagnostics.Color-coordination between voltage leads and CTs makes phase matching easy.Additionally, the Enercept automatically detects and compensates for phase reversal,eliminating the concern of CT load orientation. Up to 63 Enercepts can be daisychainedon a single RS-485 network.SPECIFICATIONSInputs:Voltage Input 208 to 480VAC, 50/60 Hz RMS †(††)Current Input Up to 2400A continuous per phase †Accuracy:System Accuracy±1% of reading from 10% to 100% of the rated current of the CTs, accomplished by matching the CTs with electronics and calibrating them as a systemOutputs:TypeModbus RTU**(*)Baud Rate9600, 8N1 formatConnectionRS-485, 2-wire + shieldEnvironmental:Operating Temperature Range0° to 60°C (32° F to 140°F), 50°C (122°F) for 2400AHumidity Range0 - 95% non-condensingUL, approved for California CSI Solar applications (check the CSI Solar website for model numbers)** Detailed protocol specifications are available at: http://www.veris.com/modbus* Other protocols available. Please consult factory.† Contact factory to interface for voltages above 480VAC or current above 2400 Amps.†† Do not apply 600V Class current transformers to circuits having a phase-to-phase voltage greater than 600V, unless adequate additional insulation is applied between the primary conductor and thecurrent transformers. Veris assumes no responsibility for damage of equipment or personal injury caused by products operated on circuits above their published ratings.800.354.8556 +1 503.598.4564 www.veris.com ©2010 Veris Industries07101
APPLICATION/WIRING EXAMPLES208 or 480VAC 3Ø, Installation240VAC 1Ø, 3-Wire InstallationØBØB120NØAØA120Yellow Voltage Lead cappedØCAdditional modbus devicesDIMENSIONAL DRAWINGSTo additionalModbus Devices(RS 485)DATA OUTPUTSYellow Label CTBABABACCCDDEDFEFEFSMALL100/300 AmpA = 3.8" (96 mm)B = 1.2" (30 mm)C = 1.3" (31 mm)D = 1.2" (30 mm)E = 4.0" (100 mm)F = 4.8" (121 mm)MEDIUM400/800 AmpA = 4.9" (125 mm)B = 2.9" (73 mm)C = 2.5" (62 mm)D = 1.2" (30 mm)E = 5.2" (132 mm)F = 5.9" (151 mm)LARGE800/1600/2400 AmpA = 4.9" (125 mm)B = 5.5" (139 mm)C = 2.5" (62 mm)D = 1.2" (30 mm)E = 7.9" (201 mm)F = 6.0" (151 mm)H8035kWhkWH8036kWh, ConsumptionkW, Real PowerkVAR, Reactive PowerkVA, Apparent PowerPower FactorAverage Real PowerMinimum Real PowerMaximum Real PowerVoltage, L-LVoltage, L-N*Amps, Average CurrentkW, Real Power ØA*kW, Real Power ØB*kW, Real Power ØC** Based on derived neutral voltage.POWER/ENERGY MONITORINGORDERING INFORMATIONModbus Basic Power Transducers*MODEL MAX. AMPS CT SIZEH8035-0100-2 100 SMALLH8035-0300-2 300 SMALLH8035-0400-3 400 MEDIUMH8035-0800-3 800 MEDIUMH8035-0800-4 800 LARGEH8035-1600-4 1600 LARGEH8035-2400-4 2400 LARGE*H8035 models work with H8920-5 LON nodesModbus Enhanced Data Stream Power Transducers*MODEL MAX. AMPS CT SIZEH8036-0100-2 100 SMALLH8036-0300-2 300 SMALLH8036-0400-3 400 MEDIUMH8036-0800-3 800 MEDIUMH8036-0800-4 800 LARGEH8036-1600-4 1600 LARGEH8036-2400-4 2400 LARGE*H8036 models work with H8920-1 LON nodesACCESSORIESCT Mounting brackets (AH06)H8920 Series LON nodes800.354.8556 +1 503.598.4564 www.veris.com ©2010 Veris Industries07101
Monitoring Plan for Aegis AGEN-75 CHP System at <strong>Archstone</strong> <strong>Chelsea</strong>APPENDIX B – Data Logger Wiring Diagrams andModbus Register MapsCDH Energy Corp. 34 revised January 24, 2012
Instrumentation, Wiring Schematic, and Installation DetailsSite VisitsJanuary 11, 2012January 23, 2012Initial site visit, data logger commissioningEngine generator power transducer installedDescription of Monitored Data Points and SchematicsTable B-1 lists the monitored points installed at the site.Table B-1. Monitored Data Point ListNo. Data Point Description Units Sensor Output Notes1 WG1 Generator #1 Power/Energy kW/kWh Veris H8035‐0800‐3 Modbus Provided and Installed by CDH Energy2 FG Generator Gas Use CF Utility pulse output Pulse 1000 CF/pulse3 FL Heat Recovery Loop Flowrate GPM Onicon F1110 4‐20 mA Read from BPL Modicon PLC4 TLS Heat Recovery Loop Supply Temperature deg F BPL RTD TT173 n/a Read from BPL Modicon PLC5 TLR1 Heat Recovery Loop Return Temperature Leaving Load HXs deg F BPL RTD TT174 n/a Read from BPL Modicon PLC6 TLR2 Heat Recovery Loop Return Temperature Entering Dump HX deg F BPL RTD TT175 n/a Read from BPL Modicon PLC7 TLR3 Heat Recovery Loop Return Temperature Leaving Dump HX deg F BPL RTD TT176 n/a Read from BPL Modicon PLCFigure B-1 displays the data logger termination diagram.
Obvius Acquisite A8812 - 1 Data LoggerInput Terminals(+) 24VDCIN1GRedBlackFGGenerator Gas UseUtility Meter Pulser1000 CF/Pulse(+) 24VDCIN2G(+) 24VDCIN3G(+) 24VDCIN4G(+) 24VDCIN5G(+) 24VDCIN6G(+) 24VDCIN7G(+) 24VDCIN8GRS-485 +RS-485 -Modbus Device Loop2 total devicesWG1, Beckwith (not used)ShieldFigure B-1. Obvius Data Logger Wiring Schematic


