Annual report on form 20F 2006 - Unilever
Annual report on form 20F 2006 - Unilever
Annual report on form 20F 2006 - Unilever

You also want an ePaper? Increase the reach of your titles
YUMPU automatically turns print PDFs into web optimized ePapers that Google loves.
Disclaimer<br />
Notes to the <str<strong>on</strong>g>Annual</str<strong>on</strong>g> Report and Accounts <strong>on</strong> Form 20-F This PDF versi<strong>on</strong> of the <strong>Unilever</strong><br />
<str<strong>on</strong>g>Annual</str<strong>on</strong>g> Report and Accounts <strong>2006</strong> <strong>on</strong> Form 20-F is an exact copy of the document filed<br />
with the SEC at www.sec.gov.<br />
Certain secti<strong>on</strong>s of the <strong>Unilever</strong> <str<strong>on</strong>g>Annual</str<strong>on</strong>g> Report and Accounts <strong>2006</strong> <strong>on</strong> Form 20-F have<br />
been audited. Secti<strong>on</strong>s that have been audited are set out <strong>on</strong> pages 70 to 140 and 147<br />
to 148. The auditable part of the <str<strong>on</strong>g>report</str<strong>on</strong>g> of the Remunerati<strong>on</strong> Committee as set out <strong>on</strong><br />
page 49 has also been audited.<br />
The maintenance and integrity of the <strong>Unilever</strong> website is the resp<strong>on</strong>sibility of the Directors;<br />
the work carried out by the auditors does not involve c<strong>on</strong>siderati<strong>on</strong> of these matters.<br />
Accordingly, the auditors accept no resp<strong>on</strong>sibility for any changes that may have occurred<br />
to the financial statements since they were initially placed <strong>on</strong> the website.<br />
Legislati<strong>on</strong> in the United Kingdom and the Netherlands governing the preparati<strong>on</strong> and<br />
disseminati<strong>on</strong> of financial statements may differ from legislati<strong>on</strong> in other jurisdicti<strong>on</strong>s.<br />
Disclaimer Except where you are a shareholder, this material is provided for in<strong>form</strong>ati<strong>on</strong><br />
purposes <strong>on</strong>ly and is not, in particular, intended to c<strong>on</strong>fer any legal rights <strong>on</strong> you.<br />
This <str<strong>on</strong>g>Annual</str<strong>on</strong>g> Report and Accounts <strong>on</strong> Form 20-F does not c<strong>on</strong>stitute an invitati<strong>on</strong> to invest<br />
in <strong>Unilever</strong> shares. Any decisi<strong>on</strong>s you make in reliance <strong>on</strong> this in<strong>form</strong>ati<strong>on</strong> are solely your<br />
resp<strong>on</strong>sibility.<br />
The in<strong>form</strong>ati<strong>on</strong> is given as of the dates specified, is not updated, and any forward-looking<br />
statements are made subject to the reservati<strong>on</strong>s specified <strong>on</strong> the final page of the Report.<br />
<strong>Unilever</strong> accepts no resp<strong>on</strong>sibility for any in<strong>form</strong>ati<strong>on</strong> <strong>on</strong> other websites that may be<br />
accessed from this site by hyperlinks.
<strong>2006</strong> <str<strong>on</strong>g>Annual</str<strong>on</strong>g> Report <strong>on</strong> Form 20-F
At a glance<br />
Turnover (€ milli<strong>on</strong>)<br />
C<strong>on</strong>tinuing operati<strong>on</strong>s<br />
<strong>2006</strong><br />
2005<br />
2004<br />
Operating margin (%)<br />
C<strong>on</strong>tinuing operati<strong>on</strong>s<br />
<strong>2006</strong><br />
2005<br />
2004<br />
Dividends<br />
Per Ordinary €0.16 share of<br />
<strong>Unilever</strong> N.V. (€)<br />
<strong>2006</strong><br />
2005<br />
2004<br />
Per €0.16 New York Registry share of<br />
<strong>Unilever</strong> N.V. ($)<br />
<strong>2006</strong><br />
2005<br />
2004<br />
10.7<br />
39 642<br />
38 401<br />
37 168<br />
13.6<br />
13.2<br />
0.70<br />
0.66<br />
0.63<br />
0.9037<br />
0.8251<br />
0.8084<br />
Operating profit (€ milli<strong>on</strong>)<br />
C<strong>on</strong>tinuing operati<strong>on</strong>s<br />
In additi<strong>on</strong> to the dividends shown above, <strong>on</strong>e-off dividends of the following amounts per share were paid in December <strong>2006</strong>:<br />
€0.26 per ordinary NV share; 17.66p per ordinary PLC share; $0.3316 per NV New York Registry share; and $0.3372 per PLC American<br />
Depositary Receipt.<br />
The dividend and earnings per share in<strong>form</strong>ati<strong>on</strong> given above, including comparative amounts for prior years, is expressed in terms of<br />
the nominal share values which have applied since 22 May <strong>2006</strong>, following the split of NV shares and the c<strong>on</strong>solidati<strong>on</strong> of PLC shares<br />
which were approved at the <strong>2006</strong> AGMs.<br />
Dividend figures for each year comprise dividends declared or proposed for that year. Under Internati<strong>on</strong>al Financial Reporting Standards<br />
(IFRS), dividends are <strong>on</strong>ly recorded against the year in which they become payable.<br />
Actual dividends payable for <strong>2006</strong> <strong>on</strong> <strong>Unilever</strong> N.V. New York Registry Shares and American Depositary Receipts of <strong>Unilever</strong> PLC may<br />
differ from those shown above, which include final dividend values calculated using the rates of exchange ruling <strong>on</strong> 7 February 2007<br />
(€1.00 = $1.2987, £1 = $1.9718).<br />
The term ‘shares’ as used in this document should, with respect to shares issued by <strong>Unilever</strong> N.V., be c<strong>on</strong>strued to include depositary<br />
receipts for shares issued by Foundati<strong>on</strong> <strong>Unilever</strong> NV Trust Office, unless the c<strong>on</strong>text otherwise requires or unless it is clear from the<br />
c<strong>on</strong>text that this is not the case. For further in<strong>form</strong>ati<strong>on</strong> please refer to page 41.<br />
<strong>2006</strong><br />
2005<br />
2004<br />
Earnings per share (€)<br />
Total operati<strong>on</strong>s<br />
<strong>2006</strong><br />
2005<br />
2004<br />
Per Ordinary 3 1 /9p share of<br />
<strong>Unilever</strong> PLC (pence)<br />
<strong>2006</strong><br />
2005<br />
2004<br />
<strong>2006</strong><br />
2005<br />
2004<br />
0.94<br />
3 981<br />
1.29<br />
Per 3 1 /9p American Depositary Receipt of<br />
<strong>Unilever</strong> PLC ($)<br />
5 408<br />
5 074<br />
1.65<br />
47.66<br />
45.13<br />
42.56<br />
0.9300<br />
0.8238<br />
0.7952
The <strong>Unilever</strong> Group<br />
<strong>Unilever</strong> N.V. (NV) is a public limited company registered in the Netherlands, which<br />
has listings of shares and depositary receipts for shares <strong>on</strong> Eur<strong>on</strong>ext Amsterdam and<br />
of New York Registry Shares <strong>on</strong> the New York Stock Exchange.<br />
<strong>Unilever</strong> PLC (PLC) is a public limited company registered in England and Wales<br />
which has shares listed <strong>on</strong> the L<strong>on</strong>d<strong>on</strong> Stock Exchange and, as American Depositary<br />
Receipts, <strong>on</strong> the New York Stock Exchange.<br />
The two parent companies, NV and PLC, together with their group companies,<br />
operate as a single ec<strong>on</strong>omic entity (the <strong>Unilever</strong> Group, also referred to as <strong>Unilever</strong><br />
or the Group). NV and PLC and their group companies c<strong>on</strong>stitute a single <str<strong>on</strong>g>report</str<strong>on</strong>g>ing<br />
entity for the purposes of presenting c<strong>on</strong>solidated accounts. Accordingly, the accounts<br />
of the <strong>Unilever</strong> Group are presented by both NV and PLC as their respective<br />
c<strong>on</strong>solidated accounts.<br />
Basis of <str<strong>on</strong>g>report</str<strong>on</strong>g>ing<br />
Our accounting policies are based <strong>on</strong> Internati<strong>on</strong>al Financial Reporting Standards<br />
(IFRS) as adopted by the EU and UK and Dutch law. These differ in certain respects<br />
from accounting principles generally accepted in the United States (US GAAP).<br />
Certain measures used in our <str<strong>on</strong>g>report</str<strong>on</strong>g>ing are not defined under either IFRS or US GAAP.<br />
For further in<strong>form</strong>ati<strong>on</strong> about these measures, and the reas<strong>on</strong>s why we believe they<br />
are important for an understanding of the per<strong>form</strong>ance of the business, please refer<br />
to the Operating review <strong>on</strong> page 13 and the Financial review <strong>on</strong> page 23. Variati<strong>on</strong>s<br />
from United States generally accepted accounting principles (US GAAP) and Securities<br />
and Exchange Commissi<strong>on</strong> Financial Statement Requirements Regulati<strong>on</strong> S-X are<br />
outlined in notes 34 and 35 <strong>on</strong> pages 124 to 140.<br />
The brand names shown in italics in this <str<strong>on</strong>g>report</str<strong>on</strong>g> are trademarks owned by or licensed<br />
to companies within the <strong>Unilever</strong> Group.<br />
Reporting currency and exchange rates<br />
Details of key exchange rates used in preparati<strong>on</strong> of these accounts are given <strong>on</strong><br />
page 146, together with No<strong>on</strong> Buying Rates in New York for the equivalent dates.<br />
Forward-looking statements<br />
This document c<strong>on</strong>tains certain statements that are neither <str<strong>on</strong>g>report</str<strong>on</strong>g>ed financial results<br />
nor other historical in<strong>form</strong>ati<strong>on</strong>. These statements are forward-looking statements,<br />
including within the meaning of the United States Private Securities Litigati<strong>on</strong> Re<strong>form</strong><br />
Act of 1995. For a descripti<strong>on</strong> of factors that could affect future results, reference<br />
should be made to the full ‘Cauti<strong>on</strong>ary Statement’ <strong>on</strong> the inside back cover.<br />
C<strong>on</strong>tents<br />
Report of the Directors<br />
Chairman’s <str<strong>on</strong>g>report</str<strong>on</strong>g> 3<br />
About <strong>Unilever</strong> 5<br />
Group Chief Executive 11<br />
Operating review – regi<strong>on</strong>s 13<br />
Operating review – categories 20<br />
Financial review 23<br />
Corporate governance 33<br />
Report of the Nominati<strong>on</strong> Committee 48<br />
Report of the Remunerati<strong>on</strong> Committee 49<br />
Report of the Audit Committee<br />
Report of the Corporate Resp<strong>on</strong>sibility<br />
63<br />
and Reputati<strong>on</strong> Committee 64<br />
Financial statements<br />
Statement of Directors’ resp<strong>on</strong>sibilities<br />
Management’s <str<strong>on</strong>g>report</str<strong>on</strong>g> <strong>on</strong> internal<br />
66<br />
c<strong>on</strong>trol over financial <str<strong>on</strong>g>report</str<strong>on</strong>g>ing 68<br />
Auditors’ <str<strong>on</strong>g>report</str<strong>on</strong>g> 69<br />
C<strong>on</strong>solidated income statement<br />
C<strong>on</strong>solidated statement of recognised<br />
70<br />
income and expense 71<br />
C<strong>on</strong>solidated balance sheet 72<br />
C<strong>on</strong>solidated cash flow statement 73<br />
Notes to the c<strong>on</strong>solidated accounts 74<br />
Selected ffinancial data<br />
Principal group companies and<br />
141<br />
n<strong>on</strong>-current investments 147<br />
Shareholder in<strong>form</strong>ati<strong>on</strong><br />
Analysis of shareholding<br />
Exchange c<strong>on</strong>trols affecting<br />
149<br />
security holders 150<br />
Nature of the trading market<br />
Taxati<strong>on</strong> for US residents holding<br />
151<br />
shares in NV<br />
Taxati<strong>on</strong> for US residents holding<br />
153<br />
shares in PLC 154<br />
Dividend record 155<br />
Glossary 156<br />
Cross reference to Form 20-F 157<br />
Financial calendar 158<br />
C<strong>on</strong>tact details 158<br />
Website 159<br />
Publicati<strong>on</strong>s 159<br />
Share registrati<strong>on</strong> 159<br />
Index 160<br />
<strong>Unilever</strong> <str<strong>on</strong>g>Annual</str<strong>on</strong>g> Report <strong>on</strong> Form 20-F <strong>2006</strong> 1
A changing <strong>Unilever</strong><br />
Our missi<strong>on</strong> is to add Vitality to life. We meet everyday needs for nutriti<strong>on</strong>,<br />
hygiene and pers<strong>on</strong>al care with brands that help people feel good, look good<br />
and get more out of life.<br />
<strong>Unilever</strong> is changing – from the way we are structured and the way we operate,<br />
to the choices we make and the priorities we set.<br />
We have a re<strong>form</strong>ed governance, a new structure and a ‘One <strong>Unilever</strong>’<br />
programme creating c<strong>on</strong>sistency, delivering cost savings and enabling us to<br />
leverage our global scale. We are developing and implementing brilliant c<strong>on</strong>sumer<br />
marketing. We are strengthening our relati<strong>on</strong>ships with retail customers. And we<br />
are outsourcing transacti<strong>on</strong>al operati<strong>on</strong>s in IT, finance and HR so we can focus <strong>on</strong><br />
growing global brands.<br />
In supporting our growth strategy, these changes are all making an impact <strong>on</strong><br />
per<strong>form</strong>ance. <strong>2006</strong> was a year of progress, showing c<strong>on</strong>sistent broad-based<br />
growth, with all regi<strong>on</strong>s and all categories c<strong>on</strong>tributing, and savings programmes<br />
delivered ahead of plan, helping to offset higher input costs.<br />
Our investment priorities – pers<strong>on</strong>al care, developing and emerging markets, and<br />
Vitality – are fuelling this growth. For example, our Vitality missi<strong>on</strong> is shaping and<br />
directing our brand development, our partnerships and the way in which we<br />
operate around the world.<br />
On the following pages you will recognise in<strong>form</strong>ati<strong>on</strong> about many of our worldfamous<br />
brands and see how our values – our desire to improve people’s lives, our<br />
commitment to the communities in which we operate – are at the heart of our<br />
business. But you will also witness a new purpose, a new c<strong>on</strong>fidence and a new<br />
hunger to succeed.<br />
Whether serving the world’s most affluent c<strong>on</strong>sumers or those with very limited<br />
disposable income, we always remember that respect and reputati<strong>on</strong> have to be<br />
earned. And retaining the trust and credibility that <strong>Unilever</strong> has built up over many<br />
years is critical to our success in helping people ‘feel good, look good and get<br />
more out of life’.<br />
2 <strong>Unilever</strong> <str<strong>on</strong>g>Annual</str<strong>on</strong>g> Report <strong>on</strong> Form 20-F <strong>2006</strong>
Chairman’s <str<strong>on</strong>g>report</str<strong>on</strong>g><br />
In <strong>2006</strong> we regained the initiative in the marketplace resulting in<br />
top line growth of 3.8% and a stabilisati<strong>on</strong> of our market shares.<br />
Many initiatives such as ‘One <strong>Unilever</strong>’ were accelerated and<br />
executed with great skill and discipline.<br />
On behalf of the Boards I would like to thank Patrick and his<br />
team, as well as all our 179 000 employees around the world,<br />
for their hard work and commitment.<br />
Although ec<strong>on</strong>omic activity has been favourable, in other business<br />
areas (for example raw material prices) the going has been tough.<br />
Therefore the words of appreciati<strong>on</strong> from the Boards are well<br />
deserved.<br />
I would like to <str<strong>on</strong>g>report</str<strong>on</strong>g> back to you <strong>on</strong> a number of issues c<strong>on</strong>cerning<br />
the dual structure, Board compositi<strong>on</strong> and Board evaluati<strong>on</strong>.<br />
Dual structure<br />
In 2005 three proposals were put forward to change <strong>Unilever</strong>’s<br />
c<strong>on</strong>stituti<strong>on</strong>al arrangements. All were approved by shareholders<br />
at the two <str<strong>on</strong>g>Annual</str<strong>on</strong>g> General Meetings (AGMs) which were held in<br />
May <strong>2006</strong>.<br />
As a result, we now have greater flexibility to allocate assets<br />
between the two parent companies. In additi<strong>on</strong>, there is full<br />
transparency between our share prices since there is <strong>on</strong>e-to-<strong>on</strong>e<br />
equivalence in their ec<strong>on</strong>omic interests in the <strong>Unilever</strong> Group.<br />
Finally, our shareholders have the right to nominate candidates<br />
to the Boards.<br />
All of this means we have simplified the relati<strong>on</strong>ship between<br />
our NV and PLC shares, and strengthened several elements of<br />
<strong>Unilever</strong>’s corporate governance. At the same time, the Group<br />
c<strong>on</strong>tinues to benefit from its dual structure.<br />
I would like to remind you that the dual structure refers to the<br />
legal framework of <strong>Unilever</strong>. When it comes to the day-to-day<br />
management of <strong>Unilever</strong>’s operati<strong>on</strong>s the Group is run <strong>on</strong> the<br />
principle of <strong>on</strong>e operating unit and as such the vast majority of<br />
employees are, quite properly, unaware of our legal structure.<br />
Board successi<strong>on</strong><br />
During <strong>2006</strong> we c<strong>on</strong>tinued our search to identify candidates for<br />
the Boards who would strengthen its expertise and independence.<br />
We are very pleased that Genevieve Berger, Narayana Murthy and<br />
Hix<strong>on</strong>ia Nyasulu have expressed their willingness to serve <strong>on</strong><br />
<strong>Unilever</strong>’s Boards; they will be proposed as N<strong>on</strong>-Executive<br />
Directors at the AGMs in May 2007. Genevieve is a Professor<br />
of Biophysics and Medical Imaging at Paris University VI and<br />
Chairman of the Advisory Board ‘Health’ for the EU Commissi<strong>on</strong><br />
for Research. Narayana is co-founder and Chairman of Infosys<br />
Technologies Limited. Hix<strong>on</strong>ia is a N<strong>on</strong>-Executive Director of Sasol<br />
Limited and Anglo Platinum and an Advisory Board Member of<br />
JP Morgan South Africa. Their appointments will bring further<br />
diversity of background and experience to the Boards and we<br />
hope that their nominati<strong>on</strong>s will be approved by shareholders.<br />
In additi<strong>on</strong> to welcoming these new members to the Boards,<br />
we will be saying goodbye to two of the Directors. First, Rudy<br />
Markham. Rudy retires after 39 years of distinguished service with<br />
<strong>Unilever</strong> during which time he has successfully occupied a number<br />
of senior executive positi<strong>on</strong>s. In 1998 he joined the Boards as<br />
Strategy and Technology Director, being appointed Financial<br />
Director, now Chief Financial Officer, in 2000. On behalf of the<br />
Boards I would like to acknowledge his outstanding career and<br />
thank him for the significant c<strong>on</strong>tributi<strong>on</strong> he has made to our<br />
business throughout that time.<br />
Sec<strong>on</strong>dly, Lynda Chalker. Lynda retires as a N<strong>on</strong>-Executive Director<br />
after three terms of three years. She has served as Chair of the<br />
Corporate Resp<strong>on</strong>sibility and Reputati<strong>on</strong> Committee and<br />
throughout her time <strong>on</strong> the Boards we have benefited from<br />
her wise counsel and expert knowledge of developing markets.<br />
On your behalf I thank them both for their service.<br />
In additi<strong>on</strong>, the Nominati<strong>on</strong> Committee led by its Chairman David<br />
Sim<strong>on</strong> was given the task of searching for a new Chairman as my<br />
successor. We are delighted that Michael Treschow has agreed to<br />
succeed me as the first independent Chairman of the Boards of<br />
<strong>Unilever</strong>, subject to his appointment as a N<strong>on</strong>-Executive Director<br />
at the AGMs. Michael is a businessman with a <strong>form</strong>idable track<br />
record gained in some of the world’s most competitive c<strong>on</strong>sumer<br />
industries. He has also proved himself an effective Chairman at<br />
both Ericss<strong>on</strong> and Electrolux, and we trust that his appointment<br />
will be approved by shareholders.<br />
When these changes are implemented we will have finalised<br />
a complete restructuring of our corporate governance<br />
arrangements. This change process was initiated in 2004 and it<br />
involved the eliminati<strong>on</strong> of Advisory Directors, the phase-out of<br />
the dual leadership system, the adopti<strong>on</strong> of a <strong>on</strong>e-tier board<br />
structure and the appointment of a fully independent Chairman<br />
of the Boards. We feel we will have Boards in place which<br />
will measure favourably against the highest corporate<br />
governance standards.<br />
Board evaluati<strong>on</strong><br />
During <strong>2006</strong> a full and thorough evaluati<strong>on</strong> of how the Boards<br />
functi<strong>on</strong>ed was c<strong>on</strong>ducted by a specialist outside firm. Taken as a<br />
whole, the outcome was positive as it c<strong>on</strong>firmed that the changes<br />
we have made since 2004, the move from Advisory Directors to<br />
N<strong>on</strong>-Executive Directors and the splitting of the Chairman and<br />
Chief Executive roles, have strengthened our governance<br />
structure. In additi<strong>on</strong>, the amount of time spent <strong>on</strong> <strong>Unilever</strong><br />
Board matters compares very favourably with general practice.<br />
These c<strong>on</strong>clusi<strong>on</strong>s support our belief that all the alterati<strong>on</strong>s to<br />
our governance structure and proceedings have been beneficial<br />
to <strong>Unilever</strong> overall and that we meet the very high standards<br />
expected of a group of our size and complexity.<br />
<strong>Unilever</strong> <str<strong>on</strong>g>Annual</str<strong>on</strong>g> Report <strong>on</strong> Form 20-F <strong>2006</strong> 3<br />
Report of the Directors
Report of the Directors (c<strong>on</strong>tinued)<br />
Chairman’s <str<strong>on</strong>g>report</str<strong>on</strong>g> (c<strong>on</strong>tinued)<br />
C<strong>on</strong>clusi<strong>on</strong><br />
I realise I am writing to you for the last time after 35 years<br />
of service with <strong>Unilever</strong>.<br />
The changes within <strong>Unilever</strong> over this period have been truly<br />
trans<strong>form</strong>ati<strong>on</strong>al both in terms of product portfolio and<br />
geographical spread. Our turnover in Western Europe has<br />
declined from 65% to 34% of <strong>Unilever</strong> sales. The expansi<strong>on</strong><br />
has been picked up by the developing countries which represent<br />
over 40% of our turnover.<br />
Moreover, 35 years ago 25% of <strong>Unilever</strong> sales were outside the<br />
fast moving c<strong>on</strong>sumer goods sector. Spearheaded by disposals<br />
and acquisiti<strong>on</strong>s such as Chesebrough P<strong>on</strong>d’s and Bestfoods,<br />
<strong>Unilever</strong> turnover is now focused <strong>on</strong> around 400 brands, all in<br />
c<strong>on</strong>sumer goods categories. Especially spectacular has been the<br />
rise of turnover of our pers<strong>on</strong>al care business from 4% of sales<br />
in 1972 to 28% of sales today.<br />
Perhaps the most impressive change since the early seventies is<br />
the step-up of the quality and strength of our brand portfolio.<br />
We have come from a positi<strong>on</strong> of no brand achieving a turnover<br />
of over €1 billi<strong>on</strong>, to today’s positi<strong>on</strong> of twelve billi<strong>on</strong>-euro<br />
brands, representing around 55% of <strong>Unilever</strong>’s turnover.<br />
All these changes together with the underpinning of our Vitality<br />
missi<strong>on</strong> positi<strong>on</strong> our company favourably for future growth.<br />
What has not changed over the last four decades is the way<br />
<strong>Unilever</strong> c<strong>on</strong>ducts its business: integrity first and foremost in<br />
all things we undertake together with a keen interest for the<br />
communities and envir<strong>on</strong>ment in which we work.<br />
It has been a privilege to serve in <strong>Unilever</strong> over the last 35 years.<br />
Ant<strong>on</strong>y Burgmans<br />
Chairman<br />
4 <strong>Unilever</strong> <str<strong>on</strong>g>Annual</str<strong>on</strong>g> Report <strong>on</strong> Form 20-F <strong>2006</strong>
About <strong>Unilever</strong><br />
Descripti<strong>on</strong> of business<br />
<strong>Unilever</strong> is <strong>on</strong>e of the world’s leading suppliers of fast moving<br />
c<strong>on</strong>sumer goods across Foods and Home and Pers<strong>on</strong>al Care<br />
categories. <strong>Unilever</strong>’s portfolio includes some of the world’s best<br />
known and most loved brands.<br />
Strategy and l<strong>on</strong>g-term financial targets<br />
At the heart of <strong>Unilever</strong>'s strategy is a c<strong>on</strong>centrati<strong>on</strong> of resources<br />
<strong>on</strong> areas where we have leading positi<strong>on</strong>s and <strong>on</strong> high growth<br />
spaces, especially in pers<strong>on</strong>al care, in developing and emerging<br />
markets and in Vitality. While the focus is <strong>on</strong> developing the<br />
business organically, acquisiti<strong>on</strong>s and disposals also have a role<br />
to play in accelerating the portfolio development.<br />
To execute this strategy the business has been reorganised to<br />
simplify the management structure and to improve capabilities<br />
in marketing, customer management, and research and<br />
development. The result is better allocati<strong>on</strong> of resources, better<br />
executi<strong>on</strong>, faster decisi<strong>on</strong>-making and greater focus <strong>on</strong> efficiency.<br />
The new organisati<strong>on</strong>, augmented by the successful 'One<br />
<strong>Unilever</strong>' project, allows us to leverage our scale both globally<br />
and locally.<br />
<strong>Unilever</strong>'s l<strong>on</strong>g-term ambiti<strong>on</strong> is to achieve top-third total<br />
shareholder return and our targets reflect this. Over the period<br />
2005-2010 we target ungeared free cash flow of €25-30 billi<strong>on</strong>.<br />
Disposals made in the past two years, with no significant<br />
acquisiti<strong>on</strong>s to date, have reduced the cash generati<strong>on</strong> over the<br />
period by just over €1 billi<strong>on</strong>. Return <strong>on</strong> invested capital is<br />
targeted to increase over the 2004 base of 11%. We expect<br />
underlying sales growth of 3-5% per annum and an operating<br />
margin in excess of 15% by 2010 after a normal level of<br />
restructuring of 0.5 to 1 percent of sales.<br />
Key per<strong>form</strong>ance indicators<br />
Underlying sales growth, operating margin, ungeared free cash<br />
flow, return <strong>on</strong> invested capital and total shareholder return are<br />
key per<strong>form</strong>ance indicators for the Group.<br />
In the Operating review <strong>on</strong> pages 13 to 22 and the Financial<br />
review <strong>on</strong> pages 23 to 32 we explain why we regard these as<br />
important indicators of our progress against our strategic<br />
objectives, describe how we calculate them, and <str<strong>on</strong>g>report</str<strong>on</strong>g> <strong>on</strong> the<br />
results of these measures for the current and preceding years.<br />
Regi<strong>on</strong>s<br />
Three regi<strong>on</strong>al teams are resp<strong>on</strong>sible for managing <strong>Unilever</strong>’s<br />
business in the regi<strong>on</strong>s, and for market operati<strong>on</strong>s. They are<br />
primarily resp<strong>on</strong>sible for winning with customers and deploying<br />
brand events and innovati<strong>on</strong>s effectively. The regi<strong>on</strong>s are fully<br />
accountable for the profit per<strong>form</strong>ance of our business, as well<br />
as growth, short-term cash flows and the in-year development<br />
of market shares.<br />
The Europe regi<strong>on</strong> includes our operati<strong>on</strong>s in Western Europe<br />
and in Central and Eastern Europe, and in <strong>2006</strong> accounted for<br />
approximately 38% of our business <strong>on</strong> a turnover basis.<br />
The Americas regi<strong>on</strong> includes our operati<strong>on</strong>s in North America<br />
and Latin America and represented around 35% of our business.<br />
Our Asia Africa regi<strong>on</strong> accounted for 27% of our business, and<br />
includes our operati<strong>on</strong>s in the Middle East, Turkey, Africa, Asia<br />
and Australasia.<br />
Categories<br />
Two category teams cover Foods and Home and Pers<strong>on</strong>al Care,<br />
and are resp<strong>on</strong>sible for each category and the brands therein.<br />
They are fully resp<strong>on</strong>sible for brand development and innovati<strong>on</strong>,<br />
including research and development. Categories also lead the<br />
strategic elements of the supply chain and are accountable for<br />
l<strong>on</strong>g-term value creati<strong>on</strong> in the business, as measured by market<br />
share development, category growth, innovati<strong>on</strong> metrics and<br />
brand health.<br />
For more in<strong>form</strong>ati<strong>on</strong> about our two categories and their<br />
innovati<strong>on</strong> activities during <strong>2006</strong> please refer to pages 20 to 22.<br />
Functi<strong>on</strong>s<br />
Our five support functi<strong>on</strong>s (Finance, HR, IT, Communicati<strong>on</strong>s<br />
and Legal) provide value-adding business partnership, strategic<br />
support and competitive services to the whole business (especially<br />
the regi<strong>on</strong>al and category organisati<strong>on</strong>s). They are organised<br />
around the model of business partners, shared services and<br />
expertise teams.<br />
Operating envir<strong>on</strong>ment<br />
Competiti<strong>on</strong><br />
We have a wide and diverse set of competitors in our c<strong>on</strong>sumer<br />
goods businesses. Many of our competitors also operate <strong>on</strong><br />
an internati<strong>on</strong>al scale, but others have a narrower regi<strong>on</strong>al or<br />
local focus.<br />
Competiti<strong>on</strong> is a normal part of business. We aim to compete<br />
and give value to our c<strong>on</strong>sumers, customers and shareholders<br />
in three ways:<br />
• by c<strong>on</strong>tinually developing new and improved products;<br />
• by sharing our innovati<strong>on</strong>s and c<strong>on</strong>cepts with our businesses<br />
all around the world; and<br />
• by striving to lower the cost of our sourcing, manufacturing<br />
and distributi<strong>on</strong> processes while still maintaining, and<br />
improving, the quality of our products.<br />
We support efforts to create a more open competitive<br />
envir<strong>on</strong>ment through the liberalisati<strong>on</strong> of internati<strong>on</strong>al trade.<br />
We support the full implementati<strong>on</strong> of the Single European Market<br />
and inclusi<strong>on</strong> in the European Uni<strong>on</strong> of other countries that fulfil<br />
the agreed criteria for membership.<br />
Distributi<strong>on</strong><br />
<strong>Unilever</strong>’s products are generally sold through its sales force and<br />
through independent brokers, agents and distributors to chain,<br />
wholesale, co-operative and independent grocery accounts, food<br />
service distributors and instituti<strong>on</strong>s. Products are distributed<br />
through distributi<strong>on</strong> centres, satellite warehouses, companyoperated<br />
and public storage facilities, depots and other facilities.<br />
<strong>Unilever</strong> <str<strong>on</strong>g>Annual</str<strong>on</strong>g> Report <strong>on</strong> Form 20-F <strong>2006</strong> 5<br />
Report of the Directors (c<strong>on</strong>tinued)
Report of the Directors (c<strong>on</strong>tinued)<br />
About <strong>Unilever</strong> (c<strong>on</strong>tinued)<br />
Exports<br />
We sell our products in nearly all countries throughout the world<br />
and manufacture in many of them. We export a wide range of<br />
products to countries where we do not make them. For example,<br />
inside the European Uni<strong>on</strong> we make many of our products in <strong>on</strong>ly<br />
a few member countries, for sale in all of them. The chosen<br />
manufacturing c<strong>on</strong>figurati<strong>on</strong> is generally determined by an<br />
optimised regi<strong>on</strong>al sourcing strategy which takes account of<br />
requirements for innovati<strong>on</strong>, quality, service, cost and flexibility.<br />
Seas<strong>on</strong>ality<br />
Certain of our businesses, such as ice cream, are subject to<br />
significant seas<strong>on</strong>al fluctuati<strong>on</strong>s in sales. However, <strong>Unilever</strong><br />
operates globally in many different markets and product<br />
categories. No individual element of seas<strong>on</strong>ality is likely to be<br />
material to the results of the Group as a whole.<br />
Related party transacti<strong>on</strong>s<br />
Transacti<strong>on</strong>s with related parties are c<strong>on</strong>ducted in accordance<br />
with agreed transfer pricing policies and include sales to joint<br />
ventures and associates. Other than those disclosed in this <str<strong>on</strong>g>report</str<strong>on</strong>g>,<br />
there were no related party transacti<strong>on</strong>s that were material to the<br />
Group or to the related parties c<strong>on</strong>cerned that are required to be<br />
<str<strong>on</strong>g>report</str<strong>on</strong>g>ed in <strong>2006</strong> or the two preceding years.<br />
For more in<strong>form</strong>ati<strong>on</strong> about related party transacti<strong>on</strong>s please refer<br />
also to note 30 <strong>on</strong> page 122.<br />
Resources<br />
Our brands – Foods<br />
Our Foods category manages brands in two main groups:<br />
Savoury, dressings and spreads includes sales of soups, bouill<strong>on</strong>s,<br />
sauces, snacks, may<strong>on</strong>naise, salad dressings, olive oil, margarines,<br />
spreads and cooking products such as liquid margarines and the<br />
remaining frozen foods businesses. Am<strong>on</strong>g the leading brands are<br />
Knorr, Hellmann’s, Calvé, Wish-B<strong>on</strong>e, Amora, Bertolli, our healthy<br />
heart Becel and Flora ranges, and our family brands including<br />
Rama, Blue Band and Country Crock.<br />
Ice cream and beverages includes our sales of ice cream under<br />
the internati<strong>on</strong>al Heart brand, including Cornetto, Magnum,<br />
Carte d’Or and Solero, and also Ben & Jerry’s, Breyers, Kl<strong>on</strong>dike<br />
and Popsicle. It also includes sales of tea, where our brands<br />
include Lipt<strong>on</strong> and Brooke B<strong>on</strong>d, weight management products,<br />
principally Slim•Fast, and nutriti<strong>on</strong>ally enhanced staples sold in<br />
developing markets, including our Annapurna and AdeS ranges.<br />
Within these groups, our <strong>Unilever</strong> Foodsoluti<strong>on</strong>s business is a<br />
global food service business providing soluti<strong>on</strong>s for professi<strong>on</strong>al<br />
chefs and caterers. Its results are <str<strong>on</strong>g>report</str<strong>on</strong>g>ed within those for the<br />
groups above.<br />
Our brands – Home and Pers<strong>on</strong>al Care<br />
Our Home and Pers<strong>on</strong>al Care category manages brands in two<br />
main groups:<br />
In Pers<strong>on</strong>al Care, six global brands are the core of our business in<br />
the deodorants, skin cleansing, daily hair care and mass-market<br />
skin care categories – Axe, Dove, Lux, P<strong>on</strong>d’s, Rex<strong>on</strong>a and Sunsilk.<br />
Other important brands include Suave, Clear, Lifebuoy and<br />
Vaseline, together with Signal and Close Up in oral care.<br />
6 <strong>Unilever</strong> <str<strong>on</strong>g>Annual</str<strong>on</strong>g> Report <strong>on</strong> Form 20-F <strong>2006</strong><br />
Our Home Care ranges include a series of laundry products,<br />
including tablets as well as traditi<strong>on</strong>al powders and liquids for<br />
washing by hand or machine. Tailored products including soap<br />
bars are available for lower-income c<strong>on</strong>sumers. Our brands<br />
include Comfort, Omo, Radiant, Skip, Snuggle and Surf. Our<br />
household care products are led by our Cif and Domestos brands.<br />
Corporate venture activities<br />
<strong>Unilever</strong> has allocated €350 milli<strong>on</strong> to its venturing activities in<br />
order to create business opportunities that will help build our core<br />
business interests in Foods and Home and Pers<strong>on</strong>al Care. These<br />
activities include:<br />
• <strong>Unilever</strong> Technology Ventures, which invests in technology<br />
funds and start-up companies;<br />
• <strong>Unilever</strong> Ventures, which is an early-stage business development<br />
fund for businesses from both inside and outside <strong>Unilever</strong>; and<br />
• Langholm Capital, which is an independent fund investing in<br />
private European companies with above-average l<strong>on</strong>ger-term<br />
growth prospects.<br />
Our employees<br />
We set great store by our people. No matter what their level or<br />
individual resp<strong>on</strong>sibilities, they all make an important c<strong>on</strong>tributi<strong>on</strong><br />
to our success.<br />
The following examples outline some of the initiatives we have<br />
instigated to help our people develop their skills, broaden their<br />
experience and – wherever they are in the world – improve their<br />
chances of progressing within <strong>Unilever</strong>.<br />
Talented people are given opportunities to develop at every level.<br />
However, our new senior leadership programme, launched in<br />
<strong>2006</strong>, is aimed at those with potential to reach the top roles. The<br />
programme includes a bespoke business simulati<strong>on</strong>, based <strong>on</strong> <strong>on</strong>e<br />
of our skincare businesses. It provides an excepti<strong>on</strong>al opportunity<br />
for senior managers rapidly to gain the breadth and depth of<br />
business and leadership understanding required for our business’s<br />
most demanding roles.<br />
We are always looking at new ways of working to drive business<br />
effectiveness. One example is in the area of business travel which<br />
can be time-c<strong>on</strong>suming and tiring. Our current videoc<strong>on</strong>ferencing<br />
equipment is being upgraded to state-of-the-art facilities at five<br />
major <strong>Unilever</strong> sites worldwide and is expected to enable us to<br />
reduce travel. These facilities mean that complete teams can<br />
communicate effectively with <strong>on</strong>e another across c<strong>on</strong>tinents<br />
and time z<strong>on</strong>es without any<strong>on</strong>e leaving the office – making<br />
better use of every<strong>on</strong>e’s time and energy, and limiting time<br />
spent away from home.<br />
During <strong>2006</strong>, as part of a graduate recruitment programme,<br />
<strong>Unilever</strong> Netherlands set an unusual work-experience challenge.<br />
Students spent two weeks in rural India <strong>on</strong> Hindustan Lever’s<br />
Project Shakti, helping women in remote areas who have set up<br />
small businesses as direct-to-c<strong>on</strong>sumer retailers and measuring<br />
the project’s success. By providing local women with training and<br />
business skills, Shakti creates a new distributi<strong>on</strong> channel for our<br />
products while providing the women with opportunities to<br />
improve their income, standard of living and place in the<br />
community. It also helped open Dutch students’ eyes to the wide<br />
variety of activities that take place across the <strong>Unilever</strong> world.
About <strong>Unilever</strong> (c<strong>on</strong>tinued)<br />
<strong>Unilever</strong> employees whose skills are h<strong>on</strong>ed in developing and<br />
emerging (D&E) markets are reaching senior positi<strong>on</strong>s both at<br />
home and abroad, and 20% of our top 123 managers are from<br />
D&E regi<strong>on</strong>s. Andina/Central America, Argentina, Brazil, India,<br />
Ind<strong>on</strong>esia, Japan, Mexico, Pakistan, the Philippines and South<br />
Africa all have either local nati<strong>on</strong>als as their chairmen, or<br />
chairmen from within the D&E regi<strong>on</strong>s. Furthermore, 39% of all<br />
individuals <strong>on</strong> internati<strong>on</strong>al sec<strong>on</strong>dment are from developing or<br />
emerging countries.<br />
Hindustan Lever, <strong>Unilever</strong>’s business in India, has a Pers<strong>on</strong>al<br />
Vitality Programme which assesses individual employees’ body<br />
mass, blood pressure, cholesterol and blood sugar levels. And<br />
assistance is provided to those who have nutriti<strong>on</strong> or health<br />
issues, or exercise requirements. Although voluntary, over<br />
10 000 employees have taken part so far and each will be<br />
followed up annually to ensure they have every opportunity<br />
to improve their health.<br />
Str<strong>on</strong>g, effective leadership is at the heart of our trans<strong>form</strong>ati<strong>on</strong><br />
programme and is the key to sustaining high levels of business<br />
per<strong>form</strong>ance. Our new global Standards of Leadership framework<br />
clearly sets out the behaviours needed to align ‘hearts and minds’,<br />
inspire people to achieve excellence in strategy executi<strong>on</strong> and<br />
develop the skills and capabilities we need for the future.<br />
Maintaining health and fitness can be challenging for senior<br />
managers in demanding roles. During <strong>2006</strong>, several senior<br />
leadership teams – including the <strong>Unilever</strong> Executive – took part<br />
in a well-being programme. Each received their own individual<br />
health and Vitality check, which was then used to design a<br />
pers<strong>on</strong>al plan to enhance their habits and practices in physical<br />
activity, nutriti<strong>on</strong> and mental resilience. In 2007 a further ten<br />
leadership teams are expected to participate in a well-being<br />
programme.<br />
Our total employee numbers over the last five years were as<br />
follows:<br />
Year end in thousands <strong>2006</strong> 2005 2004 2003 2002<br />
Europe 44 49 52 55 60<br />
The Americas 45 47 47 50 53<br />
Asia Africa 90 110 124 129 134<br />
Total 179 206 223 234 247<br />
Of the overall reducti<strong>on</strong> in numbers during <strong>2006</strong> of 27 000, the<br />
sale of a plantati<strong>on</strong>s business in India accounted for a reducti<strong>on</strong><br />
of 18 000. A further 3 000 resulted from the sale of the majority<br />
of our European frozen foods businesses, with the remainder of<br />
the reducti<strong>on</strong> arising from other business disposals and a range<br />
of restructuring projects.<br />
Included in the total <str<strong>on</strong>g>report</str<strong>on</strong>g>ed numbers for <strong>2006</strong> were 26 000<br />
part-time or seas<strong>on</strong>al employees (2005: 33 000).<br />
Diversity<br />
Diversity in <strong>Unilever</strong> is about inclusi<strong>on</strong>, embracing differences,<br />
creating possibilities and growing together for better business<br />
per<strong>form</strong>ance. We embrace diversity in our workforce; this means<br />
giving full and fair c<strong>on</strong>siderati<strong>on</strong> to all applicants and c<strong>on</strong>tinuing<br />
development to all employees, regardless of gender, nati<strong>on</strong>ality,<br />
race, creed, disability, style or sexuality. Diversity plays a vital role<br />
in ensuring we understand c<strong>on</strong>sumers’ needs.<br />
The commitment to diversity is set right at the top of our<br />
business. An important legacy of our Chairman, Ant<strong>on</strong>y<br />
Burgmans, is that he is leaving the most diverse <strong>Unilever</strong> Board in<br />
our history. Going forward, Group Chief Executive Patrick Cescau<br />
will lead our global diversity board that will drive the diversity<br />
strategy within the business.<br />
<strong>Unilever</strong> is <strong>on</strong>e of the world’s most culturally diverse companies<br />
with 24 different nati<strong>on</strong>alities represented am<strong>on</strong>g our top 123<br />
managers worldwide.<br />
In <strong>2006</strong> we focused <strong>on</strong> practical diversity initiatives. These<br />
included the quarterly measurement and tracking of diversity<br />
against objectives and the integrati<strong>on</strong> of our diversity agenda<br />
into our people processes.<br />
Gender c<strong>on</strong>tinues to be the primary focus of our diversity strategy,<br />
as well as a way of improving business per<strong>form</strong>ance. Between<br />
2000 and <strong>2006</strong>, we have increased our female management<br />
profile from 25% to 33% and most of our senior leadership<br />
teams, such as Foods, Europe, The Americas and human<br />
resources include female leaders.<br />
In<strong>form</strong>ati<strong>on</strong> technology<br />
<strong>Unilever</strong> IT is a global functi<strong>on</strong> headed by the Global Chief<br />
In<strong>form</strong>ati<strong>on</strong> Officer with a strategy to deliver simpler, more cost<br />
effective IT soluti<strong>on</strong>s to support the business. Comm<strong>on</strong><br />
technology framework and standards for architecture, key<br />
technologies, process, in<strong>form</strong>ati<strong>on</strong> and services, allow <strong>Unilever</strong><br />
to leverage its scale. For example, this approach is supporting<br />
the integrati<strong>on</strong> of our businesses in each country under the ‘One<br />
<strong>Unilever</strong>’ programme, as well as the setting up of regi<strong>on</strong>al shared<br />
service centres for ‘back-office’ operati<strong>on</strong>s, which in some cases<br />
are being outsourced.<br />
The development of ‘destinati<strong>on</strong> IT architecture’ is another<br />
example of simplifying and leveraging scale. The destinati<strong>on</strong> IT<br />
architecture is essentially a l<strong>on</strong>g-term view <strong>on</strong> the IT applicati<strong>on</strong><br />
and technology landscape for <strong>Unilever</strong>. This also fundamentally<br />
changes the way IT works with the business.<br />
<strong>Unilever</strong> partners with a few major suppliers to develop the<br />
minimum number of n<strong>on</strong>-overlapping systems needed to deliver<br />
the business objectives. This promotes radical simplificati<strong>on</strong> with<br />
flexibility and agility, faster implementati<strong>on</strong> and reduced costs.<br />
Intellectual property<br />
We have a large portfolio of patents and trademarks, and we<br />
c<strong>on</strong>duct some of our operati<strong>on</strong>s under licences which are based<br />
<strong>on</strong> patents or trademarks owned or c<strong>on</strong>trolled by others. We are<br />
not dependent <strong>on</strong> any <strong>on</strong>e patent or group of patents. We use<br />
our best efforts to protect our brands and technology.<br />
<strong>Unilever</strong> <str<strong>on</strong>g>Annual</str<strong>on</strong>g> Report <strong>on</strong> Form 20-F <strong>2006</strong> 7<br />
Report of the Directors (c<strong>on</strong>tinued)
Report of the Directors (c<strong>on</strong>tinued)<br />
About <strong>Unilever</strong> (c<strong>on</strong>tinued)<br />
Property, plant and equipment<br />
We have interests in properties in most of the countries where<br />
there are <strong>Unilever</strong> operati<strong>on</strong>s. However, n<strong>on</strong>e is material in the<br />
c<strong>on</strong>text of the Group as a whole. The properties are used<br />
predominantly to house producti<strong>on</strong> and distributi<strong>on</strong> activities<br />
and as offices. There is a mixture of leased and owned property<br />
throughout the Group. There are no envir<strong>on</strong>mental issues<br />
affecting the properties which would have a material impact<br />
up<strong>on</strong> the Group, and there are no material encumbrances <strong>on</strong> our<br />
properties. Any difference between the market value of properties<br />
held by the Group and the amount at which they are included in<br />
the balance sheet is not significant. Please refer to the schedule<br />
of principal group companies and n<strong>on</strong>-current investments <strong>on</strong><br />
page 147 and 148 and details of property, plant and equipment<br />
in note 10 <strong>on</strong> page 90.<br />
We currently have no plans to c<strong>on</strong>struct new facilities or expand<br />
or improve our current facilities in a manner that is material to<br />
the Group.<br />
Laws and regulati<strong>on</strong><br />
<strong>Unilever</strong> businesses are governed by laws and regulati<strong>on</strong>s<br />
designed to ensure that products may be safely used for their<br />
intended purpose and that labelling and advertising are truthful<br />
and not misleading. <strong>Unilever</strong> businesses are further regulated by<br />
data protecti<strong>on</strong> and anti-trust legislati<strong>on</strong>. Important regulatory<br />
bodies in respect of our businesses include the European<br />
Commissi<strong>on</strong> and the US Food and Drug Administrati<strong>on</strong>.<br />
We have processes in place to ensure that products, ingredients,<br />
manufacturing processes, marketing materials and activities<br />
comply with the above-menti<strong>on</strong>ed laws and regulati<strong>on</strong>s.<br />
Legal proceedings<br />
We are not involved in any legal or arbitrati<strong>on</strong> proceedings which<br />
might lead to material loss or expenditure in the c<strong>on</strong>text of the<br />
Group results. Similarly we do not have any material obligati<strong>on</strong>s<br />
under envir<strong>on</strong>mental legislati<strong>on</strong>. N<strong>on</strong>e of our Directors or Officers<br />
is involved in any legal proceedings which are material as aforesaid.<br />
Preference shares<br />
In 1999, NV issued 211 473 785 €0.05 (Fl.0.10) cumulative<br />
preference shares, with a noti<strong>on</strong>al value of €6.58 (Fl.14.50), as an<br />
alternative to a cash dividend. In March 2004, NV announced its<br />
intenti<strong>on</strong> to c<strong>on</strong>vert part (€6.53 – equivalent to Fl.14.40) of the<br />
noti<strong>on</strong>al value of the preference shares, in accordance with its<br />
Articles of Associati<strong>on</strong>, into NV ordinary shares in the first quarter<br />
of 2005. A number of holders of preference shares raised<br />
objecti<strong>on</strong>s to the c<strong>on</strong>versi<strong>on</strong>, claiming that NV had created<br />
legitimate expectati<strong>on</strong>s that it would buy the preference shares<br />
back for an amount of €6.58, the amount of the cash dividend<br />
in 1999. A group of holders of preference shares requested the<br />
Enterprise Chamber of the Amsterdam Court of Appeal to<br />
c<strong>on</strong>duct an inquiry into the course of affairs surrounding the<br />
preference shares. On 21 December 2004, the Enterprise<br />
Chamber ordered an inquiry; an additi<strong>on</strong>al request to forbid NV<br />
to c<strong>on</strong>vert the preference shares was rejected.<br />
On 15 February 2005 NV c<strong>on</strong>verted part of the noti<strong>on</strong>al value of<br />
the preference shares into NV ordinary shares. The value, which<br />
the holders of the preference shares received up<strong>on</strong> c<strong>on</strong>versi<strong>on</strong>,<br />
was €4.55 for each preference share.<br />
8 <strong>Unilever</strong> <str<strong>on</strong>g>Annual</str<strong>on</strong>g> Report <strong>on</strong> Form 20-F <strong>2006</strong><br />
As a c<strong>on</strong>sequence of the c<strong>on</strong>versi<strong>on</strong>, the noti<strong>on</strong>al value of the<br />
preference shares was reduced to €0.05 (Fl.0.10) and pursuant to<br />
the Articles of Associati<strong>on</strong> of NV the preference shares could be<br />
cancelled up<strong>on</strong> repayment of this remaining noti<strong>on</strong>al value. On<br />
4 May 2005, the Enterprise Chamber of the Amsterdam Court<br />
of Appeal rejected another request of a group of holders of<br />
preference shares who had bought their preference shares after<br />
24 March 2004, which was aimed to prohibit NV from cancelling<br />
the preference shares. On 10 May 2005, NV’s <str<strong>on</strong>g>Annual</str<strong>on</strong>g> General<br />
Meeting decided to cancel the preference shares and cancellati<strong>on</strong><br />
took effect <strong>on</strong> 13 July 2005.<br />
On 8 September <strong>2006</strong>, the investigators published a <str<strong>on</strong>g>report</str<strong>on</strong>g>.<br />
Criticisms made in this <str<strong>on</strong>g>report</str<strong>on</strong>g> related to how <strong>Unilever</strong> had<br />
communicated with the preference shareholders but the criticisms<br />
did not extend to NV’s decisi<strong>on</strong> to c<strong>on</strong>vert part of the noti<strong>on</strong>al<br />
value of the preference shares into ordinary shares.<br />
On 8 November <strong>2006</strong> NV announced that it had agreed a<br />
settlement with the main parties in the legal dispute over the<br />
preference shares. The settlement includes all <strong>form</strong>er preference<br />
shareholders who had initiated the inquiry procedure. <strong>Unilever</strong><br />
has provided €300 milli<strong>on</strong> in respect of the settlement. Further<br />
in<strong>form</strong>ati<strong>on</strong> is given in note 19 <strong>on</strong> page 102.<br />
The group of <strong>form</strong>er preference shareholders who had bought<br />
their preference shares after 24 March 2004 and who are not<br />
entitled to the settlement, have requested the Enterprise Chamber<br />
to rule that the <str<strong>on</strong>g>report</str<strong>on</strong>g> of the investigators dem<strong>on</strong>strates<br />
mismanagement of NV. They have requested an additi<strong>on</strong>al inquiry<br />
into the policy and affairs of NV in the period after 24 March<br />
2004. This group of <strong>form</strong>er preference shareholders has also<br />
instituted claims with the Rotterdam District Court for nullificati<strong>on</strong><br />
of the NV Board’s decisi<strong>on</strong> to c<strong>on</strong>vert the preference shares and<br />
NV’s <str<strong>on</strong>g>Annual</str<strong>on</strong>g> General Meeting decisi<strong>on</strong> to cancel the preference<br />
shares. The Enterprise Chamber and the Rotterdam District Court<br />
have not yet decided <strong>on</strong> these claims.<br />
On the grounds of NV’s alleged attributable failure to buy back<br />
the preference shares at €6.58, they also claim damages in the<br />
amount of approximately €81 milli<strong>on</strong>, which amount is based <strong>on</strong><br />
the difference between €6.58 and €4.55, the value holders of the<br />
preference shares received up<strong>on</strong> c<strong>on</strong>versi<strong>on</strong> for each preference<br />
share. These claims will be vigorously c<strong>on</strong>tested.<br />
Other<br />
<strong>Unilever</strong> has businesses in many countries and from time to<br />
time these are subject to investigati<strong>on</strong> by competiti<strong>on</strong> and other<br />
regulatory authorities. One such matter c<strong>on</strong>cerns ice cream<br />
distributi<strong>on</strong> in Europe, notably the issues of outlet and cabinet<br />
exclusivity. In October 2003, the Court of First Instance in<br />
Luxembourg (‘CFI’) ruled in favour of the European Commissi<strong>on</strong>’s<br />
decisi<strong>on</strong> banning <strong>Unilever</strong>’s Irish ice cream business, HB Ice Cream,<br />
from seeking freezer cabinet exclusivity for their products in the<br />
Irish market. HB Ice Cream submitted an appeal to the European<br />
Court of Justice in Luxembourg (‘ECJ’) against the decisi<strong>on</strong> of the<br />
CFI. On 28 September <strong>2006</strong> the ECJ dismissed the appeal.<br />
Following the CFI decisi<strong>on</strong> freezer exclusivity in Ireland has not<br />
been enforceable from October 2003 <strong>on</strong>wards, in outlets which<br />
<strong>on</strong>ly have HB freezers. From 2003 <strong>Unilever</strong> Ireland has complied<br />
with the Commissi<strong>on</strong> decisi<strong>on</strong>. With the ECJ judgement this<br />
positi<strong>on</strong> has now become final. Similar c<strong>on</strong>sequences may apply<br />
in specific European markets with equivalent structures to those<br />
described in the Commissi<strong>on</strong> and CFI decisi<strong>on</strong>s. There is a
About <strong>Unilever</strong> (c<strong>on</strong>tinued)<br />
possibility of claims for damages, in the event of which <strong>Unilever</strong><br />
will defend its positi<strong>on</strong> vigorously. The case between HB Ice<br />
Cream and Masterfoods, which has been before the Irish Courts<br />
since 1990 and which had been deferred pending the final<br />
determinati<strong>on</strong> of the appeal against the Commissi<strong>on</strong> decisi<strong>on</strong>,<br />
has been reopened at the request of Masterfoods. It is noted that<br />
in the UK since 2000, when cabinet exclusivity was effectively<br />
aband<strong>on</strong>ed following undertakings given by <strong>Unilever</strong> to the UK<br />
competiti<strong>on</strong> authorities, there has not been any material change<br />
in <strong>Unilever</strong>’s relevant market share.<br />
In <strong>2006</strong> the French competiti<strong>on</strong> authorities commenced an inquiry<br />
into potential competiti<strong>on</strong> law infringements in France involving a<br />
number of c<strong>on</strong>sumer goods companies in the home and pers<strong>on</strong>al<br />
care sector, including <strong>Unilever</strong> France and Lever Faberge France,<br />
both subsidiaries of the <strong>Unilever</strong> Group. To date, no statement<br />
of objecti<strong>on</strong>s has been lodged against either <strong>Unilever</strong> France<br />
or Lever Faberge France and accordingly the potential financial<br />
implicati<strong>on</strong>s, if any, of this investigati<strong>on</strong> for such companies<br />
cannot yet be assessed.<br />
On 8 March 2007 representatives from the Portuguese<br />
Competiti<strong>on</strong> Authority carried out an inspecti<strong>on</strong> at the offices<br />
of <strong>Unilever</strong> Jer<strong>on</strong>imo Martins and such company’s ice-cream<br />
factory in Portugal. The inspecti<strong>on</strong> was in relati<strong>on</strong> to impulse<br />
ice-cream in Portugal. It is the policy of the <strong>Unilever</strong> Group to<br />
comply fully with the legal procedures involved in such inspecti<strong>on</strong>s<br />
and any subsequent enquiry. It should be noted that no written<br />
statement of objecti<strong>on</strong>s or other allegati<strong>on</strong>s has been received<br />
by <strong>Unilever</strong> Jer<strong>on</strong>imo Martins in respect of this matter and<br />
accordingly the potential financial implicati<strong>on</strong>s, if any, of this<br />
inspecti<strong>on</strong> for such company cannot yet be assessed.<br />
On 14 March 2007 representatives from the German Federal<br />
Cartel Office carried out an inspecti<strong>on</strong> at the offices of <strong>Unilever</strong><br />
Deutschland GmbH in Hamburg. The inspecti<strong>on</strong> was in relati<strong>on</strong><br />
to the oral-care market in Germany. It is the policy of the <strong>Unilever</strong><br />
Group to comply fully with the legal procedures involved in such<br />
inspecti<strong>on</strong>s and any subsequent enquiry. It should be noted that<br />
no written statement of objecti<strong>on</strong>s or other allegati<strong>on</strong>s has been<br />
received by <strong>Unilever</strong> Deutschland GmbH in respect of this matter<br />
and accordingly the potential financial implicati<strong>on</strong>s, if any, of this<br />
inspecti<strong>on</strong> for such company cannot yet be assessed.<br />
During 2004 the Federal Supreme Court in Brazil (local acr<strong>on</strong>ym<br />
STF) announced a review of certain cases that it had previously<br />
decided in favour of taxpayers. Because of this acti<strong>on</strong> we<br />
established a provisi<strong>on</strong> in 2004 for the potential repayment<br />
of sales tax credits in the event that the cases establishing<br />
precedents in our favour are reversed. Since that time we have<br />
c<strong>on</strong>tinued to m<strong>on</strong>itor the situati<strong>on</strong> and have made reducti<strong>on</strong>s<br />
as appropriate to the amount provided.<br />
Also during 2004 in Brazil, and in comm<strong>on</strong> with many other<br />
businesses operating in that country, <strong>on</strong>e of our Brazilian<br />
subsidiaries received a notice of infringement from the Federal<br />
Revenue Service. The notice alleges that a 2001 reorganisati<strong>on</strong><br />
of our local corporate structure was undertaken without valid<br />
business purpose. If upheld, the notice could result in a tax claim<br />
in respect of prior years. The 2001 reorganisati<strong>on</strong> was comparable<br />
with that used by many companies in Brazil and we believe that<br />
the likelihood of a successful challenge by the tax authorities is<br />
remote. This view is supported by the opini<strong>on</strong> of outside counsel<br />
but there can be no guarantee of success <strong>on</strong> the merits.<br />
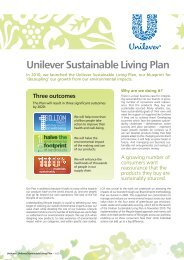
Corporate resp<strong>on</strong>sibility<br />
We seek to manage and grow our business around the world in<br />
a resp<strong>on</strong>sible and sustainable way. The values and standards by<br />
which we expect to be judged are set out in our Code of Business<br />
Principles.<br />
We aim to share these standards and values with our suppliers<br />
and c<strong>on</strong>tractors through our Business Partner Code, which sets<br />
out standards <strong>on</strong> ten key points of business integrity, labour<br />
standards, c<strong>on</strong>sumer safety and the envir<strong>on</strong>ment.<br />
The l<strong>on</strong>g-term success of our business is intimately linked with the<br />
vitality of the envir<strong>on</strong>ment and communities in which we operate.<br />
Each year we <str<strong>on</strong>g>report</str<strong>on</strong>g> <strong>on</strong> our c<strong>on</strong>tributi<strong>on</strong> to sustainable<br />
development. This is available <strong>on</strong>line at the Envir<strong>on</strong>ment & Society<br />
secti<strong>on</strong> of www.unilever.com. Our <str<strong>on</strong>g>report</str<strong>on</strong>g> describes how we are<br />
working in partnership to address issues such as poor nutriti<strong>on</strong><br />
and hygiene, how we c<strong>on</strong>tinue to work <strong>on</strong> reducing our<br />
envir<strong>on</strong>mental impacts, and our c<strong>on</strong>tributi<strong>on</strong>s of €78 milli<strong>on</strong> to<br />
communities. The strength of our commitment to sustainable<br />
development is reflected in our leadership of the food industry<br />
category of the Dow J<strong>on</strong>es Sustainability Indexes for the eighth<br />
year running.<br />
In our Operating review <strong>on</strong> pages 13 to 22 we give a glimpse of<br />
the ways in which our brands are addressing c<strong>on</strong>sumers’ social<br />
and envir<strong>on</strong>mental c<strong>on</strong>cerns.<br />
Risk management<br />
The following discussi<strong>on</strong> about risk management activities<br />
includes ‘forward-looking’ statements that involve risk and<br />
uncertainties. The actual results could differ materially from<br />
those projected. See the ‘Cauti<strong>on</strong>ary Statement’ <strong>on</strong> the inside<br />
back cover.<br />
<strong>Unilever</strong>’s system of risk management is outlined <strong>on</strong> page 66.<br />
Resp<strong>on</strong>sibility for establishing a coherent framework for the<br />
Group to manage risk resides with the Boards. The remit of the<br />
Boards is outlined <strong>on</strong> page 34.<br />
Particular risks and uncertainties that could cause actual results to<br />
vary from those described in forward-looking statements within<br />
this document, or which could impact <strong>on</strong> our ability to meet our<br />
published targets, have been identified. In this c<strong>on</strong>text the<br />
following specific risks have been identified as areas of focus<br />
in 2007.<br />
Sales and profit growth<br />
The increasingly competitive envir<strong>on</strong>ment, the further<br />
c<strong>on</strong>solidati<strong>on</strong> in the marketplace and c<strong>on</strong>tinued growth of<br />
discounters could adversely impact our rate of sales growth and<br />
our profit margins. In the light of this, we will c<strong>on</strong>tinue to invest<br />
in selected brands and high growth market areas to ensure that<br />
we deliver profitable sales growth. Our c<strong>on</strong>tinued sales and profit<br />
growth depends in large part <strong>on</strong> our ability to generate and<br />
implement a stream of c<strong>on</strong>sumer-relevant improvements to our<br />
products. The c<strong>on</strong>tributi<strong>on</strong> of innovati<strong>on</strong> is affected by the level of<br />
funding that can be made available, the technical capability of the<br />
research and development functi<strong>on</strong>s, and the success of operating<br />
management in rolling out quickly the resulting improvements.<br />
Our focus will c<strong>on</strong>tinue to be <strong>on</strong> developing our brands in ways<br />
that are distinctive and are relevant for our customers.<br />
<strong>Unilever</strong> <str<strong>on</strong>g>Annual</str<strong>on</strong>g> Report <strong>on</strong> Form 20-F <strong>2006</strong> 9<br />
Report of the Directors (c<strong>on</strong>tinued)
Report of the Directors (c<strong>on</strong>tinued)<br />
About <strong>Unilever</strong> (c<strong>on</strong>tinued)<br />
We have a number of large global brands, including 12 with an<br />
annual turnover greater than €1 billi<strong>on</strong>, which often depend <strong>on</strong><br />
global or regi<strong>on</strong>al development and supply chains. Any adverse<br />
event affecting c<strong>on</strong>sumer c<strong>on</strong>fidence or c<strong>on</strong>tinuity of supply of<br />
such a brand could have an impact in many markets. The carrying<br />
value of intangible assets associated with our brands is significant,<br />
and depends <strong>on</strong> the future success of those brands. There<br />
remains a risk that events affecting <strong>on</strong>e or more of our global<br />
brands could potentially impair the value of those brands.<br />
As the retail market place through which our products are<br />
distributed c<strong>on</strong>tinues to evolve, our growth and profitability can<br />
be threatened if we do not adapt our strategies and enhance our<br />
operati<strong>on</strong>al capabilities. It is important that we c<strong>on</strong>tinue to build<br />
and deepen relati<strong>on</strong>ships with our customers. Plans to raise our<br />
effectiveness in the trade, where necessary, receive increasing<br />
attenti<strong>on</strong> at all levels.<br />
Change initiatives<br />
The c<strong>on</strong>tinuing restructuring of the business which is designed to<br />
simplify our operati<strong>on</strong>s and leverage our scale more effectively,<br />
includes outsourcing back office support operati<strong>on</strong>s and<br />
c<strong>on</strong>verging regi<strong>on</strong>al processes and systems, and requires<br />
c<strong>on</strong>tinuing close management attenti<strong>on</strong> in 2007. Building <strong>on</strong> the<br />
experiences of <strong>2006</strong>, we will c<strong>on</strong>tinue to manage the risks in this<br />
area diligently and ensure that there are clear acti<strong>on</strong> plans to<br />
mitigate them. Key to this is the establishment and maintenance<br />
of project management processes to m<strong>on</strong>itor progress against<br />
milest<strong>on</strong>es and targets together with appropriate communicati<strong>on</strong><br />
programmes.<br />
People<br />
<strong>Unilever</strong>’s per<strong>form</strong>ance targets require it to have the right calibre<br />
of people at all levels. We must compete to obtain capable<br />
recruits for the business, and then train them in the skills and<br />
competencies that we need to deliver profitable growth. At a<br />
time of substantial change in the business there is a particular<br />
focus <strong>on</strong> creating alignment and energetic leadership, evidenced<br />
by the senior leadership programme that was launched in <strong>2006</strong>.<br />
Corporate reputati<strong>on</strong><br />
<strong>Unilever</strong> has created a str<strong>on</strong>g corporate reputati<strong>on</strong> over many<br />
years and many of our businesses have a high local profile. This<br />
reputati<strong>on</strong> is underpinned by ensuring that all employees embrace<br />
the principles prescribed in our Code of Business Principles.<br />
<strong>Unilever</strong> products carrying our well-known brand names are sold<br />
in over 100 countries. Should we fail to meet high product safety,<br />
social, envir<strong>on</strong>mental and ethical standards in all our operati<strong>on</strong>s<br />
and activities, <strong>Unilever</strong>’s corporate reputati<strong>on</strong> could be damaged,<br />
leading to the rejecti<strong>on</strong> of our products by c<strong>on</strong>sumers, damage to<br />
our brands and diversi<strong>on</strong> of management time into rebuilding our<br />
reputati<strong>on</strong>.<br />
Potential ec<strong>on</strong>omic instability<br />
Around 40% of <strong>Unilever</strong>’s turnover comes from the developing<br />
and emerging ec<strong>on</strong>omies. We have l<strong>on</strong>g experience in these<br />
markets, which are also an important source of our growth. These<br />
ec<strong>on</strong>omies are typically more volatile than those in the developed<br />
10 <strong>Unilever</strong> <str<strong>on</strong>g>Annual</str<strong>on</strong>g> Report <strong>on</strong> Form 20-F <strong>2006</strong><br />
world, and there is a risk of downturns in c<strong>on</strong>sumer demand that<br />
would reduce the sales of our products. We will c<strong>on</strong>tinue to<br />
m<strong>on</strong>itor closely per<strong>form</strong>ance in the most volatile markets and<br />
resp<strong>on</strong>d quickly to protect our business. In cases of extreme social<br />
disrupti<strong>on</strong>, protecting our people is always the priority.<br />
Price and supply of raw materials and<br />
commodities c<strong>on</strong>tracts<br />
Prices of raw materials and commodities increased significantly<br />
throughout <strong>2006</strong>, adversely impacting margin where we were<br />
unable to pass <strong>on</strong> increased costs. To mitigate such risks, and<br />
where appropriate, we purchase forward c<strong>on</strong>tracts for raw<br />
materials and commodities, almost always for physical delivery.<br />
Where appropriate we also use futures c<strong>on</strong>tracts to hedge future<br />
price movements; however, the amounts are not material.<br />
Insurance of risks<br />
As a multinati<strong>on</strong>al group with diverse product offerings and<br />
operati<strong>on</strong>s in more than 100 countries, <strong>Unilever</strong> is subject to<br />
varying degrees of risk and uncertainty. It does not take out<br />
insurance against all risks and retains a significant element of<br />
exposure to those risks against which it does insure. However,<br />
it insures its business assets in each country against insurable<br />
risks as it deems appropriate.<br />
Financial risks<br />
In additi<strong>on</strong> to the above, <strong>Unilever</strong> is exposed to various specific<br />
risks in c<strong>on</strong>necti<strong>on</strong> with its financial operati<strong>on</strong>s and results.<br />
These include the following:<br />
• The impact of movement in equity markets, interest rates and<br />
life expectancy <strong>on</strong> net pensi<strong>on</strong> liabilities;<br />
• Maintenance of group cash flows at an appropriate level;<br />
• Exposure of debt and cash positi<strong>on</strong>s to changes in interest rates;<br />
• Potential impact of changes in exchange rates <strong>on</strong> the Group’s<br />
earnings and <strong>on</strong> the translati<strong>on</strong> of its underlying net assets;<br />
• Liquidity and counterparty risks; and<br />
• Risks associated with the holding of our own shares in<br />
c<strong>on</strong>necti<strong>on</strong> with share-based remunerati<strong>on</strong> schemes.<br />
Further in<strong>form</strong>ati<strong>on</strong> about these, including sensitivity analysis to<br />
changes in certain of the key measures, is given in note 17 <strong>on</strong><br />
pages 100 and 101 and note 20 <strong>on</strong> page 105.<br />
Other risks<br />
<strong>Unilever</strong>’s businesses are exposed to varying degrees of risk and<br />
uncertainty related to other factors including competitive pricing,<br />
c<strong>on</strong>sumpti<strong>on</strong> levels, physical risks, legislative, fiscal, tax and<br />
regulatory developments, terrorism and ec<strong>on</strong>omic, political, and<br />
social c<strong>on</strong>diti<strong>on</strong>s in the envir<strong>on</strong>ments where we operate. All of<br />
these risks could materially affect the Group’s business, our<br />
turnover, operating profit, net profit, net assets and liquidity.<br />
There may be risks which are unknown to <strong>Unilever</strong> or which are<br />
currently believed to be immaterial.
Group Chief Executive<br />
We are grateful to those shareholders and other stakeholders<br />
who resp<strong>on</strong>ded to our invitati<strong>on</strong> <strong>on</strong> the <strong>Unilever</strong> website to post<br />
questi<strong>on</strong>s for Patrick Cescau. A number of their questi<strong>on</strong>s are<br />
reflected in the Q&A below.<br />
How do you look back <strong>on</strong> <strong>2006</strong>?<br />
We are <strong>on</strong> a journey to restore <strong>Unilever</strong>’s competitiveness and<br />
growth potential. That journey is <strong>on</strong>going but I think we can look<br />
back <strong>on</strong> <strong>2006</strong> with some pride and satisfacti<strong>on</strong>.<br />
The improving top-line per<strong>form</strong>ance recorded during the year<br />
suggests that the wide-ranging changes we made to the business<br />
in 2004 and 2005 – both to our organisati<strong>on</strong> and to our strategy<br />
– were the right <strong>on</strong>es for <strong>Unilever</strong>. They are putting us firmly <strong>on</strong><br />
the road to sustained growth.<br />
I also believe that we will look back <strong>on</strong> <strong>2006</strong> as the year when<br />
the business regained its c<strong>on</strong>fidence and self-belief after the<br />
setbacks of recent years. There is a new energy and optimism<br />
flowing through the Group.<br />
What pleased you most about the Group’s per<strong>form</strong>ance<br />
last year?<br />
The quality and the broad-based nature of our growth. All parts<br />
of the business – all regi<strong>on</strong>s and all categories – c<strong>on</strong>tributed to<br />
healthy underlying sales growth of 3.8%. Our cash flow positi<strong>on</strong><br />
in <strong>2006</strong> was also str<strong>on</strong>g, and it was a sign of the growing<br />
financial health of the business that we were able to return<br />
an additi<strong>on</strong>al €750 milli<strong>on</strong> to shareholders in the <strong>form</strong> of a<br />
<strong>on</strong>e-off dividend.<br />
Our per<strong>form</strong>ance was particularly str<strong>on</strong>g in those areas we had<br />
identified as growth priorities and where we had invested<br />
accordingly – for example, in developing and emerging markets<br />
(D&E) and in our pers<strong>on</strong>al care business, which grew by an<br />
impressive 6.3%. This is particularly pleasing and encouraging<br />
because it suggests the strategy we are following – investing<br />
heavily in order to obtain leadership positi<strong>on</strong>s in high growth<br />
areas – is the right <strong>on</strong>e to take us forward.<br />
I would also highlight our per<strong>form</strong>ance in Europe, which has been<br />
a tough market for us in recent years. Last year we re-doubled<br />
our efforts and this was rewarded in steadily improving results<br />
and a return to modest growth levels.<br />
Were there any areas where you had hoped to make<br />
greater progress during <strong>2006</strong>?<br />
Restoring <strong>Unilever</strong>’s competitiveness has involved making a lot of<br />
changes to the business. In order to deliver sustained growth and<br />
create value for shareholders, we have re<strong>form</strong>ed our governance,<br />
overhauled our organisati<strong>on</strong> and put in place a whole new<br />
strategy to take the business forward.<br />
Inevitably, changes <strong>on</strong> this scale are going to proceed at differing<br />
speeds. Overall I am satisfied with where we are at this stage in<br />
the trans<strong>form</strong>ati<strong>on</strong> of the Group. Equally, I know that we have<br />
some challenges ahead, in particular delivering more profitable<br />
growth. While our operating margin in <strong>2006</strong> was satisfactory, we<br />
must strive for a better per<strong>form</strong>ance in the year ahead. We<br />
weren’t helped in <strong>2006</strong> by higher than expected costs resulting<br />
from sharp increases in commodity prices, but that has merely<br />
served to highlight the importance of the measures we are taking<br />
to simplify our business and to squeeze out unnecessary costs.<br />
Since becoming Group Chief Executive you have embarked<br />
<strong>on</strong> a significant programme of organisati<strong>on</strong>al change and<br />
restructuring. Do you feel that you now have the right<br />
organisati<strong>on</strong> in place to drive <strong>Unilever</strong>’s growth?<br />
It is the nature of things today that you have to keep the<br />
workings of any organisati<strong>on</strong> under c<strong>on</strong>stant review. As a<br />
business, that is the <strong>on</strong>ly way to ensure you are best serving the<br />
interests of shareholders and other stakeholders. But yes, I do<br />
believe we are well advanced with the organisati<strong>on</strong>al changes<br />
needed to support the next stage of our development.<br />
Indeed, we are already deriving significant benefits from the<br />
changes we have made, not least from our more streamlined<br />
governance and management structures. Furthermore, our ‘One<br />
<strong>Unilever</strong>’ programme c<strong>on</strong>tinues to deliver both greater clarity and<br />
significant savings as it is steadily rolled out across the whole<br />
business. These are all helping to deliver the speed and the scale<br />
we need to compete more effectively and could be seen reflected<br />
last year in more global brand plat<strong>form</strong>s, the faster roll-out of<br />
products and the launch of bigger and better innovati<strong>on</strong>s.<br />
But we are not complacent. We know that we will have to<br />
quicken the pace of change even further in the year ahead if we<br />
are to meet our goal of moving from competing to winning in<br />
the marketplace.<br />
You have put the c<strong>on</strong>cept of ‘Vitality’ at the heart of the<br />
Group’s missi<strong>on</strong>. What evidence is there that it has had a<br />
direct impact <strong>on</strong> per<strong>form</strong>ance in <strong>2006</strong>?<br />
Vitality is about directing our business towards the increasing<br />
desire and emphasis <strong>on</strong> the part of c<strong>on</strong>sumers the world over to<br />
feel good, look good and to get more out of life. As a business<br />
whose brands deliver health, hygiene and nutriti<strong>on</strong>al benefits, we<br />
are perhaps uniquely well placed to resp<strong>on</strong>d to these evolving<br />
c<strong>on</strong>sumer trends.<br />
To that end, Vitality is already directly impacting our per<strong>form</strong>ance.<br />
It is a key element in guiding us to those high growth spaces we<br />
now regard as critical to <strong>Unilever</strong>’s l<strong>on</strong>g-term success. It is also<br />
perhaps the single biggest factor driving our innovati<strong>on</strong><br />
programme. The successful launch in the UK last year of AdeZ<br />
– a soya-based fruit drink – is a good example, <strong>on</strong>e that can be<br />
traced directly to our Vitality missi<strong>on</strong> and our determinati<strong>on</strong> to<br />
c<strong>on</strong>tinue developing products with proven nutriti<strong>on</strong>al benefits.<br />
<strong>Unilever</strong> <str<strong>on</strong>g>Annual</str<strong>on</strong>g> Report <strong>on</strong> Form 20-F <strong>2006</strong> 11<br />
Report of the Directors (c<strong>on</strong>tinued)
Report of the Directors (c<strong>on</strong>tinued)<br />
Group Chief Executive (c<strong>on</strong>tinued)<br />
What did you mean when you said last year that the<br />
successful brands of the future would be those that not<br />
<strong>on</strong>ly satisfied c<strong>on</strong>sumers’ functi<strong>on</strong>al needs, but also<br />
addressed their c<strong>on</strong>cerns as citizens?<br />
We have always believed that the health and prosperity of our<br />
business is linked to the health of the communities we serve,<br />
which is why we c<strong>on</strong>tributed €78 milli<strong>on</strong> to communities last year.<br />
However, we also know that c<strong>on</strong>sumers increasingly expect<br />
companies and brands to play a role in resp<strong>on</strong>ding to their<br />
c<strong>on</strong>cerns as citizens around issues such as climate change, or<br />
helping to address poor nutriti<strong>on</strong> and disease in some of the most<br />
impoverished parts of the world.<br />
Working in partnership with governments, internati<strong>on</strong>al agencies<br />
and NGOs is often the most effective way to help address these<br />
major global threats, and <strong>Unilever</strong> has already embarked <strong>on</strong> a<br />
number of such partnerships, including for example with UNICEF<br />
and with the United Nati<strong>on</strong>s World Food Programme.<br />
However, individual brands can and do make a difference. The<br />
remarkable success of Surf Excel in India, for example, which is<br />
helping to reduce the amount of water used in laundry in some<br />
of the country’s most water-stressed regi<strong>on</strong>s, is a good case in<br />
point. So is our success in combating iodine deficiency in parts of<br />
Africa through our iodised salt brand Annapurna. These and other<br />
initiatives dem<strong>on</strong>strate that it is possible to do good and do well,<br />
and they have c<strong>on</strong>vinced us that this is the right directi<strong>on</strong> for<br />
<strong>Unilever</strong> to take.<br />
How do you intend to positi<strong>on</strong> <strong>Unilever</strong> so that it can<br />
benefit most from the huge rise in markets like China<br />
and India?<br />
There is no doubt that the most significant growth opportunities<br />
for <strong>Unilever</strong> lie in the D&E ec<strong>on</strong>omies, and not just in China and<br />
India. Already, D&E markets account for more than 40% of<br />
<strong>Unilever</strong>’s turnover and that proporti<strong>on</strong> is set to go <strong>on</strong> rising.<br />
Our history in these countries, going back to the very origins of<br />
the Group, combined with our existing scale and reach across<br />
much of the developing world, means we are very well positi<strong>on</strong>ed<br />
to benefit from the shifts taking place in the global ec<strong>on</strong>omy.<br />
Our per<strong>form</strong>ance in <strong>2006</strong> certainly gives grounds for optimism.<br />
Last year, we grew by nearly 8% in D&E markets. That included<br />
some spectacular per<strong>form</strong>ances, not least in China where growth<br />
of nearly 30% was powered directly by the changes we are<br />
making to the business.<br />
12 <strong>Unilever</strong> <str<strong>on</strong>g>Annual</str<strong>on</strong>g> Report <strong>on</strong> Form 20-F <strong>2006</strong><br />
<strong>Unilever</strong>’s first independent N<strong>on</strong>-Executive Chairman takes<br />
up positi<strong>on</strong> in May. What are your expectati<strong>on</strong>s?<br />
I think it marks a significant stage in the life of the Group. It is<br />
the latest in a series of important governance re<strong>form</strong>s that are<br />
bringing us into line with best corporate practice. At the pers<strong>on</strong>al<br />
level, I am very much looking forward to working with Michael<br />
Treschow, who brings a wealth of relevant experience to bear.<br />
We are all excited by his appointment. At the same time, I would<br />
like to thank Ant<strong>on</strong>y Burgmans, our current Chairman, for his<br />
significant c<strong>on</strong>tributi<strong>on</strong> to <strong>Unilever</strong> over the last 35 years. I would<br />
also like to thank two members of the <strong>Unilever</strong> Executive who<br />
have also made a significant c<strong>on</strong>tributi<strong>on</strong> to <strong>Unilever</strong> over a l<strong>on</strong>g<br />
period who will leave us in 2007 – Rudy Markham and John Rice.<br />
What are your ambiti<strong>on</strong>s for <strong>Unilever</strong> as you look ahead to<br />
2007 and bey<strong>on</strong>d and what do you think will present the<br />
biggest challenges?<br />
We have made clear that our l<strong>on</strong>g-term ambiti<strong>on</strong> is to be am<strong>on</strong>g<br />
the top third of our peer group in terms of total shareholder<br />
return (TSR). That is a stretching but achievable goal. In 2007 our<br />
aim is to c<strong>on</strong>tinue delivering sustained underlying sales growth<br />
while at the same time improving our operating margin. We are<br />
all focused <strong>on</strong> that task.<br />
One of the other key challenges we face in 2007 will be to<br />
ensure that we obtain an even greater return <strong>on</strong> the significant<br />
investment we have made in upgrading our skills and capabilities<br />
in those areas identified as critical to the l<strong>on</strong>g-term success of the<br />
business – marketing, customer management, and research and<br />
development. We have made enormous strides in each of these<br />
areas in recent years, but really have the opportunity now in 2007<br />
to accelerate the level of per<strong>form</strong>ance.
Operating review by regi<strong>on</strong><br />
Basis of <str<strong>on</strong>g>report</str<strong>on</strong>g>ing<br />
In this Operating review we comment <strong>on</strong> our changes in revenue<br />
<strong>on</strong> the basis of underlying sales growth (USG). This measure<br />
reflects the change in revenue at c<strong>on</strong>stant rates of exchange,<br />
(average exchange rates for the preceding year) excluding the<br />
effects of acquisiti<strong>on</strong>s and disposals. It is a measure that provides<br />
valuable additi<strong>on</strong>al in<strong>form</strong>ati<strong>on</strong> <strong>on</strong> the underlying per<strong>form</strong>ance<br />
of the business. In particular, it presents the organic growth of<br />
our business year <strong>on</strong> year and is used internally as a core measure<br />
of sales per<strong>form</strong>ance.<br />
USG is not a measure which is defined under either IFRS or US<br />
GAAP. It should not be c<strong>on</strong>sidered in isolati<strong>on</strong> from, or as a<br />
substitute for, financial in<strong>form</strong>ati<strong>on</strong> presented in compliance<br />
with either IFRS or US GAAP. This measure as <str<strong>on</strong>g>report</str<strong>on</strong>g>ed by us<br />
may not be comparable with similarly titled measures <str<strong>on</strong>g>report</str<strong>on</strong>g>ed<br />
by other companies.<br />
The rec<strong>on</strong>ciliati<strong>on</strong> of USG to turnover for each of our <str<strong>on</strong>g>report</str<strong>on</strong>g>ing<br />
regi<strong>on</strong>s is given in the following secti<strong>on</strong>, and for the Group in<br />
total <strong>on</strong> page 25.<br />
The <str<strong>on</strong>g>report</str<strong>on</strong>g>ing in this secti<strong>on</strong> is based <strong>on</strong> results for c<strong>on</strong>tinuing<br />
operati<strong>on</strong>s. Following the disposal of the majority of our<br />
European frozen foods businesses during <strong>2006</strong>, the operati<strong>on</strong>s<br />
which we classify under this heading are different from those<br />
which were included as c<strong>on</strong>tinuing operati<strong>on</strong>s in our Report and<br />
Accounts 2005.<br />
<strong>Unilever</strong> <str<strong>on</strong>g>Annual</str<strong>on</strong>g> Report <strong>on</strong> Form 20-F <strong>2006</strong> 13<br />
Report of the Directors (c<strong>on</strong>tinued)
Report of the Directors (c<strong>on</strong>tinued)<br />
Operating review by regi<strong>on</strong> Europe<br />
Europe<br />
Turnover (€ milli<strong>on</strong>)<br />
C<strong>on</strong>tinuing operati<strong>on</strong>s<br />
<strong>2006</strong><br />
2005<br />
2004<br />
15 000<br />
14 940<br />
15 252<br />
€ milli<strong>on</strong> € milli<strong>on</strong> € milli<strong>on</strong> Year <strong>on</strong> year change Year <strong>on</strong> year change<br />
at current exchange rates at c<strong>on</strong>stant exchange rates<br />
C<strong>on</strong>tinuing operati<strong>on</strong>s <strong>2006</strong> 2005 <strong>2006</strong> 2005<br />
at current rates of exchange <strong>2006</strong> 2005 2004 vs 2005 vs 2004 vs 2005 vs 2004<br />
Turnover 15 000 14 940 15 252 0.4% (2.0)% 0.2% (2.4)%<br />
Operating profit 1 903 2 064 2 045 (7.7)% 0.8% (7.9)% 0.6%<br />
Operating margin 12.7% 13.8% 13.4%<br />
Restructuring, business disposals,<br />
impairment charges and <strong>on</strong>e-time gain <strong>on</strong> UK<br />
pensi<strong>on</strong> plans included in operating margin (1.4)% (0.9)% (2.7)%<br />
<strong>2006</strong> 2005<br />
Turnover and underlying sales growth vs 2005 vs 2004<br />
Underlying sales growth (%) 1.0 (0.4)<br />
Effect of acquisiti<strong>on</strong>s (%) 0.1 0.0<br />
Effect of disposals (%) (0.9) (2.1)<br />
Effect of exchange rates (%) 0.2 0.4<br />
Turnover growth (%) 0.4 (2.0)<br />
<strong>2006</strong> compared with 2005<br />
Turnover at current rates of exchange rose by 0.4%, after the<br />
impact of acquisiti<strong>on</strong>s, disposals and exchange rate changes as<br />
set out in the table above. Operating profit at current rates of<br />
exchange fell by 7.7%, after including a favourable currency<br />
movement of 0.2%. The underlying per<strong>form</strong>ance of the business<br />
after eliminating these exchange translati<strong>on</strong> effects and the<br />
impact of acquisiti<strong>on</strong>s and disposals is discussed below at<br />
c<strong>on</strong>stant exchange rates.<br />
We have d<strong>on</strong>e much work in Europe to make our business more<br />
competitive. In particular there has been a single-minded drive to<br />
improve the value we offer c<strong>on</strong>sumers, plus a str<strong>on</strong>g innovati<strong>on</strong><br />
programme targeted at the core of our portfolio. Simultaneously,<br />
the implementati<strong>on</strong> of our ‘One <strong>Unilever</strong>’ programme, the<br />
building of capabilities and changes in leadership are all<br />
resulting in better executi<strong>on</strong>.<br />
These differences, combined with improved c<strong>on</strong>sumer demand,<br />
returned the regi<strong>on</strong> to modest growth. Underlying sales grew<br />
by 1% in the year – entirely from volume. Market shares were<br />
broadly stable with gains in ice cream, soups, deodorants and<br />
body care. However, there were losses in laundry, hair care<br />
and tea.<br />
The UK, our largest European business, returned to growth in<br />
the year with good results across most Foods and pers<strong>on</strong>al care<br />
ranges. Although laundry sales declined, there have been<br />
promising signs of progress in recent market shares with Persil<br />
regaining its positi<strong>on</strong> as the country’s leading laundry brand.<br />
The Netherlands had a str<strong>on</strong>g year. A pi<strong>on</strong>eer of ‘One <strong>Unilever</strong>’,<br />
it benefited from operating as a single company. Highlights were<br />
rapid growth for Lipt<strong>on</strong>, Dove, Rex<strong>on</strong>a and Axe.<br />
14 <strong>Unilever</strong> <str<strong>on</strong>g>Annual</str<strong>on</strong>g> Report <strong>on</strong> Form 20-F <strong>2006</strong><br />
Operating profit (€ milli<strong>on</strong>)<br />
C<strong>on</strong>tinuing operati<strong>on</strong>s<br />
<strong>2006</strong><br />
2005<br />
2004<br />
1 903<br />
2 064<br />
2 045<br />
Operating margin (%)<br />
C<strong>on</strong>tinuing operati<strong>on</strong>s<br />
<strong>2006</strong><br />
2005<br />
2004<br />
France remained a difficult market with sales lower in spreads,<br />
laundry and hair care. New management is now in place and<br />
there was an improvement in the sec<strong>on</strong>d half of the year.<br />
Sales in Germany held up better in <strong>2006</strong>. There was good growth<br />
for pers<strong>on</strong>al care brands but some turnover in Lipt<strong>on</strong> ice tea was<br />
lost following changes in rules for bottle returns.<br />
Central and Eastern Europe c<strong>on</strong>tinued to do well, driven by<br />
double-digit growth in Russia.<br />
The sale of the majority of our European frozen foods businesses<br />
to Permira was successfully completed during the year.<br />
Our <strong>2006</strong> innovati<strong>on</strong> programmes have resulted in our Foods<br />
brands wholeheartedly embracing the c<strong>on</strong>cept of Vitality, with<br />
new products designed to deliver the health benefits that<br />
c<strong>on</strong>sumers seek. Rama/Blue Band Idea! – spreads with added<br />
nutrients which are beneficial to children’s mental development<br />
– was launched in <strong>2006</strong> and is being rapidly rolled out in 2007.<br />
Throughout 2007 cause-related promoti<strong>on</strong>al activities associated<br />
with these brands will support the United Nati<strong>on</strong>s World Food<br />
Programme, improving awareness of child hunger and raising<br />
funds to alleviate it.<br />
A range of Knorr bouill<strong>on</strong> cubes with selected natural ingredients<br />
and a better, richer taste has been rolled out across the regi<strong>on</strong>,<br />
while Vie <strong>on</strong>e-shot fruit and vegetable products are now available<br />
in 12 countries. Meanwhile, Latin America’s AdeS drink, a healthy<br />
blend of fruit juices and soya, has been launched successfully in<br />
the UK as AdeZ.<br />
12.7<br />
13.8<br />
13.4
Operating review by regi<strong>on</strong> Europe (c<strong>on</strong>tinued)<br />
<strong>2006</strong> compared with 2005 (c<strong>on</strong>tinued)<br />
Product launches with clear functi<strong>on</strong>al or emoti<strong>on</strong>al benefits in<br />
Home and Pers<strong>on</strong>al Care brands are being rolled out rapidly<br />
across the regi<strong>on</strong>. A range of new Dove launches included the<br />
moisturising self-tan Dove Summer Glow. Meanwhile in<br />
household care, Domestos 5x c<strong>on</strong>tinues to kill germs even after<br />
several flushes and the cleaning power of Cif has been applied<br />
to a series of power sprays.<br />
The operating margin, at 12.7%, was 1.1 percentage points<br />
lower than a year ago, with higher net costs for restructuring,<br />
disposals and impairments, partially offset by a <strong>on</strong>e-time gain of<br />
€120 milli<strong>on</strong> from changes to the UK pensi<strong>on</strong>s plan. Before these<br />
items, the operating margin would have been 0.6 percentage<br />
points lower than in 2005. Margins in Foods were lower than in<br />
2005 as we absorbed significant increases in commodity costs<br />
which were <strong>on</strong>ly partly compensated by savings programmes.<br />
2005 compared with 2004<br />
Turnover at current rates of exchange fell by 2.0%, mainly due<br />
to disposals, and including a positive impact from currency<br />
movements of 0.4%. Operating profit at current rates of<br />
exchange rose by 0.8%, including a favourable effect of currency<br />
movements of 0.2%. The underlying per<strong>form</strong>ance of the business<br />
after eliminating these exchange translati<strong>on</strong> effects and the<br />
impact of acquisiti<strong>on</strong>s and disposals is discussed below at<br />
c<strong>on</strong>stant exchange rates.<br />
Our priority in Europe was to regain momentum and improve<br />
competitiveness. The focus was <strong>on</strong> enhancing the value to<br />
c<strong>on</strong>sumers of our products through keener pricing, improved<br />
quality and more and better innovati<strong>on</strong>.<br />
Marketing support was raised to a more competitive level with<br />
additi<strong>on</strong>al spend deployed against our best opportunities, and the<br />
organisati<strong>on</strong> was streamlined.<br />
We made progress during the year. Volume was slightly positive,<br />
but investment in pricing meant that underlying sales declined by<br />
0.4% in the year.<br />
Central and Eastern Europe per<strong>form</strong>ed well in buoyant markets,<br />
notably in Russia which was ahead by nearly 20%.<br />
Western Europe was challenging, with c<strong>on</strong>tinued weak c<strong>on</strong>sumer<br />
demand. Our businesses grew in the Netherlands and Spain, but<br />
declined in France, Germany and the UK.<br />
In Foods, we have held overall market share through the course<br />
of the year, with growth across all key categories apart from<br />
frozen foods.<br />
In Home and Pers<strong>on</strong>al Care we had a disappointing year and we<br />
have lost market share, particularly in the UK.<br />
New product launches in 2005 included Knorr Vie mini shots,<br />
extensi<strong>on</strong>s of the Becel/Flora pro•activ heart health range, soups<br />
fortified with vitamins and low-fat soups.<br />
We introduced a Rex<strong>on</strong>a Sport variant in deodorants, Axe shower<br />
gel and Sunsilk hair styling products. We further improved our<br />
home care product range with launches that address specific<br />
c<strong>on</strong>sumer needs, such as ‘no-need-to-pre-treat’ laundry<br />
detergents, Sun 4-in-1 dishwash and Domestos sink and<br />
drain unblocker.<br />
The operating margin, at 13.8%, was 0.4 percentage points<br />
higher than in 2004. Increased advertising and promoti<strong>on</strong>s and<br />
pricing investment together with higher input costs were partly<br />
offset by productivity gains. Net restructuring, disposal and<br />
impairment costs, at 0.9% were 1.8 percentage points lower<br />
than in 2004.<br />
<strong>Unilever</strong> <str<strong>on</strong>g>Annual</str<strong>on</strong>g> Report <strong>on</strong> Form 20-F <strong>2006</strong> 15<br />
Report of the Directors (c<strong>on</strong>tinued)
Report of the Directors (c<strong>on</strong>tinued)<br />
Operating review by regi<strong>on</strong> The Americas<br />
The Americas<br />
Turnover (€ milli<strong>on</strong>)<br />
C<strong>on</strong>tinuing operati<strong>on</strong>s<br />
<strong>2006</strong><br />
2005<br />
2004<br />
13 779<br />
13 179<br />
12 296<br />
€ milli<strong>on</strong> € milli<strong>on</strong> € milli<strong>on</strong> Year <strong>on</strong> year change Year <strong>on</strong> year change<br />
at current exchange rates at c<strong>on</strong>stant exchange rates<br />
C<strong>on</strong>tinuing operati<strong>on</strong>s <strong>2006</strong> 2005 <strong>2006</strong> 2005<br />
at current rates of exchange <strong>2006</strong> 2005 2004 vs 2005 vs 2004 vs 2005 vs 2004<br />
Turnover 13 779 13 179 12 296 4.6% 7.2% 3.1% 3.4%<br />
Operating profit 2 178 1 719 896 26.7% 91.9% 25.0% 83.6%<br />
Operating margin 15.8% 13.0% 7.3%<br />
Restructuring, business disposals,<br />
impairment charges and <strong>on</strong>e-time gain <strong>on</strong> US<br />
healthcare plans included in operating margin 0.0% (3.4)% (9.2)%<br />
<strong>2006</strong> 2005<br />
Turnover and underlying sales growth vs 2005 vs 2004<br />
Underlying sales growth (%) 3.7 4.1<br />
Effect of acquisiti<strong>on</strong>s (%) 0.1 0.0<br />
Effect of disposals (%) (0.7) (0.7)<br />
Effect of exchange rates (%) 1.4 3.6<br />
Turnover growth (%) 4.6 7.2<br />
<strong>2006</strong> compared with 2005<br />
Turnover at current rates of exchange rose by 4.6%, after the<br />
impact of acquisiti<strong>on</strong>s, disposals and exchange rate changes as<br />
set out in the table above. Operating profit at current rates of<br />
exchange rose by 26.7%, after including a favourable currency<br />
movement of 1.4%. The underlying per<strong>form</strong>ance of the business<br />
after eliminating these exchange translati<strong>on</strong> effects and the<br />
impact of acquisiti<strong>on</strong>s and disposals is discussed below at<br />
c<strong>on</strong>stant exchange rates.<br />
Overall, we have maintained share in the US in markets which are<br />
growing at around 3%. Underlying sales growth in the US was<br />
2.4%, partly reflecting the effect of trade de-stocking in pers<strong>on</strong>al<br />
care brands during the first half of the year and in ice cream in<br />
the sec<strong>on</strong>d half. Degree, Dove and Axe – our three main<br />
deodorants brands – all gained share. The launch of Sunsilk<br />
drove growth in haircare. In laundry we initiated the move to<br />
c<strong>on</strong>centrated liquids but have lost further share in c<strong>on</strong>venti<strong>on</strong>al<br />
detergents.<br />
Bertolli frozen meals, Lipt<strong>on</strong> ready-to-drink tea, in our joint<br />
venture with Pepsi, and Slim•Fast all gained share in the US with<br />
the latter making weight loss accessible, affordable and<br />
achievable for c<strong>on</strong>sumers everywhere. Our share for the year as a<br />
whole was also up in ice cream, although sales were down. The<br />
sector has been heavily promoted in recent years but in <strong>2006</strong> the<br />
level of promoti<strong>on</strong>al intensity reduced. As a result, the trade used<br />
up stocks and bought less.<br />
Sales in Brazil picked up well after a slow start, with very good<br />
innovati<strong>on</strong>-driven per<strong>form</strong>ances in hair, deodorants and laundry.<br />
Indeed, Omo’s brand share was at its highest level for many years.<br />
16 <strong>Unilever</strong> <str<strong>on</strong>g>Annual</str<strong>on</strong>g> Report <strong>on</strong> Form 20-F <strong>2006</strong><br />
Operating profit (€ milli<strong>on</strong>)<br />
C<strong>on</strong>tinuing operati<strong>on</strong>s<br />
<strong>2006</strong><br />
2005<br />
2004<br />
896<br />
1 719<br />
2 178<br />
Operating margin (%)<br />
C<strong>on</strong>tinuing operati<strong>on</strong>s<br />
<strong>2006</strong><br />
2005<br />
2004<br />
Sales in Mexico were lower for the year, affected by a combinati<strong>on</strong><br />
of a decline in the traditi<strong>on</strong>al retail trade and local low-priced<br />
competiti<strong>on</strong>. In additi<strong>on</strong>, there were several operati<strong>on</strong>al issues<br />
which have since been addressed. The business returned to<br />
growth in the fourth quarter. Elsewhere there was good growth in<br />
Argentina, Central America and Venezuela. Taken together, sales in<br />
Latin America were ahead by 5.8% with Home and Pers<strong>on</strong>al Care<br />
brands c<strong>on</strong>tinuing to do well. However, there was more modest<br />
growth in Foods brands due to tough local competiti<strong>on</strong>.<br />
New products introduced in the US included Wish-B<strong>on</strong>e Salad<br />
Spritzers with <strong>on</strong>e calorie per spray, further development of the<br />
Bertolli premium frozen meal range, and Lipt<strong>on</strong> pyramid tea bags.<br />
Across the regi<strong>on</strong>, new Knorr soups and bouill<strong>on</strong>s cater for local<br />
tastes. The highly successful AdeS nutriti<strong>on</strong>al drink has been<br />
extended with a ‘light’ variant, new fruit flavours and the launch<br />
of soymilk in Brazil and Mexico.<br />
We strengthened our hair portfolio with the launch of Sunsilk,<br />
improved both the Suave and Dove haircare lines and sold the<br />
Aquanet and Finesse brands. We had a good sales resp<strong>on</strong>se to<br />
all Small & Mighty c<strong>on</strong>centrated liquid detergents. These use<br />
reduced-size packaging to save water, cardboard and energy use<br />
in producti<strong>on</strong>, packaging and transport. They are also easier for<br />
c<strong>on</strong>sumers to carry, pour and store. We then applied all Small &<br />
Mighty’s product technology to fabric c<strong>on</strong>diti<strong>on</strong>ers, creating<br />
Snuggle Exhilarati<strong>on</strong>s – a three-times more c<strong>on</strong>centrated premium<br />
sub-range delivering superior fragrance. In Brazil, Omo has been<br />
further strengthened with a new top-per<strong>form</strong>ance product<br />
including baby and foam c<strong>on</strong>trol variants.<br />
7.3<br />
13.0<br />
15.8
Operating review by regi<strong>on</strong> The Americas (c<strong>on</strong>tinued)<br />
<strong>2006</strong> compared with 2005 (c<strong>on</strong>tinued)<br />
The operating margin, at 15.8%, was 2.8 percentage points<br />
higher than a year ago. There were lower costs for restructuring,<br />
disposals and impairments, and a <strong>on</strong>e-time benefit in <strong>2006</strong> of<br />
€146 milli<strong>on</strong> from changes to US healthcare plans. In 2005 there<br />
was a gain <strong>on</strong> the sale of an office. Before these items the<br />
operating margin would have been 0.3 percentage points lower<br />
than last year. Innovati<strong>on</strong>-driven marketing mix, pricing and<br />
productivity offset high commodity costs. Advertising and<br />
promoti<strong>on</strong>s were increased to support major brand launches.<br />
2005 compared with 2004<br />
Turnover at current rates of exchange rose by 7.2%, including a<br />
positive impact from currency movements of 3.6%. Operating<br />
profit at current rates of exchange was 92% higher than in 2004,<br />
including a favourable impact from currency movements of 8.3%.<br />
The underlying per<strong>form</strong>ance of the business after eliminating<br />
these exchange translati<strong>on</strong> effects and the impact of disposals<br />
is discussed below at c<strong>on</strong>stant exchange rates.<br />
Underlying sales grew by 4%, all coming from volume gains,<br />
broadly based across the regi<strong>on</strong>, underpinned by a successful<br />
innovati<strong>on</strong> programme.<br />
C<strong>on</strong>sumer demand in the US showed a sustained recovery. Our<br />
sales in the US grew by 3.2%, accelerating through the year, and<br />
we gained market share in aggregate.<br />
In Brazil and Mexico, a str<strong>on</strong>g first half was followed by relatively<br />
weaker demand in the sec<strong>on</strong>d half of the year. We grew in line<br />
with our markets in Home and Pers<strong>on</strong>al Care, but saw some share<br />
loss in Foods.<br />
Growth in Pers<strong>on</strong>al Care across the regi<strong>on</strong> was driven by good<br />
c<strong>on</strong>sumer resp<strong>on</strong>se to our initiatives, including Vitality innovati<strong>on</strong><br />
and c<strong>on</strong>sistent support. This was particularly evident in the<br />
deodorants and pers<strong>on</strong>al wash categories, with str<strong>on</strong>g doubledigit<br />
growth for Axe, now the number <strong>on</strong>e deodorant in the US,<br />
and for the Dove and Rex<strong>on</strong>a brands.<br />
Another str<strong>on</strong>g Foods per<strong>form</strong>ance in the US was driven by<br />
further share gains in ice cream, c<strong>on</strong>tinued good results from the<br />
extensi<strong>on</strong> of the Country Crock and Bertolli brands into new<br />
categories, and from Lipt<strong>on</strong> ready-to-drink and speciality teas.<br />
Slim•Fast c<strong>on</strong>tinued to regain share, but in a much c<strong>on</strong>tracted<br />
weight management market and sales were well below the<br />
previous year.<br />
New launches in the US included the well received Dove Cool<br />
Moisture range and the extensi<strong>on</strong> of Axe into male shower<br />
gels. In Latin America our brands were also very successful in<br />
c<strong>on</strong>necting with younger c<strong>on</strong>sumers through Rex<strong>on</strong>a ‘teens’<br />
and innovative communicati<strong>on</strong> for Axe.<br />
In the US we introduced all Small & Mighty laundry detergent,<br />
offering the c<strong>on</strong>venience of the same cleaning power in a smaller<br />
bottle. We invested in communicati<strong>on</strong> of our Omo laundry<br />
brands, under the ‘Dirt is Good’ campaign in southern Latin<br />
America.<br />
In Foods, we strengthened the Vitality credentials of our brands<br />
in the US with Promise heart health spread, Ragú organic and<br />
support for the anti-oxidant properties of Lipt<strong>on</strong> teas. AdeS<br />
c<strong>on</strong>tinued to build across Latin America with the distinctive<br />
nutriti<strong>on</strong> benefits of ‘soy with fruit’.<br />
The operating margin at current rates of exchange was 13.0%,<br />
5.7 percentage points higher than in 2004. Net charges for<br />
restructuring, disposal and impairment were 3.4%, which was<br />
5.8 percentage points lower than in the prior year. Cost savings<br />
offset a higher level of advertising and promoti<strong>on</strong>s and increased<br />
input costs. There were also gains from the sale of an office in<br />
the US, in US healthcare plans and from currency effects <strong>on</strong><br />
capital reducti<strong>on</strong>s.<br />
<strong>Unilever</strong> <str<strong>on</strong>g>Annual</str<strong>on</strong>g> Report <strong>on</strong> Form 20-F <strong>2006</strong> 17<br />
Report of the Directors (c<strong>on</strong>tinued)
Report of the Directors (c<strong>on</strong>tinued)<br />
Operating review by regi<strong>on</strong> Asia Africa<br />
Asia Africa<br />
Turnover (€ milli<strong>on</strong>)<br />
C<strong>on</strong>tinuing operati<strong>on</strong>s<br />
<strong>2006</strong><br />
2005<br />
2004<br />
10 863<br />
10 282<br />
9 620<br />
€ milli<strong>on</strong> € milli<strong>on</strong> € milli<strong>on</strong> Year <strong>on</strong> year change Year <strong>on</strong> year change<br />
at current exchange rates at c<strong>on</strong>stant exchange rates<br />
C<strong>on</strong>tinuing operati<strong>on</strong>s <strong>2006</strong> 2005 <strong>2006</strong> 2005<br />
at current rates of exchange <strong>2006</strong> 2005 2004 vs 2005 vs 2004 vs 2005 vs 2004<br />
Turnover 10 863 10 282 9 620 5.7% 6.9% 6.8% 6.9%<br />
Operating profit 1 327 1 291 1 040 2.8% 24.1% 4.0% 24.7%<br />
Operating margin 12.2% 12.6% 10.8%<br />
Restructuring, business disposals and<br />
impairment charges included in<br />
operating margin (0.3)% 0.0% (2.9)%<br />
<strong>2006</strong> 2005<br />
Turnover and underlying sales growth vs 2005 vs 2004<br />
Underlying sales growth (%) 7.7 8.7<br />
Effect of acquisiti<strong>on</strong>s (%) 0.0 0.0<br />
Effect of disposals (%) (0.8) (1.6)<br />
Effect of exchange rates (%) (1.1) 0.0<br />
Turnover growth (%) 5.7 6.9<br />
<strong>2006</strong> compared with 2005<br />
Turnover at current rates of exchange rose by 5.7%, after the<br />
impact of acquisiti<strong>on</strong>s, disposals and exchange rate changes as<br />
set out in the table above. Operating profit at current rates of<br />
exchange rose by 2.8%, after including an adverse currency<br />
movement of 1.2%. The underlying per<strong>form</strong>ance of the business<br />
after eliminating these exchange translati<strong>on</strong> effects and the<br />
impact of acquisiti<strong>on</strong>s and disposals is discussed below at<br />
c<strong>on</strong>stant exchange rates.<br />
Markets remained buoyant in most of the key countries though<br />
there was a slowdown in c<strong>on</strong>sumer spending in Thailand.<br />
Underlying sales growth of 7.7% was broadly based and our<br />
aggregate market shares remained stable.<br />
India grew well across major sectors. A mix of global, regi<strong>on</strong>al<br />
and local brands is driving growth, notably Wheel and Surf Excel<br />
in laundry, and Clinic in haircare. A sec<strong>on</strong>d year of excellent<br />
growth in China, stemmed from a combinati<strong>on</strong> of market growth,<br />
better distributi<strong>on</strong> and innovati<strong>on</strong>s behind global brands such as<br />
Omo, Lux and P<strong>on</strong>d’s, as well as the local toothpaste brand,<br />
Zh<strong>on</strong>ghua. Indeed, <strong>Unilever</strong> Oral Care and Zh<strong>on</strong>ghua exhibited at<br />
the FDI World Dental Federati<strong>on</strong> C<strong>on</strong>gress in China to showcase<br />
‘Live, Learn, Laugh’ – <strong>Unilever</strong>’s global partnership with the<br />
Federati<strong>on</strong> to improve oral health globally.<br />
Ind<strong>on</strong>esia sustained good momentum, not <strong>on</strong>ly in the large<br />
Home and Pers<strong>on</strong>al Care ranges but also in Foods as a result<br />
of str<strong>on</strong>g per<strong>form</strong>ances in ice cream and savoury. Thailand had<br />
a disappointing year through weak demand and intense<br />
competiti<strong>on</strong>. A major programme of activities is under<br />
way to correct this.<br />
18 <strong>Unilever</strong> <str<strong>on</strong>g>Annual</str<strong>on</strong>g> Report <strong>on</strong> Form 20-F <strong>2006</strong><br />
Operating profit (€ milli<strong>on</strong>)<br />
C<strong>on</strong>tinuing operati<strong>on</strong>s<br />
<strong>2006</strong><br />
2005<br />
2004<br />
1 040<br />
1 327<br />
1 291<br />
Operating margin (%)<br />
C<strong>on</strong>tinuing operati<strong>on</strong>s<br />
<strong>2006</strong><br />
2005<br />
2004<br />
Australia experienced a much improved per<strong>form</strong>ance with share<br />
gains in a number of areas. In Japan, Lux Super Rich – the leading<br />
brand – per<strong>form</strong>ed well despite the launch of a competitor’s<br />
major brand. However, Dove and Mod’s lost share.<br />
Savoury, ice cream, laundry and household care brands were the<br />
main drivers of str<strong>on</strong>g growth in Turkey, while sales in Arabia<br />
were well ahead.<br />
In South Africa, aggressive price promoti<strong>on</strong>s by a local competitor<br />
have reduced laundry sales, but there were str<strong>on</strong>g growth and<br />
share gains in Foods.<br />
Innovati<strong>on</strong> is increasingly being driven globally and regi<strong>on</strong>ally,<br />
rather than locally. The new Sunsilk range has been introduced in<br />
most major markets and in laundry, the Dirt is Good positi<strong>on</strong>ing is<br />
now in place across the regi<strong>on</strong>. P<strong>on</strong>d’s Age Miracle, incorporating<br />
unique technology and designed specifically for Asian skin, has<br />
been launched in four countries. Meanwhile the latest global<br />
Axe/Lynx fragrance, Click, has been introduced in Australia and<br />
New Zealand.<br />
As in the rest of the world, the Foods innovati<strong>on</strong> programme<br />
focused <strong>on</strong> Vitality. Moo, a wholesome children’s ice cream range<br />
based <strong>on</strong> the goodness of milk, has been very well received by<br />
mothers and children alike and has proven a real success story in<br />
South East Asia. Healthy green tea innovati<strong>on</strong>s are being rolled<br />
out extensively, while in South Africa marketing for Rama<br />
margarine now communicates the product’s healthy oils.<br />
Addressing the needs of lower income c<strong>on</strong>sumers, low-priced<br />
Knorr stock cubes – already successful in Latin America – were<br />
also introduced in the regi<strong>on</strong>.<br />
12.2<br />
12.6<br />
10.8
Operating review by regi<strong>on</strong> Asia Africa (c<strong>on</strong>tinued)<br />
<strong>2006</strong> compared with 2005 (c<strong>on</strong>tinued)<br />
The operating margin at 12.2% was 0.4 percentage points lower<br />
than a year ago. Before the impact of restructuring, disposals and<br />
impairments, the operating margin would have been in line with<br />
last year. The benefits to margin of str<strong>on</strong>g volume growth and<br />
savings programmes were fully offset by higher commodity<br />
costs and other cost inflati<strong>on</strong> which could not be fully recovered<br />
in pricing.<br />
2005 compared with 2004<br />
Turnover at current rates of exchange rose by 6.9%, with no net<br />
impact from currency movements. Operating profit at current<br />
rates of exchange was 24% higher than in 2004, after allowing<br />
for an adverse impact from currency movements of 0.6%. The<br />
underlying per<strong>form</strong>ance of the business after eliminating these<br />
exchange translati<strong>on</strong> effects and the impact of disposals is<br />
discussed below at c<strong>on</strong>stant exchange rates.<br />
We capitalised <strong>on</strong> our leading positi<strong>on</strong>s and buoyant c<strong>on</strong>sumer<br />
demand across most of the regi<strong>on</strong>, growing underlying sales by<br />
nearly 9%, in a competitive envir<strong>on</strong>ment, and increasing market<br />
share in key battlegrounds.<br />
The growth was broad-based in terms of both categories and<br />
geographies. There were notable per<strong>form</strong>ances in all major<br />
developing and emerging countries, including a str<strong>on</strong>g recovery in<br />
India with market share gains, and significant c<strong>on</strong>tributi<strong>on</strong>s from<br />
China, which was up by over 20%, and from South East Asia,<br />
South Africa, Turkey and Arabia. Japan returned to growth.<br />
After a weak first half, Australia improved in the sec<strong>on</strong>d half of<br />
the year.<br />
Most of the increase came from volume, but price growth gained<br />
momentum through the year, as we moved selectively to recover<br />
increased commodity costs, especially in home care.<br />
Growth was underpinned by a range of innovati<strong>on</strong>s. In skin care<br />
in India, Lux was strengthened with new soap bars from the<br />
global range and the introducti<strong>on</strong> of limited editi<strong>on</strong>s. Innovati<strong>on</strong>s<br />
in P<strong>on</strong>d’s included a new ‘mud’ range in China.<br />
In haircare we launched Dove in Ind<strong>on</strong>esia, a Sunsilk summer<br />
range across South East Asia, a new variant for Lux Super Rich<br />
in China and a strengthened Sunsilk range across several key<br />
markets in Africa and the Middle East.<br />
New <strong>form</strong>ulati<strong>on</strong>s for our laundry products include improved<br />
whiteness delivery for Surf in Ind<strong>on</strong>esia and Omo for sensitive skin<br />
in Turkey.<br />
In tea, we substantially strengthened the Brooke B<strong>on</strong>d brand in<br />
India, while Lipt<strong>on</strong> benefited from str<strong>on</strong>g regi<strong>on</strong>al innovati<strong>on</strong>s,<br />
including Earl Grey and Green Tea variants in markets such as<br />
Turkey and Arabia.<br />
The operating margin was 12.6%, 1.8 percentage points higher<br />
than in 2004. Increased investment in advertising and promoti<strong>on</strong>s<br />
was partly offset by productivity gains. The remaining difference<br />
was due to net restructuring, disposal and impairment charges<br />
which were insignificant in 2005 compared with a net charge of<br />
2.9% in 2004.<br />
<strong>Unilever</strong> <str<strong>on</strong>g>Annual</str<strong>on</strong>g> Report <strong>on</strong> Form 20-F <strong>2006</strong> 19<br />
Report of the Directors (c<strong>on</strong>tinued)
Report of the Directors (c<strong>on</strong>tinued)<br />
Operating review – categories<br />
We are passi<strong>on</strong>ate about developing great global brands and<br />
bringing them to market brilliantly. Our Foods and Home and<br />
Pers<strong>on</strong>al Care teams invest heavily in world-class innovati<strong>on</strong> in<br />
order to create global brand ideas that can be rolled out fast. This<br />
involves close collaborati<strong>on</strong> between our marketing and research<br />
teams, in order to develop breakthrough ideas that meet the<br />
changing needs of c<strong>on</strong>sumers the world over and fulfil our<br />
missi<strong>on</strong> of adding Vitality to life.<br />
Faster roll-out<br />
Changes to our structure, our ‘One <strong>Unilever</strong>’ programme, and<br />
better collaborati<strong>on</strong> across our business are helping us get new<br />
products to market faster than ever before, and this is having a<br />
big impact <strong>on</strong> brand growth.<br />
Our Dirt is Good positi<strong>on</strong>ing including the Omo laundry brand<br />
now has sales of over €2.5 billi<strong>on</strong> thanks to an alignment of the<br />
brand positi<strong>on</strong>ing and the rapid roll-out in Asia, where it delivered<br />
not <strong>on</strong>ly growth, but record market shares.<br />
The new Rama/Blue Band Idea! spread was launched in 14<br />
countries within <strong>on</strong>ly five m<strong>on</strong>ths. Idea! is a breakthrough<br />
innovati<strong>on</strong> with an advanced nutrient mix that supports children’s<br />
mental development – an issue of interest to parents around the<br />
globe, both in developed and developing markets.<br />
Dove Summer Glow self-tanning loti<strong>on</strong> was rolled out across<br />
four European countries in just a few weeks. It became<br />
our most successful pers<strong>on</strong>al care innovati<strong>on</strong> in Europe in<br />
<strong>2006</strong>, gaining sector leadership in most markets through an<br />
outstanding team effort involving marketing, supply chain,<br />
R&D and customer development.<br />
Brands with global missi<strong>on</strong>s<br />
Throughout <strong>2006</strong> we c<strong>on</strong>tinued to build brands with global<br />
missi<strong>on</strong>s and distinctive points of view. Our brands aim to<br />
communicate ideas that can be expressed wherever and<br />
whenever c<strong>on</strong>sumers encounter them, and play an active role<br />
in c<strong>on</strong>sumers’ lives.<br />
Axe/Lynx is <strong>on</strong>e of the best-known examples: the ‘Axe/Lynx effect’<br />
– giving guys the edge in the dating game – underpins all the<br />
brand’s campaigns. In <strong>2006</strong> this led to an innovative launch for<br />
Axe Click, our most successful anti-perspirant variant since Pulse.<br />
More than 4 milli<strong>on</strong> c<strong>on</strong>sumers claimed a free hand-held clicker<br />
to keep track of the flirtatious looks they attracted as a result of<br />
using Axe Click, helping drive the brand’s growth in France,<br />
Germany and Mexico.<br />
Overall, our deodorants business c<strong>on</strong>tinues to grow. Rex<strong>on</strong>a,<br />
with its ‘w<strong>on</strong>’t let you down’ promise, played a big role in this<br />
success, and reached a major milest<strong>on</strong>e by breaking the<br />
€1 billi<strong>on</strong> sales barrier.<br />
20 <strong>Unilever</strong> <str<strong>on</strong>g>Annual</str<strong>on</strong>g> Report <strong>on</strong> Form 20-F <strong>2006</strong><br />
Flora/Becel has been fighting the spread of cardiovascular disease<br />
for over 40 years. Since 2003 the brand has joined forces with the<br />
World Heart Federati<strong>on</strong> to educate c<strong>on</strong>sumers and encourage<br />
them to make heart-healthy changes to their diet and lifestyle.<br />
Flora/Becel pro•activ is the world’s best-selling cholesterol-lowering<br />
food brand and in <strong>2006</strong> the Three Week Challenge engaged with<br />
c<strong>on</strong>sumers in a number of countries to dem<strong>on</strong>strate to them the<br />
product’s effectiveness in lowering cholesterol.<br />
Throughout the year, the Dove Campaign for Real Beauty<br />
c<strong>on</strong>tinued to challenge c<strong>on</strong>venti<strong>on</strong>al definiti<strong>on</strong>s of beauty. The<br />
strength of this global missi<strong>on</strong> led to great examples of regi<strong>on</strong>al<br />
executi<strong>on</strong>. For example, the Evoluti<strong>on</strong> advertisement, which<br />
exposed some of the tricks of the beauty trade, prompted much<br />
media attenti<strong>on</strong> in North America and was downloaded from<br />
YouTube.com a milli<strong>on</strong> times in a two-week period.<br />
The Dove Self Esteem Fund works in partnership with schools and<br />
organisati<strong>on</strong>s such as Girl Scouts of America and the Eating<br />
Disorders Associati<strong>on</strong> to inspire girls to feel more c<strong>on</strong>fident about<br />
the way they look. So far, Dove self-esteem programmes have<br />
reached more than 750 000 young people and sales of Dove<br />
products are growing rapidly.<br />
Lipt<strong>on</strong> is committed to ensuring c<strong>on</strong>sumers everywhere are<br />
aware of the ‘goodness of tea', which is rich in theanine and<br />
antioxidants, and has zero calories. Popular all over the world,<br />
Lipt<strong>on</strong> is the leading global tea brand. In <strong>2006</strong>, the brand grew<br />
str<strong>on</strong>gly, with leaf tea increasing by around 5% and ready-todrink<br />
products, including sales through our joint venture with<br />
Pepsi, up by 25%.<br />
Research & Development<br />
We currently employ more than 6 000 scientists and product<br />
developers in Research & Development (R&D) worldwide,<br />
delivering total product soluti<strong>on</strong>s for Vitality innovati<strong>on</strong>s. In <strong>2006</strong><br />
we spent over €900 milli<strong>on</strong> <strong>on</strong> R&D worldwide.<br />
Following our Science & Technology Review, which looked at all<br />
aspects of our R&D activities, we are focusing resources <strong>on</strong> worldclass<br />
R&D capabilities, working with clear innovati<strong>on</strong> targets and<br />
c<strong>on</strong>centrating <strong>on</strong> fewer – but bigger – projects, which in many<br />
cases involve patented technology. We have also embraced Open<br />
Innovati<strong>on</strong>, which has involved creating new working relati<strong>on</strong>ships<br />
between our R&D teams, suppliers, customers, universities and<br />
other institutes worldwide.<br />
Launched in Turkey in December, Amaze Brainfood is the result<br />
of four years of development, l<strong>on</strong>g-term clinical trials and<br />
€40 milli<strong>on</strong> of research. The range of lunchbox snacks and milk<br />
drinks c<strong>on</strong>tains <strong>on</strong>e-third of the nutrients children need daily for<br />
brain development. It was developed through collaborati<strong>on</strong><br />
between our product development teams and the <strong>Unilever</strong><br />
Food & Health Research Institute.
Operating review – categories (c<strong>on</strong>tinued)<br />
In the Asia skincare market, P<strong>on</strong>d’s launched Age Miracle, a<br />
breakthrough patented innovati<strong>on</strong> c<strong>on</strong>taining a plant extract<br />
called CLA (c<strong>on</strong>jugated linoleic acid) which helps reduce signs<br />
of ageing and yields excepti<strong>on</strong>al results in Asian complexi<strong>on</strong>s.<br />
Age Miracle has g<strong>on</strong>e <strong>on</strong> sale across Asia, helping build P<strong>on</strong>d’s<br />
profile in fast-growing D&E markets.<br />
We also developed Surf Excel, which enables c<strong>on</strong>sumers to<br />
achieve the same laundry cleaning results with less rinsing – a big<br />
advantage in areas where water supply is limited.<br />
Following the theme of ‘less is more’ in laundry, new technology<br />
helped create all Small & Mighty c<strong>on</strong>centrated liquid detergents,<br />
which were launched in the US. Small & Mighty is three times<br />
more c<strong>on</strong>centrated than regular detergents, so you get a full load<br />
clean with just <strong>on</strong>e-third of the amount. That means fewer<br />
packaging materials, cheaper transport and less space needed<br />
for storage – good news for c<strong>on</strong>sumers, retailers and the<br />
envir<strong>on</strong>ment. During 2007 Small & Mighty will be rolled out<br />
across Europe.<br />
In June we submitted a dossier to the UK FSA (Food Standards<br />
Agency) to seek regulatory approval under the EC Novel Foods<br />
Regulati<strong>on</strong> for the use of Ice Structuring Protein (ISP) in ice cream<br />
products in Europe. This breakthrough ISP technology enables a<br />
multitude of innovati<strong>on</strong>s in ice cream, including significantly<br />
healthier opti<strong>on</strong>s and better quality ice cream.<br />
New Domestos 5x c<strong>on</strong>tains a molecule called C-TAC which clings<br />
to the toilet bowl flush after flush, killing germs up to five times<br />
l<strong>on</strong>ger than any other bleach or toilet product. As part of its<br />
launch, c<strong>on</strong>sumers were supplied with a test strip to prove how<br />
l<strong>on</strong>g it remains effective. Domestos 5x is due to be launched in all<br />
key countries for the brand.<br />
Vitality<br />
Our Vitality missi<strong>on</strong> is at the heart of everything we do. It provides<br />
clear directi<strong>on</strong> for meeting c<strong>on</strong>sumers’ changing needs, and helps<br />
us identify major growth opportunities for our Foods and Home<br />
and Pers<strong>on</strong>al Care brands.<br />
For example, Knorr Vie shots pack lots of nutriti<strong>on</strong> into each<br />
handy 100ml bottle. These smoothie-style products made from<br />
fruit and vegetables provide half the minimum daily intake of fruit<br />
and vegetables recommended by the World Health Organizati<strong>on</strong>.<br />
Launched in 2005, they are now available in 12 European<br />
countries – over 100 milli<strong>on</strong> bottles have been sold so far.<br />
AdeZ – our soya-based drink with fruit juices – delivers 35% of<br />
the daily recommended intake of vitamins B6 and C, magnesium<br />
and calcium. AdeZ provides the goodness of soya in a great<br />
tasting range of flavours. AdeZ started in South America and,<br />
with the launch in the UK, this successful product has now<br />
been brought to Europe.<br />
When it comes to hygiene, Lifebuoy has already helped around<br />
70 milli<strong>on</strong> people in India become more aware of the importance<br />
of hand-washing with soap to c<strong>on</strong>trol the spread of diarrhoeal<br />
disease and respiratory infecti<strong>on</strong>s. The brand has been working<br />
in partnership with organisati<strong>on</strong>s such as the World Bank and<br />
UNICEF to promote hand-washing in other countries and as part<br />
of its roll-out in Africa.<br />
In early 2005 we made a commitment to reduce the amount of<br />
fats, salt and sugar in our products – a pledge which w<strong>on</strong> the<br />
praise of the European Health Commissi<strong>on</strong>er. Since then we<br />
have achieved our original targets: by the end of <strong>2006</strong> we had<br />
assessed more than 16 000 products and taken out more than<br />
37 000 t<strong>on</strong>nes of trans and saturated fats, 3 000 t<strong>on</strong>nes<br />
of sodium and 17 000 t<strong>on</strong>nes of sugars – without compromising<br />
flavour. This work c<strong>on</strong>tinues through our <strong>on</strong>going Nutriti<strong>on</strong><br />
Enhancement Programme.<br />
A great example is the nutriti<strong>on</strong>al improvements to our ice cream<br />
products. We have removed artificial colours and flavours,<br />
increased the fruit c<strong>on</strong>tent and reduced sugar levels in water ices<br />
across our kids’ portfolio in Western Europe. It is an <strong>on</strong>going<br />
improvement process which will extend to more products and<br />
regi<strong>on</strong>s in the future.<br />
Through our global partnership with the FDI World Dental<br />
Federati<strong>on</strong> we are helping to improve oral health around the<br />
world with practical, sustainable community programmes.<br />
To support these initiatives we have developed a low-cost<br />
toothbrush, the Pepsodent Fighter, which retails at a price<br />
equivalent to just €0.20 and is proving a great success in India<br />
and Ind<strong>on</strong>esia.<br />
Meanwhile our Choices programme is helping busy shoppers<br />
make quick purchasing decisi<strong>on</strong>s for healthier eating. The fr<strong>on</strong>tof-pack<br />
stamp helps identify products which are in line with<br />
internati<strong>on</strong>al recommendati<strong>on</strong>s for trans fats, saturated fats, salt<br />
and sugar. The programme has been launched in the Netherlands,<br />
Belgium and the US, and is now being rolled out globally to a<br />
total of 40 countries. We are also encouraging its adopti<strong>on</strong> more<br />
widely in the foods industry.<br />
Innovati<strong>on</strong>s in <strong>2006</strong><br />
The following are some examples of our brand innovati<strong>on</strong>s and<br />
similar activities in <strong>2006</strong>.<br />
Lipt<strong>on</strong>, the world’s biggest tea brand, is creating drinks that help<br />
people live healthier lives. The brand has been rolling out a<br />
communicati<strong>on</strong> programme to in<strong>form</strong> c<strong>on</strong>sumers of its<br />
antioxidant health benefits and is influencing the wider tea<br />
industry with its commitments to sustainability – for example,<br />
sustainable farming practices – and educati<strong>on</strong> and health. In <strong>2006</strong><br />
<strong>Unilever</strong> Tea Kenya w<strong>on</strong> a Global Business Coaliti<strong>on</strong> <strong>on</strong> HIV/AIDS<br />
award for its work <strong>on</strong> the educati<strong>on</strong>, preventi<strong>on</strong> and treatment<br />
of HIV/AIDS in the workplace and bey<strong>on</strong>d. The brand has shown<br />
c<strong>on</strong>sistent high growth over the past few years.<br />
<strong>Unilever</strong> <str<strong>on</strong>g>Annual</str<strong>on</strong>g> Report <strong>on</strong> Form 20-F <strong>2006</strong> 21<br />
Report of the Directors (c<strong>on</strong>tinued)
Report of the Directors (c<strong>on</strong>tinued)<br />
Operating review – categories (c<strong>on</strong>tinued)<br />
Dove Summer Glow self-tanning loti<strong>on</strong> keeps a body beautiful all<br />
year round. A great example of how a str<strong>on</strong>g global plat<strong>form</strong> can<br />
help a brand extend into new categories, Dove Summer Glow<br />
was launched in the US and rolled out in four European countries<br />
in a matter of weeks. Its advertising c<strong>on</strong>tinued to target women<br />
who, through earlier campaigns, already know that Dove is<br />
committed to real beauty for real women. Dove Summer Glow<br />
helps them feel good about their skin, whatever the weather.<br />
The healthy-heart foods market is growing fast. And backed by<br />
our Goodness of Margarine campaign, Flora/Becel c<strong>on</strong>tinues to<br />
lead the way. <strong>Unilever</strong> has been a partner of the World Heart<br />
Federati<strong>on</strong> since 2003, and works closely with them to increase<br />
awareness of cardio-vascular disease. Throughout 2007,<br />
Flora/Becel is planning to take the message further than ever<br />
before, with its global Love Your Heart campaign which is<br />
intended to inspire and empower people to make hearthealthy<br />
choices.<br />
Backed by a passi<strong>on</strong>-packed advertising campaign linked to the<br />
energy and excitement of football and the <strong>2006</strong> World Cup,<br />
Rex<strong>on</strong>a scored this year when annual sales passed the €1 billi<strong>on</strong><br />
mark for the first time. The goal now is to promote the brand’s<br />
market-leading body-resp<strong>on</strong>sive deodorant, with its technologybased<br />
‘w<strong>on</strong>’t let you down’ promise, and turn Rex<strong>on</strong>a into an<br />
ic<strong>on</strong>ic brand worldwide for men and women.<br />
Test-marketed in Ireland and Belgium in <strong>2006</strong>, Frusì – our new<br />
frozen snack – is proving very popular. Frusì was created to<br />
provide guilt-free pleasure for people who take their health<br />
seriously. With Frusì they have the best of both worlds: real<br />
natural goodness without compromise <strong>on</strong> taste, pleasure or<br />
c<strong>on</strong>venience. Sales of Frusì have beaten targets for market<br />
penetrati<strong>on</strong> and share, and repeat purchases. Following the<br />
success of this test-market, Frusì is being rolled out to more<br />
countries in 2007.<br />
Developed with ‘empty nesters’ in mind and launched in the UK<br />
in January <strong>2006</strong>, Comfort Crème has shown thousands of older<br />
women that it’s good to wear softer clothes that help you look<br />
and feel great. With its gold-topped bottles and fragrances of<br />
22 <strong>Unilever</strong> <str<strong>on</strong>g>Annual</str<strong>on</strong>g> Report <strong>on</strong> Form 20-F <strong>2006</strong><br />
jojoba and sweet alm<strong>on</strong>d oil, Comfort Crème is now used in over<br />
a milli<strong>on</strong> UK households. Its success has overturned the idea<br />
that fabric c<strong>on</strong>diti<strong>on</strong>ers are <strong>on</strong>ly popular with mothers with<br />
young children.<br />
With each bottle able to dress more salad than a bottle twice its<br />
size – 26 salads in all – Wish-B<strong>on</strong>e Salad Spritzers are helping<br />
Americans count the calories. The easy-to-use bottles allow<br />
c<strong>on</strong>sumers to dress their salads perfectly with just <strong>on</strong>e calorie per<br />
spray. Available in three flavours – Italian, Balsamic Breeze and<br />
Red Wine Mist – Wish-B<strong>on</strong>e Salad Spritzers are good for salads,<br />
vegetables – and waistlines.<br />
Bad hair dramas are becoming a thing of the past for America’s<br />
20-something women. Launched nati<strong>on</strong>wide in <strong>2006</strong> with a witty,<br />
$200 milli<strong>on</strong> campaign, the Sunsilk ‘Get Hairapy’ approach to the<br />
dramas of kinky, flat or frizzy hair is bringing this global brand to<br />
an entirely new market. Backed by innovative marketing, the<br />
campaign has led to more and more women solving their hair<br />
issues with some serious ‘hairapy’.<br />
In 2001, when <strong>Unilever</strong> signed a joint venture with Ind<strong>on</strong>esia’s<br />
Kecap company, Bango soy sauce had a nati<strong>on</strong>al market share<br />
of less than 5%. Today, following an imaginative programme<br />
designed to preserve Ind<strong>on</strong>esia’s culinary heritage and enhance<br />
the livelihood of the country’s soy bean farmers, the brand has<br />
sales of around €100 milli<strong>on</strong> – and is growing by 10% year <strong>on</strong><br />
year. <strong>Unilever</strong>’s guaranteed market, technical assistance and<br />
access to finance, combined with improved work opportunities<br />
for women and localised community involvement, have all helped<br />
develop the brand.<br />
Right across Asia, from Pakistan to China, the Dirt is Good<br />
positi<strong>on</strong>ing with Omo (Rinso) has been washing well with<br />
c<strong>on</strong>sumers. Based <strong>on</strong> the simple premise that, for children, dirt<br />
and stains are a natural part of being active and learning through<br />
play, the campaign promotes the brand through communityendorsed<br />
playgrounds, outdoor games and competiti<strong>on</strong>s involving<br />
both children and parents. The campaign’s success has led to<br />
Omo becoming <strong>Unilever</strong>’s first-ever billi<strong>on</strong> RMB (Renminbi) sales<br />
brand in China.
Financial review<br />
The Financial review for the year ended 31 December <strong>2006</strong> is<br />
presented below. The Financial review is presented to provide an<br />
overview of key influences <strong>on</strong> <strong>Unilever</strong>’s financial per<strong>form</strong>ance for<br />
the year and the financial positi<strong>on</strong> as at 31 December <strong>2006</strong>.<br />
Background secti<strong>on</strong>s, such as the overview of <strong>Unilever</strong>’s critical<br />
accounting policies and n<strong>on</strong>-GAAP measures are included to<br />
provide some additi<strong>on</strong>al c<strong>on</strong>text.<br />
Critical accounting policies<br />
The accounts presented comply in all material respects with IFRS<br />
and UK and Dutch law. To prepare these accounts, we are<br />
required to make estimates and assumpti<strong>on</strong>s, using judgement<br />
based <strong>on</strong> available in<strong>form</strong>ati<strong>on</strong>, including historical experience.<br />
These estimates and assumpti<strong>on</strong>s are reas<strong>on</strong>able and are reevaluated<br />
<strong>on</strong> an <strong>on</strong>going basis. However, actual amounts and<br />
results could differ. Critical accounting policies are those which<br />
are most important to the portrayal of <strong>Unilever</strong>’s financial positi<strong>on</strong><br />
and results of operati<strong>on</strong>s. Some of these policies require difficult,<br />
subjective or complex judgements from management, the most<br />
important being:<br />
Goodwill and intangible assets<br />
Impairment reviews in respect of goodwill and indefinite-lived<br />
intangible assets are per<strong>form</strong>ed at least annually. More regular<br />
reviews, and impairment reviews in respect of other assets, are<br />
per<strong>form</strong>ed if events indicate that this is necessary. Examples of<br />
such triggering events would include a significant planned<br />
restructuring, a major change in market c<strong>on</strong>diti<strong>on</strong>s or technology,<br />
expectati<strong>on</strong>s of future operating losses, or negative cash flows.<br />
Impairment reviews are per<strong>form</strong>ed by comparing the carrying<br />
value of the asset c<strong>on</strong>cerned to that asset’s recoverable amount<br />
(being the higher of value in use and fair value less costs to sell).<br />
Value in use is a valuati<strong>on</strong> derived from discounted future cash<br />
flows. Significant assumpti<strong>on</strong>s, such as l<strong>on</strong>g-term growth rates<br />
and discount rates, are made in preparing these forecast cash<br />
flows; although these are believed to be appropriate, changes<br />
in these assumpti<strong>on</strong>s could change the outcomes of the<br />
impairment reviews.<br />
The most significant balances of goodwill and intangible assets<br />
relate to the global savoury and dressings sub-product group.<br />
We have reviewed the carrying value of this cash generating unit<br />
by c<strong>on</strong>sidering expected future cash flows based <strong>on</strong> historical<br />
experience and planned growth rates and margins for this<br />
product group. No significant impairment losses have been<br />
identified in <strong>2006</strong>.<br />
Please refer also to note 9 <strong>on</strong> page 88.<br />
Financial instruments<br />
Financial instruments are classified according to the purpose for<br />
which the instruments were acquired. This gives rise to the<br />
following categories: held-to-maturity investments, loans and<br />
receivables, available-for-sale financial assets and financial assets<br />
at fair value through profit or loss. Please refer to note 1 <strong>on</strong> page<br />
75 for a descripti<strong>on</strong> of each of these categories.<br />
Derivative financial instruments are <str<strong>on</strong>g>report</str<strong>on</strong>g>ed at fair value, with<br />
changes in fair values booked through profit or loss unless the<br />
derivatives are designated and effective as hedges of future cash<br />
flows, in which case the changes are recognised directly in equity.<br />
At the time the hedged cash flow results in the recogniti<strong>on</strong> of an<br />
asset or a liability, the associated gains or losses <strong>on</strong> the derivative<br />
that had previously been recognised in equity are included in the<br />
initial measurement of the asset or liability. For hedged items that<br />
do not result in the recogniti<strong>on</strong> of an asset or liability, amounts<br />
deferred in equity are recognised in the income statement in the<br />
same period in which the hedged item affects net profit or loss.<br />
Changes in fair value of net investment hedges in relati<strong>on</strong> to<br />
foreign subsidiaries are recognised directly in equity.<br />
Pensi<strong>on</strong>s and similar obligati<strong>on</strong>s<br />
The assets and liabilities of the plans are recognised at fair values<br />
in the balance sheet.<br />
Pensi<strong>on</strong> accounting requires certain assumpti<strong>on</strong>s to be made in<br />
order to value our obligati<strong>on</strong>s and to determine the charges to<br />
be made to the income statement. These figures are particularly<br />
sensitive to assumpti<strong>on</strong>s for discount rates, inflati<strong>on</strong> rates,<br />
mortality rates and expected l<strong>on</strong>g-term rates of return <strong>on</strong> assets.<br />
In<strong>form</strong>ati<strong>on</strong> about sensitivity to certain of these assumpti<strong>on</strong>s is<br />
given in note 20 <strong>on</strong> page 105.<br />
The following table sets out these assumpti<strong>on</strong>s (except for<br />
mortality rates), as at 31 December <strong>2006</strong>, in respect of the four<br />
largest <strong>Unilever</strong> pensi<strong>on</strong> plans. Further details of assumpti<strong>on</strong>s<br />
(including mortality rates) made are given in note 20 <strong>on</strong> pages<br />
103 and 104.<br />
% % % %<br />
Nether- United<br />
UK lands States Germany<br />
Discount rate 5.1 4.6 5.8 4.6<br />
Inflati<strong>on</strong> 2.9 1.9 2.5 1.9<br />
Expected l<strong>on</strong>g-term rate of return:<br />
Equities 8.0 7.6 8.3 7.6<br />
B<strong>on</strong>ds 5.2 4.4 5.2 4.4<br />
Property 6.5 6.1 6.8 6.1<br />
Others 7.2 4.0 4.8 3.0<br />
These assumpti<strong>on</strong>s are set by reference to market c<strong>on</strong>diti<strong>on</strong>s at<br />
the valuati<strong>on</strong> date. Actual experience may differ from the<br />
assumpti<strong>on</strong>s made. The effects of such differences are recognised<br />
through the statement of recognised income and expense.<br />
<strong>Unilever</strong> <str<strong>on</strong>g>Annual</str<strong>on</strong>g> Report <strong>on</strong> Form 20-F <strong>2006</strong> 23<br />
Report of the Directors (c<strong>on</strong>tinued)
Report of the Directors (c<strong>on</strong>tinued)<br />
Financial review (c<strong>on</strong>tinued)<br />
Demographic assumpti<strong>on</strong>s, such as mortality rates, are set having<br />
regard to the latest trends in life expectancy, plan experience and<br />
other relevant data. The assumpti<strong>on</strong>s are reviewed and updated<br />
as necessary as part of the periodic actuarial valuati<strong>on</strong> of the<br />
pensi<strong>on</strong> plans. Mortality assumpti<strong>on</strong>s for the four largest plans<br />
are given in more detail in note 20 <strong>on</strong> page 104.<br />
Provisi<strong>on</strong>s<br />
Provisi<strong>on</strong> is made, am<strong>on</strong>gst other reas<strong>on</strong>s, for legal matters,<br />
disputed indirect taxes, employee terminati<strong>on</strong> costs and<br />
restructuring where a legal or c<strong>on</strong>structive obligati<strong>on</strong> exists at the<br />
balance sheet date and a reliable estimate can be made of the<br />
likely outcome.<br />
Advertising and promoti<strong>on</strong> costs<br />
Expenditure <strong>on</strong> items such as c<strong>on</strong>sumer promoti<strong>on</strong>s and trade<br />
advertising is charged against profit in the year in which it is<br />
incurred. At each balance sheet date, we are required to estimate<br />
the part of expenditure incurred but not yet invoiced based <strong>on</strong><br />
our knowledge of customer, c<strong>on</strong>sumer and promoti<strong>on</strong>al activity.<br />
Deferred tax<br />
Full provisi<strong>on</strong> is made for deferred taxati<strong>on</strong> at the rates of tax<br />
prevailing at the year-end unless future rates have been<br />
substantively enacted, as detailed in note 1 <strong>on</strong> page 76. Deferred<br />
tax assets are regularly reviewed for recoverability, and a valuati<strong>on</strong><br />
allowance is established to the extent that recoverability is not<br />
c<strong>on</strong>sidered likely.<br />
Reporting currency and exchange rates<br />
Foreign currency amounts for results and cash flows are translated<br />
from underlying local currencies into euros using annual average<br />
exchange rates; balance sheet amounts are translated at year-end<br />
rates except for the ordinary capital of the two parent companies.<br />
These are translated at the rate prescribed by the Equalisati<strong>on</strong><br />
Agreement of 3 1 ⁄ 9p = €0.16 (see Corporate governance <strong>on</strong><br />
page 39).<br />
N<strong>on</strong>-GAAP measures<br />
Certain discussi<strong>on</strong>s and analyses set out in this <str<strong>on</strong>g>Annual</str<strong>on</strong>g> Report <strong>on</strong><br />
Form 20-F include measures which are not defined by generally<br />
accepted accounting principles (GAAP) such as IFRS or US GAAP.<br />
We believe this in<strong>form</strong>ati<strong>on</strong>, al<strong>on</strong>g with comparable GAAP<br />
measurements, is useful to investors because it provides a basis<br />
for measuring our operating per<strong>form</strong>ance, ability to retire debt<br />
and invest in new business opportunities. Our management uses<br />
these financial measures, al<strong>on</strong>g with the most directly comparable<br />
GAAP financial measures, in evaluating our operating<br />
per<strong>form</strong>ance and value creati<strong>on</strong>. N<strong>on</strong>-GAAP financial measures<br />
should not be c<strong>on</strong>sidered in isolati<strong>on</strong> from, or as a substitute for,<br />
financial in<strong>form</strong>ati<strong>on</strong> presented in compliance with GAAP.<br />
N<strong>on</strong>-GAAP financial measures as <str<strong>on</strong>g>report</str<strong>on</strong>g>ed by us may not be<br />
comparable to similarly titled amounts <str<strong>on</strong>g>report</str<strong>on</strong>g>ed by other<br />
companies.<br />
24 <strong>Unilever</strong> <str<strong>on</strong>g>Annual</str<strong>on</strong>g> Report <strong>on</strong> Form 20-F <strong>2006</strong><br />
In the following secti<strong>on</strong>s we set out our definiti<strong>on</strong>s of the<br />
following n<strong>on</strong>-GAAP measures and provide rec<strong>on</strong>ciliati<strong>on</strong>s to<br />
relevant GAAP measures:<br />
• Underlying sales growth;<br />
• Ungeared free cash flow;<br />
• Return <strong>on</strong> invested capital; and<br />
• Net debt.<br />
We set out ‘Measures of l<strong>on</strong>g-term value creati<strong>on</strong>’ as an<br />
introducti<strong>on</strong> to the following secti<strong>on</strong>, in order to explain the<br />
relevance of the above measures. At the end of this secti<strong>on</strong><br />
<strong>on</strong> n<strong>on</strong>-GAAP measures, we summarise the impact <strong>on</strong> Total<br />
Shareholder Return (TSR) which is our key metric.<br />
Measures of l<strong>on</strong>g-term value creati<strong>on</strong><br />
<strong>Unilever</strong>’s ambiti<strong>on</strong> for the creati<strong>on</strong> of value for shareholders is<br />
measured by Total Shareholder Return over a rolling three-year<br />
period compared with a peer group of 20 other companies.<br />
<strong>Unilever</strong> believes that the c<strong>on</strong>tributi<strong>on</strong> of the business to this<br />
objective can best be measured and communicated to investors<br />
through the following measures:<br />
• The delivery, over time, of Ungeared Free Cash Flow (UFCF),<br />
which expresses the translati<strong>on</strong> of profit into cash, and thus<br />
l<strong>on</strong>ger-term ec<strong>on</strong>omic value; and<br />
• The development, over time, of Return <strong>on</strong> Invested Capital<br />
(ROIC), which expresses the returns generated <strong>on</strong> capital<br />
invested in the Group.<br />
<strong>Unilever</strong> communicates progress against these measures<br />
annually, and management remunerati<strong>on</strong> is aligned with these<br />
objectives. The UFCF over a three-year period is incorporated<br />
as a per<strong>form</strong>ance element of <strong>Unilever</strong>’s management<br />
incentive scheme.<br />
UFCF and ROIC are n<strong>on</strong>-GAAP measures under IFRS and US<br />
GAAP. We include them in this respect since they are the way<br />
in which we communicate our ambiti<strong>on</strong> and m<strong>on</strong>itor progress<br />
towards our l<strong>on</strong>ger-term value creati<strong>on</strong> goals and in order to:<br />
• Improve transparency for investors;<br />
• Assist investors in their assessment of the l<strong>on</strong>g-term value<br />
of <strong>Unilever</strong>;<br />
• Ensure that the measures are fully understood in the light of<br />
how <strong>Unilever</strong> reviews l<strong>on</strong>g-term value creati<strong>on</strong> for shareholders;<br />
• Properly define the metrics used and c<strong>on</strong>firm their calculati<strong>on</strong>;<br />
• Share the metrics with all investors at the same time; and<br />
• Disclose UFCF as it is <strong>on</strong>e of the drivers of management<br />
remunerati<strong>on</strong> and therefore management behaviour.<br />
As investor measures, we believe that there are no GAAP<br />
measures directly comparable with UFCF and ROIC. However,<br />
in the tables <strong>on</strong> page 26, we rec<strong>on</strong>cile each as follows: UFCF to<br />
cash flow from operating activities and also to net profit; ROIC<br />
to net profit.
Financial review (c<strong>on</strong>tinued)<br />
Cauti<strong>on</strong><br />
<strong>Unilever</strong> cauti<strong>on</strong>s that, while UFCF and ROIC are widely used as<br />
tools for investment analysis, they are not defined terms under<br />
IFRS or US GAAP and therefore their definiti<strong>on</strong> should be carefully<br />
reviewed and understood by investors. Investors should be aware<br />
that their applicati<strong>on</strong> may vary in practice and therefore these<br />
measures may not be fully comparable between companies.<br />
In particular:<br />
• We recognise that the usefulness of UFCF and ROIC as<br />
indicators of investment value is limited, as such measures<br />
are based <strong>on</strong> historical in<strong>form</strong>ati<strong>on</strong>;<br />
• UFCF and ROIC measures are not intended to be a substitute<br />
for, or superior to, GAAP measures in the financial statements;<br />
• The fact that ROIC is a ratio inherently limits its use, and<br />
management uses ROIC <strong>on</strong>ly for the purposes discussed above.<br />
The relevance and use of net profit for the year (being the most<br />
relevant comparable GAAP measure) is clearly more pervasive;<br />
and<br />
• UFCF is not the residual cash available to pay dividends but<br />
represents cash generated by the business and broadly available<br />
to the providers of finance, both debt and equity.<br />
Underlying sales growth<br />
USG reflects the change in revenue from c<strong>on</strong>tinuing operati<strong>on</strong>s at<br />
c<strong>on</strong>stant rates of exchange, excluding the effects of acquisiti<strong>on</strong>s<br />
and disposals. It is a measure that provides valuable additi<strong>on</strong>al<br />
in<strong>form</strong>ati<strong>on</strong> <strong>on</strong> the underlying per<strong>form</strong>ance of the business.<br />
In particular, it presents the organic growth of our business year<br />
<strong>on</strong> year and is used internally as a core measure of sales<br />
per<strong>form</strong>ance.<br />
The rec<strong>on</strong>ciliati<strong>on</strong> of USG to the GAAP measure turnover is as<br />
follows:<br />
<strong>2006</strong> 2005<br />
vs 2005 vs 2004<br />
Underlying sales growth (%) 3.8 3.4<br />
Effect of acquisiti<strong>on</strong>s (%) 0.1 0.0<br />
Effect of disposals (%) (0.8) (1.5)<br />
Effect of exchange rates (%) 0.3 1.4<br />
Turnover growth (%) 3.2 3.3<br />
Ungeared free cash flow<br />
Ungeared free cash flow (UFCF) expresses the generati<strong>on</strong> of profit<br />
by the business and how this is translated into cash, and thus<br />
ec<strong>on</strong>omic value. It is therefore not used as a liquidity measure<br />
within <strong>Unilever</strong>. The movement in UFCF is used by <strong>Unilever</strong> to<br />
measure progress against our l<strong>on</strong>ger-term value creati<strong>on</strong> goals as<br />
outlined to investors.<br />
UFCF is cash flow from group operating activities, less capital<br />
expenditure, less charges to operating profit for share-based<br />
compensati<strong>on</strong> and pensi<strong>on</strong>s, and less tax (adjusted to reflect<br />
an ungeared positi<strong>on</strong> and, in <strong>2006</strong>, for the impact <strong>on</strong> profit<br />
<strong>on</strong> sales of frozen foods businesses), but before the financing<br />
of pensi<strong>on</strong>s.<br />
In <strong>2006</strong>, UFCF was €4.2 billi<strong>on</strong> (2005: €4.0 billi<strong>on</strong>). The<br />
rec<strong>on</strong>ciliati<strong>on</strong> of UFCF to the GAAP measures net profit and<br />
cash flow from operating activities is shown <strong>on</strong> page 26.<br />
The tax charge used in determining UFCF can be either the<br />
income statement tax charge or the actual cash taxes paid.<br />
Our c<strong>on</strong>sistently applied definiti<strong>on</strong> uses the income statement<br />
tax charge in order to eliminate the impact of volatility due to the<br />
variable timing of payments around the year end. For <strong>2006</strong> the<br />
income statement tax charge <strong>on</strong> this basis is materially impacted<br />
by the tax effect of n<strong>on</strong>-cash charges for the provisi<strong>on</strong> for<br />
preference shares and certain other n<strong>on</strong>-cash items. UFCF based<br />
<strong>on</strong> actual cash tax paid would be €4.5 billi<strong>on</strong> (2005: €3.7 billi<strong>on</strong>).<br />
Return <strong>on</strong> invested capital<br />
Return <strong>on</strong> invested capital (ROIC) expresses the returns generated<br />
<strong>on</strong> capital invested in the Group. The progressi<strong>on</strong> of ROIC is used<br />
by <strong>Unilever</strong> to measure progress against our l<strong>on</strong>ger-term value<br />
creati<strong>on</strong> goals outlined to investors.<br />
ROIC is profit after tax but excluding net interest <strong>on</strong> net debt and<br />
impairment of goodwill and indefinite-lived intangible assets both<br />
net of tax, divided by average invested capital for the year.<br />
Invested capital is the sum of property, plant and equipment and<br />
other n<strong>on</strong>-current investments, software and finite-lived intangible<br />
assets, working capital, goodwill and indefinite-lived intangible<br />
assets at gross book value and cumulative goodwill written off<br />
directly to reserves under an earlier accounting policy.<br />
In <strong>2006</strong>, ROIC was 14.6% (2005: 12.5%). The rec<strong>on</strong>ciliati<strong>on</strong> of<br />
ROIC to the GAAP measure net profit is shown <strong>on</strong> page 26.<br />
ROIC <str<strong>on</strong>g>report</str<strong>on</strong>g>ed in 2005 and <strong>2006</strong> has been based <strong>on</strong> total<br />
business profit, including profit <strong>on</strong> disposals. The impact <strong>on</strong> profit<br />
after tax of material disposals was €1 170 milli<strong>on</strong> (2005: €458<br />
milli<strong>on</strong>). ROIC excluding this impact is 11.5% (2005: 11.3%).<br />
<strong>Unilever</strong> <str<strong>on</strong>g>Annual</str<strong>on</strong>g> Report <strong>on</strong> Form 20-F <strong>2006</strong> 25<br />
Report of the Directors (c<strong>on</strong>tinued)
Report of the Directors (c<strong>on</strong>tinued)<br />
Financial review (c<strong>on</strong>tinued)<br />
€ milli<strong>on</strong> € milli<strong>on</strong> € milli<strong>on</strong><br />
Ungeared free cash flow <strong>2006</strong> 2005 2004<br />
Net profit 5 015 3 975 2 941<br />
Taxati<strong>on</strong> 1 332 1 301 836<br />
Share of net profit of joint ventures/associates and other income from n<strong>on</strong>-current investments (144) (55) (95)<br />
Net finance costs 725 618 631<br />
Depreciati<strong>on</strong>, amortisati<strong>on</strong> and impairment 982 1 274 2 063<br />
Changes in working capital 87 193 547<br />
Pensi<strong>on</strong>s charges in operating profit less payments (1 038) (532) (472)<br />
Movements in provisi<strong>on</strong>s less payments 107 (230) 574<br />
Eliminati<strong>on</strong> of profits <strong>on</strong> disposals (1 620) (789) (308)<br />
N<strong>on</strong>-cash charge for share-based compensati<strong>on</strong> 120 192 218<br />
Other adjustments 8 (23) (10)<br />
Cash flow from operating activities 5 574 5 924 6 925<br />
Less charge for share-based compensati<strong>on</strong> (120) (192) (218)<br />
Add back pensi<strong>on</strong> payments less pensi<strong>on</strong> charges in operating profit 1 038 532 472<br />
Less net capital expenditure (934) (813) (869)<br />
Less tax charge adjusted to reflect an ungeared positi<strong>on</strong> (1 336) (1 440) (964)<br />
Taxati<strong>on</strong> <strong>on</strong> profit (1 332) (1 301) (836)<br />
Taxati<strong>on</strong> <strong>on</strong> profit <strong>on</strong> sales of frozen foods businesses 159 – –<br />
Tax relief <strong>on</strong> net finance costs (163) (139) (128)<br />
Ungeared free cash flow 4 222 4 011 5 346<br />
€ milli<strong>on</strong> € milli<strong>on</strong> € milli<strong>on</strong><br />
Return <strong>on</strong> invested capital <strong>2006</strong> 2005 2004<br />
Net profit 5 015 3 975 2 941<br />
Add back net interest expense net of tax 365 424 431<br />
Add back impairment charges net of tax (a) 15 245 536<br />
Profit after tax, before interest and impairment of goodwill and indefinite-lived intangible assets 5 395 4 644 3 908<br />
Year-end positi<strong>on</strong>s for invested capital:<br />
Property, plant and equipment and other n<strong>on</strong>-current investments 7 142 7 333 6 966<br />
Software and finite-lived intangible assets 608 642 623<br />
Inventories 3 796 4 107 3 756<br />
Trade and other receivables 4 667 5 185 4 410<br />
Trade payables and other creditors due within <strong>on</strong>e year (8 513) (8 782) (8 232)<br />
Elements of invested capital included in assets and liabilities held for sale 15 200 –<br />
Goodwill and indefinite-lived intangible assets at gross book value 20 705 21 621 19 854<br />
Total 28 420 30 306 27 377<br />
Add back cumulative goodwill written off directly to reserves 6 427 6 870 7 246<br />
Year-end invested capital 34 847 37 176 34 623<br />
Average invested capital for the year 36 850 37 012 36 444<br />
Return <strong>on</strong> average invested capital 14.6% 12.5% 10.7%<br />
(a) Excluding write-downs of goodwill and indefinite-lived intangible assets taken in c<strong>on</strong>necti<strong>on</strong> with business disposals.<br />
26 <strong>Unilever</strong> <str<strong>on</strong>g>Annual</str<strong>on</strong>g> Report <strong>on</strong> Form 20-F <strong>2006</strong>
Financial review (c<strong>on</strong>tinued)<br />
Net debt<br />
Net debt is defined as the excess of total borrowings, bank<br />
overdrafts, relevant derivatives and finance leases over cash, cash<br />
equivalents and financial assets, excluding amounts held for sale.<br />
It is a measure that provides valuable additi<strong>on</strong>al in<strong>form</strong>ati<strong>on</strong><br />
<strong>on</strong> the summary presentati<strong>on</strong> of the Group’s net financial<br />
liabilities and is a measure in comm<strong>on</strong> use elsewhere.<br />
The rec<strong>on</strong>ciliati<strong>on</strong> of net debt to the GAAP measure total<br />
borrowings is as follows:<br />
€ milli<strong>on</strong> € milli<strong>on</strong><br />
<strong>2006</strong> 2005<br />
Total borrowings (8 601) (12 399)<br />
Borrowings due within <strong>on</strong>e year (4 362) (5 942)<br />
Borrowings due after <strong>on</strong>e year (4 239) (6 457)<br />
Cash and cash equivalents as per balance sheet 1 039<br />
Cash and cash equivalents as per<br />
1 529<br />
cash flow statement 710 1 265<br />
Add bank overdrafts deducted therein<br />
Less cash and cash equivalents in<br />
329 265<br />
assets/liabilities held for sale – (1)<br />
Other financial assets 237 335<br />
Derivatives and finance leases included<br />
in other receivables and other liabilities (198) 33<br />
Net debt (7 523) (10 502)<br />
Total Shareholder Return<br />
Total Shareholder Return (TSR) measures the returns received by<br />
a shareholder, capturing both the increase in share price and the<br />
value of dividend income (assuming dividends are re-invested).<br />
<strong>Unilever</strong>’s TSR per<strong>form</strong>ance is compared with a peer group of<br />
competitors over a three-year rolling per<strong>form</strong>ance period. This<br />
period is sensitive enough to reflect changes but l<strong>on</strong>g enough<br />
to smooth out short-term volatility. The return is expressed in<br />
US dollars, based <strong>on</strong> the equivalent US dollar share price for<br />
NV and PLC. US dollars were chosen to facilitate comparis<strong>on</strong> with<br />
companies in <strong>Unilever</strong>’s chosen reference group. The choice of<br />
currency affects the absolute TSR but not the relative ranking.<br />
<strong>Unilever</strong>’s TSR target is to be in the top third of a reference group<br />
including 20 other internati<strong>on</strong>al c<strong>on</strong>sumer goods companies <strong>on</strong> a<br />
three-year rolling basis. At the end of 2005 we were positi<strong>on</strong>ed<br />
14th, and at the end of <strong>2006</strong> the ranking was 13th. In <strong>2006</strong>,<br />
the following companies <strong>form</strong>ed the peer group of comparative<br />
companies:<br />
Av<strong>on</strong> Kraft<br />
Beiersdorf Li<strong>on</strong><br />
Cadbury Schweppes L’Oréal<br />
Clorox Nestlé<br />
Coca-Cola Orkla<br />
Colgate Pepsico<br />
Dan<strong>on</strong>e Procter & Gamble<br />
Heinz Reckitt Benckiser<br />
Kao Sara Lee<br />
Kimberly-Clark Shiseido<br />
<strong>Unilever</strong>’s positi<strong>on</strong> relative to the TSR reference group<br />
7<br />
14<br />
21<br />
2002 2003 2004<br />
2005<br />
<strong>2006</strong><br />
The reference group, including <strong>Unilever</strong>, c<strong>on</strong>sists of 21 companies. <strong>Unilever</strong>’s positi<strong>on</strong> is<br />
based <strong>on</strong> TSR over a three-year rolling period.<br />
<strong>Unilever</strong> <str<strong>on</strong>g>Annual</str<strong>on</strong>g> Report <strong>on</strong> Form 20-F <strong>2006</strong> 27<br />
Report of the Directors (c<strong>on</strong>tinued)
Report of the Directors (c<strong>on</strong>tinued)<br />
Financial review (c<strong>on</strong>tinued)<br />
Results and earnings per share<br />
The following discussi<strong>on</strong> summarises the results of the Group<br />
during the years 2004, 2005 and <strong>2006</strong>. The figures quoted are in<br />
euros, at current rates of exchange, being the average or year-end<br />
rates of each period, unless otherwise stated. In<strong>form</strong>ati<strong>on</strong> about<br />
exchange rates between the euro, pound sterling and the US<br />
dollar is given <strong>on</strong> page 146.<br />
The results reflected in the c<strong>on</strong>solidated income statement and<br />
supporting notes arise from the Group’s c<strong>on</strong>tinuing operati<strong>on</strong>s.<br />
In November <strong>2006</strong>, we successfully completed the sale of the<br />
majority of our European frozen foods businesses. The results of<br />
the businesses disposed of have been presented as disc<strong>on</strong>tinued<br />
operati<strong>on</strong>s for 2004 and 2005, and in <strong>2006</strong>, for the period up to<br />
the date of sale. During July 2005, we completed the sale of<br />
<strong>Unilever</strong> Cosmetics Internati<strong>on</strong>al (UCI) to Coty Inc., United States.<br />
The results of UCI are presented as disc<strong>on</strong>tinued operati<strong>on</strong>s for<br />
the 2004 year and, in 2005, for the period up to the date of sale.<br />
28 <strong>Unilever</strong> <str<strong>on</strong>g>Annual</str<strong>on</strong>g> Report <strong>on</strong> Form 20-F <strong>2006</strong><br />
€ milli<strong>on</strong> € milli<strong>on</strong> € milli<strong>on</strong><br />
<strong>2006</strong> 2005 2004<br />
C<strong>on</strong>tinuing operati<strong>on</strong>s:<br />
Turnover 39 642 38 401 37 168<br />
Operating profit 5 408 5 074 3 981<br />
Net profit 3 685 3 335 2 728<br />
Net profit from disc<strong>on</strong>tinued operati<strong>on</strong>s 1 330 640 213<br />
Net profit – total 5 015 3 975 2 941<br />
€ € €<br />
<strong>2006</strong> 2005 2004<br />
EPS – c<strong>on</strong>tinuing operati<strong>on</strong>s 1.19 1.07 0.87<br />
EPS – total 1.65 1.29 0.94<br />
Results for <strong>2006</strong> compared with 2005<br />
Turnover for the period increased by 3.2% to €39 642 milli<strong>on</strong>.<br />
The increase is driven by underlying sales growth of 3.8%, with<br />
c<strong>on</strong>tributi<strong>on</strong>s from both volume and price, as well as favourable<br />
currency effects of 0.3%. Offsetting the increase is the impact of<br />
disposals (0.8)% in the period.<br />
Operating profit for the period increased by 7% to €5 408 milli<strong>on</strong><br />
with operating margin increasing to 13.6%, up by 0.4 percentage<br />
points compared with 2005. This was after charging restructuring,<br />
disposals and impairments costs equivalent to 1.3 percentage<br />
points of sales (compared with 1.5 percentage points in 2005).<br />
It also included €266 milli<strong>on</strong> of <strong>on</strong>e-off gains from changes to US<br />
healthcare and UK pensi<strong>on</strong> plans, equivalent to 0.7 percentage<br />
points of sales. Before these items, and the profit <strong>on</strong> the sale of<br />
an office in the US in 2005, the operating margin would have<br />
been 0.3 percentage points lower than last year. Gross margins<br />
held steady during the year, with supply chain savings<br />
programmes, pricing acti<strong>on</strong> and a positive mix fully offsetting<br />
around €600 milli<strong>on</strong> of higher input costs. Investment in<br />
advertising and promoti<strong>on</strong>s increased by nearly €300 milli<strong>on</strong>, from<br />
12.8% to 13.1% of sales. An overview of per<strong>form</strong>ance by regi<strong>on</strong>s<br />
is included in the Operating review <strong>on</strong> pages 13 to 19.<br />
Net finance costs were 18% higher in the year at €721 milli<strong>on</strong>.<br />
<strong>2006</strong> includes the provisi<strong>on</strong> of €300 milli<strong>on</strong> relating to preference<br />
shares. The costs of financing net borrowings were lower than<br />
last year with the benefit of a lower level of debt. Pensi<strong>on</strong>s<br />
financing, which was a net expense of €53 milli<strong>on</strong> in 2005,<br />
showed a net income of €41 milli<strong>on</strong> in <strong>2006</strong>, reflecting a lower<br />
gross pensi<strong>on</strong> fund deficit.<br />
The tax rate for the year was 24%, compared with 26% in 2005,<br />
including the benefits of a better country mix.<br />
Share of net profit from joint ventures was ahead of last year due<br />
to the c<strong>on</strong>tinued growth in the partnerships between Lipt<strong>on</strong> and<br />
Pepsi for ready-to-drink tea. Share of net profit from associates<br />
increased significantly compared with prior year, principally<br />
because of the placement of equity by <strong>on</strong>e of our venture capital<br />
fund investments.<br />
Net profit and earnings per share from c<strong>on</strong>tinuing operati<strong>on</strong>s<br />
grew by 10% and 11% respectively in the year. Including the<br />
profits of the disc<strong>on</strong>tinued operati<strong>on</strong>s, net profit and earnings per<br />
share increased by 26% and 27% in the year, respectively.<br />
Return <strong>on</strong> invested capital (ROIC) increased from 12.5% in 2005<br />
to 14.6% in <strong>2006</strong>. Both years included significant profits from<br />
the sale of disc<strong>on</strong>tinued operati<strong>on</strong>s. Excluding these, the ROIC<br />
increased from 11.3% to 11.5%.<br />
Results for 2005 compared with 2004<br />
Reported turnover grew by 3.3% in the year to €38 401 milli<strong>on</strong>.<br />
This increase includes a favourable effect from movements of the<br />
average euro exchange rate against the basket of <strong>Unilever</strong><br />
currencies, which amounted to 1.4% of turnover. The net impact<br />
of disposals less acquisiti<strong>on</strong>s was a decline in turnover of 1.5%.<br />
This arose principally from the sale of European olive oil and other<br />
foods businesses. Underlying sales growth in the year of 3.4%<br />
was the result of volume increases.<br />
Operating profit increased by 27% in the year to €5 074 milli<strong>on</strong><br />
with operating margin increasing to 13.2% (2004: 10.7%).<br />
Before the impact of net costs of restructuring, business disposals<br />
and impairments, the operating margin for 2005 would have<br />
been 0.9 percentage points lower than the previous year.<br />
Advertising and promoti<strong>on</strong>s were 1.1 percentage points of sales<br />
higher than last year. Cost savings and an improved mix more<br />
than offset the effect of an increase of nearly €600 milli<strong>on</strong> in<br />
input costs. Operating charges for restructuring, business<br />
disposals and impairments include the impairment of the Slim•Fast<br />
business in both 2005 and 2004 amounting to €363 milli<strong>on</strong> and<br />
€791 milli<strong>on</strong> respectively. An overview of per<strong>form</strong>ance by regi<strong>on</strong><br />
is included in the Operating review <strong>on</strong> pages 13 to 19.<br />
Net finance costs were 2% lower in the year at €613 milli<strong>on</strong>,<br />
through lower levels of borrowings.
Financial review (c<strong>on</strong>tinued)<br />
A reduced c<strong>on</strong>tributi<strong>on</strong> was generated from our shares in joint<br />
ventures and associates, most significantly from our associate<br />
Johns<strong>on</strong>Diversey. Profit from disc<strong>on</strong>tinued operati<strong>on</strong>s includes the<br />
gain of €458 milli<strong>on</strong> arising from the sale of UCI.<br />
The Group’s effective tax rate of profit for the year was 26%,<br />
compared with 21% in 2004, which reflected resoluti<strong>on</strong> of a<br />
higher level of outstanding prior year tax issues.<br />
Net profit and earnings per share from c<strong>on</strong>tinuing operati<strong>on</strong>s<br />
increased by 22% and 23% respectively in the year. Including the<br />
profits of the disc<strong>on</strong>tinued operati<strong>on</strong>s, total earnings per share<br />
increased by 37% in the year.<br />
Return <strong>on</strong> invested capital (ROIC) for the year was 12.5%, up<br />
from 10.7% in 2004. This reflects the lower restructuring costs<br />
and higher profits <strong>on</strong> business disposals included in net profit.<br />
ROIC retains all goodwill and intangibles in invested capital,<br />
regardless of impairment.<br />
Acquisiti<strong>on</strong>s and disposals<br />
<strong>2006</strong><br />
On 4 September <strong>2006</strong>, <strong>Unilever</strong> announced a public offer to<br />
purchase all ordinary shares of Elais-<strong>Unilever</strong> S.A. held by third<br />
party shareholders. Elais-<strong>Unilever</strong> S.A. is <str<strong>on</strong>g>report</str<strong>on</strong>g>ed as a subsidiary<br />
and is <strong>Unilever</strong>’s main foods business in Greece. The offer price<br />
was €24.50 per share, with the public offer closing <strong>on</strong> 25 October<br />
<strong>2006</strong>. A total of 2 234 692 shares were purchased by the end<br />
of <strong>2006</strong>, increasing <strong>Unilever</strong>’s ownership of Elais-<strong>Unilever</strong> S.A.<br />
to 83.52%.<br />
On 3 November <strong>2006</strong> we announced the completi<strong>on</strong> of the sale<br />
of the majority of our frozen foods businesses in Europe to the<br />
Permira Funds. <strong>Unilever</strong> received proceeds of €1.7 billi<strong>on</strong>, and<br />
recorded a profit <strong>on</strong> disposal of €1.2 billi<strong>on</strong>. The businesses sold<br />
included operati<strong>on</strong>s in Austria, Belgium, France, Germany, Ireland,<br />
the Netherlands, Portugal and the United Kingdom.<br />
In <strong>2006</strong> we disposed of various other businesses and brands with<br />
a combined turnover of around €280 milli<strong>on</strong>, including Mora in<br />
the Netherlands and Belgium, Finesse in North America and Nihar<br />
in India.<br />
2005<br />
There were no material acquisiti<strong>on</strong>s during 2005.<br />
On 11 July 2005, we completed the sale of our Prestige fragrance<br />
business, UCI, to Coty Inc. of the United States. <strong>Unilever</strong> received<br />
US $800 milli<strong>on</strong> in cash, with the opportunity for further deferred<br />
payments c<strong>on</strong>tingent up<strong>on</strong> future sales.<br />
Business disposals in 2005 included Stant<strong>on</strong> Oil in the UK and<br />
Ireland, Dextro in various countries in Europe, Opal in Peru, Karo<br />
and Knax in Mexico, spreads and cooking products in Australia<br />
and New Zealand, Crispa, Mentadent, Marmite, Bovril and<br />
Maizena in South Africa, frozen pizza in Austria, Biop<strong>on</strong> in<br />
Hungary and tea plantati<strong>on</strong>s in India. The combined annual<br />
turnover of these businesses was approximately €200 milli<strong>on</strong>.<br />
In March 2005 <strong>Unilever</strong> carried out a restructuring of its<br />
Portuguese foods business. Before the restructuring <strong>Unilever</strong><br />
Portugal held an interest in FIMA/VG – Distribuição de Produtos<br />
Alimentares, Lda. (FIMA) foods business, a joint venture with<br />
Jerónimo Martins Group, in additi<strong>on</strong> to its wholly owned<br />
Bestfoods business acquired in 2000. As a result of the transacti<strong>on</strong><br />
the two foods businesses – FIMA and <strong>Unilever</strong> Bestfoods Portugal<br />
– were unified and the joint venture stakes were re-balanced so<br />
that <strong>Unilever</strong> now holds 49% of the combined foods business<br />
and Jerónimo Martins Group 51%. See page 123 for further<br />
details <strong>on</strong> the Portuguese businesses whose ownership was<br />
further reorganised as at 1 January 2007.<br />
2004<br />
There were no material acquisiti<strong>on</strong>s during 2004.<br />
In 2004 we disposed of more than 20 businesses with total<br />
turnover in excess of €700 milli<strong>on</strong>. Significant disposals included<br />
the sale of certain household care brands in North America, our<br />
edible oils business under the Capullo, Inca and Mazola brands<br />
in Mexico, the Dalda brand in Pakistan and the sale of our<br />
European frozen pizza and baguette business. Our chemicals<br />
business in India (Hindustan Lever Chemicals) was merged<br />
with Tata Chemicals.<br />
For further in<strong>form</strong>ati<strong>on</strong> <strong>on</strong> the impact of acquisiti<strong>on</strong>s and<br />
disposals refer to note 26 <strong>on</strong> page 113.<br />
Dividends and market capitalisati<strong>on</strong><br />
Dividends per share<br />
Per €0.16 Per 3 1 ⁄9p<br />
NV ordinary share PLC ordinary share<br />
€ € £ £<br />
<strong>2006</strong> 2005 <strong>2006</strong> 2005<br />
Interim 0.23 0.22 15.62 15.04<br />
Final – 0.44 – 30.09<br />
Proposed final 0.47 – 32.04 –<br />
0.70 0.66 47.66 45.13<br />
One-off 0.26 – 17.66 –<br />
0.96 0.66 65.32 45.13<br />
Final dividends for <strong>2006</strong> are subject to approval at the <str<strong>on</strong>g>Annual</str<strong>on</strong>g><br />
General Meetings. If approved, this will bring the total regular<br />
dividend, excluding the additi<strong>on</strong>al <strong>on</strong>e-off payment, to €0.70 per<br />
share for NV and 47.66p for PLC, an increase of 6% in each case.<br />
In accordance with IFRS, no provisi<strong>on</strong> for the amount of this<br />
dividend, estimated as €1 358 milli<strong>on</strong>, has been recognised in<br />
the financial statements for the year ended 31 December <strong>2006</strong>.<br />
The additi<strong>on</strong>al <strong>on</strong>e-off dividend of €751 milli<strong>on</strong> was paid during<br />
December <strong>2006</strong>.<br />
<strong>Unilever</strong>’s combined market capitalisati<strong>on</strong> at 31 December <strong>2006</strong><br />
was €63.4 billi<strong>on</strong> (2005: €57.5 billi<strong>on</strong>).<br />
<strong>Unilever</strong> <str<strong>on</strong>g>Annual</str<strong>on</strong>g> Report <strong>on</strong> Form 20-F <strong>2006</strong> 29<br />
Report of the Directors (c<strong>on</strong>tinued)
Report of the Directors (c<strong>on</strong>tinued)<br />
Financial review (c<strong>on</strong>tinued)<br />
Balance sheet<br />
30 <strong>Unilever</strong> <str<strong>on</strong>g>Annual</str<strong>on</strong>g> Report <strong>on</strong> Form 20-F <strong>2006</strong><br />
€ milli<strong>on</strong> € milli<strong>on</strong><br />
<strong>2006</strong> 2005<br />
Goodwill and intangible assets 17 206 18 055<br />
Other n<strong>on</strong>-current assets 10 365 10 303<br />
Current assets 9 501 11 142<br />
Current liabilities (13 884) (15 394)<br />
23 188 24 106<br />
N<strong>on</strong>-current liabilities 11 516 15 341<br />
Shareholders’ equity 11 230 8 361<br />
Minority interest 442 404<br />
23 188 24 106<br />
Goodwill and intangibles as at 31 December <strong>2006</strong> were<br />
€0.8 billi<strong>on</strong> lower than in 2005. This was almost solely a<br />
c<strong>on</strong>sequence of currency movements. Currency movements also<br />
explain the reducti<strong>on</strong> of inventories and trade receivables when<br />
compared with prior year. The other significant movements in<br />
n<strong>on</strong>-current assets relate to pensi<strong>on</strong> assets for funded schemes<br />
in surplus and deferred tax assets. The increase in pensi<strong>on</strong> fund<br />
assets was due to improvements in asset yields and increased<br />
c<strong>on</strong>tributi<strong>on</strong>s. The decrease of n<strong>on</strong>-current deferred tax assets<br />
from €1.7 billi<strong>on</strong> as at 31 December 2005 to €1.3 billi<strong>on</strong> as at<br />
31 December <strong>2006</strong> was a result of the decrease in pensi<strong>on</strong><br />
liabilities.<br />
The overall funding shortfall before tax of pensi<strong>on</strong>s and health<br />
care plans reduced significantly from €5.6 billi<strong>on</strong> at the end of<br />
2005 to €3.1 billi<strong>on</strong> at the end of <strong>2006</strong>. Within this, there was at<br />
31 December <strong>2006</strong> an aggregated surplus of €0.3 billi<strong>on</strong> <strong>on</strong> our<br />
funded plans, reflecting a combinati<strong>on</strong> of str<strong>on</strong>g equity returns,<br />
increased c<strong>on</strong>tributi<strong>on</strong>s and higher real interest rates, partly offset<br />
by increased life expectancy assumpti<strong>on</strong>s. The value of our<br />
unfunded obligati<strong>on</strong>s reduced from €4.2 billi<strong>on</strong> to €3.4 billi<strong>on</strong><br />
due to rises in interest rates, favourable exchange movements<br />
and changes to various retiree medical benefits.<br />
We made a number of changes to our pensi<strong>on</strong>s and postretirement<br />
healthcare plans during <strong>2006</strong>. In particular, in the<br />
US retiree healthcare plan we introduced an annual cap <strong>on</strong> the<br />
benefits which each participant can claim. In the UK we updated<br />
assumpti<strong>on</strong>s <strong>on</strong> pensi<strong>on</strong> commutati<strong>on</strong>s and now reduce some<br />
deferred pensi<strong>on</strong>s if they are taken early, to align with market<br />
practice. See page 32 for details <strong>on</strong> <strong>Unilever</strong>’s pensi<strong>on</strong><br />
investment strategy.<br />
Total equity has increased by €2.9 billi<strong>on</strong> in the year. Net profit<br />
added €5.0 billi<strong>on</strong> and currency and fair value/actuarial gains<br />
added €0.5 billi<strong>on</strong>. Dividends paid in the year totalled<br />
€2.7 billi<strong>on</strong>.<br />
As at 31 December <strong>2006</strong>, cash and cash equivalents and other<br />
financial assets amounted to €1.3 billi<strong>on</strong>, a decrease of €0.6<br />
billi<strong>on</strong>. Borrowings, (including finance leases amounting to<br />
€0.2 billi<strong>on</strong> and the negative fair value of derivatives relating to<br />
borrowings) amounted to €8.8 billi<strong>on</strong> a reducti<strong>on</strong> of €3.8 billi<strong>on</strong>.<br />
The net debt positi<strong>on</strong>, see page 27, as at 31 December <strong>2006</strong> was<br />
€7.5 billi<strong>on</strong>, a reducti<strong>on</strong> of €3.0 billi<strong>on</strong> since 1 January <strong>2006</strong>.<br />
This was driven by the cash generated by the business during the<br />
year, the proceeds of disposals (particularly from the sale of the<br />
majority of the European frozen foods businesses) and currency<br />
effects, specifically the weakening of the US dollar.<br />
<strong>Unilever</strong> manages interest rate and currency exposures based <strong>on</strong><br />
the net debt positi<strong>on</strong>. Taking into account the various cross<br />
currency swaps and other derivatives, 81% of <strong>Unilever</strong>’s net debt<br />
was in US dollars (2005: 60%) and 25% in euros (2005:17%)<br />
and ((33)% - financial assets) in sterling, with the remainder<br />
spread over a large number of other currencies. The currency<br />
distributi<strong>on</strong> of total borrowings was as follows: 70% in US dollars<br />
(2005: 51%), and 24% in euros (2005: 20%) with the remainder<br />
spread over a large number of other currencies. Further details of<br />
the currency analyses are given in note 15 <strong>on</strong> page 95 and note<br />
16 <strong>on</strong> page 98.<br />
<strong>Unilever</strong> has committed credit facilities in place to support its<br />
commercial paper programmes and for general corporate<br />
purposes. The undrawn committed credit facilities in place at<br />
the end of <strong>2006</strong> were: bilateral committed credit facilities<br />
totalling US $4.6 billi<strong>on</strong>, bilateral notes commitments totalling<br />
US $0.2 billi<strong>on</strong> and bilateral m<strong>on</strong>ey market commitments totalling<br />
US $1.4 billi<strong>on</strong>. Further details regarding these facilities are given<br />
in note 16 <strong>on</strong> page 98.<br />
During <strong>2006</strong>, a US $300 milli<strong>on</strong> b<strong>on</strong>d with a fixed interest rate<br />
of 6.15% was repaid, as was a €1 billi<strong>on</strong> b<strong>on</strong>d with a fixed<br />
interest rate of 5.125% and a US $500 milli<strong>on</strong> b<strong>on</strong>d with a fixed<br />
interest rate of 5.125%. Three floating rate b<strong>on</strong>ds denominated<br />
in Japanese yen for a total of ¥37 billi<strong>on</strong> (approximately<br />
€250 milli<strong>on</strong>) were repaid and <strong>Unilever</strong> issued a new floating rate<br />
b<strong>on</strong>d for a similar amount with a maturity date of June 2008.<br />
<strong>Unilever</strong> is satisfied that its financing arrangements are adequate<br />
to meet its working capital needs for the foreseeable future.<br />
<strong>Unilever</strong>’s c<strong>on</strong>tractual obligati<strong>on</strong>s at the end of <strong>2006</strong> included<br />
capital expenditure commitments, borrowings, lease commitments<br />
and other commitments. A summary of certain c<strong>on</strong>tractual<br />
obligati<strong>on</strong>s at 31 December <strong>2006</strong> is provided in the table below.<br />
Other l<strong>on</strong>g-term commitments have increased compared with<br />
prior year due to the outsourcing c<strong>on</strong>tracts which <strong>Unilever</strong> has<br />
entered into during <strong>2006</strong>. Further details are set out in the<br />
following notes to the accounts; note 10 <strong>on</strong> page 90, note 16 <strong>on</strong><br />
page 96, note 17 <strong>on</strong> pages 99 to 101 and note 25 <strong>on</strong> page 112.
Financial review (c<strong>on</strong>tinued)<br />
C<strong>on</strong>tractual obligati<strong>on</strong>s at 31 December <strong>2006</strong><br />
€ milli<strong>on</strong> € milli<strong>on</strong> € milli<strong>on</strong> € milli<strong>on</strong> € milli<strong>on</strong><br />
Due Due in<br />
within Due in Due in over<br />
Total <strong>on</strong>e year 1-3 years 3-5 years 5 years<br />
L<strong>on</strong>g-term debt 6 183 1 944 696 1 346 2 197<br />
Operating lease<br />
obligati<strong>on</strong>s 1 617 342 537 338 400<br />
Purchase obligati<strong>on</strong>s (a) 233 156 58 16 3<br />
Finance leases 296 71 90 27 108<br />
Other l<strong>on</strong>g-term<br />
commitments 1 547 315 395 312 525<br />
(a) Raw and packaging materials and finished goods.<br />
Off-balance sheet arrangements<br />
IFRS interpretati<strong>on</strong> SIC 12 and US GAAP FIN 46R require that<br />
entities with which we have relati<strong>on</strong>ships are c<strong>on</strong>sidered for<br />
c<strong>on</strong>solidati<strong>on</strong> in the c<strong>on</strong>solidated accounts based <strong>on</strong> relative<br />
sharing of ec<strong>on</strong>omic risks and rewards rather than based solely<br />
<strong>on</strong> share ownership and voting rights. We periodically review our<br />
c<strong>on</strong>tractual arrangements with potential special purpose entities<br />
(SPEs) or variable interest entities (VIEs) as defined by SIC 12 and<br />
FIN 46R respectively. The most recent review has c<strong>on</strong>cluded that<br />
that there are no significant SPE or VIE relati<strong>on</strong>ships which are<br />
not already appropriately reflected in the accounts. In<strong>form</strong>ati<strong>on</strong><br />
c<strong>on</strong>cerning guarantees given by the Group is stated in note 25<br />
<strong>on</strong> page 112.<br />
Cash flow<br />
€ milli<strong>on</strong> € milli<strong>on</strong> € milli<strong>on</strong><br />
<strong>2006</strong> 2005 2004<br />
Net cash flow from<br />
operating activities 4 511 4 353 5 547<br />
Net cash flow from/(used in)<br />
investing activities 1 155 515 (120)<br />
Net cash flow from/(used in)<br />
financing activities (6 572) (4 821) (5 938)<br />
Net increase/(decrease) in cash and cash<br />
equivalents (906) 47 (511)<br />
Cash and cash equivalents at 31 December <strong>2006</strong> were<br />
€0.6 billi<strong>on</strong> lower than as at 31 December 2005. Cash from<br />
operating activities was €0.3 billi<strong>on</strong> lower than in 2005 due to<br />
significantly higher c<strong>on</strong>tributi<strong>on</strong>s to pensi<strong>on</strong> schemes. This was<br />
offset to some extent by the improvements in the level of working<br />
capital, with a further reducti<strong>on</strong> of €0.1 billi<strong>on</strong> as at 31 December<br />
<strong>2006</strong>. Income tax paid was substantially lower through a<br />
combinati<strong>on</strong> of tax relief <strong>on</strong> the higher pensi<strong>on</strong> c<strong>on</strong>tributi<strong>on</strong>s,<br />
structural improvements in the tax rate and timing differences. As<br />
a result, net cash flow from operating activities was €0.2 billi<strong>on</strong><br />
higher than last year.<br />
Net cash flow from investing activities was €0.6 billi<strong>on</strong> higher due<br />
to the impact of the disposals in the year which had a positive<br />
impact of €1.8 billi<strong>on</strong> (2005: €0.8 billi<strong>on</strong>), offset by increased<br />
capital expenditure of €0.1 billi<strong>on</strong> compared with the prior year.<br />
Net cash flow used in financing activities increased by €1.8 billi<strong>on</strong>,<br />
reflecting dividend payments and repayment of debt.<br />
Finance and liquidity<br />
<strong>Unilever</strong> aims to be in the top third of a reference group including<br />
20 other internati<strong>on</strong>al c<strong>on</strong>sumer goods companies for Total<br />
Shareholder Return, as explained <strong>on</strong> page 27. The Group’s<br />
financial strategy supports this objective and provides the financial<br />
flexibility to meet its strategic and day-to-day needs. The key<br />
elements of the financial strategy are:<br />
• Appropriate access to equity and debt capital;<br />
• Sufficient flexibility for acquisiti<strong>on</strong>s that we fund out of current<br />
cash flows;<br />
• A1/P1 short-term credit rating;<br />
• Sufficient resilience against ec<strong>on</strong>omic turmoil; and<br />
• Optimal weighted average cost of capital, given the c<strong>on</strong>straints<br />
above.<br />
<strong>Unilever</strong> aims to c<strong>on</strong>centrate cash in the parent and finance<br />
companies in order to ensure maximum flexibility in meeting<br />
changing business needs. Operating subsidiaries are financed<br />
through the mix of retained earnings, third-party borrowings and<br />
loans from parent and group financing companies that is most<br />
appropriate to the particular country and business c<strong>on</strong>cerned.<br />
<strong>Unilever</strong> maintains access to global debt markets through an<br />
infrastructure of short-term debt programmes (principally US<br />
domestic and euro commercial paper programmes) and l<strong>on</strong>g-term<br />
debt programmes (principally a US Shelf registrati<strong>on</strong> and<br />
euromarket Debt Issuance Programme). Debt in the internati<strong>on</strong>al<br />
markets is, in general, issued in the name of NV, PLC, <strong>Unilever</strong><br />
Finance Internati<strong>on</strong>al BV or <strong>Unilever</strong> Capital Corporati<strong>on</strong>. NV and<br />
PLC will normally guarantee such debt where they are not the<br />
issuer.<br />
Treasury<br />
<strong>Unilever</strong> Treasury’s role is to ensure that appropriate financing is<br />
available for all value-creating investments. Additi<strong>on</strong>ally, Treasury<br />
delivers financial services to allow operating companies to<br />
manage their financial transacti<strong>on</strong>s and exposures in an efficient,<br />
timely and low-cost manner.<br />
<strong>Unilever</strong> Treasury operates as a service centre and is governed by<br />
policies and plans approved by the Boards. In additi<strong>on</strong> to policies,<br />
guidelines and exposure limits, a system of authorities and<br />
extensive independent <str<strong>on</strong>g>report</str<strong>on</strong>g>ing covers all major areas of activity.<br />
Per<strong>form</strong>ance is m<strong>on</strong>itored closely. Reviews are undertaken by the<br />
corporate internal audit functi<strong>on</strong>.<br />
<strong>Unilever</strong> <str<strong>on</strong>g>Annual</str<strong>on</strong>g> Report <strong>on</strong> Form 20-F <strong>2006</strong> 31<br />
Report of the Directors (c<strong>on</strong>tinued)
Report of the Directors (c<strong>on</strong>tinued)<br />
Financial review (c<strong>on</strong>tinued)<br />
The key financial instruments used by <strong>Unilever</strong> are short- and<br />
l<strong>on</strong>g-term borrowings, cash and cash equivalents and certain<br />
straightforward derivative instruments, principally comprising<br />
interest rate swaps and foreign exchange c<strong>on</strong>tracts. The<br />
accounting for derivative instruments is discussed in note 1 <strong>on</strong><br />
page 74. The use of leveraged instruments is not permitted.<br />
Other relevant disclosures are given in notes 15, 16 and 17 <strong>on</strong><br />
pages 95, 96 and 99.<br />
<strong>Unilever</strong> Treasury manages a variety of market risks, including the<br />
effects of changes in foreign exchange rates, interest rates and<br />
liquidity. Further details of the management of these risks are<br />
given in note 17 <strong>on</strong> pages 100 and 101.<br />
Pensi<strong>on</strong>s investment strategy<br />
The Group’s investment strategy in respect of its funded<br />
pensi<strong>on</strong> plans is implemented within the framework of the<br />
various statutory requirements of the territories where the<br />
plans are based. The Group has developed policy guidelines for<br />
the allocati<strong>on</strong> of assets to different classes with the objective of<br />
c<strong>on</strong>trolling risk and maintaining the right balance between risk<br />
and l<strong>on</strong>g-term returns in order to limit the cost to the company<br />
of the benefits provided. To achieve this, investments are well<br />
diversified, such that the failure of any single investment would<br />
not have a material impact <strong>on</strong> the overall level of assets. The<br />
plans invest the largest proporti<strong>on</strong> of the assets in equities, which<br />
the Group believes offer the best returns over the l<strong>on</strong>g term<br />
commensurate with an acceptable level of risk. The pensi<strong>on</strong> funds<br />
32 <strong>Unilever</strong> <str<strong>on</strong>g>Annual</str<strong>on</strong>g> Report <strong>on</strong> Form 20-F <strong>2006</strong><br />
also have a proporti<strong>on</strong> of assets invested in property, b<strong>on</strong>ds and<br />
cash. The majority of the assets are managed by a number of<br />
external fund managers with a small proporti<strong>on</strong> managed inhouse.<br />
<strong>Unilever</strong> has a pooled investment vehicle (Univest) which<br />
it believes offers its pensi<strong>on</strong> plans around the world a simplified<br />
externally managed investment soluti<strong>on</strong> to implement their<br />
strategic asset allocati<strong>on</strong> models initially for equities. The aim is<br />
to provide a high quality, well diversified risk c<strong>on</strong>trolled soluti<strong>on</strong>.<br />
Significant changes after the balance sheet date<br />
On 1 January 2007, <strong>Unilever</strong> completed the restructuring of its<br />
Portuguese businesses. The result of the reorganisati<strong>on</strong> is that<br />
<strong>Unilever</strong> now has a 55% share of the c<strong>on</strong>solidated Portuguese<br />
entity, called <strong>Unilever</strong> Jerónimo Martins. The c<strong>on</strong>solidated business<br />
includes the foods and home and pers<strong>on</strong>al care businesses.<br />
The remaining 45% interest is held by Jerónimo Martins Group.<br />
The structure of the agreement is such that there is joint c<strong>on</strong>trol<br />
of the newly <strong>form</strong>ed entity and so it will be accounted for by<br />
<strong>Unilever</strong> as a joint venture.<br />
On 12 March 2007, <strong>Unilever</strong> announced the commencement of<br />
a share buy-back programme. This will involve the purchase in<br />
2007 of ordinary shares of NV or PLC, or a combinati<strong>on</strong> of the<br />
two, up to an aggregate market value of €1.5 billi<strong>on</strong>. The value<br />
of the shares purchased will be booked against equity under<br />
the heading of Other reserves, in line with established practice.<br />
As at 19 March 2007, 1 967 782 ordinary shares of NV had<br />
been purchased at prices between €19.55 and €21.41 per share.<br />
These shares will be held as treasury shares.
Corporate governance<br />
Introducti<strong>on</strong><br />
<strong>Unilever</strong> c<strong>on</strong>stantly keeps its corporate governance arrangements<br />
under review. NV and PLC are subject to various corporate<br />
governance requirements and best practice codes, the most<br />
relevant being those in the Netherlands, the United Kingdom<br />
and the United States. It is <strong>Unilever</strong>’s practice to comply, where<br />
practicable, with the highest level of these codes and resp<strong>on</strong>d<br />
to developments appropriately.<br />
The <strong>Unilever</strong> Group<br />
<strong>Unilever</strong> N.V. and <strong>Unilever</strong> PLC are the two parent companies<br />
of the <strong>Unilever</strong> Group. Together with the group companies, NV<br />
and PLC operate effectively as a single ec<strong>on</strong>omic entity. This is<br />
achieved by a series of agreements between NV and PLC (the<br />
Foundati<strong>on</strong> Agreements, see page 39), together with special<br />
provisi<strong>on</strong>s in the Articles of Associati<strong>on</strong> of NV and PLC. NV and<br />
PLC have the same Directors and adopt the same accounting<br />
principles. Shareholders of both companies receive dividends <strong>on</strong><br />
an equalised basis. NV and PLC and their group companies<br />
c<strong>on</strong>stitute a single <str<strong>on</strong>g>report</str<strong>on</strong>g>ing entity for the purposes of presenting<br />
c<strong>on</strong>solidated accounts. Accordingly, the accounts of the <strong>Unilever</strong><br />
Group are presented by both NV and PLC as their respective<br />
c<strong>on</strong>solidated accounts.<br />
NV and PLC have agreed to co-operate in all areas and ensure<br />
that all group companies act accordingly. NV and PLC are holding<br />
and service companies, and the business activity of <strong>Unilever</strong> is<br />
carried out by their subsidiaries around the world. Shares in group<br />
companies may ultimately be held wholly by either NV or PLC, or<br />
jointly by the two companies, in varying proporti<strong>on</strong>s.<br />
NV was incorporated under the name Naamlooze Vennootschap<br />
Margarine Unie in the Netherlands in 1927. Its objects and<br />
purposes are set out in Article 2 of its Articles of Associati<strong>on</strong>.<br />
PLC was incorporated under the name Lever Brothers Limited in<br />
England and Wales in 1894. Its objects and purposes can be<br />
found in Clause 3 of its Memorandum of Associati<strong>on</strong>. The two<br />
companies have different shareholder c<strong>on</strong>stituencies and<br />
shareholders cannot c<strong>on</strong>vert or exchange the shares of <strong>on</strong>e<br />
company for shares of the other. NV is listed in Amsterdam and<br />
New York. PLC is listed in L<strong>on</strong>d<strong>on</strong> and New York.<br />
<strong>Unilever</strong> policies<br />
The implementati<strong>on</strong> of and compliance with our governance<br />
structure is facilitated through a business orientated policy<br />
framework. <strong>Unilever</strong> policies are characterised by being universally<br />
applicable within the <strong>Unilever</strong> Group. They are mandatory in<br />
effect and have been developed to ensure c<strong>on</strong>sistency in key<br />
areas within our worldwide operati<strong>on</strong>s. They cover operati<strong>on</strong>al<br />
and functi<strong>on</strong>al matters, and govern how we run our business,<br />
in order to comply with applicable laws and regulati<strong>on</strong>s.<br />
<strong>Unilever</strong> policies include: the Code of Business Principles; the<br />
Code of Ethics for Senior Financial Officers, the Compliance<br />
Manual for the Listing Rules and Disclosure and Transparency<br />
Rules (including the <strong>Unilever</strong> Share Dealing Code), the Risk<br />
Management Policy, the Corporate Pensi<strong>on</strong>s Policy and the<br />
Accounting and Reporting Policy.<br />
The Code of Business Principles is <strong>Unilever</strong>’s statement of values<br />
and represents the standard of c<strong>on</strong>duct we require from all of our<br />
employees. Our Code of Ethics applies to the senior executive,<br />
financial and accounting officers and comprises the standards<br />
prescribed by the US Securities and Exchange Commissi<strong>on</strong> (SEC).<br />
The Code of Business Principles Hotline provides for a c<strong>on</strong>fidential<br />
hotline, not <strong>on</strong>ly to ensure that employees can an<strong>on</strong>ymously<br />
submit c<strong>on</strong>cerns regarding accounting and auditing issues but to<br />
handle all alleged violati<strong>on</strong>s of the Code of Business Principles.<br />
Copies of the Code of Business Principles, the Code of Ethics<br />
and the Share Dealing Code are posted <strong>on</strong> our website at<br />
www.unilever.com/investorcentre/corpgovernance.<br />
Our internal risk management and c<strong>on</strong>trol systems are described<br />
<strong>on</strong> page 9.<br />
Developments in corporate governance<br />
In recent years there have been significant developments in<br />
<strong>Unilever</strong>’s corporate governance structure.<br />
In 2004, the NV and PLC shareholders adopted proposals to<br />
create <strong>on</strong>e-tier boards with a majority of independent N<strong>on</strong>-<br />
Executive Directors.<br />
In 2005, shareholders approved a series of further changes to<br />
streamline management and leadership. A separate N<strong>on</strong>-Executive<br />
Chairman and Group Chief Executive were appointed. The Group<br />
Chief Executive established the <strong>Unilever</strong> Executive (UEx) which<br />
comprises three Regi<strong>on</strong>al Presidents (for Europe, The Americas<br />
and Asia Africa), two Category Presidents (for Foods and Home<br />
and Pers<strong>on</strong>al Care), the Chief Financial Officer and the Chief<br />
HR Officer.<br />
The regi<strong>on</strong>s are resp<strong>on</strong>sible for per<strong>form</strong>ance, implementing<br />
proven brand mixes and focusing <strong>on</strong> building capabilities with<br />
customers. The categories are resp<strong>on</strong>sible for the entire brand<br />
development process, including innovati<strong>on</strong>, brand positi<strong>on</strong>ing and<br />
communicati<strong>on</strong> and category strategies. The interdependence<br />
between the regi<strong>on</strong>s and categories allows us to exploit our<br />
global scale, while building <strong>on</strong> our deep roots in local markets.<br />
Our HR and Finance functi<strong>on</strong>s c<strong>on</strong>centrate <strong>on</strong> excellence in<br />
human capabilities and cost-efficiencies across the Group.<br />
In <strong>2006</strong>, following a thorough review of our corporate structure,<br />
shareholders approved proposals to:<br />
• adapt <strong>Unilever</strong>’s c<strong>on</strong>stituti<strong>on</strong>al arrangements to allow greater<br />
flexibility to allocate assets between both parent companies;<br />
• simplify the relati<strong>on</strong>ship between NV and PLC shares by<br />
establishing a <strong>on</strong>e-to-<strong>on</strong>e equivalence in their ec<strong>on</strong>omic interest<br />
in the <strong>Unilever</strong> Group (this was achieved by a split of the NV<br />
shares and a c<strong>on</strong>solidati<strong>on</strong> of the PLC shares); and<br />
• allow shareholders the right to nominate candidates to the<br />
Boards, taking into account the need to ensure the unity<br />
of management.<br />
<strong>Unilever</strong> <str<strong>on</strong>g>Annual</str<strong>on</strong>g> Report <strong>on</strong> Form 20-F <strong>2006</strong> 33<br />
Report of the Directors (c<strong>on</strong>tinued)
Report of the Directors (c<strong>on</strong>tinued)<br />
Corporate governance (c<strong>on</strong>tinued)<br />
In 2007, <strong>Unilever</strong> plans to appoint its first independent N<strong>on</strong>-<br />
Executive Chairman, Michael Treschow, subject to his<br />
appointment as a N<strong>on</strong>-Executive Director at the AGMs.<br />
The text that follows describes the corporate governance<br />
arrangements since the <strong>2006</strong> AGMs. More in<strong>form</strong>ati<strong>on</strong> <strong>on</strong><br />
our corporate governance arrangements is set out in<br />
‘The Governance of <strong>Unilever</strong>’, the Boards’ statement of<br />
their internal arrangements, which can be found at<br />
www.unilever.com/investorcentre/corpgovernance.<br />
The Boards<br />
The Boards of NV and PLC comprise the same Directors and have<br />
the same Chairman. This ensures unity of governance and<br />
management by ensuring that all matters are c<strong>on</strong>sidered by the<br />
Boards as a single intellect, reaching the same c<strong>on</strong>clusi<strong>on</strong>s <strong>on</strong> the<br />
same set of facts (save where specific local factors apply).<br />
The Boards are <strong>on</strong>e-tier boards, comprising Executive Directors<br />
and, in a majority, N<strong>on</strong>-Executive Directors. The Boards have<br />
ultimate resp<strong>on</strong>sibility for the management, general affairs,<br />
directi<strong>on</strong> and per<strong>form</strong>ance of the business as a whole. The<br />
resp<strong>on</strong>sibility of the Directors is collective, taking into account<br />
their respective roles as Executive Directors and N<strong>on</strong>-Executive<br />
Directors. The Executive Directors have additi<strong>on</strong>al resp<strong>on</strong>sibilities<br />
for the operati<strong>on</strong> of our business as determined by the Group<br />
Chief Executive.<br />
Our Directors have set out a number of areas of resp<strong>on</strong>sibility<br />
which are reserved to themselves and other areas for which<br />
matters are delegated to the Group Chief Executive and<br />
committees whose acti<strong>on</strong>s are regularly <str<strong>on</strong>g>report</str<strong>on</strong>g>ed to and<br />
m<strong>on</strong>itored by the Boards. These are described <strong>on</strong> pages 35 to 38.<br />
Further details of how our Boards effectively operate as <strong>on</strong>e<br />
board, govern themselves and delegate their authorities are set<br />
out in ‘The Governance of <strong>Unilever</strong>’, which can be found at<br />
www.unilever.com/investorcentre/corpgovernance.<br />
Appointment of Directors<br />
Directors are appointed by shareholders at the AGMs. All existing<br />
Directors unless they are retiring submit themselves for electi<strong>on</strong><br />
every year and shareholders can remove any of them by a simple<br />
majority vote.<br />
In order to seek to ensure that NV and PLC have the same<br />
Directors, the Articles of Associati<strong>on</strong> of NV and PLC c<strong>on</strong>tain<br />
provisi<strong>on</strong>s which are designed to ensure that both NV and PLC<br />
shareholders are presented with the same candidates for electi<strong>on</strong><br />
as Directors. This is achieved through a nominati<strong>on</strong> procedure<br />
operated by the Boards of NV and PLC through <strong>Unilever</strong>’s<br />
Nominati<strong>on</strong> Committee.<br />
The Nominati<strong>on</strong> Committee, based <strong>on</strong> the evaluati<strong>on</strong> of the Boards,<br />
its Committees and its individual members, recommends to the<br />
Boards a list of candidates for nominati<strong>on</strong> at both the <str<strong>on</strong>g>Annual</str<strong>on</strong>g><br />
General Meetings of NV and of PLC. In additi<strong>on</strong>, since <strong>2006</strong><br />
shareholders have been able to nominate Directors for this list but<br />
to do so they must put a resoluti<strong>on</strong> to both meetings in line with<br />
34 <strong>Unilever</strong> <str<strong>on</strong>g>Annual</str<strong>on</strong>g> Report <strong>on</strong> Form 20-F <strong>2006</strong><br />
local requirements for requisiti<strong>on</strong>ing a resoluti<strong>on</strong>. In order to<br />
ensure that the Boards remain identical, any<strong>on</strong>e being elected as a<br />
Director of NV must also be elected as a Director of PLC and vice<br />
versa. If an individual fails to be elected to both companies then<br />
he or she will be unable to take their place <strong>on</strong> the Boards.<br />
The provisi<strong>on</strong>s in the Articles of Associati<strong>on</strong> for appointing<br />
Directors cannot be changed without the permissi<strong>on</strong>, in the case<br />
of NV, of the holders of the special ordinary shares numbered<br />
1 - 2400 inclusive and, in the case of PLC, of the holders of<br />
PLC's deferred stock. The NV special ordinary shares may <strong>on</strong>ly be<br />
transferred to <strong>on</strong>e or more other holders of such shares. The<br />
joint holders of both the NV special ordinary shares and the<br />
PLC deferred stock are N.V. Elma and United Holdings Limited,<br />
which are joint subsidiaries of NV and PLC. The boards of N.V.<br />
Elma and United Holdings Limited comprise the members of the<br />
Nominati<strong>on</strong> Committee.<br />
Board meetings<br />
Our Boards meet at least seven times a year to c<strong>on</strong>sider important<br />
corporate events and acti<strong>on</strong>s, such as:<br />
• approval of corporate strategy;<br />
• approval of the corporate <str<strong>on</strong>g>Annual</str<strong>on</strong>g> Plan;<br />
• review of risks and c<strong>on</strong>trols;<br />
• authorisati<strong>on</strong> of major transacti<strong>on</strong>s;<br />
• review of the functi<strong>on</strong>ing of the Boards and their Committees;<br />
• preparati<strong>on</strong> of the <str<strong>on</strong>g>Annual</str<strong>on</strong>g> Report and Accounts;<br />
• declarati<strong>on</strong> of dividends;<br />
• agreement of quarterly results announcements;<br />
• c<strong>on</strong>vening of shareholders’ meetings;<br />
• nominati<strong>on</strong>s for Board appointments; and<br />
• approval of Board remunerati<strong>on</strong> policy.<br />
In <strong>2006</strong> the Boards of NV and PLC met eight times. All our<br />
Executive Directors attended all meetings. All the N<strong>on</strong>-Executive<br />
Directors attended all meetings, except for Wim Dik who missed<br />
<strong>on</strong>e meeting; Lynda Chalker, David Sim<strong>on</strong> and Jean-Cyril Spinetta<br />
who each missed two meetings, and Jeroen van der Veer who<br />
missed three meetings. Board meetings are normally held either<br />
in L<strong>on</strong>d<strong>on</strong> or Rotterdam. The Chairman is assisted by the Joint<br />
Secretaries, who ensure that the Boards are supplied with all the<br />
in<strong>form</strong>ati<strong>on</strong> necessary for their deliberati<strong>on</strong>s. The Chairman and<br />
the Joint Secretaries involve the Senior Independent Director (see<br />
page 36) in the arrangements for Board meetings.<br />
Board inducti<strong>on</strong> and training<br />
Up<strong>on</strong> electi<strong>on</strong>, Directors receive a comprehensive Directors’<br />
Manual and are briefed thoroughly <strong>on</strong> their resp<strong>on</strong>sibilities.<br />
Updates <strong>on</strong> corporate governance developments and investor<br />
relati<strong>on</strong>s matters are frequent items at Board meetings.<br />
On-going training is provided for Directors by way of site visits,<br />
presentati<strong>on</strong>s, circulated updates, teach-ins and agenda items<br />
at Board or Board committee meetings <strong>on</strong>, am<strong>on</strong>g other things,<br />
<strong>Unilever</strong>’s business, corporate governance, regulatory<br />
developments, and investor relati<strong>on</strong>s matters. In <strong>2006</strong>, a Board<br />
meeting was held at Port Sunlight which included a visit to <strong>on</strong>e<br />
of <strong>Unilever</strong>’s Research and Development facilities.
Corporate governance (c<strong>on</strong>tinued)<br />
Board evaluati<strong>on</strong><br />
In <strong>2006</strong>, an independent firm, Board C<strong>on</strong>sultants Internati<strong>on</strong>al<br />
(BCI), was commissi<strong>on</strong>ed to carry out an evaluati<strong>on</strong> of the Boards,<br />
the Board committees, the Chairman and individual Directors.<br />
As part of the evaluati<strong>on</strong>, Dr Florian Schilling from BCI c<strong>on</strong>ducted<br />
interviews with all Directors, the Joint Secretaries and two <strong>form</strong>er<br />
Directors who had retired in <strong>2006</strong>. He <str<strong>on</strong>g>report</str<strong>on</strong>g>ed the outcome of<br />
the evaluati<strong>on</strong> to the Chairman and the Senior Independent<br />
Director and to the Boards in February 2007.<br />
Board support<br />
The Joint Secretaries are available to advise all Directors and<br />
ensure that Board procedures are complied with. They are<br />
appointed and can be removed by the Boards.<br />
A procedure is in place to enable Directors, if they so wish, to<br />
seek independent professi<strong>on</strong>al advice at <strong>Unilever</strong>’s expense.<br />
Board changes<br />
The current Directors, with their biographies, are shown <strong>on</strong> page<br />
46. All the Executive Directors held office throughout the year.<br />
Le<strong>on</strong> Brittan, Lynda Chalker, Wim Dik, David Sim<strong>on</strong> and Jeroen<br />
van der Veer were re-elected as N<strong>on</strong>-Executive Directors of NV<br />
and PLC at the <strong>2006</strong> AGMs. In additi<strong>on</strong>, Charles Golden, Byr<strong>on</strong><br />
Grote, Jean-Cyril Spinetta and Kees Storm were appointed as<br />
N<strong>on</strong>-Executive Directors.<br />
In <strong>2006</strong>, David Sim<strong>on</strong> became our Senior Independent Director,<br />
Vice-Chairman of NV and PLC, and Chairman of our<br />
Remunerati<strong>on</strong> and Nominati<strong>on</strong> Committees. Kees Storm became<br />
a member and Chairman of the Audit Committee. Charles<br />
Golden and Byr<strong>on</strong> Grote became members of the Audit<br />
Committee. Jean-Cyril Spinetta became a member of the<br />
Remunerati<strong>on</strong> and Nominati<strong>on</strong> Committee.<br />
At the <strong>2006</strong> AGMs, Bertrand Collomb, Oscar Fanjul and Hilmar<br />
Kopper retired as N<strong>on</strong>-Executive Directors.<br />
At the 2007 AGMs all of the Executive Directors and the N<strong>on</strong>-<br />
Executive Directors, with the excepti<strong>on</strong> of Ant<strong>on</strong>y Burgmans,<br />
Lynda Chalker and Rudy Markham, who will be retiring at these<br />
meetings, will be nominated for re-electi<strong>on</strong>. Their colleagues<br />
would like to thank Ant<strong>on</strong>y, Lynda and Rudy for the enormous<br />
c<strong>on</strong>tributi<strong>on</strong> they have made to <strong>Unilever</strong> during their associati<strong>on</strong><br />
with the Group.<br />
In additi<strong>on</strong>, four new N<strong>on</strong>-Executive Directors will be proposed<br />
for electi<strong>on</strong> at the 2007 AGMs. These are Genevieve Berger,<br />
Narayana Murthy, Hix<strong>on</strong>ia Nyasulu and Michael Treschow.<br />
Genevieve Berger is a Professor of Biophysics and Medical Imaging<br />
at Paris University VI and Chairman of the Advisory Board ‘Health’<br />
for the EU Commissi<strong>on</strong> for Research. Narayana Murthy is cofounder<br />
and Chairman of Infosys Technologies Limited. Hix<strong>on</strong>ia<br />
Nyasulu is a N<strong>on</strong>-Executive Director of Sasol Limited and Anglo<br />
Platinum and an Advisory Board Member of JP Morgan South<br />
Africa. Michael Treschow, who, if appointed, will become<br />
<strong>Unilever</strong>’s new independent Chairman, is currently Chairman<br />
of Ericss<strong>on</strong> and Electrolux. He will be stepping down as Chairman<br />
of Electrolux in April 2007. Their appointments will, should their<br />
nominati<strong>on</strong>s be approved by shareholders, bring further diversity<br />
of background and experience to the Boards. Professor Berger,<br />
Mr Murthy and Ms Nyasulu will, subject to their electi<strong>on</strong> as<br />
Directors, become members of the Corporate Resp<strong>on</strong>sibility<br />
and Reputati<strong>on</strong> Committee.<br />
Biographical details for the new N<strong>on</strong>-Executive Directors are<br />
c<strong>on</strong>tained in the 2007 AGM Notices, and <strong>on</strong> our website at<br />
www.unilever.com/ourcompany/investorcentre.<br />
Chairman and Group Chief Executive<br />
<strong>Unilever</strong> has a separate N<strong>on</strong>-Executive Chairman and Group Chief<br />
Executive. There is a clear divisi<strong>on</strong> of resp<strong>on</strong>sibilities between their<br />
roles. The Chairman is primarily resp<strong>on</strong>sible for leadership of the<br />
Boards, ensuring their effectiveness and setting their agendas. He<br />
is also resp<strong>on</strong>sible for ensuring that the Boards receive accurate,<br />
timely and clear in<strong>form</strong>ati<strong>on</strong>.<br />
The Group Chief Executive has been entrusted, within the<br />
parameters set out in the Articles of Associati<strong>on</strong> of NV and PLC<br />
and ‘The Governance of <strong>Unilever</strong>’, with all the Boards’ powers,<br />
authorities and discreti<strong>on</strong>s in relati<strong>on</strong> to the operati<strong>on</strong>al<br />
management of <strong>Unilever</strong>. The Group Chief Executive has the<br />
authority to determine which duties regarding the operati<strong>on</strong>al<br />
management of the companies and their business enterprises will<br />
be carried out under his resp<strong>on</strong>sibility by <strong>on</strong>e or more Executive<br />
Directors or by <strong>on</strong>e or more other pers<strong>on</strong>s. This provides a basis<br />
for the <strong>Unilever</strong> Executive team (UEx) that <str<strong>on</strong>g>report</str<strong>on</strong>g>s to the Group<br />
Chief Executive. For UEx members’ biographies see page 47. For<br />
our business structure, please refer to ‘About <strong>Unilever</strong>’ <strong>on</strong> page 5.<br />
Executive Directors<br />
All four Executive Directors are members of the UEx: the Group<br />
Chief Executive, the Chief Financial Officer, the President, Europe<br />
and the President, Home and Pers<strong>on</strong>al Care. Details <strong>on</strong> their<br />
resp<strong>on</strong>sibilities can be found in ‘The Governance of <strong>Unilever</strong>’.<br />
The Executive Directors are full-time employees of <strong>Unilever</strong>.<br />
In<strong>form</strong>ati<strong>on</strong> about their remunerati<strong>on</strong> can be found in the <str<strong>on</strong>g>report</str<strong>on</strong>g><br />
of the Remunerati<strong>on</strong> Committee and <strong>on</strong> our website. We are<br />
currently updating our Directors’ service c<strong>on</strong>tract to take into<br />
account recent changes in the law and best practice, for example,<br />
those relating to age limits for directors.<br />
The Remunerati<strong>on</strong> Committee takes the view that the entitlement<br />
of the Executive Directors to the security of twelve m<strong>on</strong>ths’ notice<br />
of terminati<strong>on</strong> of employment is in line both with the practice of<br />
many comparable companies and the entitlement of other senior<br />
executives within <strong>Unilever</strong>. It is our policy to set the level of<br />
severance payments for Directors to no more than <strong>on</strong>e year’s<br />
salary, unless the Boards, at the proposal of the Remunerati<strong>on</strong><br />
Committee, find this manifestly unreas<strong>on</strong>able given circumstances<br />
or unless dictated by applicable law.<br />
The Executive Directors submit themselves for re-electi<strong>on</strong> at the<br />
AGMs each year. The Nominati<strong>on</strong> Committee carefully c<strong>on</strong>siders<br />
each nominati<strong>on</strong> for reappointment.<br />
<strong>Unilever</strong> <str<strong>on</strong>g>Annual</str<strong>on</strong>g> Report <strong>on</strong> Form 20-F <strong>2006</strong> 35<br />
Report of the Directors (c<strong>on</strong>tinued)
Report of the Directors (c<strong>on</strong>tinued)<br />
Corporate governance (c<strong>on</strong>tinued)<br />
The Directors stop holding executive office <strong>on</strong> ceasing to be<br />
Directors. Those appointed prior to 2004 retire at the latest by<br />
the age of 62. Appointees from 2004 <strong>on</strong>wards retire at an age<br />
between 60 and 65, as decided by either them or <strong>Unilever</strong>.<br />
We do not grant our Executive Directors any pers<strong>on</strong>al loans or<br />
guarantees.<br />
There are no family relati<strong>on</strong>ships between any of our Executive<br />
Directors, other key management pers<strong>on</strong>nel or N<strong>on</strong>-Executive<br />
Directors. N<strong>on</strong>e of our Executive Directors are elected or<br />
appointed under any arrangement or understanding. Executive<br />
Directors are to obtain approval from the Chairman for all outside<br />
Board appointments. Normally not more than <strong>on</strong>e such<br />
appointment should be accepted. For Executive Directors’<br />
biographies see page 46.<br />
N<strong>on</strong>-Executive Directors<br />
The N<strong>on</strong>-Executive Directors share resp<strong>on</strong>sibility for the executi<strong>on</strong><br />
of the Boards’ duties, taking into account their specific<br />
resp<strong>on</strong>sibilities, which are essentially supervisory. In particular,<br />
they comprise the principal external presence in the governance<br />
of <strong>Unilever</strong>, and provide a str<strong>on</strong>g independent element. See<br />
page 46 for their biographies.<br />
Role and Resp<strong>on</strong>sibility<br />
The key elements of the role and resp<strong>on</strong>sibilities of our N<strong>on</strong>-<br />
Executive Directors are:<br />
• supervisi<strong>on</strong> of and advice to the Group Chief Executive;<br />
• developing strategy with the Group Chief Executive;<br />
• scrutiny of per<strong>form</strong>ance;<br />
• c<strong>on</strong>trols;<br />
• <str<strong>on</strong>g>report</str<strong>on</strong>g>ing of per<strong>form</strong>ance;<br />
• remunerati<strong>on</strong> of and successi<strong>on</strong> planning for Executive<br />
Directors; and<br />
• governance and compliance.<br />
Our N<strong>on</strong>-Executive Directors are chosen for their broad and<br />
relevant experience and internati<strong>on</strong>al outlook, as well as<br />
their independence. They <strong>form</strong> the Audit Committee, the<br />
Nominati<strong>on</strong> Committee, the Remunerati<strong>on</strong> Committee and<br />
the Corporate Resp<strong>on</strong>sibility and Reputati<strong>on</strong> Committee<br />
(<strong>form</strong>erly External Affairs and Corporate Relati<strong>on</strong>s Committee).<br />
The roles and membership of these key Board committees are<br />
described <strong>on</strong> page 37. The profile set by the Boards for the<br />
N<strong>on</strong>-Executive Directors and the chart used for orderly<br />
successi<strong>on</strong> planning can be seen <strong>on</strong> our website at<br />
www.unilever.com/investorcentre/corpgovernance.<br />
Meetings<br />
The N<strong>on</strong>-Executive Directors meet as a group, without the<br />
Executive Directors present, under the chairmanship of the Senior<br />
Independent Director. In <strong>2006</strong> they met twice as a group. In<br />
additi<strong>on</strong>, the N<strong>on</strong>-Executive Directors usually meet before each<br />
Board meeting with the Chairman, the Group Chief Executive and<br />
the Joint Secretaries.<br />
36 <strong>Unilever</strong> <str<strong>on</strong>g>Annual</str<strong>on</strong>g> Report <strong>on</strong> Form 20-F <strong>2006</strong><br />
Senior Independent Director<br />
Our N<strong>on</strong>-Executive Directors have appointed David Sim<strong>on</strong> as<br />
Senior Independent Director. He acts as their spokesman. The<br />
Senior Independent Director is c<strong>on</strong>sulted by the Chairman <strong>on</strong><br />
the agenda and arrangements for Board meetings. He is also,<br />
in appropriate cases, a point of c<strong>on</strong>tact for shareholders and<br />
other stakeholders.<br />
Tenure<br />
Our N<strong>on</strong>-Executive Directors submit themselves for re-electi<strong>on</strong><br />
each year. Their nominati<strong>on</strong> for re-electi<strong>on</strong> is subject to c<strong>on</strong>tinued<br />
good per<strong>form</strong>ance which is evaluated by the Boards, based <strong>on</strong><br />
the recommendati<strong>on</strong>s of the Nominati<strong>on</strong> Committee. The<br />
Nominati<strong>on</strong> Committee carefully c<strong>on</strong>siders each nominati<strong>on</strong> for<br />
reappointment. The N<strong>on</strong>-Executive Directors normally serve for a<br />
maximum of nine years.<br />
Remunerati<strong>on</strong><br />
The remunerati<strong>on</strong> of the N<strong>on</strong>-Executive Directors is determined by<br />
the Boards, within the overall limit set by the shareholders at the<br />
AGMs in <strong>2006</strong>, and it is <str<strong>on</strong>g>report</str<strong>on</strong>g>ed <strong>on</strong> page 61. Details of the<br />
engagement of our N<strong>on</strong>-Executive Directors can be seen <strong>on</strong> the<br />
<strong>Unilever</strong> website.<br />
Independence<br />
Taking into account the role of N<strong>on</strong>-Executive Directors, which is<br />
essentially supervisory, and the fact that they make up the key<br />
committees of the Boards, it is important that our N<strong>on</strong>-Executive<br />
Directors can be c<strong>on</strong>sidered to be independent.<br />
Our definiti<strong>on</strong> of ‘independence’ for Directors is set out in<br />
‘The Governance of <strong>Unilever</strong>’. It is derived from the applicable<br />
definiti<strong>on</strong>s in use in the Netherlands, UK and US. Our current<br />
N<strong>on</strong>-Executive Directors are c<strong>on</strong>sidered to be independent of<br />
<strong>Unilever</strong>, with the excepti<strong>on</strong> of Ant<strong>on</strong>y Burgmans. Our Boards<br />
reached this c<strong>on</strong>clusi<strong>on</strong> after c<strong>on</strong>ducting a thorough review of all<br />
relevant relati<strong>on</strong>ships of the N<strong>on</strong>-Executive Directors, and their<br />
related or c<strong>on</strong>nected pers<strong>on</strong>s.<br />
A number of relati<strong>on</strong>ships, such as n<strong>on</strong>-executive directorships,<br />
exist between various of our N<strong>on</strong>-Executive Directors and<br />
companies that provide banking, insurance or financial advisory<br />
services to <strong>Unilever</strong>. Our Boards c<strong>on</strong>sidered in each case the<br />
number of other companies that also provide or could readily<br />
provide such services to <strong>Unilever</strong>, the significance to those<br />
companies of the services they provide to <strong>Unilever</strong>, the roles<br />
of the N<strong>on</strong>-Executive Directors within those companies and<br />
the significance of that role to our N<strong>on</strong>-Executive Directors.<br />
It c<strong>on</strong>cluded that n<strong>on</strong>e of these relati<strong>on</strong>ships threaten the<br />
independence of the N<strong>on</strong>-Executive Directors c<strong>on</strong>cerned. For<br />
example, the Boards have satisfied themselves that Le<strong>on</strong> Brittan’s<br />
positi<strong>on</strong> at UBS Investment Bank does not involve him in any way<br />
in its broking relati<strong>on</strong>ship with <strong>Unilever</strong>. They have noted that<br />
Lynda Chalker’s involvement in c<strong>on</strong>sultancy services for <strong>Unilever</strong><br />
had been terminated before she was elected a N<strong>on</strong>-Executive<br />
Director in May 2004. The Boards have <strong>form</strong>ed the view that the<br />
fact that Ant<strong>on</strong>y Burgmans was a member of the Supervisory<br />
Board of ABN AMRO until April <strong>2006</strong> and that David Sim<strong>on</strong> is a<br />
senior adviser of Morgan Stanley Internati<strong>on</strong>al, were not material.
Corporate governance (c<strong>on</strong>tinued)<br />
The Boards c<strong>on</strong>sider that the Executive Directorship of Byr<strong>on</strong><br />
Grote combined with the N<strong>on</strong>-Executive Directorship of Ant<strong>on</strong>y<br />
Burgmans of BP p.l.c. does not affect Dr Grote’s status as<br />
independent in relati<strong>on</strong> to his N<strong>on</strong>-Executive Directorship of<br />
<strong>Unilever</strong>. The Boards also c<strong>on</strong>sider that Jean-Cyril Spinetta’s<br />
positi<strong>on</strong> as Chairman/CEO of Air France-KLM SA combined with<br />
Kees Storm’s Chairmanship of the Supervisory Board of KLM Royal<br />
Dutch Airlines N.V. does not affect their status as independent in<br />
relati<strong>on</strong> to their N<strong>on</strong>-Executive Directorships of <strong>Unilever</strong>.<br />
Ant<strong>on</strong>y Burgmans, who before May 2005 was an Executive<br />
Director, is not c<strong>on</strong>sidered to be independent. The Nominati<strong>on</strong><br />
Committee and the Boards nominated him for electi<strong>on</strong> as a N<strong>on</strong>-<br />
Executive Director in 2005 because of his thorough knowledge of<br />
<strong>Unilever</strong> and its operati<strong>on</strong>s. Ant<strong>on</strong>y Burgmans will be succeeded<br />
by Michael Treschow as an independent Chairman at the AGMs in<br />
2007, subject to his electi<strong>on</strong> as a N<strong>on</strong>-Executive Director.<br />
N<strong>on</strong>e of our N<strong>on</strong>-Executive Directors are elected or appointed<br />
under any arrangement or understanding.<br />
Board committees<br />
The Boards have established the following committees, all<br />
<strong>form</strong>ally set up by Board resoluti<strong>on</strong> with carefully defined remits.<br />
They are made up solely of N<strong>on</strong>-Executive Directors with the<br />
excepti<strong>on</strong> of the Corporate Resp<strong>on</strong>sibility and Reputati<strong>on</strong><br />
Committee which has an Executive Director as a member, and<br />
<str<strong>on</strong>g>report</str<strong>on</strong>g> regularly to the Boards. The remits can be found <strong>on</strong><br />
our website.<br />
Audit Committee<br />
The Audit Committee is comprised <strong>on</strong>ly of independent N<strong>on</strong>-<br />
Executive Directors with a minimum requirement of three. It is<br />
chaired by Kees Storm, and its other members are Wim Dik,<br />
Charles Golden and Byr<strong>on</strong> Grote. The Committee met five times<br />
in <strong>2006</strong>, and the members attended all meetings. The Boards<br />
have satisfied themselves that all the current members of the<br />
Committee are competent in financial matters and have recent<br />
and relevant experience and that, for the purposes of the US<br />
Sarbanes-Oxley Act of 2002, Kees Storm is the Audit Committee’s<br />
financial expert. The Committee’s meetings are attended, by<br />
invitati<strong>on</strong>, by the Chief Financial Officer, the General Counsel,<br />
the Deputy Chief Financial Officer, the Chief Auditor and our<br />
external auditors.<br />
The Audit Committee assists the Boards in fulfilling their oversight<br />
resp<strong>on</strong>sibilities in respect of the integrity of <strong>Unilever</strong>’s financial<br />
statements; risk management and internal c<strong>on</strong>trol arrangements;<br />
compliance with legal and regulatory requirements; the<br />
per<strong>form</strong>ance, qualificati<strong>on</strong>s and independence of the external<br />
auditors; and the per<strong>form</strong>ance of the internal audit functi<strong>on</strong>. The<br />
Committee is directly resp<strong>on</strong>sible, subject to local laws regarding<br />
shareholder approval, for the nominati<strong>on</strong>, compensati<strong>on</strong> and<br />
oversight of the external auditors.<br />
The Audit Committee is fully compliant with the rules regarding<br />
audit committees that are applicable in the Netherlands, UK and<br />
US. The Committee’s resp<strong>on</strong>sibilities and powers are fully aligned<br />
with all requirements in the UK, US and the Netherlands.<br />
The Audit Committee is supplied with all in<strong>form</strong>ati<strong>on</strong> necessary<br />
for the per<strong>form</strong>ance of its duties by the Chief Auditor, Chief<br />
Financial Officer, and Deputy Chief Financial Officer. Both the<br />
Chief Auditor and the external auditors have direct access to the<br />
Audit Committee separately from management.<br />
See page 63 for the Report of the Audit Committee to the<br />
shareholders.<br />
Nominati<strong>on</strong> Committee<br />
Our Nominati<strong>on</strong> Committee comprises a minimum of three<br />
independent N<strong>on</strong>-Executive Directors. It is chaired by David Sim<strong>on</strong><br />
and its other members are Jean-Cyril Spinetta, Jeroen van der<br />
Veer and Ant<strong>on</strong>y Burgmans. It met six times in <strong>2006</strong> and the<br />
members attended all meetings except that David Sim<strong>on</strong> was<br />
absent for <strong>on</strong>e meeting. The Committee recommends to the<br />
Boards candidates for the positi<strong>on</strong>s of Director. It also has<br />
resp<strong>on</strong>sibilities for successi<strong>on</strong> planning and oversight of corporate<br />
governance matters. It is supplied with in<strong>form</strong>ati<strong>on</strong> by the<br />
Joint Secretaries.<br />
See page 48 for the Report of the Nominati<strong>on</strong> Committee<br />
to shareholders.<br />
Remunerati<strong>on</strong> Committee<br />
Our Remunerati<strong>on</strong> Committee comprises three independent N<strong>on</strong>-<br />
Executive Directors. It is chaired by David Sim<strong>on</strong> and its other<br />
members are Jean-Cyril Spinetta and Jeroen van der Veer. It met<br />
six times in <strong>2006</strong> and the members attended all meetings except<br />
that David Sim<strong>on</strong> was absent for <strong>on</strong>e meeting.<br />
The Committee reviews Directors’ remunerati<strong>on</strong> and is resp<strong>on</strong>sible<br />
for the executive share-based incentive plans. It determines,<br />
within the parameters set by our shareholders, specific<br />
remunerati<strong>on</strong> arrangements for each of the Executive Directors,<br />
the remunerati<strong>on</strong> scales and arrangements for N<strong>on</strong>-Executive<br />
Directors and the remunerati<strong>on</strong> of the tier of management<br />
directly below the Boards. The Committee is supplied with<br />
in<strong>form</strong>ati<strong>on</strong> by Jan van der Bijl, Joint Secretary of <strong>Unilever</strong>.<br />
The detailed <str<strong>on</strong>g>report</str<strong>on</strong>g> of the Remunerati<strong>on</strong> Committee to<br />
shareholders <strong>on</strong> Directors’ remunerati<strong>on</strong> is <strong>on</strong> pages 49 to 62.<br />
Corporate Resp<strong>on</strong>sibility and Reputati<strong>on</strong> Committee<br />
The Corporate Resp<strong>on</strong>sibility and Reputati<strong>on</strong> Committee currently<br />
comprises four N<strong>on</strong>-Executive Directors and <strong>on</strong>e Executive<br />
Director. It is chaired by Lynda Chalker and its other members<br />
are Le<strong>on</strong> Brittan, Ant<strong>on</strong>y Burgmans, Wim Dik and Ralph Kugler.<br />
Following the 2007 AGMs, subject to their electi<strong>on</strong>, Le<strong>on</strong> Brittan<br />
will chair the Committee and its members will be Genevieve<br />
Berger, Ralph Kugler, Narayana Murthy and Hix<strong>on</strong>ia Nyasulu.<br />
The Committee, which replaced the External Affairs and<br />
Corporate Relati<strong>on</strong>s Committee, has resp<strong>on</strong>sibility for the<br />
oversight of <strong>Unilever</strong>’s c<strong>on</strong>duct with regard to its corporate<br />
and societal obligati<strong>on</strong>s and its reputati<strong>on</strong> as a resp<strong>on</strong>sible<br />
corporate citizen.<br />
See page 64 for the Report of the Corporate Resp<strong>on</strong>sibility and<br />
Reputati<strong>on</strong> Committee to shareholders.<br />
<strong>Unilever</strong> <str<strong>on</strong>g>Annual</str<strong>on</strong>g> Report <strong>on</strong> Form 20-F <strong>2006</strong> 37<br />
Report of the Directors (c<strong>on</strong>tinued)
Report of the Directors (c<strong>on</strong>tinued)<br />
Corporate governance (c<strong>on</strong>tinued)<br />
Routine business committees<br />
Committees are also set up to c<strong>on</strong>duct routine business as and<br />
when they are necessary. They comprise any two of the Directors<br />
and certain senior executives and officers. They administer or<br />
implement certain matters previously agreed by our Boards or the<br />
Group Chief Executive. The Joint Secretaries are resp<strong>on</strong>sible for<br />
the operati<strong>on</strong> of these committees.<br />
Disclosures Committee<br />
The Boards have set up a Disclosures Committee which is<br />
resp<strong>on</strong>sible for helping the Boards ensure that financial and<br />
other in<strong>form</strong>ati<strong>on</strong> that ought to be disclosed publicly is disclosed<br />
in a timely manner and that the in<strong>form</strong>ati<strong>on</strong> that is disclosed<br />
is complete and accurate. The Committee comprises the<br />
Deputy Chief Financial Officer, the Joint Secretaries and the<br />
Group Treasurer.<br />
Directors – Various <strong>form</strong>al matters<br />
The borrowing powers of NV Directors <strong>on</strong> behalf of NV are not<br />
limited by the Articles of Associati<strong>on</strong> of NV. PLC Directors have<br />
the power to borrow <strong>on</strong> behalf of PLC up to three times the<br />
adjusted capital and reserves of PLC, as defined in its Articles of<br />
Associati<strong>on</strong>, without the approval of shareholders (any excepti<strong>on</strong>s<br />
requiring an ordinary resoluti<strong>on</strong>).<br />
The Articles of Associati<strong>on</strong> of NV and PLC do not require Directors<br />
of NV or Directors of PLC to hold shares in NV or PLC. However,<br />
the remunerati<strong>on</strong> arrangements applicable to our Executive<br />
Directors require our Executive Directors to build and retain a<br />
pers<strong>on</strong>al shareholding in <strong>Unilever</strong> equal to at least 150% of their<br />
annual base pay.<br />
Directors – Indemnificati<strong>on</strong><br />
Directors’ indemnificati<strong>on</strong>, including the terms thereof, is provided<br />
for in Article 19 of NV’s Articles of Associati<strong>on</strong>. The power to<br />
indemnify directors is provided for in PLC’s Articles of Associati<strong>on</strong>.<br />
Deeds of indemnity have been issued to all PLC Directors.<br />
Appropriate Directors’ and Officers’ liability insurance is in place<br />
for all <strong>Unilever</strong> Directors.<br />
Directors – C<strong>on</strong>flicts of interest<br />
We attach special importance to avoiding c<strong>on</strong>flicts of interest<br />
between <strong>on</strong> the <strong>on</strong>e hand NV and PLC and <strong>on</strong> the other hand<br />
their Directors. The Boards are resp<strong>on</strong>sible for ensuring that there<br />
are rules in place to avoid c<strong>on</strong>flicts of interest by Board members.<br />
Shareholder matters<br />
Relati<strong>on</strong>s with shareholders and other investors<br />
We believe it is important both to explain our business<br />
developments and financial results to investors and to understand<br />
their objectives.<br />
The Chief Financial Officer has lead resp<strong>on</strong>sibility for investor<br />
relati<strong>on</strong>s, with the active involvement of the Group Chief<br />
Executive. They are supported by our Investor Relati<strong>on</strong>s<br />
department which organises presentati<strong>on</strong>s for analysts and<br />
investors. Such presentati<strong>on</strong>s are generally made available <strong>on</strong> our<br />
website. Briefings <strong>on</strong> quarterly results are given via telec<strong>on</strong>ference<br />
and are accessible by teleph<strong>on</strong>e or via our website. For further<br />
in<strong>form</strong>ati<strong>on</strong> visit our website at www.unilever.com/investorcentre.<br />
38 <strong>Unilever</strong> <str<strong>on</strong>g>Annual</str<strong>on</strong>g> Report <strong>on</strong> Form 20-F <strong>2006</strong><br />
The Boards are regularly briefed <strong>on</strong> reacti<strong>on</strong>s to the quarterly<br />
results announcements. They, or the relevant Board Committee,<br />
are briefed <strong>on</strong> any issues raised by shareholders that are relevant<br />
to their resp<strong>on</strong>sibilities.<br />
Our shareholders can, and do, raise issues directly with the<br />
relevant Executive Director or the Chairman and, if appropriate,<br />
a relevant N<strong>on</strong>-Executive Director or the Senior Independent<br />
Director.<br />
Both NV and PLC communicate with their respective shareholders<br />
through the AGMs as well as resp<strong>on</strong>ding to their questi<strong>on</strong>s and<br />
enquiries during the course of the year. We take the views of our<br />
shareholders into account and, in accordance with all applicable<br />
legislati<strong>on</strong> and regulati<strong>on</strong>s, may c<strong>on</strong>sult them in an appropriate<br />
way before putting major new proposals to our AGMs.<br />
General Meetings of shareholders<br />
The business to be c<strong>on</strong>ducted at the AGMs of NV and PLC is set<br />
out in the separate Notices of AGM for NV and PLC. It includes<br />
appointment of Directors, declarati<strong>on</strong>/approval of final dividend,<br />
appointment of external auditors, approval of changes to the<br />
Articles of Associati<strong>on</strong>, and authorisati<strong>on</strong> for the Boards to<br />
allot and repurchase shares, and to restrict pre-emptive rights<br />
of shareholders.<br />
At the AGMs, a full account is given of the progress of the<br />
business over the last year and there is a review of current issues.<br />
Shareholders are encouraged to attend the meetings and ask<br />
questi<strong>on</strong>s, and the questi<strong>on</strong>-and-answer sessi<strong>on</strong>s <strong>form</strong> an<br />
important part of the meetings.<br />
General Meetings of shareholders of NV and PLC are held at<br />
times and places decided by our Boards. NV meetings are held in<br />
Rotterdam and PLC meetings are held in L<strong>on</strong>d<strong>on</strong> <strong>on</strong> c<strong>on</strong>secutive<br />
days. The notices calling the meeting normally go out more than<br />
thirty days prior to the meetings and include further in<strong>form</strong>ati<strong>on</strong><br />
<strong>on</strong> how to gain access to the AGMs and how to vote by proxy.<br />
We welcome our external auditors to the AGMs and they are<br />
entitled to address the meetings.<br />
We are committed to efforts to establish more effective ways<br />
of communicati<strong>on</strong> with our shareholders around the AGMs.<br />
Electr<strong>on</strong>ic communicati<strong>on</strong> is becoming an important medium for<br />
shareholders, providing ready access to shareholder in<strong>form</strong>ati<strong>on</strong><br />
and <str<strong>on</strong>g>report</str<strong>on</strong>g>s, and for voting purposes.<br />
NV was <strong>on</strong>e of the founders of the Dutch Shareholders’<br />
Communicati<strong>on</strong> Channel. NV shareholders participating in the<br />
Dutch Shareholders’ Communicati<strong>on</strong> Channel are able to appoint<br />
electr<strong>on</strong>ically a proxy to vote <strong>on</strong> their behalf at the NV AGM and<br />
NV shareholders who wish to participate should c<strong>on</strong>tact their<br />
bank or broker. Shareholders of PLC in the United Kingdom can<br />
choose to receive electr<strong>on</strong>ic notificati<strong>on</strong> that the <str<strong>on</strong>g>Annual</str<strong>on</strong>g> Review,<br />
<str<strong>on</strong>g>Annual</str<strong>on</strong>g> Report and Accounts and Notice of AGMs have been<br />
published <strong>on</strong> our website, instead of receiving printed copies,<br />
and can also electr<strong>on</strong>ically appoint a proxy to vote <strong>on</strong> their behalf<br />
at the AGM. Registrati<strong>on</strong> for electr<strong>on</strong>ic communicati<strong>on</strong> by<br />
shareholders of PLC can be made at<br />
www.unilever.com/shareholderservices.
Corporate governance (c<strong>on</strong>tinued)<br />
Voting rights<br />
To be entitled to attend and vote at NV General Meetings<br />
shareholders must hold their NV shares <strong>on</strong> the record date, which<br />
is set by the Directors and is not more than thirty days before the<br />
meeting. Shareholders do not need to block their shares. NV<br />
shareholders can cast <strong>on</strong>e vote for each €0.16 nominal capital<br />
that they hold. This means that they can cast <strong>on</strong>e vote for each<br />
NV ordinary share, or NV New York Registry Share. Shareholders<br />
can vote in pers<strong>on</strong> or by proxy. Similar arrangements apply to<br />
holders of depositary receipts issued for NV shares and the<br />
holders of NV preference shares (see pages 41 and 42).<br />
PLC shareholders can cast <strong>on</strong>e vote for each 1.4p nominal capital<br />
that they hold. This means that <strong>on</strong>e vote equals 9/20ths of a<br />
share. Shareholders can vote in pers<strong>on</strong> at the meeting or by proxy.<br />
Proxies should be submitted to the Registrars, Computershare<br />
Investor Services PLC, whose details can be found <strong>on</strong> page 159,<br />
at least 48 hours before the AGM. Shareholders at the PLC 2007<br />
AGM are, however, being asked to approve a change in the<br />
voting rights of PLC’s ordinary shares designed to bring the<br />
voting arrangements into line with the c<strong>on</strong>solidati<strong>on</strong> of ordinary<br />
shares of 3 1⁄ 9p approved at the <strong>2006</strong> AGM. This will result in<br />
<strong>on</strong>e vote for each 3 1 ⁄ 9p of nominal capital instead of 1.4p of<br />
nominal capital.<br />
More in<strong>form</strong>ati<strong>on</strong> <strong>on</strong> the exercise of voting rights can be found<br />
in NV’s and PLC’s Articles of Associati<strong>on</strong> and in the respective<br />
Notices of Meetings.<br />
Holders of NV New York Registry Shares or PLC American<br />
Depositary Receipts of shares will receive a proxy <strong>form</strong> enabling<br />
them to authorise and instruct ABN AMRO N.V. or Citibank, N.A.<br />
respectively to vote <strong>on</strong> their behalf at the shareholders’ meeting<br />
of NV or PLC. N.V. Elma and United Holdings Limited (the holders<br />
of NV’s special shares), other group companies of NV which hold<br />
ordinary or preference shares, and United Holdings Limited, which<br />
owns half of PLC’s deferred stock, are not permitted to vote at<br />
General Meetings.<br />
Voting <strong>on</strong> each of the resoluti<strong>on</strong>s c<strong>on</strong>tained in the Notice of<br />
AGMs is c<strong>on</strong>ducted by poll. The final vote is published at the<br />
meetings and the outcome of the votes, including the proxy<br />
votes, is put <strong>on</strong> <strong>Unilever</strong>’s website. For each resoluti<strong>on</strong>, proxy<br />
appointment <strong>form</strong>s in <strong>2006</strong> provided PLC shareholders with<br />
the opti<strong>on</strong> to direct their proxy to vote either for or against the<br />
resoluti<strong>on</strong> or to abstain. In 2007, proxy appointment <strong>form</strong>s will<br />
replace the abstain opti<strong>on</strong> with a vote withhold opti<strong>on</strong>. Future<br />
PLC proxy <strong>form</strong>s and voting result announcements will make it<br />
clear that a vote withheld is not a vote in law, and will not be<br />
counted in the calculati<strong>on</strong> of the proporti<strong>on</strong> of votes for and<br />
against the resoluti<strong>on</strong> voted <strong>on</strong>.<br />
Shareholder proposed resoluti<strong>on</strong>s<br />
Shareholders of NV may propose resoluti<strong>on</strong>s if they individually or<br />
together hold 1% of NV’s issued capital in the <strong>form</strong> of shares or<br />
depositary receipts for shares, or if they individually or together<br />
hold shares or depositary receipts worth at least €50 milli<strong>on</strong>. They<br />
must submit these requests at least 60 days before the date of<br />
the General Meeting, and the request will be h<strong>on</strong>oured unless, in<br />
the opini<strong>on</strong> of the Boards, it is against a substantive interest of<br />
the Company. Shareholders who together represent at least 10%<br />
of the issued capital of NV can also requisiti<strong>on</strong> Extraordinary<br />
General Meetings to deal with specific resoluti<strong>on</strong>s.<br />
Shareholders who together hold shares representing at least 5%<br />
of the total voting rights of PLC, or 100 shareholders who hold<br />
<strong>on</strong> average £100 each in nominal value of PLC capital, can<br />
require PLC to propose a resoluti<strong>on</strong> at a General Meeting.<br />
PLC shareholders holding in aggregate <strong>on</strong>e-tenth of the issued<br />
ordinary shares of PLC are able to c<strong>on</strong>vene a general meeting<br />
of PLC.<br />
Required majorities<br />
Resoluti<strong>on</strong>s are usually adopted at NV and PLC shareholder<br />
meetings by an absolute majority of votes cast, unless there are<br />
other requirements under the applicable laws or NV’s or PLC’s<br />
Articles of Associati<strong>on</strong>. For example, there are special<br />
requirements for resoluti<strong>on</strong>s relating to the alterati<strong>on</strong> of the<br />
Articles of Associati<strong>on</strong>, the liquidati<strong>on</strong> of NV or PLC and the<br />
alterati<strong>on</strong> of the Equalisati<strong>on</strong> Agreement (see below).<br />
A proposal to alter the Articles of Associati<strong>on</strong> of NV can <strong>on</strong>ly<br />
be made by the Board of Directors. Such a proposal requires the<br />
prior approval of the meeting of the holders of the special shares.<br />
A proposal to alter the Memorandum and Articles of Associati<strong>on</strong><br />
of PLC can be made either by the Board of Directors or by<br />
shareholders in the manner permitted under the United Kingdom<br />
Companies Act 1985. Proposals to alter the provisi<strong>on</strong>s in the<br />
Articles of Associati<strong>on</strong> of NV and PLC relating to the unity of<br />
management require the prior approval of meetings of the<br />
holders of the NV special shares and the PLC deferred stock.<br />
Copies of the Articles of Associati<strong>on</strong> of NV and the Memorandum<br />
and Articles of Associati<strong>on</strong> of PLC can be found <strong>on</strong> our website.<br />
Right to hold shares<br />
<strong>Unilever</strong> places no limitati<strong>on</strong>s <strong>on</strong> the right to hold NV and PLC<br />
shares.<br />
Foundati<strong>on</strong> Agreements<br />
Equalisati<strong>on</strong> Agreement<br />
The Equalisati<strong>on</strong> Agreement makes the positi<strong>on</strong> of the<br />
shareholders of NV and PLC, as far as possible, the same as if they<br />
held shares in a single company. The Agreement regulates the<br />
mutual rights of the shareholders of NV and PLC. Under the<br />
Equalisati<strong>on</strong> Agreement, NV and PLC must adopt the same<br />
financial periods and accounting policies. Dividends are paid in<br />
accordance with a <strong>form</strong>ula relating to the nominal values of NV’s<br />
and PLC’s issued share capital.<br />
Since the AGMs in <strong>2006</strong>, each NV Ordinary share represents the<br />
same underlying ec<strong>on</strong>omic interest in the <strong>Unilever</strong> Group as each<br />
PLC Ordinary share.<br />
We pay ordinary dividends for NV and PLC <strong>on</strong> the same day.<br />
NV and PLC allocate funds for the dividend from their parts of<br />
our current profits and free reserves. We pay the same amount<br />
<strong>on</strong> each NV share as <strong>on</strong> <strong>on</strong>e PLC share calculated at the relevant<br />
exchange rate. For interim dividends this exchange rate is the<br />
average rate for the quarter before we declare the dividend. For<br />
final dividends it is the average rate for the year. In arriving at the<br />
equalised amount we include any tax payable by the Company in<br />
respect of the dividend, but calculate it before any tax deductible<br />
by the Company from the dividend.<br />
The Equalisati<strong>on</strong> Agreement provides that if <strong>on</strong>e company had<br />
losses, or was unable to pay its preference dividends, the loss or<br />
shortfall would be made up out of:<br />
<strong>Unilever</strong> <str<strong>on</strong>g>Annual</str<strong>on</strong>g> Report <strong>on</strong> Form 20-F <strong>2006</strong> 39<br />
Report of the Directors (c<strong>on</strong>tinued)
Report of the Directors (c<strong>on</strong>tinued)<br />
Corporate governance (c<strong>on</strong>tinued)<br />
• the current profits of the other company (after it has paid its<br />
own preference shareholders);<br />
• then its own free reserves; and<br />
• then the free reserves of the other company.<br />
If either company could not pay its ordinary dividends, we would<br />
follow the same procedure, except that the current profits of the<br />
other company would <strong>on</strong>ly be used after it had paid its own<br />
ordinary shareholders and if the Directors thought this more<br />
appropriate than, for example, using its own free reserves.<br />
So far, NV and PLC have always been able to pay their own<br />
dividends, so we have never had to follow this procedure. If we<br />
did, the payment from <strong>on</strong>e company to the other would be<br />
subject to any United Kingdom and Dutch tax and exchange<br />
c<strong>on</strong>trol laws applicable at that time.<br />
Under the Equalisati<strong>on</strong> Agreement, the two companies are<br />
permitted to pay different dividends in the following excepti<strong>on</strong>al<br />
circumstances:<br />
• If the average annual sterling/euro exchange rate changed<br />
so substantially from <strong>on</strong>e year to the next that to pay equal<br />
dividends at the current exchange rates, either NV or PLC<br />
would have to pay a dividend that was unreas<strong>on</strong>able (that is to<br />
say, substantially larger or smaller in its own currency than the<br />
dividend it paid in the previous year); or<br />
• The governments of the Netherlands or the United Kingdom<br />
could in some circumstances place restricti<strong>on</strong>s <strong>on</strong> the<br />
proporti<strong>on</strong> of a company’s profits which can be paid out as<br />
dividends. This could mean that in order to pay equal dividends<br />
<strong>on</strong>e company would have to pay out an amount which would<br />
breach the limitati<strong>on</strong>s in place at the time, or that the other<br />
company would have to pay a smaller dividend.<br />
In either of these rare cases, NV and PLC could pay different<br />
amounts of dividend if the Boards thought it appropriate. The<br />
company paying less than the equalised dividend would put the<br />
difference between the dividends into a reserve: an equalisati<strong>on</strong><br />
reserve in the case of exchange rate fluctuati<strong>on</strong>s, or a dividend<br />
reserve in the case of a government restricti<strong>on</strong>. The reserves<br />
would be paid out to its shareholders when it became possible or<br />
reas<strong>on</strong>able to do so, which would ensure that the shareholders of<br />
both companies would ultimately be treated the same.<br />
If both companies were to go into liquidati<strong>on</strong>, NV and PLC would<br />
each use any funds available for shareholders to pay the prior<br />
claims of their own preference shareholders. Then they would<br />
use any surplus to pay each other’s preference shareholders, if<br />
necessary. After these claims had been met, they would pay out<br />
any equalisati<strong>on</strong> or dividend reserve to their own shareholders<br />
before pooling the remaining surplus. This would be distributed<br />
to the ordinary shareholders of both companies <strong>on</strong> an equal basis.<br />
If <strong>on</strong>e company were to go into liquidati<strong>on</strong>, we would apply the<br />
same principles as if both had g<strong>on</strong>e into liquidati<strong>on</strong><br />
simultaneously.<br />
In principle, issues of b<strong>on</strong>us shares and rights offerings can <strong>on</strong>ly<br />
be made in ordinary shares. Again we would ensure that<br />
shareholders of NV and PLC received shares in equal proporti<strong>on</strong>s.<br />
The subscripti<strong>on</strong> price for <strong>on</strong>e new NV share would have to be<br />
the same, at the prevailing exchange rate, as the price for <strong>on</strong>e<br />
40 <strong>Unilever</strong> <str<strong>on</strong>g>Annual</str<strong>on</strong>g> Report <strong>on</strong> Form 20-F <strong>2006</strong><br />
new PLC share. Neither company can issue or reduce capital<br />
without the c<strong>on</strong>sent of the other.<br />
The Articles of Associati<strong>on</strong> of NV establish that any payment<br />
under the Equalisati<strong>on</strong> Agreement will be credited or debited to<br />
the income statement for the financial year in questi<strong>on</strong>.<br />
Under Article 2 of the Articles of Associati<strong>on</strong> of NV and Clause 3<br />
of the Memorandum of Associati<strong>on</strong> of PLC, each company is<br />
required to carry out the Equalisati<strong>on</strong> Agreement with the other.<br />
Both documents state that the Agreement cannot be changed or<br />
terminated without the approval of shareholders. For NV, the<br />
General Meeting can decide to alter or terminate the Equalisati<strong>on</strong><br />
Agreement at the proposal of the Board. The necessary approval<br />
of the General Meeting is then that at least <strong>on</strong>e half of the total<br />
issued ordinary capital must be represented at an ordinary<br />
shareholders’ meeting, where the majority must vote in favour;<br />
and (if they would be disadvantaged or the agreement is to be<br />
terminated), at least two-thirds of the total issued preference<br />
share capital must be represented at a preference shareholders’<br />
meeting, where at least three-quarters of them must vote in<br />
favour. For PLC, the necessary approval must be given by the<br />
holders of a majority of all issued shares voting at a General<br />
Meeting and the holders of the ordinary shares, either by<br />
three-quarters in writing, or by three-quarters voting at a<br />
General Meeting where the majority of the ordinary shares in<br />
issue are represented.<br />
In additi<strong>on</strong>, Article 3 of the PLC Articles of Associati<strong>on</strong> states that<br />
PLC’s Board must carry out the Equalisati<strong>on</strong> Agreement and that<br />
the other provisi<strong>on</strong>s of the Articles of Associati<strong>on</strong> are subject to it.<br />
We are advised by counsel that these provisi<strong>on</strong>s oblige our Boards<br />
to carry out the Equalisati<strong>on</strong> Agreement, unless it is amended or<br />
terminated with the required approval of the shareholders of<br />
both companies. If the Boards fail to enforce the Agreement,<br />
shareholders can compel them to do so under Dutch and United<br />
Kingdom law.<br />
A copy of the Equalisati<strong>on</strong> Agreement can be found <strong>on</strong> our<br />
website at www.unilever.com/investorcentre/corpgovernance.<br />
The Deed of Mutual Covenants<br />
The Deed of Mutual Covenants provides that NV and PLC and<br />
their respective subsidiary companies shall co-operate in every<br />
way for the purpose of maintaining a comm<strong>on</strong> operating policy.<br />
In additi<strong>on</strong>, they shall exchange all relevant in<strong>form</strong>ati<strong>on</strong> about<br />
their respective businesses – the intenti<strong>on</strong> being to create and<br />
maintain a comm<strong>on</strong> operating plat<strong>form</strong> for the <strong>Unilever</strong> Group<br />
throughout the world. The Deed of Mutual Covenants illustrates<br />
some of the in<strong>form</strong>ati<strong>on</strong> which makes up this comm<strong>on</strong> plat<strong>form</strong>,<br />
such as the mutual exchange and free use of know-how, patents,<br />
trade marks and all other commercially valuable in<strong>form</strong>ati<strong>on</strong>.<br />
The Deed c<strong>on</strong>tains provisi<strong>on</strong>s which allow the Directors of NV and<br />
PLC to take any acti<strong>on</strong>s to ensure that the dividend-generating<br />
capacity of each of NV and PLC is aligned with the ec<strong>on</strong>omic<br />
interests of their respective shareholders. These provisi<strong>on</strong>s also<br />
allow assets to be transferred between NV and PLC and their<br />
associated companies (as defined in the Deed of Mutual<br />
Covenants) to ensure that assets are allocated in the most<br />
efficient manner. These arrangements are designed to create<br />
a balance between the two parent companies and the funds<br />
generated by them, for the benefit of their respective sets<br />
of shareholders.
Corporate governance (c<strong>on</strong>tinued)<br />
The Agreement for Mutual Guarantees of Borrowing<br />
Under the Agreement for Mutual Guarantees of Borrowing<br />
between NV and PLC, each company will, if asked by the other,<br />
guarantee the borrowings of the other. The two companies<br />
can also agree jointly to guarantee the borrowings of their<br />
subsidiaries. These arrangements are used, as a matter of financial<br />
policy, for certain significant public borrowings. They enable<br />
lenders to rely <strong>on</strong> our combined financial strength.<br />
Combined earnings per share<br />
We calculate earnings per share <strong>on</strong> a combined basis. The<br />
calculati<strong>on</strong> is based <strong>on</strong> the average amount of NV’s and PLC’s<br />
ordinary share capital in issue during the year.<br />
In our combined earnings per share calculati<strong>on</strong>, we assume that<br />
both companies will be able to pay their dividends out of their<br />
part of our profits. This has always been the case in the past,<br />
but if we did have to make a payment from <strong>on</strong>e to the other<br />
it could result in additi<strong>on</strong>al taxes, and reduce our combined<br />
earnings per share.<br />
Further in<strong>form</strong>ati<strong>on</strong> about the calculati<strong>on</strong> of earnings per share,<br />
including the calculati<strong>on</strong> <strong>on</strong> a diluted basis, can be found in note<br />
7 <strong>on</strong> page 87.<br />
Share capital<br />
NV’s issued share capital <strong>on</strong> 31 December <strong>2006</strong> was made up of:<br />
• €274 356 432 split into 1 714 727 700 ordinary shares of<br />
€0.16 each;<br />
• €1 028 568 split into 2 400 ordinary shares numbered 1 to<br />
2 400, known as special shares; and<br />
• €113 599 014 split into several classes (4%, 6% and 7%)<br />
cumulative preference shares (‘financing preference shares’).<br />
The total number of voting rights attached to NV's outstanding<br />
shares is shown hereunder:<br />
Total number of votes % of issued capital<br />
1 714 727 700 ordinary shares 1 714 727 700 70.53<br />
2 400 special shares 6 428 550 0.26<br />
750 000 4% cumulative<br />
preference shares 200 906 250 8.26<br />
161 060 6% cumulative<br />
preference shares 431 409 276 17.75<br />
29 000 7% cumulative<br />
preference shares 77 678 312 3.20<br />
NV may issue shares not yet issued and grant rights to subscribe<br />
for shares <strong>on</strong>ly pursuant to a resoluti<strong>on</strong> of the General Meeting<br />
of Shareholders or of another corporate body designated for such<br />
purpose by a resoluti<strong>on</strong> of the General Meeting. At the <str<strong>on</strong>g>Annual</str<strong>on</strong>g><br />
General Meeting held <strong>on</strong> 8 May <strong>2006</strong> the Board of Directors was<br />
designated, in accordance with Articles 96 and 96a of Book 2 of<br />
the Netherlands Civil Code, as the corporate body which is<br />
authorised until 8 November 2007 to resolve <strong>on</strong> the issue of – or<br />
<strong>on</strong> the granting of rights to subscribe for – shares not yet issued<br />
and to restrict or exclude the statutory pre-empti<strong>on</strong> rights<br />
that accrue to shareholders up<strong>on</strong> issue of shares, <strong>on</strong> the<br />
understanding that this authority is limited to 10% of the issued<br />
share capital of the Company, plus an additi<strong>on</strong>al 10% of the<br />
issued share capital of the Company in c<strong>on</strong>necti<strong>on</strong> with or <strong>on</strong> the<br />
occasi<strong>on</strong> of mergers and acquisiti<strong>on</strong>s.<br />
At the <strong>2006</strong> AGM the Board of Directors of NV was authorised,<br />
in accordance with Article 98 of Book 2 of the Netherlands Civil<br />
Code, until 8 November 2007 to cause the Company to buy in its<br />
own shares and depositary receipts therefor, within the limits set<br />
by law (10% of the issued share capital), either through purchase<br />
<strong>on</strong> a stock exchange or otherwise, at a price, excluding expenses,<br />
not lower than the nominal value of the shares and not higher<br />
than 10% above the average of the closing price of the shares <strong>on</strong><br />
Eurolist by Eur<strong>on</strong>ext Amsterdam for the five business days before<br />
the day <strong>on</strong> which the purchase is made.<br />
PLC’s issued share capital <strong>on</strong> 31 December <strong>2006</strong> was made up of:<br />
• £40 760 420 split into 1 310 156 361 ordinary shares of 3 1 ⁄ 9p<br />
each; and<br />
• £100 000 of deferred stock.<br />
The total number of voting rights attached to PLC’s outstanding<br />
shares are shown hereunder:<br />
Total number of votes % of issued capital<br />
1 310 156 361 ordinary shares 2 911 458 580 99.76<br />
£100 000 deferred stock 7 142 857 0.24<br />
Article 83 sets out the voting rights of members which are<br />
currently <strong>on</strong>e vote for every 1.4p of capital. At the 2007 PLC<br />
AGM, a resoluti<strong>on</strong> will be proposed to amend Article 83 to state<br />
that every member shall have <strong>on</strong>e vote for every 3 1 ⁄ 9p nominal of<br />
capital held of whatever class.<br />
The Board of Directors of PLC under secti<strong>on</strong>s 80 and 89 United<br />
Kingdom Companies Act 1985 may, subject to the passing of the<br />
appropriate resoluti<strong>on</strong>s at a meeting of shareholders, issue shares<br />
within the limits prescribed within the resoluti<strong>on</strong>s. At the <strong>2006</strong><br />
AGM the Directors were authorised to issue new shares pursuant<br />
to secti<strong>on</strong> 80 of that Act, limited to a maximum of £13 450 000<br />
nominal value, and pursuant to secti<strong>on</strong> 89 of that Act, to disapply<br />
pre-empti<strong>on</strong> rights up to approximately 5% of PLC’s issued<br />
ordinary share capital. These authorities are renewed annually.<br />
At the <strong>2006</strong> AGM the Board of Directors of PLC was authorised<br />
in accordance with its Articles of Associati<strong>on</strong> to make market<br />
purchases of its ordinary shares within the limits prescribed within<br />
the resoluti<strong>on</strong> until the earlier of the 12 m<strong>on</strong>ths anniversary after<br />
the passing of the resoluti<strong>on</strong> or the c<strong>on</strong>clusi<strong>on</strong> of the 2007 AGM.<br />
Depositary receipts for NV shares<br />
As at 1 March 2007, the majority (around 75%) of NV’s ordinary<br />
shares and around 34% of NV’s 7% cumulative preference shares<br />
are held by the Foundati<strong>on</strong> <strong>Unilever</strong> NV Trust Office (Stichting<br />
Administratiekantoor <strong>Unilever</strong> N.V.), a trust office with a Board<br />
independent from <strong>Unilever</strong>. As part of its corporate objects, the<br />
Foundati<strong>on</strong> issues depositary receipts in exchange for these<br />
shares. These depositary receipts are listed <strong>on</strong> Eur<strong>on</strong>ext<br />
Amsterdam, as are the NV ordinary and 7% preference shares<br />
themselves.<br />
Holders of depositary receipts can under all circumstances<br />
exchange their depositary receipts for the underlying shares<br />
(and vice versa).<br />
<strong>Unilever</strong> <str<strong>on</strong>g>Annual</str<strong>on</strong>g> Report <strong>on</strong> Form 20-F <strong>2006</strong> 41<br />
Report of the Directors (c<strong>on</strong>tinued)
Report of the Directors (c<strong>on</strong>tinued)<br />
Corporate governance (c<strong>on</strong>tinued)<br />
Holders of depositary receipts are entitled to dividends that are<br />
paid <strong>on</strong> the underlying shares held by the Foundati<strong>on</strong>.<br />
Foundati<strong>on</strong> <strong>Unilever</strong> NV Trust Office’s board<br />
The members of the board are Mr J H Schraven (Chairman),<br />
Mr P P de K<strong>on</strong>ing, Prof Dr L Koopmans and Mr A A Olijslager.<br />
Their Biographies can be found <strong>on</strong> the website of the Foundati<strong>on</strong><br />
www.administratiekantoor-unilever.nl.<br />
The Foundati<strong>on</strong> <str<strong>on</strong>g>report</str<strong>on</strong>g>s periodically, but at least <strong>on</strong>ce a year, <strong>on</strong><br />
its activities.<br />
Voting by holders of depositary receipts<br />
Although the depositary receipts themselves do not <strong>form</strong>ally have<br />
voting rights, holders of depositary receipts are in practice<br />
equated with shareholders. Holders of depositary receipts can<br />
attend NV’s General Meetings, either pers<strong>on</strong>ally or by proxy, and<br />
will then automatically, without limitati<strong>on</strong> and under all<br />
circumstances, receive a voting proxy <strong>on</strong> behalf of the Foundati<strong>on</strong><br />
to vote <strong>on</strong> the underlying shares.<br />
Holders of depositary receipts not attending a shareholders’<br />
meeting and who participate in the Dutch Shareholders’<br />
Communicati<strong>on</strong> Channel can also issue binding voting<br />
instructi<strong>on</strong>s to the Foundati<strong>on</strong>. The Foundati<strong>on</strong> is obliged<br />
to follow these instructi<strong>on</strong>s. The same applies to holders<br />
of depositary receipts who instruct the Foundati<strong>on</strong> outside<br />
the Shareholders Communicati<strong>on</strong> Channel.<br />
Voting by the Foundati<strong>on</strong> <strong>Unilever</strong> NV Trust Office<br />
Shares for which the Foundati<strong>on</strong> has not granted voting proxies<br />
or for which it has not received voting instructi<strong>on</strong>s are voted<br />
<strong>on</strong> by the Foundati<strong>on</strong> in such a way as it deems to be in the<br />
interests of the holders of the depositary receipts. This voting<br />
policy is laid down in the C<strong>on</strong>diti<strong>on</strong>s of Administrati<strong>on</strong> that<br />
apply to the depositary receipts. Both the Articles of Associati<strong>on</strong><br />
and the C<strong>on</strong>diti<strong>on</strong>s of Administrati<strong>on</strong> can be found <strong>on</strong> the<br />
Foundati<strong>on</strong>’s website.<br />
Specific provisi<strong>on</strong>s apply in the event that a meeting of holders of<br />
NV 7% cumulative preference shares is c<strong>on</strong>vened.<br />
If a change to shareholders’ rights is proposed, the Foundati<strong>on</strong><br />
will let shareholders know if it intends to vote, at least 14 days<br />
in advance if possible. It will do this by advertising in the press.<br />
Hitherto the majority of votes cast by ordinary shareholders at<br />
NV meetings have been cast by the Foundati<strong>on</strong>. <strong>Unilever</strong> and<br />
the Foundati<strong>on</strong> have a policy of actively encouraging holders<br />
of depositary receipts to exercise their voting rights in<br />
NV meetings.<br />
<strong>Unilever</strong> c<strong>on</strong>siders the arrangements of the Foundati<strong>on</strong><br />
appropriate and in the interest of NV and its shareholders given<br />
the voting rights attached to the financing preference shares and<br />
the relatively low attendance of the ordinary shares in its AGMs.<br />
42 <strong>Unilever</strong> <str<strong>on</strong>g>Annual</str<strong>on</strong>g> Report <strong>on</strong> Form 20-F <strong>2006</strong><br />
Foundati<strong>on</strong> <strong>Unilever</strong> NV Trust Office’s shareholding<br />
Foundati<strong>on</strong> NV Trust Office’s shareholding fluctuates daily – its<br />
holdings <strong>on</strong> 1 March 2007 were:<br />
• NV ordinary shares of €0.16: 1 285 189 970 (74.95%);<br />
• NV 7% cumulative preference shares of €428.57: 9 790<br />
(33.76%);<br />
• NV 6% cumulative preference shares of €428.57: 5 (0.00%);<br />
and<br />
• NV 4% cumulative preference shares of €42.86: 23 (0.00%).<br />
Further in<strong>form</strong>ati<strong>on</strong> <strong>on</strong> the Foundati<strong>on</strong>, its arrangements<br />
and its activities can be found <strong>on</strong> its website at<br />
www.administratiekantoor-unilever.nl.<br />
Margarine Uni<strong>on</strong> (1930) Limited: C<strong>on</strong>versi<strong>on</strong> Rights<br />
The first Viscount Leverhulme was the founder of the company<br />
which became PLC. When he died in 1925, he left in his will a<br />
large number of PLC shares in various trusts.<br />
When the will trusts were varied in 1983, the interests of the<br />
beneficiaries of his will were also preserved. Four classes of special<br />
shares were created in Margarine Uni<strong>on</strong> (1930) Limited, a<br />
subsidiary of PLC. One of these classes can be c<strong>on</strong>verted at the<br />
end of the year 2038 into 70 875 000 PLC ordinary shares of<br />
3 1 ⁄ 9p each. This currently represents 5.4% of PLC’s issued ordinary<br />
capital. These c<strong>on</strong>vertible shares replicate the rights which the<br />
descendants of the first Viscount would have had under his will.<br />
This class of the special shares <strong>on</strong>ly has a right to dividends in<br />
specified circumstances, and no dividends have yet been paid.<br />
PLC guarantees the dividend and c<strong>on</strong>versi<strong>on</strong> rights of the<br />
special shares.<br />
Requirements and compliance – general<br />
<strong>Unilever</strong> is subject to corporate governance requirements in the<br />
Netherlands, the UK and as a foreign private issuer in the US.<br />
In the following secti<strong>on</strong> we <str<strong>on</strong>g>report</str<strong>on</strong>g> <strong>on</strong> our compliance with the<br />
corporate governance regulati<strong>on</strong>s and best practice codes<br />
applicable in the Netherlands and the UK and we also describe<br />
compliance with corporate governance regulati<strong>on</strong>s in the US.<br />
Our governance arrangements are designed and structured to<br />
promote and further the interests of our companies and their<br />
shareholders. The Boards reserve the right, in cases where they<br />
decide such to be c<strong>on</strong>ducive to the interests of the companies<br />
and the enterprise c<strong>on</strong>nected therewith or our shareholders, to<br />
depart from that which is set out in the present and previous<br />
secti<strong>on</strong>s in relati<strong>on</strong> to our corporate governance. Further changes<br />
will be <str<strong>on</strong>g>report</str<strong>on</strong>g>ed in future <str<strong>on</strong>g>Annual</str<strong>on</strong>g> Reports and Accounts and,<br />
when necessary, through changes to the relevant documents<br />
published <strong>on</strong> our website. As appropriate, proposals for change<br />
will be put to our shareholders for approval.<br />
Further in<strong>form</strong>ati<strong>on</strong> can be found <strong>on</strong> our website and in ‘The<br />
Governance of <strong>Unilever</strong>’, the Boards’ own c<strong>on</strong>stituti<strong>on</strong>al<br />
document. This describes the terms of reference of our Board<br />
Committees, including their full resp<strong>on</strong>sibilities. It will be kept up<br />
to date with changes in our internal c<strong>on</strong>stituti<strong>on</strong>al arrangements<br />
that our Boards may make from time to time and it is available <strong>on</strong><br />
our website and up<strong>on</strong> request.
Corporate governance (c<strong>on</strong>tinued)<br />
Requirements – the Netherlands<br />
General<br />
NV is required to state in its <str<strong>on</strong>g>Annual</str<strong>on</strong>g> Report and Accounts whether<br />
it complies or will comply with the Principles (‘P’) and best<br />
practice provisi<strong>on</strong>s (‘bpp’) of the Dutch Corporate Governance<br />
Code (the Dutch Code) and, if it does not comply, to explain the<br />
reas<strong>on</strong>s for this. As will be clear from the preceding descripti<strong>on</strong> of<br />
our governance arrangements, NV complies with almost all of the<br />
principles and best practice provisi<strong>on</strong>s of the Dutch Code. The<br />
text that follows sets out areas of n<strong>on</strong>-compliance, as well as<br />
certain statements that the Dutch Code invites us to make to<br />
our shareholders that are not included elsewhere in this <str<strong>on</strong>g>Annual</str<strong>on</strong>g><br />
Report and Accounts.<br />
Board and Committee structures<br />
NV is a multinati<strong>on</strong>al company with activities and shareholders<br />
located all over the world. It has a <strong>on</strong>e-tier board, c<strong>on</strong>sisting of<br />
both Executive and, as a majority, N<strong>on</strong>-Executive Directors.<br />
We achieve compliance of our board arrangements with the<br />
Dutch Code, which is for the most part based <strong>on</strong> the customary<br />
two-tier structure in the Netherlands, by, as far as is possible and<br />
practicable, applying the provisi<strong>on</strong>s of the Dutch Code relating to<br />
members of a management board to our Executive Directors and<br />
the provisi<strong>on</strong>s relating to members of a supervisory board to our<br />
N<strong>on</strong>-Executive Directors. Management tasks not capable of<br />
delegati<strong>on</strong> are per<strong>form</strong>ed by the Board. Reference is made to Ps II<br />
and III and corresp<strong>on</strong>ding bpps. Reference is also made to the UK<br />
Combined Code <strong>on</strong> Corporate Governance, which is fully tailored<br />
to the <strong>on</strong>e-tier board model (see page 34).<br />
Role of the Chairman<br />
The Dutch Code recommends that in a <strong>on</strong>e-tier board the<br />
chairman should neither be, nor have been, resp<strong>on</strong>sible for the<br />
day-to-day c<strong>on</strong>duct of the business (bpp III.8.1). Before his<br />
appointment as N<strong>on</strong>-Executive Chairman, Ant<strong>on</strong>y Burgmans was<br />
jointly resp<strong>on</strong>sible for the daily operati<strong>on</strong>s of NV and PLC. Thus<br />
he is not independent from <strong>Unilever</strong>. He was nominated as N<strong>on</strong>-<br />
Executive Chairman in 2005 because of his thorough knowledge<br />
of <strong>Unilever</strong> and its operati<strong>on</strong>s. In additi<strong>on</strong> to his role as Chairman,<br />
the Board c<strong>on</strong>sidered his knowledge of the business to be<br />
essential to see through the changes resulting from the structure<br />
review. Ant<strong>on</strong>y Burgmans will be succeeded by Michael Treschow<br />
as an independent Chairman at the AGMs in 2007, subject to his<br />
appointment as N<strong>on</strong>-Executive Director.<br />
As Ant<strong>on</strong>y Burgmans was the <strong>on</strong>ly N<strong>on</strong>-Executive Director who is<br />
not independent from <strong>Unilever</strong>, NV complies with bpp. III.2.1 of<br />
the Dutch Code.<br />
In additi<strong>on</strong> to the Chairman, the Boards of NV and PLC have<br />
a Senior Independent Director who is appointed by the N<strong>on</strong>-<br />
Executive Directors and acts as their spokespers<strong>on</strong>.<br />
Risk management and c<strong>on</strong>trol<br />
Reference is made to page 66 where <strong>Unilever</strong>’s c<strong>on</strong>trol framework<br />
is described. This incorporates risk management, internal c<strong>on</strong>trol<br />
procedures and disclosure c<strong>on</strong>trols and procedures. Our<br />
procedures cover financial, operati<strong>on</strong>al, social, strategic and<br />
envir<strong>on</strong>mental risks and regulatory matters. They are in line with<br />
the latest recommendati<strong>on</strong>s of ‘Internal C<strong>on</strong>trol – Revised<br />
Guidance for Directors <strong>on</strong> the Combined Code’ published by the<br />
Internal C<strong>on</strong>trol Working Party of the Institute of Chartered<br />
Accountants in England and Wales in October 2005 (‘The Turnbull<br />
Guidance’). On pages 9 and 10 we have identified certain specific<br />
risks that are areas of focus in 2007. <strong>Unilever</strong> has designed its<br />
internal risk management and c<strong>on</strong>trol systems to provide<br />
reas<strong>on</strong>able (not absolute) assurance to ensure compliance with<br />
regulatory matters and to safeguard reliability of the financial<br />
<str<strong>on</strong>g>report</str<strong>on</strong>g>ing and its disclosures.<br />
The Board c<strong>on</strong>siders that the internal risk management and<br />
c<strong>on</strong>trol systems are appropriate for our business and in<br />
compliance with bpp II.1.3.<br />
In bpp II.1.4 the Dutch Code invites our Board to make a<br />
statement <strong>on</strong> our internal risk management and c<strong>on</strong>trol systems.<br />
In its <str<strong>on</strong>g>report</str<strong>on</strong>g>, published <strong>on</strong> 20 December 2005, the Corporate<br />
Governance Code M<strong>on</strong>itoring Committee has made<br />
recommendati<strong>on</strong>s c<strong>on</strong>cerning the applicati<strong>on</strong> of this best practice<br />
provisi<strong>on</strong>. In accordance with its recommendati<strong>on</strong> and in the light<br />
of the above, the Board believes that, as regards financial<br />
<str<strong>on</strong>g>report</str<strong>on</strong>g>ing risks:<br />
• the risk management and c<strong>on</strong>trol systems provide reas<strong>on</strong>able<br />
assurance that this <str<strong>on</strong>g>Annual</str<strong>on</strong>g> Report does not c<strong>on</strong>tain any<br />
material inaccuracies;<br />
• the risk management and c<strong>on</strong>trol systems have worked<br />
properly in <strong>2006</strong>;<br />
• there are no indicati<strong>on</strong>s that the risk management and c<strong>on</strong>trol<br />
systems will not work properly in 2007;<br />
• no material failings in the risk management and c<strong>on</strong>trol systems<br />
were discovered in the year under review or the current year<br />
until the signing of these accounts; and, as regards financial,<br />
operati<strong>on</strong>al, social, strategic, envir<strong>on</strong>mental and regulatory<br />
risks; and<br />
• no material failings in the risk management and c<strong>on</strong>trol systems<br />
were discovered in the year under review.<br />
This statement is not a statement in accordance with the<br />
requirements of Secti<strong>on</strong> 404 of the US Sarbanes-Oxley Act.<br />
Share opti<strong>on</strong>s and awards<br />
In line with bpp II.2.2, the awards and grants of shares and<br />
opti<strong>on</strong>s to our Executive Directors are in the material cases subject<br />
to per<strong>form</strong>ance criteria, as referred to <strong>on</strong> pages 51 and 52 of the<br />
Report of the Remunerati<strong>on</strong> Committee. The excepti<strong>on</strong> is the<br />
opti<strong>on</strong>s over 150 NV shares granted each year to our Executive<br />
Directors under the all-employee share opti<strong>on</strong> plan in the<br />
Netherlands, as described <strong>on</strong> pages 117 and 118. The Directors’<br />
participati<strong>on</strong> in this plan is seen as a stimulus for all employees<br />
to participate.<br />
<strong>Unilever</strong> <str<strong>on</strong>g>Annual</str<strong>on</strong>g> Report <strong>on</strong> Form 20-F <strong>2006</strong> 43<br />
Report of the Directors (c<strong>on</strong>tinued)
Report of the Directors (c<strong>on</strong>tinued)<br />
Corporate governance (c<strong>on</strong>tinued)<br />
Retenti<strong>on</strong> period of shares<br />
The Dutch Code recommends that shares granted to executive<br />
directors without a financial c<strong>on</strong>siderati<strong>on</strong> must be retained for<br />
a period of at least five years (bpp II.2.3). In 2001 we introduced<br />
a new remunerati<strong>on</strong> policy with shareholder approval which<br />
requires our Executive Directors to build and retain a pers<strong>on</strong>al<br />
shareholding in <strong>Unilever</strong> equal to at least 150% of their annual<br />
base pay. We believe that this is in line with the spirit of the<br />
Dutch Code.<br />
Severance pay<br />
It is our policy to set the level of severance payments for Directors<br />
to no more than <strong>on</strong>e year’s salary, unless the Board, at the<br />
proposal of the Remunerati<strong>on</strong> Committee, finds this manifestly<br />
unreas<strong>on</strong>able given circumstances or unless otherwise dictated by<br />
applicable law (bpp II.2.7).<br />
Regulati<strong>on</strong>s for transacti<strong>on</strong>s in securities in other<br />
companies<br />
The Dutch Code recommends that a director shall give periodic<br />
notice of any changes in his holding of securities in other Dutch<br />
listed companies (bpp II.2.6 and bpp III.7.3). Our Share Dealing<br />
Code provides that Directors are required, up<strong>on</strong> request, to<br />
disclose to the compliance officer their holdings and transacti<strong>on</strong>s<br />
in securities in other listed companies. We believe this<br />
requirement c<strong>on</strong>stitutes an appropriate arrangement.<br />
C<strong>on</strong>flicts of interest<br />
In the event of a (potential) c<strong>on</strong>flict of interest, the provisi<strong>on</strong>s of<br />
the Dutch Code (P II.3 and III.6) are applied. C<strong>on</strong>flicts of interest<br />
are not understood to include transacti<strong>on</strong>s and other activities<br />
between companies in the <strong>Unilever</strong> Group.<br />
Financing preference shares<br />
NV issued 4%, 6% and 7% cumulative preference shares<br />
between 1927 and 1970. Their voting rights are based <strong>on</strong> their<br />
nominal value, as prescribed by Dutch law. The Dutch Code<br />
recommends that the voting rights <strong>on</strong> such shares should, in any<br />
event when they are newly issued, be based <strong>on</strong> their ec<strong>on</strong>omic<br />
value rather than <strong>on</strong> their nominal value (bpp IV.1.2). NV agrees<br />
with this principle but cannot unilaterally reduce voting rights of<br />
its outstanding shares.<br />
Anti-takeover c<strong>on</strong>structi<strong>on</strong>s and c<strong>on</strong>trol over the company<br />
With reference to bpp IV.3.9, NV has no anti-takeover<br />
c<strong>on</strong>structi<strong>on</strong>s, in the sense of c<strong>on</strong>structi<strong>on</strong>s that are intended<br />
solely, or primarily, to block future hostile public offers for its<br />
shares. Nor does it have any c<strong>on</strong>structi<strong>on</strong>s whose specific purpose<br />
is to prevent a bidder, after acquiring 75% of the capital, from<br />
appointing or dismissing members of the Board and subsequently<br />
altering the Articles of Associati<strong>on</strong>. The acquisiti<strong>on</strong> through a<br />
public offer of a majority of the shares in a company does not<br />
under Dutch law preclude in all circumstances the c<strong>on</strong>tinued right<br />
of the board of the company to exercise its powers. The relevant<br />
in<strong>form</strong>ati<strong>on</strong> which NV is required to disclose in accordance with<br />
the Decree dated 5 April <strong>2006</strong> to implement Article 10 of<br />
Directive 2004/25/EC can be found in this document.<br />
44 <strong>Unilever</strong> <str<strong>on</strong>g>Annual</str<strong>on</strong>g> Report <strong>on</strong> Form 20-F <strong>2006</strong><br />
Provisi<strong>on</strong> of in<strong>form</strong>ati<strong>on</strong><br />
We c<strong>on</strong>sider it important to comply with all applicable statutory<br />
regulati<strong>on</strong>s <strong>on</strong> the equal treatment of shareholders and provisi<strong>on</strong><br />
of in<strong>form</strong>ati<strong>on</strong> and communicati<strong>on</strong> with shareholders and other<br />
parties (P IV.2 and P IV.3).<br />
Meetings of analysts and presentati<strong>on</strong>s to investors<br />
We have extensive procedures for handling relati<strong>on</strong>s with and<br />
communicating with shareholders, investors, analysts and the<br />
media (see descripti<strong>on</strong> <strong>on</strong> page 38). The important presentati<strong>on</strong>s<br />
and meetings are c<strong>on</strong>ducted as far as practicable in accordance<br />
with bpp IV.3.1. Due to their large number and overlap in<br />
in<strong>form</strong>ati<strong>on</strong>, some of the less important <strong>on</strong>es are not announced<br />
in advance, made accessible to every<strong>on</strong>e or put <strong>on</strong> our website.<br />
Requirements – the United Kingdom<br />
PLC is required, as a company that is incorporated in the United<br />
Kingdom and listed <strong>on</strong> the L<strong>on</strong>d<strong>on</strong> Stock Exchange, to state how<br />
it has applied the principles and how far it has complied with the<br />
provisi<strong>on</strong>s set out in Secti<strong>on</strong> 1 of the Combined Code issued in<br />
1998, as revised in 2003 (‘the Combined Code’), appended to the<br />
United Kingdom Listing Rules.<br />
In the preceding pages we have described how we have applied<br />
the Principles and the provisi<strong>on</strong>s in the Combined Code. In <strong>2006</strong>,<br />
<strong>Unilever</strong> complied with the Combined Code except in the<br />
following two areas:<br />
• Ant<strong>on</strong>y Burgmans, who before May 2005 was an Executive<br />
Director, is not c<strong>on</strong>sidered to be independent. The Nominati<strong>on</strong><br />
Committee and the Board nominated him for electi<strong>on</strong> as a<br />
N<strong>on</strong>-Executive Director in 2005 because of his thorough<br />
knowledge of <strong>Unilever</strong> and its operati<strong>on</strong>s. However, with the<br />
appointment of Michael Treschow as Chairman, subject to his<br />
appointment as a N<strong>on</strong>-Executive Director at the AGMs, <strong>Unilever</strong><br />
will comply with the provisi<strong>on</strong> that requires the Chairman to be<br />
independent <strong>on</strong> appointment; and<br />
• Due to the requirement for <strong>Unilever</strong> to hold two AGMs for its<br />
respective companies <strong>on</strong> c<strong>on</strong>secutive days, it may not always be<br />
possible for all Directors, and possibly the Chairmen of the<br />
Audit, Remunerati<strong>on</strong> and Nominati<strong>on</strong> Committees, to be<br />
present at both meetings. The Chairman therefore ensures that<br />
a majority of Directors attend both meetings and that at least<br />
<strong>on</strong>e member of each Committee attends each AGM.<br />
Requirements – the United States<br />
Both NV and PLC are listed <strong>on</strong> the New York Stock Exchange and<br />
must therefore comply with such of the requirements of US<br />
legislati<strong>on</strong>, such as the Sarbanes-Oxley Act of 2002, regulati<strong>on</strong>s<br />
enacted under US securities laws and the Listing Standards of the<br />
New York Stock Exchange as are applicable to foreign private<br />
issuers. In some cases the requirements are mandatory and in<br />
other cases the obligati<strong>on</strong> is to ’comply or explain’.
Corporate governance (c<strong>on</strong>tinued)<br />
We have complied with the requirements c<strong>on</strong>cerning corporate<br />
governance that were in force during <strong>2006</strong>. Attenti<strong>on</strong> is drawn<br />
in particular to the remit of the Audit Committee <strong>on</strong> page 37<br />
and the Report of the Audit Committee <strong>on</strong> page 63.<br />
Acti<strong>on</strong>s already taken to ensure compliance that are not<br />
specifically disclosed elsewhere or otherwise clear from reading<br />
this document include:<br />
• the issuance of a Code of Ethics for senior financial officers;<br />
• the issuance of instructi<strong>on</strong>s restricting the employment of<br />
<strong>form</strong>er employees of the audit firm; and<br />
• the establishment of a policy <strong>on</strong> <str<strong>on</strong>g>report</str<strong>on</strong>g>ing requirements under<br />
the US Securities and Exchange Commissi<strong>on</strong> (SEC) relating to<br />
the standards of professi<strong>on</strong>al c<strong>on</strong>duct for US attorneys.<br />
In each of these cases, existing practices were revised and/or<br />
documented in such a way as to c<strong>on</strong><strong>form</strong> to the new<br />
requirements.<br />
The Code of Ethics applies to the senior executive, financial and<br />
accounting officers and comprises the standards prescribed by the<br />
SEC, and a copy has been posted <strong>on</strong> our website at<br />
www.unilever.com/investorcentre/corpgovernance.<br />
The Code of Ethics comprises an extract of the relevant provisi<strong>on</strong>s<br />
of <strong>Unilever</strong>’s Code of Business Principles and the more detailed<br />
rules of c<strong>on</strong>duct that implement it. The <strong>on</strong>ly amendment to these<br />
pre-existing provisi<strong>on</strong>s and rules that was made in preparing the<br />
Code of Ethics was made at the request of the Audit Committee<br />
and c<strong>on</strong>sisted of a strengthening of the explicit requirement to<br />
keep proper accounting records. No waiver from any provisi<strong>on</strong><br />
of the Code of Ethics was granted to any of the pers<strong>on</strong>s falling<br />
within the scope of the SEC requirement in <strong>2006</strong>.<br />
We are required by US securities laws and the Listing Standards<br />
of the New York Stock Exchange to have an Audit Committee<br />
that satisfies Rule 10A-3 under the Exchange Act and the Listing<br />
Standards of the New York Stock Exchange (NYSE). We are fully<br />
compliant with these requirements. We are also required to<br />
disclose any significant ways in which our corporate governance<br />
practices differ from those typically followed by US companies<br />
listed <strong>on</strong> the NYSE. In additi<strong>on</strong> to the in<strong>form</strong>ati<strong>on</strong> we have<br />
given you in this document about our corporate governance<br />
arrangements, further details are provided in<br />
‘The Governance of <strong>Unilever</strong>’, which is <strong>on</strong> our website at<br />
www.unilever.com/investorcentre/corpgovernance.<br />
We are fully compliant with the Listing Standards of the<br />
New York Stock Exchange applicable to foreign private issuers.<br />
Our corporate governance practices do not significantly differ<br />
from those followed by US companies listed <strong>on</strong> the New York<br />
Stock Exchange.<br />
We would also c<strong>on</strong>firm that it is our practice, in accordance with<br />
our home country laws and practices, to give our shareholders the<br />
opportunity to vote <strong>on</strong> equity compensati<strong>on</strong> plans.<br />
<strong>Unilever</strong> <str<strong>on</strong>g>Annual</str<strong>on</strong>g> Report <strong>on</strong> Form 20-F <strong>2006</strong> 45<br />
Report of the Directors (c<strong>on</strong>tinued)
Report of the Directors (c<strong>on</strong>tinued)<br />
Corporate governance Biographical details<br />
Executive Directors<br />
Patrick Cescau<br />
Group Chief Executive<br />
Nati<strong>on</strong>ality: French. Aged 58. Group Chief Executive since April 2005.<br />
Joined <strong>Unilever</strong> 1973. Appointed Director 4 May 1999. Previous posts<br />
include: Chairman, <strong>Unilever</strong> PLC and Vice-Chairman, <strong>Unilever</strong> N.V.<br />
2004-2005. Foods Director 2001. Financial Director 1999. C<strong>on</strong>troller<br />
and Deputy Financial Director 1998-1999. President, Lipt<strong>on</strong> USA<br />
1997-1998. President and CEO, Van den Bergh Foods USA 1995-<br />
1997. Chairman, Ind<strong>on</strong>esia 1991-1995. External appointments<br />
include: N<strong>on</strong>-Executive Director, Pears<strong>on</strong> plc and C<strong>on</strong>seiller du<br />
Commerce Extérieur de la France in the Netherlands.<br />
Kees van der Graaf<br />
President Europe<br />
Nati<strong>on</strong>ality: Dutch. Aged 56. President Europe since April 2005. Joined<br />
<strong>Unilever</strong> 1976. Appointed Director 12 May 2004. Previous posts<br />
include: Foods Director 2004, Business Group President, Ice Cream<br />
and Frozen Foods 2001. Executive Vice-President, Foods and<br />
Beverages Europe 1998. Senior Vice-President, Global Ice Cream<br />
category 1995. External appointments include: Board member, ECR<br />
(Efficient C<strong>on</strong>sumer Resp<strong>on</strong>se) and Member, IAB (Internati<strong>on</strong>al<br />
Advisory Board of the City of Rotterdam). Member, Supervisory<br />
Boards of ANWB Club (Algemene Nederlandse Wielrijdersb<strong>on</strong>d)<br />
and ANWB B.V.<br />
Ralph Kugler 1<br />
President Home and pers<strong>on</strong>al care<br />
Nati<strong>on</strong>ality: British. Aged 51. President Home and Pers<strong>on</strong>al Care since<br />
1 April 2005. Joined <strong>Unilever</strong> 1979. Appointed Director 11 May 2005.<br />
Previous posts include: President Home and Pers<strong>on</strong>al Care Europe<br />
2001. Business Group President, Latin America 1999. Chairman,<br />
<strong>Unilever</strong> Thai Holdings 1995. Chairman, <strong>Unilever</strong> Malaysia 1992.<br />
External appointments include: N<strong>on</strong>-Executive Director,<br />
InterC<strong>on</strong>tinental Hotels Group PLC.<br />
Rudy Markham<br />
Chief Financial Officer<br />
Nati<strong>on</strong>ality: British. Aged 61. Chief Financial Officer since April 2005.<br />
Joined <strong>Unilever</strong> 1968. Appointed Director 6 May 1998. Previous posts<br />
include: Financial Director 2000. Strategy & Technology Director 1998.<br />
Business Group President, North East Asia 1996-1998. Chairman,<br />
Nipp<strong>on</strong> Lever Japan 1992-1996. Chairman, <strong>Unilever</strong> Australasia<br />
1989-1992. Group Treasurer 1986-1989. External appointments<br />
include: N<strong>on</strong>-Executive Director, Standard Chartered PLC and<br />
Legal & General Group Plc.<br />
N<strong>on</strong>-Executive Directors<br />
Ant<strong>on</strong>y Burgmans 1,2<br />
Chairman<br />
Nati<strong>on</strong>ality: Dutch. Aged 60. Appointed 2005. Joined <strong>Unilever</strong> 1972.<br />
Appointed Director 8 May 1991. Previous posts include: Chairman,<br />
<strong>Unilever</strong> N.V. and Vice-Chairman, <strong>Unilever</strong> PLC 1999-2005. Vice-<br />
Chairman, <strong>Unilever</strong> N.V. 1998. Business Group President, Ice<br />
Cream and Frozen Foods – Europe and Chairman, <strong>Unilever</strong> Europe<br />
Committee 1996-1998. Resp<strong>on</strong>sible for South European Foods<br />
business 1994-1996. Pers<strong>on</strong>al Products Co-ordinator 1991-1994.<br />
External appointments include: Member, Supervisory Board of<br />
Akzo Nobel N.V. and N<strong>on</strong>-Executive Director, BP p.l.c.<br />
1 Member Corporate Resp<strong>on</strong>sibility and Reputati<strong>on</strong> Committee<br />
2 Member Nominati<strong>on</strong> Committee<br />
3 Chairman Corporate Resp<strong>on</strong>sibility and Reputati<strong>on</strong> Committee<br />
4 Chairman Nominati<strong>on</strong> Committee<br />
5 Chairman Remunerati<strong>on</strong> Committee<br />
46 <strong>Unilever</strong> <str<strong>on</strong>g>Annual</str<strong>on</strong>g> Report <strong>on</strong> Form 20-F <strong>2006</strong><br />
The Rt H<strong>on</strong> The Lord Brittan of Spennithorne QC, DL 1<br />
Nati<strong>on</strong>ality: British. Aged 67. Appointed 2000. Vice-Chairman,<br />
UBS Investment Bank and Chairman, UBS Limited. Member,<br />
Internati<strong>on</strong>al Advisory Committee of Total. Member, European<br />
Commissi<strong>on</strong> and Vice-President 1989-1999. Member, UK Government<br />
1979-1986. Home Secretary 1983-1985 and Secretary of State for<br />
Trade and Industry 1985-1986.<br />
The Rt H<strong>on</strong> The Bar<strong>on</strong>ess Chalker of Wallasey 3<br />
Nati<strong>on</strong>ality: British. Aged 64. Appointed 1998. N<strong>on</strong>-Executive Director,<br />
Group 5 (Pty) Ltd. and Equator Energy Limited. Member, Internati<strong>on</strong>al<br />
Advisory Board of Lafarge S.A. and Merchant Bridge & Co Ltd.<br />
UK Minister of State at the Foreign and Comm<strong>on</strong>wealth Office<br />
1986-1997.<br />
Professor Wim Dik 1,7<br />
Nati<strong>on</strong>ality: Dutch. Aged 68. Appointed 2001. Professor at Delft<br />
University of Technology. Chairman, Supervisory Boards of Tele Atlas<br />
N.V., Zesko Holding B.V. and N.V. Casema. N<strong>on</strong>-Executive Director,<br />
Aviva plc and LogicaCMG plc. Chairman and CEO, K<strong>on</strong>inklijke PTT<br />
Nederland (KPN) 1988-1998 and K<strong>on</strong>inklijke KPN N.V. (Royal Dutch<br />
Telecom) 1998-2000. Minister for Foreign Trade, Netherlands<br />
1981-1982.<br />
Charles Golden 7<br />
Nati<strong>on</strong>ality: American. Aged 60. Appointed <strong>2006</strong>. Executive Vice-<br />
President, Chief Financial Officer and Director, Eli Lilly and Company<br />
1996-<strong>2006</strong>. N<strong>on</strong>-Executive Director, Clarian Health Partners,<br />
Hillenbrand Industries, Inc. and Eat<strong>on</strong> Corporati<strong>on</strong>. Member of<br />
Finance Committee, Indianapolis Museum of Art.<br />
Byr<strong>on</strong> Grote 7<br />
Nati<strong>on</strong>ality: American/British. Aged 59. Appointed <strong>2006</strong>. Chief<br />
Financial Officer, BP p.l.c. Member of Advisory Council, Cornell<br />
University Johns<strong>on</strong> Graduate School of Management.<br />
The Lord Sim<strong>on</strong> of Highbury CBE 4,5,6,<br />
Vice-Chairman<br />
Nati<strong>on</strong>ality: British. Aged 67. Appointed 2000. N<strong>on</strong>-Executive Director,<br />
Suez Group. Senior Advisor, Morgan Stanley Internati<strong>on</strong>al. UK<br />
Government Minister 1997-1999. Group Chief Executive, BP p.l.c.<br />
1992-1995 and Chairman 1995-1997.<br />
Jean-Cyril Spinetta 2,9<br />
Nati<strong>on</strong>ality: French. Aged 63. Appointed <strong>2006</strong>. Chairman and CEO<br />
of Air France – KLM S.A. Director, Saint-Gobain and Alitalia S.p.A<br />
2002-<strong>2006</strong>. Permanent representative of Air France <strong>on</strong> Board of<br />
Directors of Le M<strong>on</strong>de Enterprises S.A.<br />
Kees Storm 8<br />
Nati<strong>on</strong>ality: Dutch. Aged 64. Appointed <strong>2006</strong>. Chairman Executive<br />
Board AEGON N.V. 1993-2002. Chairman Supervisory Board KLM<br />
Royal Dutch Airlines N.V. Board member and Chairman of Audit<br />
Committee, InBev S.A. Board member and Audit Committee member,<br />
Baxter Internati<strong>on</strong>al Inc. Member, Supervisory Board, P<strong>on</strong> Holdings<br />
B.V. Member, Supervisory Board, AEGON N.V.<br />
Jeroen van der Veer 2,9<br />
Nati<strong>on</strong>ality: Dutch. Aged 59. Appointed 2002. Chief Executive<br />
Royal Dutch Shell plc. Former Member, Supervisory Board of De<br />
Nederlandsche Bank 2000-2004.<br />
6 Senior Independent Director<br />
7 Member Audit Committee<br />
8 Chairman Audit Committee<br />
9 Member Remunerati<strong>on</strong> Committee
Corporate governance Biographical details (c<strong>on</strong>tinued)<br />
<strong>Unilever</strong> Executive (UEx)*<br />
Patrick Cescau<br />
Group Chief Executive<br />
(see previous details <strong>on</strong> page 46)<br />
Vindi Banga<br />
President Foods<br />
Nati<strong>on</strong>ality: Indian. Aged 52. Appointed President Foods April 2005.<br />
Joined <strong>Unilever</strong> 1977. Previous posts include: Business Group President<br />
Home and Pers<strong>on</strong>al Care Asia 2004 in additi<strong>on</strong> to N<strong>on</strong>-Executive<br />
Chairman, Hindustan Lever 2004-2005. Chairman and Managing<br />
Director Hindustan Lever 2000-2004.<br />
Kees van der Graaf<br />
President Europe<br />
(see previous details <strong>on</strong> page 46)<br />
Ralph Kugler<br />
President Home and Pers<strong>on</strong>al Care<br />
(see previous details <strong>on</strong> page 46)<br />
Harish Manwani<br />
President Asia Africa<br />
Nati<strong>on</strong>ality: Indian. Aged 53. Appointed President Asia Africa April<br />
2005. Joined <strong>Unilever</strong> 1976. He is also N<strong>on</strong>-Executive Chairman,<br />
Hindustan Lever. Previous posts include: Business Group President,<br />
Home and Pers<strong>on</strong>al Care, North America 2004. Business Group<br />
President, Home and Pers<strong>on</strong>al Care, Latin America 2001 and Senior<br />
Vice President, Hair Care and Oral Care 2000.<br />
Rudy Markham<br />
Chief Financial Officer<br />
(see previous details <strong>on</strong> page 46)<br />
Sandy Ogg<br />
Chief Human Resources Officer<br />
Nati<strong>on</strong>ality: American. Aged 53. Appointed Chief HR Officer April<br />
2005. Joined <strong>Unilever</strong> 2003. Previous posts include: SVP Human<br />
Resources, Foods 2003. Prior to joining <strong>Unilever</strong> he worked for<br />
Motorola in Change Management/Organisati<strong>on</strong> Effectiveness to<br />
assist in the trans<strong>form</strong>ati<strong>on</strong> of all Communicati<strong>on</strong>s businesses.<br />
John Rice **<br />
President The Americas<br />
Nati<strong>on</strong>ality: American. Aged 55. Appointed President The Americas<br />
April 2005. Joined <strong>Unilever</strong> 1981. Previous posts include: Business<br />
Group President, <strong>Unilever</strong> Foods, North America 2002 and <strong>Unilever</strong><br />
Bestfoods Latin America 2000.<br />
* UEx members are treated as executive officers and senior management for US purposes and key management pers<strong>on</strong>nel for IFRS<br />
purposes. Although <strong>Unilever</strong> intends to offer revised service agreements to members of UEx, the agreements are currently under<br />
negotiati<strong>on</strong> with these individuals. All members of the UEx have existing agreements with varying terms, however, all agreements<br />
include a notice period of twelve m<strong>on</strong>ths. Details of the remunerati<strong>on</strong> paid and share awards are shown in aggregate in note 31<br />
<strong>on</strong> page 122.<br />
**<strong>Unilever</strong> announced <strong>on</strong> 19 December <strong>2006</strong> that John Rice had decided to retire from <strong>Unilever</strong> in March 2007. He will be replaced<br />
<strong>on</strong> the <strong>Unilever</strong> Executive Team and as President, The Americas by Michael Polk. Michael is currently Group Vice President and<br />
President <strong>Unilever</strong> United States. Michael joined <strong>Unilever</strong> in 2003 after 16 years at Kraft.<br />
<strong>Unilever</strong> <str<strong>on</strong>g>Annual</str<strong>on</strong>g> Report <strong>on</strong> Form 20-F <strong>2006</strong> 47<br />
Report of the Directors (c<strong>on</strong>tinued)
Report of the Directors (c<strong>on</strong>tinued)<br />
Report of the Nominati<strong>on</strong> Committee<br />
Compositi<strong>on</strong><br />
During <strong>2006</strong> the Nominati<strong>on</strong> Committee comprised three<br />
Independent N<strong>on</strong>-Executive Directors and the Chairman of<br />
<strong>Unilever</strong>. David Sim<strong>on</strong> chaired the Committee from 9 May <strong>2006</strong>,<br />
taking over from Bertrand Collomb. Other members in <strong>2006</strong> were<br />
Jean-Cyril Spinetta, as from 9 May <strong>2006</strong>, and Jeroen van der Veer<br />
and Ant<strong>on</strong>y Burgmans. The Joint Secretaries act as secretaries to<br />
the Committee.<br />
The Boards are of the view that it is appropriate that the<br />
Chairman is included as a member of the Committee <strong>on</strong> the<br />
express c<strong>on</strong>diti<strong>on</strong> that he does not participate in any discussi<strong>on</strong><br />
of his own positi<strong>on</strong>.<br />
Remit<br />
The Committee recommends to the Boards candidates for the<br />
positi<strong>on</strong>s of Executive and N<strong>on</strong>-Executive Director, Chairman,<br />
Vice-Chairman and Senior Independent Director. The Committee<br />
is c<strong>on</strong>cerned with successi<strong>on</strong> planning within the Boards. The<br />
Committee also has resp<strong>on</strong>sibility for oversight of all matters<br />
relating to corporate governance and brings any issues to the<br />
attenti<strong>on</strong> of the Boards. The Committee uses the services of<br />
recruitment c<strong>on</strong>sultants and other external experts. The Boards<br />
c<strong>on</strong>duct a process of evaluati<strong>on</strong> of their own per<strong>form</strong>ance each<br />
year. This includes a review of each Board Committee’s<br />
per<strong>form</strong>ance.<br />
The remit of the Committee and the in<strong>form</strong>ati<strong>on</strong> used by<br />
it for successi<strong>on</strong> planning are available <strong>on</strong> our website<br />
www.unilever.com/investorcentre/corpgovernance. Also <strong>on</strong><br />
the website are the procedures for evaluati<strong>on</strong> of the Boards and<br />
individual Directors. The results of the evaluati<strong>on</strong>s are provided to<br />
the Committee when it discusses the nominati<strong>on</strong>s for electi<strong>on</strong> as<br />
Directors, who offer themselves for re-electi<strong>on</strong> every year.<br />
In nominating Directors to the Boards, the Committee follows an<br />
agreed Board Profile of potential N<strong>on</strong>-Executive Directors, which<br />
takes into account the roles of N<strong>on</strong>-Executive Directors set out in<br />
the Dutch Corporate Governance Code and the UK Combined<br />
Code. Under the terms of the Governance of <strong>Unilever</strong> the Boards<br />
should comprise a majority of N<strong>on</strong>-Executive Directors and the<br />
Profile provides that three of these have str<strong>on</strong>g financial<br />
experience, and staff the Audit Committee. To represent <strong>Unilever</strong>’s<br />
areas of interest, the Profile also indicates there should be a<br />
str<strong>on</strong>g representati<strong>on</strong> from Developing and Emerging markets as<br />
well as from Europe and North America. N<strong>on</strong>-Executives should<br />
be independent of <strong>Unilever</strong> and free from any c<strong>on</strong>flicts of interest.<br />
The Profile looks at diversity in terms of nati<strong>on</strong>ality, race, gender<br />
and relevant expertise and directs that, wherever possible, the<br />
Boards should reflect <strong>Unilever</strong>’s c<strong>on</strong>sumer base. For more details<br />
see www.unilever.com/investorcentre/corpgovernance.<br />
48 <strong>Unilever</strong> <str<strong>on</strong>g>Annual</str<strong>on</strong>g> Report <strong>on</strong> Form 20-F <strong>2006</strong><br />
Meetings of the Committee<br />
The Committee met six times in <strong>2006</strong>. All but <strong>on</strong>e meeting were<br />
fully attended. The Committee proposed the nominati<strong>on</strong> of all<br />
Directors offering themselves for re-electi<strong>on</strong> at the AGMs in <strong>2006</strong>.<br />
In <strong>2006</strong>, the Committee also proposed the nominati<strong>on</strong> of four<br />
new N<strong>on</strong>-Executive Directors.<br />
These were Charles Golden, Byr<strong>on</strong> Grote, Kees Storm and<br />
Jean-Cyril Spinetta. They were chosen specifically for their<br />
financial and general business expertise. The first three are<br />
members of the Audit Committee, with Kees Storm in the chair.<br />
Jean-Cyril Spinetta is a member of the Nominati<strong>on</strong> Committee<br />
and the Remunerati<strong>on</strong> Committee.<br />
During the year the Committee c<strong>on</strong>ducted the search for a new<br />
Chairman to succeed Ant<strong>on</strong>y Burgmans, who retires at the 2007<br />
AGMs. The Committee followed a thorough process supported<br />
by an independent c<strong>on</strong>sultant. The process resulted in the<br />
Committee’s recommendati<strong>on</strong> to the Boards to nominate Michael<br />
Treschow as Ant<strong>on</strong>y Burgmans’ successor. The Committee is<br />
pleased to have identified an excellent candidate, who fully<br />
meets the criteria set for the Chairman’s role. Up<strong>on</strong> appointment<br />
Michael Treschow will be the first independent n<strong>on</strong>-executive<br />
Chairman of <strong>Unilever</strong>.<br />
The Committee has initiated the search process aimed at<br />
identifying candidates for the role of Chief Financial Officer,<br />
following the retirement of Rudy Markham at the 2007<br />
AGMs. For this purpose an outside executive search firm<br />
has been engaged.<br />
Also with the support of independent c<strong>on</strong>sultants the Committee<br />
c<strong>on</strong>tinued its search for new N<strong>on</strong>-Executive Directors to<br />
strengthen the Boards’ knowledge in IT and science as well as<br />
to increase representati<strong>on</strong> from the D&E markets and enhance<br />
diversity of both background and expertise.<br />
The nominati<strong>on</strong>s of Genevieve Berger, Hix<strong>on</strong>ia Nyasulu and<br />
Narayana Murthy are the result of this search. The Committee<br />
is of the view that they, if appointed, would be a very valuable<br />
additi<strong>on</strong> to the Boards’ compositi<strong>on</strong>.<br />
The Committee commissi<strong>on</strong>ed an outside c<strong>on</strong>sultant to support it<br />
in carrying out the <strong>2006</strong> evaluati<strong>on</strong> of the Boards, the Chairman,<br />
the individual Directors and the Board Committees. The results of<br />
this evaluati<strong>on</strong> have been presented to and discussed by the<br />
Boards. The overall c<strong>on</strong>clusi<strong>on</strong> is that Boards and Board<br />
Committee per<strong>form</strong>ance is in line with that of its peer group.<br />
David Sim<strong>on</strong> Chairman of the Nominati<strong>on</strong> Committee<br />
Ant<strong>on</strong>y Burgmans<br />
Jean-Cyril Spinetta<br />
Jeroen van der Veer
Report of the Remunerati<strong>on</strong> Committee<br />
During <strong>2006</strong> the Committee has reviewed the remunerati<strong>on</strong><br />
policy and practice of the past few years, and <strong>on</strong> the basis of this<br />
experience has decided to prioritise five strategic principles to<br />
serve as the plat<strong>form</strong> for <strong>Unilever</strong>’s approach to remunerati<strong>on</strong>.<br />
This strategy is not <strong>on</strong>ly for our Executive Directors but for all<br />
<strong>Unilever</strong>’s leadership levels. These principles, which improve the<br />
structure of our existing remunerati<strong>on</strong> framework as explained<br />
in greater detail in the following pages, are that pay should be:<br />
• robustly linked to per<strong>form</strong>ance;<br />
• aligned with strategic priorities;<br />
• aligned with shareholders’ interests;<br />
• market competitive; and<br />
• finally, easy to understand and communicate.<br />
Our overriding objective is to ensure that <strong>Unilever</strong> recruits and<br />
retains the best per<strong>form</strong>ers and then optimises the return <strong>on</strong><br />
investment from the reward system for <strong>Unilever</strong>’s leadership<br />
group. It is also our aim to manage the differing elements of<br />
total remunerati<strong>on</strong> in a fully integrated manner.<br />
The five principles will from 2007 provide the foundati<strong>on</strong> of<br />
some important changes to executive remunerati<strong>on</strong> that we are<br />
proposing for the level and structure of <strong>Unilever</strong> incentive plans.<br />
Our proposals have been the subject of c<strong>on</strong>sultati<strong>on</strong> with our<br />
major shareholders and their representatives. In summary, these<br />
changes enhance variable rewards relative to fixed pay and<br />
simplify the share-based incentives.<br />
The details of the proposed changes to <strong>Unilever</strong>’s l<strong>on</strong>g-term<br />
incentive arrangements are described in the Notices to<br />
Shareholders for the 2007 AGMs.<br />
In short, we believe that we have developed an approach<br />
which incorporates the right mix and level of incentives for our<br />
leadership team which also aligns with shareholders’ interests. It<br />
would also be more understandable and simpler to communicate<br />
to our staff.<br />
The year <strong>2006</strong> showed a c<strong>on</strong>tinuing improvement in top-line<br />
growth, whilst trading c<strong>on</strong>tributi<strong>on</strong> was proximate to but slightly<br />
below the targets we had set.<br />
To remain competitive the base salaries for the <strong>Unilever</strong> Executive<br />
team were increased by an average of 3.9% from the beginning<br />
of <strong>2006</strong>. Based <strong>on</strong> the per<strong>form</strong>ance over <strong>2006</strong> the annual<br />
incentive awards were <strong>on</strong> average 52% of base salary across<br />
the <strong>Unilever</strong> Executive team. However, in industry ranked terms<br />
we are not yet in a payout positi<strong>on</strong> for the TSR L<strong>on</strong>g-Term<br />
Incentive Plan.<br />
In 2007, we are strengthening the linkage between business<br />
per<strong>form</strong>ance and executive rewards.<br />
We hope to see c<strong>on</strong>tinued improvement in business results<br />
in 2007, with the leadership team appropriately rewarded<br />
commensurate with these improved results.<br />
David Sim<strong>on</strong> Chairman of the Remunerati<strong>on</strong> Committee<br />
Jean-Cyril Spinetta<br />
Jeroen van der Veer<br />
Definiti<strong>on</strong> of auditable part of the <str<strong>on</strong>g>report</str<strong>on</strong>g> of the Remunerati<strong>on</strong> Committee<br />
In compliance with the UK Directors’ Remunerati<strong>on</strong> Report Regulati<strong>on</strong> 2002, and under Title 9, Book 2 of the Civil Code in the<br />
Netherlands, the auditable part of the <str<strong>on</strong>g>report</str<strong>on</strong>g> of the Remunerati<strong>on</strong> Committee comprises the ’Aggregate remunerati<strong>on</strong> for Executive<br />
Directors’ <strong>on</strong> page 55, the ’Remunerati<strong>on</strong> for individual Executive Directors’ <strong>on</strong> page 55, the ‘Executive Directors’ Global Per<strong>form</strong>ance<br />
Share Plan’ <strong>on</strong> page 56, the ’Executive Directors’ c<strong>on</strong>diti<strong>on</strong>al share awards under the TSR L<strong>on</strong>g-Term Incentive Plan’ <strong>on</strong> page 56,<br />
the ‘Executive Directors’ Share Matching Plan’ <strong>on</strong> page 57, ’Executive Directors’ share opti<strong>on</strong>s’ <strong>on</strong> page 58, ’Executive Directors’<br />
pensi<strong>on</strong>s’ <strong>on</strong> page 59, ’Executive Directors’ interests – share capital’ <strong>on</strong> page 60, ‘N<strong>on</strong>-Executive Directors’ remunerati<strong>on</strong><br />
<strong>on</strong> page 61 and ‘N<strong>on</strong>-Executive Directors’ interests – share capital’ <strong>on</strong> page 62.<br />
<strong>Unilever</strong> <str<strong>on</strong>g>Annual</str<strong>on</strong>g> Report <strong>on</strong> Form 20-F <strong>2006</strong> 49<br />
Report of the Directors (c<strong>on</strong>tinued)
Report of the Directors (c<strong>on</strong>tinued)<br />
Report of the Remunerati<strong>on</strong> Committee (c<strong>on</strong>tinued)<br />
<strong>Unilever</strong> reward policy table <strong>2006</strong><br />
Short-term (<strong>on</strong>e year)<br />
L<strong>on</strong>g-term (three years)<br />
Indicative levels at face<br />
Element Payment vehicle value as % of base pay Plan objectives/Key drivers Per<strong>form</strong>ance measures<br />
Base salary Cash Market competitive Attracti<strong>on</strong> and retenti<strong>on</strong> of Individual per<strong>form</strong>ance<br />
key executives<br />
<str<strong>on</strong>g>Annual</str<strong>on</strong>g> incentive Cash (75%) Executive Director: 60% Delivery of trading Trading c<strong>on</strong>tributi<strong>on</strong><br />
<strong>on</strong> target c<strong>on</strong>tributi<strong>on</strong> (<strong>Unilever</strong>’s (Executive Director: 40%,<br />
Shares (25%) (range of 0% – 100%) primary internal measure of Group Chief Executive: 50%)<br />
ec<strong>on</strong>omic value added –<br />
Group Chief Executive: see page 51) and top-line Underlying sales growth<br />
90% <strong>on</strong> target growth targets (Executive Director: 40%,<br />
(range of 0% – 150%) Group Chief Executive: 50%)<br />
Individual resp<strong>on</strong>sibility for<br />
key <strong>Unilever</strong> business Individual c<strong>on</strong>tributi<strong>on</strong> to<br />
objectives <strong>Unilever</strong> business strategy<br />
(Executive Director: 20%,<br />
Group Chief Executive: 50%)<br />
Global Shares Grant level: around 25% Ungeared Free Cash Flow Ungeared Free Cash Flow (50%)<br />
Per<strong>form</strong>ance as the basic driver of <strong>Unilever</strong><br />
Share Plan Vesting level: 0% – 200% shareholder returns Underlying sales growth<br />
of grant (50%)<br />
Top-line growth as<br />
essential to <strong>Unilever</strong>’s<br />
l<strong>on</strong>g-term value creati<strong>on</strong><br />
TSR L<strong>on</strong>g-Term Shares Grant level: around 60% Shareholder return at upper Relative total shareholder<br />
Incentive Plan half of peer group with return<br />
Vesting level: 0% – 200% 20 other companies<br />
of grant<br />
Share Matching Shares 25% of annual Alignment with shareholders’<br />
Plan incentive earned in interests<br />
return for the deferral<br />
of 25% of b<strong>on</strong>us earned<br />
A significant proporti<strong>on</strong> of the Executive Directors’ total reward<br />
is linked to a number of key measures of Group per<strong>form</strong>ance<br />
to create alignment with the strategy and business priorities.<br />
Depending <strong>on</strong> the level of per<strong>form</strong>ance the variable comp<strong>on</strong>ent<br />
could vary between 0% and around 70% of the total reward<br />
package (excluding pensi<strong>on</strong>s).<br />
<strong>Unilever</strong>’s reward policy is benchmarked regularly against<br />
arrangements of other global companies based in Europe. This<br />
ensures that Executive Directors’ reward levels remain competitive.<br />
An internal comparis<strong>on</strong> is made with the reward arrangements for<br />
other senior executives within <strong>Unilever</strong> to support c<strong>on</strong>sistent<br />
applicati<strong>on</strong> of <strong>Unilever</strong>’s executive reward policies.<br />
In setting targets for the per<strong>form</strong>ance measures, the Committee<br />
is guided by what needs to happen to drive underlying<br />
per<strong>form</strong>ance. This is reflected in both the short-term and<br />
l<strong>on</strong>g-term per<strong>form</strong>ance targets.<br />
50 <strong>Unilever</strong> <str<strong>on</strong>g>Annual</str<strong>on</strong>g> Report <strong>on</strong> Form 20-F <strong>2006</strong>
Report of the Remunerati<strong>on</strong> Committee (c<strong>on</strong>tinued)<br />
Base salary<br />
The Remunerati<strong>on</strong> Committee reviews base salary levels annually,<br />
taking into account external benchmarks in the c<strong>on</strong>text of Group<br />
and individual per<strong>form</strong>ance.<br />
<str<strong>on</strong>g>Annual</str<strong>on</strong>g> incentive<br />
The annual incentive arrangement rewards Executive Directors for<br />
the delivery of trading c<strong>on</strong>tributi<strong>on</strong> (<strong>Unilever</strong>’s primary internal<br />
measure of ec<strong>on</strong>omic value added) and top-line growth targets,<br />
as well as for their individual c<strong>on</strong>tributi<strong>on</strong> to <strong>Unilever</strong>’s business<br />
strategy.<br />
In <strong>2006</strong>, the Group Chief Executive had a maximum opportunity<br />
of 150% of base salary. The maximum level is <strong>on</strong>ly payable in the<br />
case of excepti<strong>on</strong>al per<strong>form</strong>ance. The opportunity for other<br />
Executive Directors in <strong>2006</strong> was between 0% and 100%.<br />
The per<strong>form</strong>ance criteria for the annual incentive are:<br />
• Trading c<strong>on</strong>tributi<strong>on</strong>: <strong>Unilever</strong>’s primary internal measure of<br />
ec<strong>on</strong>omic value added. It is calculated from Trading Result after<br />
a deducti<strong>on</strong> for tax and a charge for asset use. (Trading result<br />
is the internal management measure of profit that is the most<br />
c<strong>on</strong>sistent with operating profit). Increases in trading<br />
c<strong>on</strong>tributi<strong>on</strong> reflect the combined impact of top-line growth,<br />
margin improvement and capital efficiency gains. It is well<br />
aligned with our objective of a progressive improvement in<br />
return <strong>on</strong> invested capital and with shareholder value creati<strong>on</strong>;<br />
• Underlying sales growth: focus <strong>on</strong> the organic growth of<br />
<strong>Unilever</strong>’s turnover; and<br />
• Individual business targets: tailored to each individual’s<br />
resp<strong>on</strong>sibilities to deliver certain business objectives supporting<br />
the strategy. Individual c<strong>on</strong>tributi<strong>on</strong> is assessed against robustly<br />
set measures and targets to ensure both objectivity and<br />
‘stretch’.<br />
Achievement of targets is measured at the end of the year and<br />
the payment takes place the following March. Part of the annual<br />
incentive (25%) is delivered to the Executive Directors in the <strong>form</strong><br />
of shares in NV and PLC, which are matched by a c<strong>on</strong>diti<strong>on</strong>al<br />
award of ‘matching shares’, as further described under the<br />
secti<strong>on</strong> <strong>on</strong> l<strong>on</strong>g-term incentives below.<br />
L<strong>on</strong>g-term incentives<br />
The l<strong>on</strong>g-term incentives for Executive Directors in <strong>2006</strong> c<strong>on</strong>sist<br />
of three elements, all of which are delivered in shares:<br />
• Global Per<strong>form</strong>ance Share Plan;<br />
• TSR L<strong>on</strong>g-Term Incentive Plan; and<br />
• Share Matching Plan (linked to the annual incentive).<br />
Executive Directors are required to dem<strong>on</strong>strate a significant<br />
pers<strong>on</strong>al shareholding commitment to <strong>Unilever</strong>. Within five years<br />
of appointment, they are expected to hold shares worth 150%<br />
of their annual base salary. This reinforces the link between the<br />
executives and other shareholders.<br />
Global Per<strong>form</strong>ance Share Plan (GPSP)<br />
Under the GPSP c<strong>on</strong>diti<strong>on</strong>al rights over shares in NV and PLC are<br />
awarded annually to Executive Directors. For Executive Directors<br />
the value of a grant of c<strong>on</strong>diti<strong>on</strong>al shares will not exceed 50% of<br />
base salary. The number of shares actually received at the end of<br />
the per<strong>form</strong>ance periods of the three years depends <strong>on</strong> the<br />
satisfacti<strong>on</strong> of the per<strong>form</strong>ance targets.<br />
The per<strong>form</strong>ance measures for vesting are underlying sales<br />
growth (for 50% of the award) and ungeared free cash flow<br />
(for 50% of the award). These are key per<strong>form</strong>ance measures<br />
in <strong>Unilever</strong>’s external <str<strong>on</strong>g>report</str<strong>on</strong>g>ing. Underlying sales growth focuses<br />
<strong>on</strong> the organic growth of <strong>Unilever</strong>’s turnover. Ungeared free cash<br />
flow expresses the translati<strong>on</strong> of profit into cash and thus l<strong>on</strong>gerterm<br />
ec<strong>on</strong>omic value.<br />
In respect of per<strong>form</strong>ance targets, there is a minimum and a<br />
maximum per<strong>form</strong>ance range for each of the two measures and<br />
associated vesting levels. Each year, the Remunerati<strong>on</strong> Committee<br />
reviews the per<strong>form</strong>ance targets by taking account of market<br />
c<strong>on</strong>diti<strong>on</strong>s and internal financial planning.<br />
Total Shareholder Return (TSR) L<strong>on</strong>g-Term Incentive Plan<br />
This plan rewards Executive Directors for creating more value<br />
for <strong>Unilever</strong>’s shareholders when compared with the investment<br />
returns generated by competitors.<br />
Under this plan c<strong>on</strong>diti<strong>on</strong>al rights over shares in NV and PLC<br />
are awarded annually to Executive Directors.<br />
The level of c<strong>on</strong>diti<strong>on</strong>al annual award in <strong>2006</strong> is as follows:<br />
• Group Chief Executive: Shares in NV and PLC to the combined<br />
value of €800 000; and<br />
• Other Executive Directors: Shares in NV and PLC to the<br />
combined value of €500 000.<br />
Vesting is subject to <strong>Unilever</strong>’s relative TSR per<strong>form</strong>ance. TSR<br />
measures the returns received by a shareholder, capturing both<br />
the increase in share price and the value of dividend income<br />
(assuming dividends are reinvested). <strong>Unilever</strong>’s TSR per<strong>form</strong>ance is<br />
compared with a peer group of competitors over a three-year<br />
per<strong>form</strong>ance period. The TSR<br />
results are compared <strong>on</strong> a single reference currency basis.<br />
No shares will vest if <strong>Unilever</strong> is ranked below positi<strong>on</strong> 11 of the<br />
TSR ranking table over the three-year period. Between 25% and<br />
200% of the shares will vest if <strong>Unilever</strong> is ranked in the top half<br />
of the table as shown below:<br />
Vested award<br />
% of original c<strong>on</strong>diti<strong>on</strong>al<br />
TSR peer group ranking award that will vest<br />
12th to 21st 0%<br />
10th or 11th 25%<br />
8th or 9th 50%<br />
5th to 7th 100%<br />
3rd or 4th 150%<br />
1st or 2nd 200%<br />
<strong>Unilever</strong> <str<strong>on</strong>g>Annual</str<strong>on</strong>g> Report <strong>on</strong> Form 20-F <strong>2006</strong> 51<br />
Report of the Directors (c<strong>on</strong>tinued)
Report of the Directors (c<strong>on</strong>tinued)<br />
Report of the Remunerati<strong>on</strong> Committee (c<strong>on</strong>tinued)<br />
Peer group:<br />
Av<strong>on</strong> Kraft<br />
Beiersdorf Li<strong>on</strong><br />
Cadbury Schweppes L’Oréal<br />
Clorox Nestlé<br />
Coca-Cola Orkla<br />
Colgate Pepsico<br />
Dan<strong>on</strong>e Procter & Gamble<br />
Heinz Reckitt Benckiser<br />
Kao Sara Lee<br />
Kimberly-Clark Shiseido<br />
Share Matching Plan (linked to the annual incentive)<br />
The Share Matching Plan enhances the alignment with<br />
shareholders’ interests and supports the retenti<strong>on</strong> of key<br />
executives. In additi<strong>on</strong>, the necessity to hold the shares for<br />
a minimum period of three years supports the shareholding<br />
requirements set out <strong>on</strong> page 51.<br />
The Executive Directors receive 25% of their annual incentive<br />
in the <strong>form</strong> of NV and PLC shares. These are matched with an<br />
equivalent number of matching shares. The matching shares will<br />
vest after three years provided that the underlying shares have<br />
been retained during this period and the Executive Director has<br />
not resigned or been dismissed.<br />
The Remunerati<strong>on</strong> Committee c<strong>on</strong>siders that there is no need for<br />
further per<strong>form</strong>ance c<strong>on</strong>diti<strong>on</strong>s <strong>on</strong> the vesting of the matching<br />
shares because the number of shares is directly linked to the<br />
annual incentive (which is itself subject to demanding<br />
per<strong>form</strong>ance c<strong>on</strong>diti<strong>on</strong>s). In additi<strong>on</strong>, during the three-year<br />
vesting period the share price of NV and PLC will be influenced by<br />
the per<strong>form</strong>ance of <strong>Unilever</strong>. This, in turn, will affect the ultimate<br />
value of the matching shares <strong>on</strong> vesting.<br />
Executive Directors’ pensi<strong>on</strong>s<br />
The Remunerati<strong>on</strong> Committee has decided that from 2007 new<br />
Executive Directors will be members of the all-employee pensi<strong>on</strong><br />
arrangement of their home country. Executive Directors appointed<br />
prior to 2007 have a defined benefit pensi<strong>on</strong> of two-thirds of final<br />
salary payable at retirement from age 60. <str<strong>on</strong>g>Annual</str<strong>on</strong>g> incentive is not<br />
pensi<strong>on</strong>able except for Executive Directors appointed prior to the<br />
change of policy for Executive Directors in 2005 for whom annual<br />
incentive is pensi<strong>on</strong>able up to a maximum of 20% of base salary.<br />
Other benefits and allowances<br />
Executive Directors enjoy similar benefits to many other<br />
employees of <strong>Unilever</strong>. For example, like other employees,<br />
Executive Directors are able to participate in the UK Employee<br />
ShareSave Plan, the UK Share Incentive Plan (‘ShareBuy’) and<br />
the All Employee Opti<strong>on</strong> Plan in the Netherlands.<br />
Some of the Executive Directors serve as a n<strong>on</strong>-executive <strong>on</strong> the<br />
Board of another company. <strong>Unilever</strong> requires that all remunerati<strong>on</strong><br />
and fees earned from outside directorships are paid directly<br />
to <strong>Unilever</strong>.<br />
52 <strong>Unilever</strong> <str<strong>on</strong>g>Annual</str<strong>on</strong>g> Report <strong>on</strong> Form 20-F <strong>2006</strong><br />
Future developments<br />
Changes will be proposed for the structure and level of the <strong>Unilever</strong><br />
incentive plans. In summary these changes enhance variable awards<br />
relative to fixed pay and simplify the share-based incentives.<br />
Details of the proposed changes to <strong>Unilever</strong>’s l<strong>on</strong>g-term incentive<br />
arrangements are described in the notice to shareholders for the<br />
2007 AGMs.<br />
The Remunerati<strong>on</strong> Committee intends to c<strong>on</strong>tinue m<strong>on</strong>itoring<br />
trends and changes in the market. It keeps a watching brief <strong>on</strong><br />
the c<strong>on</strong>tinuing alignment between <strong>Unilever</strong>’s strategic objectives<br />
and the reward policy for Executive Directors.<br />
Commentary <strong>on</strong> Executive Directors’ Remunerati<strong>on</strong><br />
paid in <strong>2006</strong><br />
The tables <strong>on</strong> pages 55 to 60 give details of the specific elements<br />
of Executive Directors’ reward packages in <strong>2006</strong>.<br />
Base salary<br />
In <strong>2006</strong>, base salary levels were benchmarked against those paid<br />
in other major global companies based in Europe, excluding<br />
companies in the financial sector. The increases for <strong>2006</strong> reflect<br />
the change in market levels as well as individual and Group<br />
per<strong>form</strong>ance. The <strong>2006</strong> annual base salary levels for the Executive<br />
Directors are set out below:<br />
Based in the UK<br />
Patrick Cescau £972 500<br />
Ralph Kugler £587 500<br />
Rudy Markham £664 500<br />
Based in the Netherlands<br />
Kees van der Graaf €798 000<br />
<str<strong>on</strong>g>Annual</str<strong>on</strong>g> incentive<br />
The annual incentive awards for <strong>2006</strong> were subject to<br />
achievement of underlying sales growth and trading c<strong>on</strong>tributi<strong>on</strong><br />
targets in combinati<strong>on</strong> with individual key strategic business<br />
targets. The Committee measured the results against the targets<br />
set and determined the annual incentive amounts for <strong>2006</strong>.<br />
L<strong>on</strong>g-term incentive arrangements<br />
• Global Per<strong>form</strong>ance Share Plan<br />
The per<strong>form</strong>ance period of the first award ends <strong>on</strong><br />
31 December 2007 and therefore no award vested in <strong>2006</strong>.<br />
The sec<strong>on</strong>d award was made in <strong>2006</strong> for the per<strong>form</strong>ance<br />
period <strong>2006</strong>-2008.<br />
• TSR Plan<br />
The c<strong>on</strong>diti<strong>on</strong>al shares awarded in 2003 lapsed in <strong>2006</strong><br />
because the vesting was based <strong>on</strong> the TSR per<strong>form</strong>ance of<br />
<strong>Unilever</strong> (when ranked against its defined peer group with<br />
competitors) over the three-year per<strong>form</strong>ance period which<br />
ended 31 December 2005. For this period, <strong>Unilever</strong> was ranked<br />
14 in this peer group and therefore no vesting occurred for this<br />
award in March <strong>2006</strong> and the shares lapsed.
Report of the Remunerati<strong>on</strong> Committee (c<strong>on</strong>tinued)<br />
• Share Matching Plan<br />
The matching shares originally granted in 2003 <strong>on</strong> a c<strong>on</strong>diti<strong>on</strong>al<br />
basis vested in <strong>2006</strong>, subject to fulfilment of the retenti<strong>on</strong><br />
c<strong>on</strong>diti<strong>on</strong>s.<br />
• Executive Share Opti<strong>on</strong>s<br />
The grants of executive share opti<strong>on</strong>s made in 2003 became<br />
exercisable as from <strong>2006</strong>. As the 2003 grant was based <strong>on</strong><br />
<strong>Unilever</strong>’s EPS per<strong>form</strong>ance, the opti<strong>on</strong>s at vesting were subject<br />
to no further c<strong>on</strong>diti<strong>on</strong>s.<br />
Pensi<strong>on</strong>s<br />
The Netherlands all-employee pensi<strong>on</strong> plan benefit basis<br />
was changed from final salary to career average earnings at<br />
31 December <strong>2006</strong>. This had a small impact <strong>on</strong> the accrued<br />
pensi<strong>on</strong> of the Netherlands-based Executive Director.<br />
During <strong>2006</strong>, in line with the treatment adopted for other<br />
UK-based employees, individual c<strong>on</strong>tributi<strong>on</strong>s paid by Executive<br />
Directors in the UK are now paid through a salary sacrifice<br />
arrangement.<br />
N<strong>on</strong>-Executive Directors<br />
The N<strong>on</strong>-Executive Directors receive fees from both NV and PLC.<br />
No other remunerati<strong>on</strong> is given in respect of their N<strong>on</strong>-Executive<br />
duties from either NV or PLC, such as annual incentives, sharebased<br />
incentives or pensi<strong>on</strong> benefits.<br />
The level of their fees reflects their commitment and c<strong>on</strong>tributi<strong>on</strong><br />
to the companies. The levels were increased in <strong>2006</strong> as a market<br />
analysis against <strong>Unilever</strong>’s peers showed that <strong>Unilever</strong> had fallen<br />
behind in this area. The Remunerati<strong>on</strong> Committee believes that<br />
the levels outlined below are fair in the light of the resp<strong>on</strong>sibilities<br />
carried out by N<strong>on</strong>-Executive Directors and in view of the need<br />
to attract and retain N<strong>on</strong>-Executive Directors of the appropriate<br />
calibre and standing.<br />
The current fee levels are set out below:<br />
N<strong>on</strong>-Executive Role Fees payable by PLC Fees payable by NV<br />
Chairman £175 000 €255 000<br />
Senior Independent Director £45 000 €65 000<br />
Chairman of Audit Committee £38 000 €55 000<br />
Board Committee Chairman £35 000 €50 000<br />
Other N<strong>on</strong>-Executive Directors £31 000 €45 000<br />
An additi<strong>on</strong>al £5 000 per meeting will be paid to N<strong>on</strong>-Executive<br />
Directors who have to travel to meetings from outside Europe.<br />
Other items<br />
<strong>Unilever</strong>’s share per<strong>form</strong>ance relative to broad-based<br />
equity indices<br />
The UK Companies Act 1985 (schedule 7A) requires us to show<br />
<strong>Unilever</strong>’s relative share per<strong>form</strong>ance, based <strong>on</strong> Total Shareholder<br />
Return, against a holding of shares in a broad-based equity index<br />
for the last five years. The Remunerati<strong>on</strong> Committee has decided<br />
to show <strong>Unilever</strong>’s per<strong>form</strong>ance against two indices, namely the<br />
FTSE 100 Index, L<strong>on</strong>d<strong>on</strong>, and the Eur<strong>on</strong>ext AEX Index, Amsterdam<br />
as these are the most generally used indices in the UK and the<br />
Netherlands, where we have our principal listings.<br />
Five-Year Historical TSR Per<strong>form</strong>ance<br />
Growth in the value of a hypothetical £100 holding over five years<br />
FTSE 100 comparis<strong>on</strong> based <strong>on</strong> 30 trading day average values<br />
150<br />
140<br />
130<br />
120<br />
110<br />
100<br />
90<br />
80<br />
70<br />
60<br />
Growth in the value of a hypothetical investment over five years<br />
AEX comparis<strong>on</strong> based <strong>on</strong> 30 day average values<br />
130<br />
120<br />
110<br />
100<br />
90<br />
80<br />
70<br />
60<br />
<strong>Unilever</strong><br />
FTSE 100<br />
<strong>Unilever</strong><br />
AEX<br />
Dec 2001 Dec 2002 Dec 2003 Dec 2004 Dec 2005 Dec <strong>2006</strong><br />
Dec 2001 Dec 2002 Dec 2003 Dec 2004 Dec 2005 Dec <strong>2006</strong><br />
<strong>Unilever</strong> <str<strong>on</strong>g>Annual</str<strong>on</strong>g> Report <strong>on</strong> Form 20-F <strong>2006</strong> 53<br />
Report of the Directors (c<strong>on</strong>tinued)
Report of the Directors (c<strong>on</strong>tinued)<br />
Report of the Remunerati<strong>on</strong> Committee (c<strong>on</strong>tinued)<br />
Remunerati<strong>on</strong> committee<br />
Role and resp<strong>on</strong>sibilities<br />
The Committee is resp<strong>on</strong>sible for making proposals to the Boards<br />
<strong>on</strong> the reward policy for Executive Directors. It is also resp<strong>on</strong>sible<br />
for setting individual reward packages for Executive Directors<br />
and for m<strong>on</strong>itoring and approving all share-based incentive<br />
arrangements. The Committee meets at least three times a<br />
year and, during <strong>2006</strong>, it met <strong>on</strong> six occasi<strong>on</strong>s.<br />
Structure and role<br />
Bertrand Collomb stepped down as Chairman of the Committee<br />
at the AGM <strong>2006</strong>. At the same time David Sim<strong>on</strong> became the<br />
new Chairman of the Committee and Jean-Cyril Spinetta joined<br />
as member of the Committee. The other N<strong>on</strong>-Executive Director<br />
of the Committee is Jeroen van der Veer.<br />
Advice and assistance<br />
The Committee does not <strong>form</strong>ally retain remunerati<strong>on</strong><br />
c<strong>on</strong>sultants. It seeks professi<strong>on</strong>al advice from external advisers as<br />
and when required. During <strong>2006</strong>, the Committee sought advice<br />
from Towers Perrin (an independent firm of human resources<br />
specialists) <strong>on</strong> market data, reward trends and per<strong>form</strong>ancerelated<br />
pay. Towers Perrin also provides general c<strong>on</strong>sultancy advice<br />
to <strong>Unilever</strong> group companies <strong>on</strong> employee rewards, pensi<strong>on</strong>,<br />
communicati<strong>on</strong>s and other human resource matters.<br />
The Group Chief Executive can be invited to attend Committee<br />
meetings to provide his own insights to the Committee <strong>on</strong><br />
business objectives and the individual per<strong>form</strong>ance of his direct<br />
<str<strong>on</strong>g>report</str<strong>on</strong>g>s. Naturally, he does not attend when his own remunerati<strong>on</strong><br />
is being discussed.<br />
The N<strong>on</strong>-Executive Chairman can, in his role as Chairman of the<br />
Board, also attend the meetings.<br />
54 <strong>Unilever</strong> <str<strong>on</strong>g>Annual</str<strong>on</strong>g> Report <strong>on</strong> Form 20-F <strong>2006</strong>
Report of the Remunerati<strong>on</strong> Committee (c<strong>on</strong>tinued)<br />
The following secti<strong>on</strong> c<strong>on</strong>tains detailed in<strong>form</strong>ati<strong>on</strong> <strong>on</strong> the Executive Directors’ annual remunerati<strong>on</strong>, l<strong>on</strong>g-term incentives, pensi<strong>on</strong><br />
benefits and share interests in respect of <strong>2006</strong>.<br />
Aggregate remunerati<strong>on</strong> for Executive Directors<br />
The following table gives details of the aggregate remunerati<strong>on</strong> (including value of the vesting of matching shares and exercise of<br />
opti<strong>on</strong>s) as a group.<br />
<str<strong>on</strong>g>Annual</str<strong>on</strong>g> emoluments<br />
€ ’000 € ’000<br />
<strong>2006</strong> 2005<br />
Base salary 4 061 5 219<br />
Allowances and other payments:<br />
Allowances 178 255<br />
Other payments (a) 735 2 586<br />
Benefits 111 264<br />
Per<strong>form</strong>ance-related payments (annual incentive) 2 409 2 752<br />
Sub-total of annual emoluments 7 494 11 076<br />
Other income arising from vesting/exercise of l<strong>on</strong>g-term incentives (b)<br />
Gains <strong>on</strong> exercise of share opti<strong>on</strong>s 427 10<br />
Vesting of matching shares 566 1 149<br />
Vesting of TSR L<strong>on</strong>g-Term Incentive Plans – –<br />
Total of annual emoluments and other income arising from l<strong>on</strong>g-term incentives 8 487 12 235<br />
(a) Other payments include payments to Ant<strong>on</strong>y Burgmans and André van Heemstra following c<strong>on</strong>tractual obligati<strong>on</strong>s.<br />
(b) Includes the gains realised in <strong>2006</strong> following the exercise of share opti<strong>on</strong>s granted in earlier years and the value of matching shares vested<br />
in <strong>2006</strong>. No value is attributed to TSR L<strong>on</strong>g-Term Incentive Plan as the shares which were c<strong>on</strong>diti<strong>on</strong>ally granted in 2003 did not vest and<br />
lapsed in <strong>2006</strong>.<br />
Remunerati<strong>on</strong> for individual Executive Directors<br />
The following table gives details of the remunerati<strong>on</strong> received in <strong>2006</strong> (including the value of vested share match and opti<strong>on</strong>s exercised<br />
at the end of the exercise period) by each Executive Director individually.<br />
Other income arising from<br />
l<strong>on</strong>g-term incentives and<br />
<str<strong>on</strong>g>Annual</str<strong>on</strong>g> Emoluments <strong>2006</strong> exercise of opti<strong>on</strong>s in <strong>2006</strong><br />
Allowances Grand Grand<br />
Base and other Total Total Opti<strong>on</strong> Share total total<br />
salary payments (a) Benefits (b) B<strong>on</strong>us (c) <strong>2006</strong> 2005 gains match TSR/LTIP <strong>2006</strong> 2005<br />
Name and Base Country € ’000 € ’000 € ’000 € ’000 € ’000 € ’000 € ’000 € ’000 € ’000 € ’000 € ’000<br />
Patrick Cescau (UK) (d) 1 426 109 51 1 141 2 727 2 544 – 213 – 2 940 2 742<br />
Kees van der Graaf (NL) 798 14 23 367 1 202 1 119 – 85 – 1 287 1 173<br />
Ralph Kugler (UK) 862 27 10 414 1 313 817 – 101 – 1 414 827<br />
Rudy Markham (UK) 975 28 27 487 1 517 1 425 427 (e) 167 – 2 111 1 610<br />
Following notice period payments made to <strong>form</strong>er Executive Directors:<br />
Ant<strong>on</strong>y Burgmans (NL) Jan – May 674 674 674<br />
André van Heemstra (NL) January 61 61 61<br />
(a) Include: allowance in lieu of company car; blind trust fees compensati<strong>on</strong>; compensati<strong>on</strong> for loss of net income because part of the salary had<br />
to be paid in the Netherlands; entertaining allowance; allowance for cost <strong>on</strong> chauffeur driven cars and employers cost for the all-employee<br />
savings plan in the Netherlands. All allowances are taxable in the country of residence apart from the entertaining allowance which is<br />
currently tax free in the Netherlands. Also includes payments to Ant<strong>on</strong>y Burgmans and André van Heemstra following c<strong>on</strong>tractual obligati<strong>on</strong>s.<br />
(b) Include: benefits for company car; medical insurance; private use chauffeur driven cars; and housing (for business use) instead of hotel.<br />
Included are benefits that are taxable in the country of residence. In additi<strong>on</strong>, <strong>Unilever</strong> provides support to Executive Directors in relati<strong>on</strong> to<br />
spouse’s travel expenses when travelling together <strong>on</strong> company business. This amount is capped at 5% of base salary and for <strong>2006</strong> totalled<br />
€206 083 (including related taxes payable).<br />
(c) B<strong>on</strong>us of the year <strong>2006</strong>. Include: the value of both the cash element and the element paid in shares of <strong>Unilever</strong> N.V. and PLC. In additi<strong>on</strong> to<br />
the element of the b<strong>on</strong>us paid in shares each Executive Director is awarded, <strong>on</strong> a c<strong>on</strong>diti<strong>on</strong>al basis, an equivalent number of matching shares.<br />
(d) Group Chief Executive.<br />
(e) All shares under opti<strong>on</strong> purchased and retained.<br />
Figures have been translated into euros using the following exchange rate: €1 = £0.6818 (2005: €1 = £0.6837)<br />
<strong>Unilever</strong> <str<strong>on</strong>g>Annual</str<strong>on</strong>g> Report <strong>on</strong> Form 20-F <strong>2006</strong> 55<br />
Report of the Directors (c<strong>on</strong>tinued)
Report of the Directors (c<strong>on</strong>tinued)<br />
Report of the Remunerati<strong>on</strong> Committee (c<strong>on</strong>tinued)<br />
Executive Directors’ Global Per<strong>form</strong>ance Share Plan<br />
The following c<strong>on</strong>diti<strong>on</strong>al shares were outstanding, awarded or vested during <strong>2006</strong> under the Global Per<strong>form</strong>ance Share Plan:<br />
56 <strong>Unilever</strong> <str<strong>on</strong>g>Annual</str<strong>on</strong>g> Report <strong>on</strong> Form 20-F <strong>2006</strong><br />
Balance of<br />
Balance of c<strong>on</strong>diti<strong>on</strong>al C<strong>on</strong>diti<strong>on</strong>al grant made 21 March <strong>2006</strong> c<strong>on</strong>diti<strong>on</strong>al shares at<br />
shares at 1 January <strong>2006</strong> (Per<strong>form</strong>ance period <strong>2006</strong> to 2008) (b) 31 December <strong>2006</strong><br />
Share type No. of shares (a) No. of shares (a) Price at award (a) No. of shares<br />
Patrick Cescau NV 9 000 9 000 €19.10 18 000<br />
PLC 9 000 9 000 1 301.11p 18 000<br />
Kees van der Graaf NV 6 000 6 000 €19.10 12 000<br />
PLC 6 075 6 075 1 301.11p 12 150<br />
Ralph Kugler NV 6 000 6 000 €19.10 12 000<br />
PLC 6 075 6 075 1 301.11p 12 150<br />
Rudy Markham NV 6 000 6 000 €19.10 12 000<br />
PLC 6 075 6 075 1 301.11p 12 150<br />
(a) Number of shares and share prices have been recalculated following the share split and c<strong>on</strong>solidati<strong>on</strong>.<br />
(b) Each award of per<strong>form</strong>ance shares is c<strong>on</strong>diti<strong>on</strong>al and vests subject to certain c<strong>on</strong>diti<strong>on</strong>s three years after the date of the award. The <strong>2006</strong><br />
awards are subject to the per<strong>form</strong>ance period 1 January <strong>2006</strong> to 31 December 2008.<br />
Executive Directors’ c<strong>on</strong>diti<strong>on</strong>al share awards under the TSR L<strong>on</strong>g-Term Incentive Plan<br />
C<strong>on</strong>diti<strong>on</strong>al rights to ordinary shares in NV and PLC were outstanding, granted or vested/lapsed in <strong>2006</strong> as shown in the table below:<br />
Balance of Balance of<br />
c<strong>on</strong>diti<strong>on</strong>al C<strong>on</strong>diti<strong>on</strong>al award C<strong>on</strong>diti<strong>on</strong>al awards c<strong>on</strong>diti<strong>on</strong>al<br />
shares made 21 March <strong>2006</strong> lapsed 25 March <strong>2006</strong> shares at<br />
at 1 January (Per<strong>form</strong>ance period (Per<strong>form</strong>ance period 31 December<br />
<strong>2006</strong> <strong>2006</strong> to 2008) (a) 2003 to 2005) (b) Original<br />
<strong>2006</strong><br />
Share No. of No. of Price at No. of price No. of<br />
type shares (c) shares (c) award (c) shares (c) at award (c) shares<br />
Patrick Cescau NV 51 144 20 943 €19.10 (13 611) €18.37 58 476<br />
PLC 52 118 21 326 1 301.11p (12 995) 1 300p 60 449<br />
Kees van der Graaf NV 31 281 13 089 €19.10 (8 169) €18.37 36 201<br />
PLC 31 888 13 329 1 301.11p (7 795) 1 300p 37 422<br />
Ralph Kugler NV 31 281 13 089 €19.10 (8 169) €18.37 36 201<br />
PLC 31 888 13 329 1 301.11p (7 795) 1 300p 37 422<br />
Rudy Markham NV 42 267 13 089 €19.10 (13 611) €18.37 41 745<br />
PLC 42 845 13 329 1 301.11p (12 995) 1 300p 43 179<br />
(a) The end date of the per<strong>form</strong>ance period in respect of the c<strong>on</strong>diti<strong>on</strong>al award made in <strong>2006</strong> is 31 December 2008.<br />
(b) The c<strong>on</strong>diti<strong>on</strong>al awards made in 2003, which vested in <strong>2006</strong> were based <strong>on</strong> the TSR per<strong>form</strong>ance of <strong>Unilever</strong> (when ranked against its<br />
defined peer group) over the three-year per<strong>form</strong>ance period ending 31 December 2005. For this period, <strong>Unilever</strong> was ranked 14 out of<br />
its peer group and therefore no vesting occurred for this award in March <strong>2006</strong> and the awarded shares of the award 2003 lapsed.<br />
(c) The numbers of shares and prices have been c<strong>on</strong>verted following the share split and share c<strong>on</strong>solidati<strong>on</strong> which took place <strong>on</strong> 22 May <strong>2006</strong>.<br />
Ant<strong>on</strong>y Burgmans changed from Executive to N<strong>on</strong>-Executive Director at the 2005 AGMs and assumed his new role of N<strong>on</strong>-Executive<br />
Chairman. In his capacity as an Executive Director Ant<strong>on</strong>y Burgmans was granted c<strong>on</strong>diti<strong>on</strong>al shares under the TSR L<strong>on</strong>g-Term<br />
Incentive Plan.<br />
Below are details of the balances and vesting of shares under this Plan:<br />
C<strong>on</strong>diti<strong>on</strong>al<br />
Balance award lapsed Balance<br />
1 January 25 March 31 December<br />
<strong>2006</strong> (a) <strong>2006</strong> (a)(b) <strong>2006</strong><br />
NV 43 962 (21 780) 22 182<br />
PLC 43 814 (20 790) 23 024<br />
(a) The number of shares and prices have been c<strong>on</strong>verted following the share split and share c<strong>on</strong>solidati<strong>on</strong> which took place <strong>on</strong> 22 May <strong>2006</strong>.<br />
(b) The c<strong>on</strong>diti<strong>on</strong>al shares awarded in 2003 lapsed in March <strong>2006</strong>.<br />
In his capacity as a N<strong>on</strong>-Executive Chairman, Ant<strong>on</strong>y Burgmans does not participate in any share-based remunerati<strong>on</strong>.
Report of the Remunerati<strong>on</strong> Committee (c<strong>on</strong>tinued)<br />
Executive Directors’ c<strong>on</strong>diti<strong>on</strong>al share awards under the TSR L<strong>on</strong>g-Term Incentive Plan (c<strong>on</strong>tinued)<br />
<strong>Unilever</strong>’s positi<strong>on</strong> relative to the TSR reference group<br />
7<br />
14<br />
21<br />
2004 2005 <strong>2006</strong><br />
The reference group, including <strong>Unilever</strong>, c<strong>on</strong>sists of 21 companies. <strong>Unilever</strong>’s positi<strong>on</strong> is<br />
based <strong>on</strong> TSR over a three-year rolling period.<br />
Executive Directors’ Share Matching Plan<br />
The following c<strong>on</strong>diti<strong>on</strong>al shares were outstanding, awarded or vested during <strong>2006</strong> under the share matching plan:<br />
Balance of Balance of<br />
c<strong>on</strong>diti<strong>on</strong>al c<strong>on</strong>diti<strong>on</strong>al<br />
shares shares at<br />
at 1 January C<strong>on</strong>diti<strong>on</strong>al shares Shares vested <strong>on</strong> 31 December<br />
<strong>2006</strong> awarded in <strong>2006</strong> (a)(b) 24 March <strong>2006</strong> (a)(c) <strong>2006</strong><br />
Market Original<br />
Share No. of No. of Price at No. of price price No. of<br />
type shares (a) shares award shares at vesting at award shares<br />
Patrick Cescau NV 7 932 6 552 €19.10 (5 706) €19.15 €18.37 8 778<br />
PLC 7 770 6 671 1 301.11p (5 449) 1 298.89p 1 300p 8 992<br />
Kees van der Graaf NV 4 293 2 211 €19.10 (2 238) (d) €19.15 €18.37 4 266<br />
PLC 4 439 2 254 1 301.11p (2 299) (d) 1 298.89p 1 300p 4 394<br />
Ralph Kugler NV 4 359 2 175 €19.10 (2 703) €19.15 €18.37 3 831<br />
PLC 4 305 2 215 1 301.11p (2 584) 1 298.89p 1 300p 3 936<br />
Rudy Markham NV 6 675 2 739 €19.10 (4 482) €19.15 €18.37 4 932<br />
PLC 6 552 2 788 1 301.11p (4 269) 1 298.89p 1 300p 5 071<br />
(a) The numbers of shares and prices have been c<strong>on</strong>verted following the share split and share c<strong>on</strong>solidati<strong>on</strong> which took place <strong>on</strong> 22 May <strong>2006</strong>.<br />
(b) Each award of matching shares is c<strong>on</strong>diti<strong>on</strong>al and vests three years after the date of the award subject to certain c<strong>on</strong>diti<strong>on</strong>s. The <strong>2006</strong><br />
award was made <strong>on</strong> 21 March <strong>2006</strong> and will vest <strong>on</strong> 21 March 2009.<br />
(c) The c<strong>on</strong>diti<strong>on</strong>al shares awarded <strong>on</strong> 25 March 2003 (relating to the 2002 per<strong>form</strong>ance period) vested <strong>on</strong> 24 March <strong>2006</strong>.<br />
(d) Includes c<strong>on</strong>diti<strong>on</strong>al shares awarded in 2001: 1 041 NV (original granted at €20.97) and 1 155 PLC (original granted at 1 174p).<br />
Ant<strong>on</strong>y Burgmans changed from Executive to N<strong>on</strong>-Executive Director at the 2005 AGMs and assumed his new role of N<strong>on</strong>-Executive<br />
Chairman. In his capacity as an Executive Director Ant<strong>on</strong>y Burgmans was granted c<strong>on</strong>diti<strong>on</strong>al share under the Executive Directors’<br />
Share Plan.<br />
Below details of the balances and vesting of shares under this Plan:<br />
C<strong>on</strong>diti<strong>on</strong>al<br />
Balance shares Shares vested Balance<br />
1 January awarded 24 March 31 December<br />
<strong>2006</strong> (a) in <strong>2006</strong> (a)(b) <strong>2006</strong> (a)(c) <strong>2006</strong><br />
NV 9 909 1 743 (7 083) 4 569<br />
PLC 9 698 1 773 (6 759) 4 712<br />
(a) The number of shares and prices have been c<strong>on</strong>verted following the share split and share c<strong>on</strong>solidati<strong>on</strong> which took place <strong>on</strong> 22 May <strong>2006</strong>.<br />
(b) The award was made 21 March <strong>2006</strong> and related to the period January to May 2005. The award will vest <strong>on</strong> 21 March 2009.<br />
(c) The c<strong>on</strong>diti<strong>on</strong>al shares awarded 25 March 2003 vested <strong>on</strong> 24 March <strong>2006</strong>.<br />
In his capacity as a N<strong>on</strong>-Executive Chairman, Ant<strong>on</strong>y Burgmans does not participate in any share-based remunerati<strong>on</strong>.<br />
<strong>Unilever</strong> <str<strong>on</strong>g>Annual</str<strong>on</strong>g> Report <strong>on</strong> Form 20-F <strong>2006</strong> 57<br />
Report of the Directors (c<strong>on</strong>tinued)
Report of the Directors (c<strong>on</strong>tinued)<br />
Report of the Remunerati<strong>on</strong> Committee (c<strong>on</strong>tinued)<br />
Executive Directors’ share opti<strong>on</strong>s<br />
Details of the opti<strong>on</strong> plans under which Executive Directors and employees are able to acquire ordinary shares of NV and PLC are<br />
shown in note 29 <strong>on</strong> pages 117 to 121.<br />
Opti<strong>on</strong>s to acquire NV ordinary shares of €0.16 each and opti<strong>on</strong>s to acquire PLC ordinary shares of 3 1 ⁄ 9p each were granted, exercised,<br />
lapsed and held during <strong>2006</strong> as follows:<br />
58 <strong>Unilever</strong> <str<strong>on</strong>g>Annual</str<strong>on</strong>g> Report <strong>on</strong> Form 20-F <strong>2006</strong><br />
Opti<strong>on</strong>s outstanding Opti<strong>on</strong>s outstanding<br />
below market price above market price<br />
at 31 December <strong>2006</strong> at 31 December <strong>2006</strong><br />
Balance of Number<br />
Number<br />
of opti<strong>on</strong>s Balance of Weighted Weighted<br />
opti<strong>on</strong>s at of opti<strong>on</strong>s exercised/ opti<strong>on</strong>s at average average First Final<br />
Share 1 January granted lapsed 31 December Number exercise Number exercise exercisable expiry<br />
type <strong>2006</strong> (a) in <strong>2006</strong> in <strong>2006</strong> <strong>2006</strong> of shares price of shares price date date<br />
Patrick Cescau<br />
Executive Plan NV 269 166 – – 269 166 135 237 €17.66 133 929 €22.08 08/05/01 08/11/15<br />
Executive Plan PLC 272 967 – – 272 967 245 967 1 175p 27 000 1 483p 08/05/01 08/11/15<br />
NL All-Employee Plan NV 750 150 (b) (150) (c) 750 600 €17.53 150 €22.63 12/06/02 17/05/11<br />
UK ShareSave Plan PLC – 1 374 (d) – 1 374 1 374 1 171p – – 01/10/11 31/03/12<br />
Kees van der Graaf<br />
Executive Plan NV 135 450 – – 135 450 83 250 €18.30 52 200 €21.94 24/03/02 08/11/15<br />
Executive Plan PLC 135 450 – – 135 450 135 450 1 203p – – 24/03/02 08/11/15<br />
NL All-Employee Plan NV 750 150 (b) (150) (c) 750 600 €17.53 150 €22.63 12/06/02 17/05/11<br />
UK ShareSave Plan PLC 1 374 – – 1 374 1 374 1 202p – – 01/10/10 31/03/11<br />
Ralph Kugler<br />
Executive Plan NV 176 625 – – 176 625 120 600 €18.19 56 025 €22.04 24/03/02 20/03/15<br />
Executive Plan PLC 176 625 – – 176 625 176 625 1 163p – – 24/03/02 20/03/15<br />
NL All-Employee Plan NV 150 150 (b) – 300 300 €17.59 – – 18/05/05 17/05/11<br />
UK ShareSave Plan PLC 1 374 – – 1 374 1 374 1 202p – – 01/10/10 31/03/11<br />
Rudy Markham<br />
Executive Plan NV 264 150 – (27 000) (e) 237 150 130 500 €17.60 106 650 €22.21 08/05/01 20/03/15<br />
Executive Plan PLC 278 682 – (41 532) (f)(g) 237 150 203 400 1 167p 33 750 1 483p 08/05/01 20/03/15<br />
NL All-Employee Plan NV 750 150 (b) (150) (c) 750 600 €17.53 150 €22.63 12/06/02 17/05/11<br />
UK ShareSave Plan PLC 1 373 – – 1 373 1 373 1 190p – – 01/10/09 31/03/10<br />
(a) The number of shares and the share prices have been c<strong>on</strong>verted following the share split and share c<strong>on</strong>solidati<strong>on</strong> which took place <strong>on</strong><br />
22 May <strong>2006</strong>.<br />
(b) Grants made under the Dutch All-Employee Opti<strong>on</strong> Plan <strong>on</strong> 18 May <strong>2006</strong> at an opti<strong>on</strong> price of €17.50.<br />
(c) Opti<strong>on</strong>s lapsed without value <strong>on</strong> 30 May <strong>2006</strong>.<br />
(d) Grants made under the UK All-Employee ShareSave Plan <strong>on</strong> 3 July <strong>2006</strong> at an opti<strong>on</strong> price of 1 171p.<br />
(e) Opti<strong>on</strong>s exercised <strong>on</strong> 1 December <strong>2006</strong> at a market price of €19.97. The opti<strong>on</strong>s had originally been granted <strong>on</strong> 2 June 1997 at a price<br />
(after taking into account the share split in May <strong>2006</strong>) of €14.26.<br />
(f) Opti<strong>on</strong>s in respect of 14 532 shares exercised <strong>on</strong> 2 June <strong>2006</strong> at a market price of 1 188p. The opti<strong>on</strong>s had originally been granted <strong>on</strong><br />
6 December 1996 at a price (after taking into account the share c<strong>on</strong>solidati<strong>on</strong> in May <strong>2006</strong>) of 762p.<br />
(g) Opti<strong>on</strong>s in respect of 27 000 shares exercised <strong>on</strong> 1 December <strong>2006</strong> at a market price of 1 363p. The opti<strong>on</strong>s had originally been granted<br />
<strong>on</strong> 2 June 1997 at a price (after taking into account the share c<strong>on</strong>solidati<strong>on</strong> in May <strong>2006</strong>) of 904p.<br />
The value, calculated in accordance with an adjusted Black-Scholes pricing method in respect of opti<strong>on</strong>s granted in <strong>2006</strong> to the current<br />
Executive Directors was as follows: Patrick Cescau €6 155; Kees van der Graaf €432; Ralph Kugler €432; and Rudy Markham €432.<br />
The term ‘Executive Plan’ refers to opti<strong>on</strong>s granted under the PLC or NV Executive Opti<strong>on</strong> Plans.<br />
The closing market prices of ordinary shares at 31 December <strong>2006</strong> were €20.70 (NV shares) and 1 428p (PLC shares). During <strong>2006</strong> the highest<br />
market prices were €20.84 and 1 428p respectively, and the lowest market prices were €16.53 and 1 125p respectively.<br />
Ant<strong>on</strong>y Burgmans changed from Executive to N<strong>on</strong>-Executive Director at the 2005 AGMs and assumed his new role of N<strong>on</strong>-Executive Chairman.<br />
In his capacity as an Executive Director Ant<strong>on</strong>y Burgmans was granted share opti<strong>on</strong>s under the Executive Plan and the Dutch All-Employee Plan.<br />
Below are details of his outstanding opti<strong>on</strong>s under the Opti<strong>on</strong> plans:<br />
Number<br />
Balance of Number of opti<strong>on</strong>s Balance of Balance Weighted Balance Weighted<br />
opti<strong>on</strong>s at of opti<strong>on</strong>s exercised/ opti<strong>on</strong>s at below average above average First Final<br />
Share 1 January granted lapsed 31 December market exercise market exercise exercisable expiry<br />
Plan type <strong>2006</strong> in <strong>2006</strong> in <strong>2006</strong> <strong>2006</strong> price price price price date date<br />
Executive Opti<strong>on</strong> NV 316 800 – – 316 800 203 400 €17.61 113 400 €21.78 24/03/02 13/02/09<br />
Executive Opti<strong>on</strong> PLC 316 800 – – 316 800 316 800 1 163p – – 24/03/02 13/02/09<br />
NL All-Employee Plan 600 – (150) (a) 450 300 €17.47 150 €22.63 12/06/02 12/05/09<br />
(a) Opti<strong>on</strong>s lapsed without value <strong>on</strong> 30 May <strong>2006</strong>.<br />
In his capacity as a N<strong>on</strong>-Executive Chairman, Ant<strong>on</strong>y Burgmans does not participate in any share-based remunerati<strong>on</strong>.
Report of the Remunerati<strong>on</strong> Committee (c<strong>on</strong>tinued)<br />
Executive Directors’ pensi<strong>on</strong>s (a)<br />
Pensi<strong>on</strong> values for the year ended 31 December <strong>2006</strong> are set out below.<br />
Increase<br />
Increase in Transfer in transfer Transfer<br />
accrued value of value during Individual value of<br />
Accrued pensi<strong>on</strong> Accrued accrued <strong>2006</strong> (less c<strong>on</strong>tributi<strong>on</strong>s accrued<br />
pensi<strong>on</strong> at during pensi<strong>on</strong> at pensi<strong>on</strong> at individual made during pensi<strong>on</strong> at<br />
Age at 31/12/05 (b) <strong>2006</strong> (c) 31/12/06 (b) 31/12/05 (d) c<strong>on</strong>tributi<strong>on</strong>s) (e) <strong>2006</strong> (f) 31/12/06 (d)<br />
Name and base country 31/12/06 €’000 pa €’000 pa €’000 pa €’000 €’000 €’000 €’000<br />
Patrick Cescau (UK) 58 933 67 1 000 16 770 1 874 18 18 662<br />
Kees van der Graaf (g) (NL) 56 538 64 602 6 942 1 147 9 8 098<br />
Ralph Kugler (UK) 50 396 45 441 5 411 862 10 6 283<br />
Rudy Markham (UK) 60 752 41 793 15 147 741 21 15 909<br />
(a) Figures have been translated into euros where necessary using the following exchange rates: 31 December 2005 €1.00 = £0.6864;<br />
31 December <strong>2006</strong> €1.00 = £0.6712; Average for the year ended 31 December <strong>2006</strong> €1.00 = £0.6818.<br />
(b) Based <strong>on</strong> the Executive Directors’ current pensi<strong>on</strong> letters and calculated <strong>on</strong> a deferred basis using the Executive Directors’ service to<br />
31 December 2005 and 31 December <strong>2006</strong> respectively <strong>on</strong> the basis that the Executive Directors remain in service until at least age 60<br />
and that the pensi<strong>on</strong> payment commences at that time. It includes all pensi<strong>on</strong>s provided from <strong>Unilever</strong> pensi<strong>on</strong> plans. In the event that<br />
an Executive Director leaves service prior to age 60 and the payment of pensi<strong>on</strong> commences earlier than age 60, the pensi<strong>on</strong> payable<br />
would be <strong>on</strong> a reduced basis.<br />
(c) Includes the effect of inflati<strong>on</strong> <strong>on</strong> the accrued pensi<strong>on</strong> at 31 December 2005.<br />
(d) For the Netherlands-based Executive Directors’ arrangement calculated <strong>on</strong> the basis used by the <strong>Unilever</strong> Netherlands pensi<strong>on</strong> plan<br />
(‘Progress’), as prescribed by the Netherlands Ministry of Social Affairs and Employment. For the UK-based Executive Directors’ arrangement<br />
calculated <strong>on</strong> the market related basis used by <strong>Unilever</strong> United Kingdom pensi<strong>on</strong> plan (UUKPF), in line with the GN11 guidance note<br />
published by the Institute and Faculty of Actuaries in the United Kingdom.<br />
(e) The increase in transfer value during <strong>2006</strong> includes the effect of salary increases and additi<strong>on</strong>al service together with exchange rate<br />
movements (for pensi<strong>on</strong>s denominated in currencies other than Euro) and the Executive Directors being <strong>on</strong>e year closer to retirement.<br />
(f) C<strong>on</strong>sistent with other Netherlands and UK-based employees, the rate of individual c<strong>on</strong>tributi<strong>on</strong>s in the Netherlands is 1% of pensi<strong>on</strong>able<br />
salary and in the UK 5% of pensi<strong>on</strong>able salary (above the relevant thresholds). In line with the treatment adopted for other UK-based<br />
employees, individual c<strong>on</strong>tributi<strong>on</strong>s paid by Executive Directors’ in the UK are now paid through a salary sacrifice arrangement. Individual<br />
c<strong>on</strong>tributi<strong>on</strong>s shown above represent the c<strong>on</strong>tributi<strong>on</strong>s paid before the change to salary sacrifice.<br />
(g) C<strong>on</strong>sistent with the treatment adopted for other Netherlands-based employees, the increase in pensi<strong>on</strong> accrued during the year includes<br />
the impact of the changes to the <strong>Unilever</strong> Netherlands pensi<strong>on</strong> plan.<br />
The Listing Rules of the Financial Services Authority are different from the Directors’ Remunerati<strong>on</strong> Report Regulati<strong>on</strong>s 2002 and<br />
require the following disclosures for defined benefit pensi<strong>on</strong> plans which are calculated <strong>on</strong> an alternative basis to those disclosed in<br />
the table above:<br />
• Increase (or decrease) in accrued pensi<strong>on</strong> during <strong>2006</strong> (excluding the effect of inflati<strong>on</strong> <strong>on</strong> the accrued pensi<strong>on</strong> at 31 December<br />
2005): Patrick Cescau €33 000; Kees van der Graaf €56 000; Ralph Kugler €10 000; Rudy Markham €(4 000); and<br />
• Transfer value at 31 December <strong>2006</strong> of the increase (or decrease) in accrued pensi<strong>on</strong> during <strong>2006</strong> (excluding the effect of inflati<strong>on</strong><br />
<strong>on</strong> the accrued pensi<strong>on</strong> at 31 December 2005 and less individual c<strong>on</strong>tributi<strong>on</strong>s): Patrick Cescau €605 000; Kees van der Graaf<br />
€754 000; Ralph Kugler €134 000; Rudy Markham €(110 000).<br />
The Dutch Corporate Governance Code requires the following disclosure of pensi<strong>on</strong> service costs charged to operating profit: Patrick<br />
Cescau €842 000; Kees van der Graaf €258 000; Ralph Kugler €299 000; Rudy Markham €167 000.<br />
The accrued pensi<strong>on</strong> of Ant<strong>on</strong>y Burgmans at 1 June <strong>2006</strong> (the date his pensi<strong>on</strong> payment commenced) was €1 136 000; increase in<br />
accrued pensi<strong>on</strong> during the year €22 000 (€21 000 excluding inflati<strong>on</strong>); transfer value of the increase in accrued pensi<strong>on</strong> during the<br />
year (less individual c<strong>on</strong>tributi<strong>on</strong>s) €652 000 (€337 000 excluding inflati<strong>on</strong>); individual c<strong>on</strong>tributi<strong>on</strong>s made during the year €10 000;<br />
pensi<strong>on</strong> cost charged to operating profit €621 000.<br />
<strong>Unilever</strong> <str<strong>on</strong>g>Annual</str<strong>on</strong>g> Report <strong>on</strong> Form 20-F <strong>2006</strong> 59<br />
Report of the Directors (c<strong>on</strong>tinued)
Report of the Directors (c<strong>on</strong>tinued)<br />
Report of the Remunerati<strong>on</strong> Committee (c<strong>on</strong>tinued)<br />
Executive Directors’ interests – share capital<br />
The interests in the share capitals of NV and PLC and their group companies of those who were Executive Directors at 31 December<br />
<strong>2006</strong> and of their immediate families were as shown in the table below:<br />
Shares held at Shares held at<br />
1 January <strong>2006</strong> 31 December <strong>2006</strong><br />
(excluding unvested (excluding unvested<br />
Name Share type (a) matching shares) (b) matching shares)<br />
Patrick Cescau (c) NV 69 351 85 059<br />
PLC 40 230 52 347<br />
Kees van der Graaf NV 18 708 23 157<br />
PLC 12 037 16 718<br />
Ralph Kugler NV 41 628 45 396<br />
PLC 16 264 20 124<br />
Rudy Markham NV 127 044 161 265<br />
PLC 64 606 113 329<br />
(a) NV shares are ordinary €0.16 shares and PLC shares are ordinary 3 1 ⁄9p shares.<br />
(b) The numbers have been c<strong>on</strong>verted into the new denominati<strong>on</strong> following the NV/PLC share split and share c<strong>on</strong>solidati<strong>on</strong> which took place<br />
<strong>on</strong> 22 May <strong>2006</strong>.<br />
(c) Balances include under NV 38 715 NV New York shares and under PLC 10 220 PLC ADRs.<br />
The Executive Directors, in comm<strong>on</strong> with other employees of PLC and its United Kingdom subsidiaries, had beneficial interests in<br />
19 454 453 PLC ordinary shares at 1 January <strong>2006</strong> (c<strong>on</strong>verted into the new denominati<strong>on</strong> following the shares split and c<strong>on</strong>solidati<strong>on</strong>)<br />
and 16 678 871 PLC ordinary shares at 31 December <strong>2006</strong>, acquired by the <strong>Unilever</strong> Employee Share Trust (Jersey) for the purpose of<br />
satisfying opti<strong>on</strong>s and vesting of shares under various group share plans (including the PLC Executive Opti<strong>on</strong> Plans and the UK<br />
Employee ShareSave Plan). Further in<strong>form</strong>ati<strong>on</strong>, including details of the NV and PLC ordinary shares acquired by certain group<br />
companies in c<strong>on</strong>necti<strong>on</strong> with other share-based compensati<strong>on</strong> plans, is given in note 29 <strong>on</strong> pages 117 to 121.<br />
The voting rights of the Directors who hold interests in the share capitals of NV and PLC are the same as for other holders of the class<br />
of shares indicated. N<strong>on</strong>e of the Directors’ or other executive officers’ shareholdings amounts to more than 1% of the issued shares in<br />
that class of share. Except as stated above, all shareholdings are beneficial.<br />
The <strong>on</strong>ly changes in the interests of the Executive Directors and their families in NV and PLC ordinary shares between 31 December<br />
<strong>2006</strong> and 1 March 2007 were that:<br />
• The holding of the <strong>Unilever</strong> Employee Share Trust (Jersey) has reduced to 16 313 295 PLC ordinary shares; and<br />
• Kees van der Graaf, Ralph Kugler and Rudy Markham each acquired further interests in 18 PLC ordinary shares during January and<br />
February due to m<strong>on</strong>thly ShareBuy purchases.<br />
60 <strong>Unilever</strong> <str<strong>on</strong>g>Annual</str<strong>on</strong>g> Report <strong>on</strong> Form 20-F <strong>2006</strong>
Report of the Remunerati<strong>on</strong> Committee (c<strong>on</strong>tinued)<br />
N<strong>on</strong>-Executive Directors’ remunerati<strong>on</strong><br />
The total fees payable to each N<strong>on</strong>-Executive Director in <strong>2006</strong> are set out below:<br />
€ €<br />
Total fees paid Total fees paid<br />
Current N<strong>on</strong>-Executive Directors in <strong>2006</strong> (a) in 2005 (a)<br />
Le<strong>on</strong> Brittan (b) 82 712 67 102<br />
Ant<strong>on</strong>y Burgmans (c) 299 614 –<br />
Lynda Chalker (d) 94 403 80 415<br />
Wim Dik (b)(e) 84 663 67 102<br />
Charles Golden (e)(f)(g) 89 478 n/a<br />
Byr<strong>on</strong> Grote (e)(f) 60 311 n/a<br />
David Sim<strong>on</strong> (h) 109 735 67 102<br />
Jean-Cyril Spinetta (f)(i) 60 311 n/a<br />
Kees Storm (f)(j) 75 137 n/a<br />
Jeroen van der Veer (i) 82 712 67 102<br />
Former N<strong>on</strong>-Executive Directors<br />
Bertrand Collomb (k)(l) 42 001 100 654<br />
Oscar Fanjul (e)(l) 28 000 67 102<br />
Hilmar Kopper (j)(l) 33 557 80 415<br />
(a) Covers fees and allowances received from both NV and PLC.<br />
(b) Member of the Corporate Resp<strong>on</strong>sibility and Reputati<strong>on</strong> Committee.<br />
(c) Chairman NV and PLC, and Nominati<strong>on</strong> Committee member. Received fee as Chairman since June <strong>2006</strong>.<br />
(d) Chairman of the Corporate Resp<strong>on</strong>sibility and Reputati<strong>on</strong> Committee.<br />
(e) Member of the Audit Committee.<br />
(f) Appointed at <strong>2006</strong> AGMs.<br />
(g) Total fees include €29 167 allowance for travel from outside Europe.<br />
(h) Senior Independent Director, Vice Chairman and Chairman of the Remunerati<strong>on</strong> and Nominati<strong>on</strong> Committees as from <strong>2006</strong> AGMs.<br />
Until <strong>2006</strong> AGMs member of the Nominati<strong>on</strong> and Remunerati<strong>on</strong> Committees.<br />
(i) Member of the Nominati<strong>on</strong> and Remunerati<strong>on</strong> Committees.<br />
(j) Chairman of the Audit Committee.<br />
(k) Senior Independent Director, Vice Chairman and Chairman of the Remunerati<strong>on</strong> and Nominati<strong>on</strong> Committees until <strong>2006</strong> AGMs.<br />
(l) Stepped down at the <strong>2006</strong> AGMs.<br />
<strong>Unilever</strong> <str<strong>on</strong>g>Annual</str<strong>on</strong>g> Report <strong>on</strong> Form 20-F <strong>2006</strong> 61<br />
Report of the Directors (c<strong>on</strong>tinued)
Report of the Directors (c<strong>on</strong>tinued)<br />
Report of the Remunerati<strong>on</strong> Committee (c<strong>on</strong>tinued)<br />
N<strong>on</strong>-Executive Directors’ interests – share capital<br />
The interests in the share capitals of NV and PLC and their group companies of those who were N<strong>on</strong>-Executive Directors as at<br />
31 December <strong>2006</strong> (including those of their immediate families) were as shown below:<br />
Shares held at Shares held at<br />
Name Share type (a) 1 January <strong>2006</strong> (b) 31 December <strong>2006</strong><br />
Le<strong>on</strong> Brittan NV – –<br />
PLC – –<br />
Ant<strong>on</strong>y Burgmans NV 133 848 137 334<br />
PLC 58 511 62 054<br />
Lynda Chalker NV – –<br />
PLC 1 136 1 136<br />
Wim Dik NV – –<br />
PLC – –<br />
Charles Golden NV – –<br />
PLC – –<br />
Byr<strong>on</strong> Grote NV 3 000 (c)(d) 3 000 (d)<br />
PLC 1 800 (c)(e) 1 800 (e)<br />
David Sim<strong>on</strong> NV – –<br />
PLC 1 421 1 492<br />
Jean-Cyril Spinetta NV – –<br />
PLC – –<br />
Kees Storm NV – –<br />
PLC – –<br />
Jeroen van der Veer NV 16 800 16 800<br />
PLC – –<br />
(a) NV shares are ordinary €0.16 shares and PLC shares are ordinary 3 1 ⁄9p shares.<br />
(b) The numbers have been c<strong>on</strong>verted into the new denominati<strong>on</strong> following the share split and share c<strong>on</strong>solidati<strong>on</strong> which took place <strong>on</strong><br />
22 May <strong>2006</strong>.<br />
(c) Balance at date of appointment at the AGMs in May <strong>2006</strong>.<br />
(d) Held in the <strong>form</strong> of NV New York shares.<br />
(e) Held in the <strong>form</strong> of PLC ADRs.<br />
There were no changes in the interests of the N<strong>on</strong>-Executive Directors and their immediate families in NV and PLC ordinary shares<br />
between 31 December <strong>2006</strong> and 1 March 2007.<br />
The Report has been approved by the Boards and has been signed <strong>on</strong> their behalf by the Joint Secretaries, J A A van der Bijl and S G Williams.<br />
By order of the Boards<br />
J A A van der Bijl<br />
S G Williams<br />
Joint Secretaries of <strong>Unilever</strong> N.V. and <strong>Unilever</strong> PLC<br />
6March 2007<br />
62 <strong>Unilever</strong> <str<strong>on</strong>g>Annual</str<strong>on</strong>g> Report <strong>on</strong> Form 20-F <strong>2006</strong>
Report of the Audit Committee<br />
The role of the Audit Committee is to assist the <strong>Unilever</strong> Boards in<br />
fulfilling their oversight resp<strong>on</strong>sibilities regarding the integrity of<br />
<strong>Unilever</strong>’s financial statements, risk management and internal<br />
c<strong>on</strong>trol, compliance with legal and regulatory requirements, the<br />
external auditors’ per<strong>form</strong>ance, qualificati<strong>on</strong>s and independence,<br />
and the per<strong>form</strong>ance of the internal audit functi<strong>on</strong>. During the<br />
year ended 31 December <strong>2006</strong> the principal activities of the<br />
Committee were as follows:<br />
Financial statements<br />
The Committee c<strong>on</strong>sidered <str<strong>on</strong>g>report</str<strong>on</strong>g>s from the Chief Financial<br />
Officer <strong>on</strong> the quarterly and annual financial statements and<br />
reviewed the <str<strong>on</strong>g>Annual</str<strong>on</strong>g> Report and Accounts and <str<strong>on</strong>g>Annual</str<strong>on</strong>g> Report<br />
<strong>on</strong> Form 20-F prior to publicati<strong>on</strong>.<br />
Audit of the <str<strong>on</strong>g>Annual</str<strong>on</strong>g> Accounts<br />
PricewaterhouseCoopers, <strong>Unilever</strong>’s external auditors, <str<strong>on</strong>g>report</str<strong>on</strong>g>ed in<br />
depth to the Committee <strong>on</strong> the scope and outcome of the annual<br />
audit. Their <str<strong>on</strong>g>report</str<strong>on</strong>g>s included accounting matters, governance and<br />
c<strong>on</strong>trol, and accounting developments.<br />
Risk management and internal c<strong>on</strong>trol arrangements<br />
The Committee reviewed <strong>Unilever</strong>'s overall approach to risk<br />
management and c<strong>on</strong>trol, and its processes, outcomes and<br />
disclosure, including specifically:<br />
• review of level of disclosure in quarterly financial results<br />
announcements;<br />
• review of accounting principles and judgements with respect<br />
to financial statements;<br />
• review of management’s risk assessments in relati<strong>on</strong> to the NV<br />
preference shares issued in 1999;<br />
• Corporate Audit’s interim and year-end <str<strong>on</strong>g>report</str<strong>on</strong>g>s <strong>on</strong> the Status of<br />
Risk Management and C<strong>on</strong>trol, and management’s resp<strong>on</strong>se;<br />
• annual <str<strong>on</strong>g>report</str<strong>on</strong>g> from the Chief Financial Officer <strong>on</strong> business risks and<br />
positive assurance <strong>on</strong> operating c<strong>on</strong>trols and corporate policies; and<br />
a quarterly review of business risks and safeguards;<br />
• the interim and year-end <str<strong>on</strong>g>report</str<strong>on</strong>g>s from the Code of Business<br />
Principles Compliance Committee;<br />
• m<strong>on</strong>itoring the resoluti<strong>on</strong> of complaints received through the<br />
global Ethics hotline which included a procedure for handling<br />
complaints and c<strong>on</strong>cerns relating to accounting, internal c<strong>on</strong>trol<br />
and auditing matters;<br />
• quarterly review of progress of the implementati<strong>on</strong> of the<br />
requirements under Secti<strong>on</strong> 404 of the Sarbanes-Oxley Act of<br />
2002 with respect to internal c<strong>on</strong>trols over financial <str<strong>on</strong>g>report</str<strong>on</strong>g>ing;<br />
• review of the applicati<strong>on</strong> of in<strong>form</strong>ati<strong>on</strong> and communicati<strong>on</strong><br />
technology;<br />
• a review of the annual pensi<strong>on</strong> <str<strong>on</strong>g>report</str<strong>on</strong>g> and pensi<strong>on</strong>s related<br />
accounting and proposals;<br />
• annual review of anti-fraud arrangements;<br />
• a review of tax planning policy; and<br />
• review of treasury policies and c<strong>on</strong>siderati<strong>on</strong> of proposals<br />
relating to capital injecti<strong>on</strong>, debt issuance, investment hedge<br />
and dividends.<br />
External auditors<br />
The Audit Committee c<strong>on</strong>ducted a <strong>form</strong>al evaluati<strong>on</strong> of the<br />
effectiveness of the external audit process and carried out a <strong>form</strong>al<br />
review of the appointment of external auditors in October <strong>2006</strong>.<br />
The Committee has approved the extensi<strong>on</strong> of the current external<br />
audit c<strong>on</strong>tract by <strong>on</strong>e year, and recommended to the Boards the<br />
reappointment of the external auditors. On the recommendati<strong>on</strong><br />
of the Audit Committee, the Directors will be proposing the<br />
reappointment of PricewaterhouseCoopers at the AGMs in<br />
May 2007.<br />
Both <strong>Unilever</strong> and the auditors have for many years had safeguards<br />
in place to avoid the possibility that the auditors’ objectivity<br />
and independence could be compromised. The Committee<br />
reviewed the <str<strong>on</strong>g>report</str<strong>on</strong>g> from PricewaterhouseCoopers <strong>on</strong> the acti<strong>on</strong>s<br />
they take to comply with the professi<strong>on</strong>al and regulatory<br />
requirements and best practice designed to ensure their<br />
independence from <strong>Unilever</strong>. The UK lead partner in charge of the<br />
audit, who was appointed in 2001, rotated off at the <strong>2006</strong> AGM<br />
and a new lead partner was appointed in May <strong>2006</strong>, and assumed<br />
resp<strong>on</strong>sibility for the audit of the <strong>2006</strong> accounts.<br />
The committee also reviewed the statutory audit, other audit,<br />
tax and other services provided by PricewaterhouseCoopers, and<br />
compliance with <strong>Unilever</strong>’s policy, which prescribes in detail the<br />
types of engagements for which the external auditors can and<br />
cannot be used:<br />
• statutory audit services – as detailed above, including audit of<br />
subsidiaries;<br />
• other audit services – work which regulati<strong>on</strong>s or agreements<br />
with third parties require the auditors to undertake e.g. in<br />
c<strong>on</strong>necti<strong>on</strong> with borrowings and shareholder services;<br />
• other services – statutory auditors may carry out work that they<br />
are best placed to undertake, including internal c<strong>on</strong>trol reviews;<br />
• acquisiti<strong>on</strong> and disposal services – where the auditors are best<br />
placed to do this work;<br />
• tax services – all significant tax c<strong>on</strong>sulting work is put to tender,<br />
except where the auditors are best placed to do this; and<br />
• general c<strong>on</strong>sulting – external auditors may not tender for<br />
general c<strong>on</strong>sulting work.<br />
All engagements over €100,000 require specific advance approval<br />
of the Audit Committee Chairman. The overall policy is regularly<br />
reviewed and updated in the light of internal developments,<br />
external developments and best practice.<br />
The Committee held independent meetings with the external<br />
auditors during the year.<br />
Internal audit functi<strong>on</strong><br />
The Committee engaged in discussi<strong>on</strong> and review of the<br />
Corporate Audit Department’s audit plan for the year, and<br />
approved its budget and resource requirements.<br />
The Committee carried out a <strong>form</strong>al evaluati<strong>on</strong> of the<br />
per<strong>form</strong>ance of the internal audit functi<strong>on</strong> and c<strong>on</strong>firmed that<br />
they were satisfied with their relati<strong>on</strong>ship with the Chief Auditor.<br />
The Committee held independent meetings with the Chief Auditor<br />
during the year.<br />
Audit Committee terms of reference<br />
The Audit Committee’s terms of reference can be viewed <strong>on</strong><br />
<strong>Unilever</strong>’s website at www.unilever.com or supplied <strong>on</strong> request.<br />
In February <strong>2006</strong>, the terms of reference were updated to reflect<br />
requirements under the Dutch Corporate Governance Code that<br />
the Audit Committee has oversight of the policy of the Group <strong>on</strong><br />
tax planning, the financing of the Group, and the applicati<strong>on</strong>s of<br />
in<strong>form</strong>ati<strong>on</strong> and communicati<strong>on</strong> technology.<br />
The Audit Committee carried out a self-assessment of its own<br />
per<strong>form</strong>ance.<br />
Kees Storm Chairman of the Audit Committee<br />
Wim Dik<br />
Charles Golden<br />
Byr<strong>on</strong> Grote<br />
<strong>Unilever</strong> <str<strong>on</strong>g>Annual</str<strong>on</strong>g> Report <strong>on</strong> Form 20-F <strong>2006</strong> 63<br />
Report of the Directors (c<strong>on</strong>tinued)
Report of the Directors (c<strong>on</strong>tinued)<br />
Report of the Corporate Resp<strong>on</strong>sibility and Reputati<strong>on</strong> Committee<br />
Terms of reference<br />
In <strong>2006</strong>, the Committee revised its name and terms of reference<br />
and made the following adjustments:<br />
• the members of the Committee will include the Executive<br />
Director who chairs the Corporate Resp<strong>on</strong>sibility Council;<br />
• the Committee has oversight of and will make<br />
recommendati<strong>on</strong>s to the Boards <strong>on</strong> <strong>Unilever</strong>’s c<strong>on</strong>duct with<br />
regard to corporate and societal obligati<strong>on</strong>s and its reputati<strong>on</strong><br />
as a resp<strong>on</strong>sible corporate citizen;<br />
• it will ensure that appropriate communicati<strong>on</strong>s policies are in<br />
place and working effectively to build and protect <strong>Unilever</strong>’s<br />
reputati<strong>on</strong> internally and externally; and<br />
• it will provide oversight and guidance <strong>on</strong> the envir<strong>on</strong>mental<br />
and social impact of how <strong>Unilever</strong> c<strong>on</strong>ducts its business.<br />
The full text of the Committee’s terms of reference can be found<br />
<strong>on</strong> <strong>Unilever</strong>’s website at www.unilever.com.<br />
Meetings<br />
In its four meetings held in <strong>2006</strong>, the Committee focused <strong>on</strong><br />
a review of its terms of reference, implementati<strong>on</strong> of <strong>Unilever</strong>’s<br />
Code of Business Principles and its supplier code, corporate<br />
resp<strong>on</strong>sibility strategy as defined by the newly established<br />
Corporate Resp<strong>on</strong>sibility Council (c<strong>on</strong>sisting of executive<br />
members from supply chain, SEAC, communicati<strong>on</strong>s and regi<strong>on</strong>al<br />
representatives), <strong>Unilever</strong>’s role in the Investment Climate Facility<br />
for Africa and policy issues such as biofuels.<br />
The Committee welcomed the visibility and importance given to<br />
the Code by Executive Directors as an important mechanism to<br />
ensure that <strong>Unilever</strong> operates as a good corporate citizen. The<br />
Committee reviewed the programme for further embedding of<br />
the code in <strong>Unilever</strong>’s business operati<strong>on</strong>s, including the training<br />
module to keep the code alive and understood.<br />
<strong>Unilever</strong>’s lead role in the Investment Climate Facility for Africa,<br />
launched at the World Ec<strong>on</strong>omic Forum in Cape Town in June,<br />
was discussed. This initiative is supported by several companies,<br />
64 <strong>Unilever</strong> <str<strong>on</strong>g>Annual</str<strong>on</strong>g> Report <strong>on</strong> Form 20-F <strong>2006</strong><br />
governments, the EU Commissi<strong>on</strong> and the World Bank. <strong>Unilever</strong>’s<br />
commitment to help drive development and growth in Africa<br />
through public/private partnerships was fully endorsed.<br />
The Committee noted good progress made <strong>on</strong> redefining<br />
<strong>Unilever</strong>’s corporate envir<strong>on</strong>mental strategy.<br />
The important role and impact that values-led product brands<br />
have <strong>on</strong> the health and prosperity of the communities <strong>Unilever</strong><br />
serve was discussed and the CEO leadership role recognised<br />
(Social Innovati<strong>on</strong>: How values-led brands are helping to drive<br />
business strategy, speech by Patrick Cescau, available <strong>on</strong> <strong>Unilever</strong>’s<br />
website at www.unilever.com).<br />
Policy issues discussed included <strong>Unilever</strong>’s strategy <strong>on</strong> biofuels.<br />
First generati<strong>on</strong> biofuels are made from rapeseed oil and other<br />
ingredients generally used for food, while sec<strong>on</strong>d generati<strong>on</strong><br />
biofuels are made from materials including wood, straw, pulp and<br />
waste. Members supported <strong>Unilever</strong>’s positi<strong>on</strong> to improve energy<br />
efficiency and set targets for the use of renewable energy with<br />
the aim of combating climate change causes. Members also<br />
agreed that biofuels can play an important role as an alternative<br />
energy provided they meet the criteria of being sustainable,<br />
efficient and not having a negative impact <strong>on</strong> public health. It was<br />
agreed that sec<strong>on</strong>d generati<strong>on</strong> biofuels would meet these criteria.<br />
<strong>Unilever</strong> should develop a strategy geared towards promoting that<br />
more resource, particularly in R&D, be allocated to accelerating<br />
the introducti<strong>on</strong> of sec<strong>on</strong>d generati<strong>on</strong> biofuels and other<br />
sustainable, cost-effective sources of renewable energy.<br />
Lynda Chalker Chair of the Corporate Resp<strong>on</strong>sibility and<br />
Reputati<strong>on</strong> Committee<br />
Le<strong>on</strong> Brittan<br />
Ant<strong>on</strong>y Burgmans<br />
Wim Dik<br />
Ralph Kugler Executive Director
Financial statements<br />
C<strong>on</strong>tents<br />
Statement of Directors’ resp<strong>on</strong>sibilities<br />
Management’s <str<strong>on</strong>g>report</str<strong>on</strong>g> <strong>on</strong> internal c<strong>on</strong>trol<br />
66<br />
over financial <str<strong>on</strong>g>report</str<strong>on</strong>g>ing 68<br />
Auditors’ <str<strong>on</strong>g>report</str<strong>on</strong>g> 69<br />
C<strong>on</strong>solidated income statement 70<br />
C<strong>on</strong>solidated statement of recognised income and expense 71<br />
C<strong>on</strong>solidated balance sheet 72<br />
C<strong>on</strong>solidated cash flow statement 73<br />
Notes to the c<strong>on</strong>solidated accounts 74<br />
1 Accounting in<strong>form</strong>ati<strong>on</strong> and policies 74<br />
2 Segment in<strong>form</strong>ati<strong>on</strong> 79<br />
3 Gross profit and operating costs 83<br />
4 Staff costs 84<br />
5 Net finance costs 84<br />
6 Taxati<strong>on</strong> 85<br />
7 Combined earnings per share 87<br />
8 Dividends <strong>on</strong> ordinary capital 88<br />
9 Goodwill and intangible assets 88<br />
10 Property, plant and equipment 90<br />
11 Other n<strong>on</strong>-current assets 92<br />
12 Deferred taxati<strong>on</strong> 93<br />
13 Inventories 94<br />
14 Trade and other receivables 94<br />
15 Cash and cash equivalents and other financial assets 95<br />
16 Borrowings 96<br />
17 Financial instruments and treasury risk management 99<br />
18 Trade payables and other liabilities 102<br />
19 Provisi<strong>on</strong>s 102<br />
20 Pensi<strong>on</strong>s and similar obligati<strong>on</strong>s 103<br />
21 Equity 108<br />
22 Share capital 109<br />
23 Other reserves 110<br />
24 Retained profit 111<br />
25 Commitments and c<strong>on</strong>tingent liabilities 112<br />
26 Acquisiti<strong>on</strong>s and disposals 113<br />
27 Assets held for sale and disc<strong>on</strong>tinued operati<strong>on</strong>s<br />
28Rec<strong>on</strong>ciliati<strong>on</strong> of net profit to cash flow from<br />
114<br />
operating activities 116<br />
29 Share-based compensati<strong>on</strong> plans 117<br />
30 Related party transacti<strong>on</strong>s 122<br />
31Key management pers<strong>on</strong>nel 122<br />
32 Remunerati<strong>on</strong> of auditors 123<br />
33 Events after the balance sheet date 123<br />
34 Divergences from United States GAAP 124<br />
35 Additi<strong>on</strong>al in<strong>form</strong>ati<strong>on</strong> for US investors 132<br />
Selected ffinancial data 141<br />
Principal group companies and n<strong>on</strong>-current investments 147<br />
<strong>Unilever</strong> <str<strong>on</strong>g>Annual</str<strong>on</strong>g> Report <strong>on</strong> Form 20-F <strong>2006</strong> 65<br />
Financial Statements
Financial Statements (c<strong>on</strong>tinued)<br />
Statement of Directors’ resp<strong>on</strong>sibilities<br />
<str<strong>on</strong>g>Annual</str<strong>on</strong>g> accounts<br />
The Directors are required by Title 9, Book 2 of the Civil Code in<br />
the Netherlands and the United Kingdom Companies Act 1985<br />
to prepare accounts for each financial year which give a true and<br />
fair view of the state of affairs of the <strong>Unilever</strong> Group, and the NV<br />
and PLC entities as at the end of the financial year and of the<br />
profit or loss and cash flows for that year.<br />
The Directors c<strong>on</strong>sider that, in preparing the accounts, the Group<br />
and the NV and PLC entities have used the most appropriate<br />
accounting policies, c<strong>on</strong>sistently applied and supported by<br />
reas<strong>on</strong>able and prudent judgements and estimates, and that all<br />
Internati<strong>on</strong>al Financial Reporting Standards as adopted by the EU<br />
which they c<strong>on</strong>sider to be applicable have been followed.<br />
The Directors have resp<strong>on</strong>sibility for ensuring that NV and PLC<br />
keep accounting records which disclose with reas<strong>on</strong>able accuracy<br />
their financial positi<strong>on</strong> and which enable the Directors to ensure<br />
that the accounts comply with the relevant legislati<strong>on</strong>. They also<br />
have a general resp<strong>on</strong>sibility for taking such steps as are<br />
reas<strong>on</strong>ably open to them to safeguard the assets of the Group,<br />
and to prevent and detect fraud and other irregularities.<br />
This statement, which should be read in c<strong>on</strong>juncti<strong>on</strong> with the<br />
Auditors’ <str<strong>on</strong>g>report</str<strong>on</strong>g>, is made with a view to distinguishing for<br />
shareholders the respective resp<strong>on</strong>sibilities of the Directors<br />
and of the auditors in relati<strong>on</strong> to the accounts.<br />
A copy of the financial statements of the <strong>Unilever</strong> Group is<br />
placed <strong>on</strong> our website at www.unilever.com/investorcentre. The<br />
maintenance and integrity of the website are the resp<strong>on</strong>sibility of<br />
the Directors, and the work carried out by the auditors does not<br />
involve c<strong>on</strong>siderati<strong>on</strong> of these matters. Accordingly, the auditors<br />
accept no resp<strong>on</strong>sibility for any changes that may have occurred<br />
to the financial statements since they were initially placed <strong>on</strong> the<br />
website. Legislati<strong>on</strong> in the United Kingdom and the Netherlands<br />
governing the preparati<strong>on</strong> and disseminati<strong>on</strong> of financial<br />
statements may differ from legislati<strong>on</strong> in other jurisdicti<strong>on</strong>s.<br />
66 <strong>Unilever</strong> <str<strong>on</strong>g>Annual</str<strong>on</strong>g> Report <strong>on</strong> Form 20-F <strong>2006</strong><br />
Going c<strong>on</strong>cern<br />
The Directors c<strong>on</strong>tinue to adopt the going c<strong>on</strong>cern basis<br />
in preparing the accounts. This is because the Directors,<br />
after making enquiries and following a review of the Group’s<br />
budget for 2007 and 2008, including cash flows and borrowing<br />
facilities, c<strong>on</strong>sider that the Group has adequate resources to<br />
c<strong>on</strong>tinue in operati<strong>on</strong> for the foreseeable future.<br />
Internal and disclosure c<strong>on</strong>trols and procedures<br />
<strong>Unilever</strong> has a well-established c<strong>on</strong>trol framework, which is<br />
documented and regularly reviewed by the Boards. This<br />
incorporates risk management, internal c<strong>on</strong>trol procedures and<br />
disclosure c<strong>on</strong>trols and procedures (including the operati<strong>on</strong> of<br />
the Disclosures Committee – see page 38) which are designed to<br />
provide reas<strong>on</strong>able, but not absolute, assurance that assets are<br />
safeguarded, the risks facing the business are being addressed<br />
and all in<strong>form</strong>ati<strong>on</strong> required to be disclosed is <str<strong>on</strong>g>report</str<strong>on</strong>g>ed to the<br />
Group’s senior management, including where appropriate the<br />
Group Chief Executive and Chief Financial Officer, within the<br />
required timeframe.<br />
Our procedures cover financial, operati<strong>on</strong>al, social, strategic and<br />
envir<strong>on</strong>mental risks and regulatory matters. The Boards of NV<br />
and PLC have also established a clear organisati<strong>on</strong>al structure,<br />
including delegati<strong>on</strong> of appropriate authorities. The Group’s<br />
c<strong>on</strong>trol framework is supported through a Code of Business<br />
Principles, which sets standards of professi<strong>on</strong>alism and integrity<br />
for its operati<strong>on</strong>s worldwide, and through an Operati<strong>on</strong>al<br />
C<strong>on</strong>trols Assessment process, which requires the senior<br />
management in each business unit to assess the effectiveness of<br />
financial c<strong>on</strong>trols. In our major units financial c<strong>on</strong>trols are subject<br />
to a comprehensive assessment annually with all other c<strong>on</strong>trols<br />
being reviewed over a <strong>on</strong>e- to three-year cycle.<br />
The Boards have overall resp<strong>on</strong>sibility for establishing key<br />
procedures designed to achieve systems of internal c<strong>on</strong>trol<br />
and disclosure c<strong>on</strong>trol and for reviewing and evaluating their<br />
effectiveness. The day-to-day resp<strong>on</strong>sibility for implementati<strong>on</strong><br />
of these procedures and <strong>on</strong>going m<strong>on</strong>itoring of risk and<br />
the effectiveness of c<strong>on</strong>trols rests with the Group’s senior<br />
management at individual operating company and regi<strong>on</strong>al<br />
level. Regi<strong>on</strong>s review, <strong>on</strong> an <strong>on</strong>going basis, the risks faced by<br />
their group and the related internal c<strong>on</strong>trol arrangements, and<br />
provide written <str<strong>on</strong>g>report</str<strong>on</strong>g>s to the Group Chief Executive.
Statement of Directors’ resp<strong>on</strong>sibilities (c<strong>on</strong>tinued)<br />
<strong>Unilever</strong>’s corporate internal audit functi<strong>on</strong> plays a key role in<br />
providing an objective view and c<strong>on</strong>tinuous reassurance of the<br />
effectiveness of the risk management and related c<strong>on</strong>trol systems<br />
throughout <strong>Unilever</strong> to both operating management and the<br />
Boards. The Group has an independent Audit Committee,<br />
comprised entirely of Independent N<strong>on</strong>-Executive Directors.<br />
This Committee meets regularly with the Chief Auditor and<br />
the external auditors.<br />
<strong>Unilever</strong> has a comprehensive budgeting system with an annual<br />
budget approved by the Boards, which is regularly reviewed and<br />
updated. Per<strong>form</strong>ance is m<strong>on</strong>itored against budget and the<br />
previous year through m<strong>on</strong>thly and quarterly <str<strong>on</strong>g>report</str<strong>on</strong>g>ing routines.<br />
The Group <str<strong>on</strong>g>report</str<strong>on</strong>g>s to shareholders quarterly.<br />
<strong>Unilever</strong>’s system of risk management has been in place<br />
throughout <strong>2006</strong> and up to the date of this <str<strong>on</strong>g>report</str<strong>on</strong>g>, and complies<br />
with the recommendati<strong>on</strong>s of ’Internal C<strong>on</strong>trol – Revised<br />
Guidance for Directors <strong>on</strong> the Combined Code’, published by<br />
the Internal C<strong>on</strong>trol Working Party of the Institute of Chartered<br />
Accountants in England & Wales in October 2005. The Boards<br />
have carried out an annual review of the effectiveness of the<br />
systems of risk management and internal c<strong>on</strong>trol during <strong>2006</strong><br />
in accordance with this guidance, and have ensured that the<br />
necessary acti<strong>on</strong>s have been or are being taken to address<br />
any significant failings arising out of that review.<br />
Based <strong>on</strong> an evaluati<strong>on</strong> by the Boards, the Group Chief Executive<br />
and the Chief Financial Officer c<strong>on</strong>cluded that the design and<br />
operati<strong>on</strong> of the Group’s disclosure c<strong>on</strong>trols and procedures as at<br />
31 December <strong>2006</strong> were effective, and that subsequently there<br />
have been no significant changes in the Group’s internal c<strong>on</strong>trols,<br />
or in other factors that could significantly affect those c<strong>on</strong>trols.<br />
It is <strong>Unilever</strong>’s practice to bring acquired companies within the<br />
Group’s governance procedures as so<strong>on</strong> as is practicable and<br />
in any event by the end of the first full year of operati<strong>on</strong>.<br />
<strong>Unilever</strong> <str<strong>on</strong>g>Annual</str<strong>on</strong>g> Report <strong>on</strong> Form 20-F <strong>2006</strong> 67<br />
Financial Statements (c<strong>on</strong>tinued)
Financial Statements (c<strong>on</strong>tinued)<br />
Management’s <str<strong>on</strong>g>report</str<strong>on</strong>g> <strong>on</strong> internal c<strong>on</strong>trol over financial <str<strong>on</strong>g>report</str<strong>on</strong>g>ing<br />
In accordance with the requirements of Secti<strong>on</strong> 404 of the US Sarbanes-Oxley Act of 2002, the following <str<strong>on</strong>g>report</str<strong>on</strong>g> is provided by<br />
management in respect of the Company’s internal c<strong>on</strong>trol over financial <str<strong>on</strong>g>report</str<strong>on</strong>g>ing (as defined in rules 13a-15(f) or rule 15d-15(f)<br />
under the US Securities Exchange Act of 1934):<br />
• <strong>Unilever</strong>’s management is resp<strong>on</strong>sible for establishing and maintaining adequate internal c<strong>on</strong>trol over financial <str<strong>on</strong>g>report</str<strong>on</strong>g>ing for the<br />
group;<br />
• <strong>Unilever</strong>’s management has used the Committee of Sp<strong>on</strong>soring Organizati<strong>on</strong>s of the Treadway Commissi<strong>on</strong> (COSO) framework to<br />
evaluate the effectiveness of our internal c<strong>on</strong>trol over financial <str<strong>on</strong>g>report</str<strong>on</strong>g>ing. Management believes that the COSO framework is a<br />
suitable framework for its evaluati<strong>on</strong> of our internal c<strong>on</strong>trol over financial <str<strong>on</strong>g>report</str<strong>on</strong>g>ing because it is free from bias, permits reas<strong>on</strong>ably<br />
c<strong>on</strong>sistent qualitative and quantitative measurements of internal c<strong>on</strong>trols, is sufficiently complete so that those relevant factors that<br />
would alter a c<strong>on</strong>clusi<strong>on</strong> about the effectiveness of internal c<strong>on</strong>trols are not omitted and is relevant to an evaluati<strong>on</strong> of internal<br />
c<strong>on</strong>trol over financial <str<strong>on</strong>g>report</str<strong>on</strong>g>ing.<br />
• Management has assessed the effectiveness of internal c<strong>on</strong>trol over financial <str<strong>on</strong>g>report</str<strong>on</strong>g>ing as of 31 December <strong>2006</strong>, and has c<strong>on</strong>cluded<br />
that such internal c<strong>on</strong>trol over financial <str<strong>on</strong>g>report</str<strong>on</strong>g>ing is effective.<br />
• PricewaterhouseCoopers LLP and PricewaterhouseCoopers Accountants N.V., who have audited the c<strong>on</strong>solidated financial statements<br />
of the Group for the year ended 31 December <strong>2006</strong>, have also audited management’s assessment of the effectiveness of internal<br />
c<strong>on</strong>trol over financial <str<strong>on</strong>g>report</str<strong>on</strong>g>ing as at 31 December <strong>2006</strong> and have issued an attestati<strong>on</strong> <str<strong>on</strong>g>report</str<strong>on</strong>g> <strong>on</strong> management’s assessment. For the<br />
Auditors’ <str<strong>on</strong>g>report</str<strong>on</strong>g> please refer to page 69.<br />
68 <strong>Unilever</strong> <str<strong>on</strong>g>Annual</str<strong>on</strong>g> Report <strong>on</strong> Form 20-F <strong>2006</strong>
Auditors’ <str<strong>on</strong>g>report</str<strong>on</strong>g> United States<br />
Report of the independent registered public accounting firms to the shareholders of <strong>Unilever</strong> N.V. and<br />
<strong>Unilever</strong> PLC<br />
We have completed an integrated audit of the <strong>Unilever</strong> Group’s 31 December <strong>2006</strong> c<strong>on</strong>solidated accounts and of its internal c<strong>on</strong>trol<br />
over financial <str<strong>on</strong>g>report</str<strong>on</strong>g>ing as of 31 December <strong>2006</strong> and audits of its 31 December 2005 and 31 December 2004 c<strong>on</strong>solidated accounts in<br />
accordance with the standards of the Public Company Accounting Oversight Board (United States). Our opini<strong>on</strong>s, based <strong>on</strong> our audits,<br />
are presented below.<br />
C<strong>on</strong>solidated accounts<br />
In our opini<strong>on</strong>, the accompanying c<strong>on</strong>solidated income statements and the related c<strong>on</strong>solidated balance sheets, c<strong>on</strong>solidated cash flow<br />
statements and c<strong>on</strong>solidated statements of recognised income and expense present fairly, in all material respects, the financial positi<strong>on</strong><br />
of the <strong>Unilever</strong> Group at 31 December <strong>2006</strong> and 2005 and the results of its operati<strong>on</strong>s and cash flows for each of the three years in<br />
the period ended 31 December <strong>2006</strong>, in c<strong>on</strong><strong>form</strong>ity with Internati<strong>on</strong>al Financial Reporting Standards (IFRS) as adopted by the European<br />
Uni<strong>on</strong>. These c<strong>on</strong>solidated accounts are the resp<strong>on</strong>sibility of the Group’s Directors. Our resp<strong>on</strong>sibility is to express an opini<strong>on</strong> <strong>on</strong> these<br />
c<strong>on</strong>solidated accounts based <strong>on</strong> our audits. We c<strong>on</strong>ducted our audits of these c<strong>on</strong>solidated accounts in accordance with the standards<br />
of the Public Company Accounting Oversight Board (United States). Those standards require that we plan and per<strong>form</strong> the audit to<br />
obtain reas<strong>on</strong>able assurance about whether the c<strong>on</strong>solidated accounts are free of material misstatement. An audit of c<strong>on</strong>solidated<br />
accounts includes examining, <strong>on</strong> a test basis, evidence supporting the amounts and disclosures in the c<strong>on</strong>solidated accounts, assessing<br />
the accounting principles used and significant estimates made by management, and evaluating the overall c<strong>on</strong>solidated accounts<br />
presentati<strong>on</strong>. We believe that our audits provide a reas<strong>on</strong>able basis for our opini<strong>on</strong>.<br />
IFRS as adopted by the European Uni<strong>on</strong> vary in certain significant respects from accounting principles generally accepted in the United<br />
States of America. In<strong>form</strong>ati<strong>on</strong> relating to the nature and effect of such differences is presented in notes 34 and 35 <strong>on</strong> pages 124 to 140.<br />
As discussed in note 21 <strong>on</strong> page 108, <strong>Unilever</strong> changed the manner in which it accounts for financial instruments up<strong>on</strong> adopti<strong>on</strong><br />
of Internati<strong>on</strong>al Accounting Standards No. 32 Financial Instruments: Disclosure and Presentati<strong>on</strong>, and No. 39 Financial Instruments:<br />
Recogniti<strong>on</strong> and Measurement, <strong>on</strong> 1 January 2005.<br />
Internal c<strong>on</strong>trol over financial <str<strong>on</strong>g>report</str<strong>on</strong>g>ing<br />
Also, in our opini<strong>on</strong>, management’s assessment, included in the accompanying ‘Management’s <str<strong>on</strong>g>report</str<strong>on</strong>g> <strong>on</strong> internal c<strong>on</strong>trol over financial<br />
<str<strong>on</strong>g>report</str<strong>on</strong>g>ing’ as set out <strong>on</strong> page 68, that the Group maintained effective internal c<strong>on</strong>trol over financial <str<strong>on</strong>g>report</str<strong>on</strong>g>ing as of 31 December <strong>2006</strong><br />
based <strong>on</strong> criteria established in Internal C<strong>on</strong>trol – Integrated Framework issued by the Committee of Sp<strong>on</strong>soring Organizati<strong>on</strong>s of the<br />
Treadway Commissi<strong>on</strong> (COSO), is fairly stated, in all material respects, based <strong>on</strong> those criteria. Furthermore, in our opini<strong>on</strong>, the Group<br />
maintained, in all material respects, effective internal c<strong>on</strong>trol over financial <str<strong>on</strong>g>report</str<strong>on</strong>g>ing as of 31 December <strong>2006</strong>, based <strong>on</strong> criteria<br />
established in Internal C<strong>on</strong>trol – Integrated Framework issued by the COSO. The Group’s management is resp<strong>on</strong>sible for maintaining<br />
effective internal c<strong>on</strong>trol over financial <str<strong>on</strong>g>report</str<strong>on</strong>g>ing and for its assessment of the effectiveness of internal c<strong>on</strong>trol over financial <str<strong>on</strong>g>report</str<strong>on</strong>g>ing.<br />
Our resp<strong>on</strong>sibility is to express opini<strong>on</strong>s <strong>on</strong> management’s assessment and <strong>on</strong> the effectiveness of the Group’s internal c<strong>on</strong>trol over<br />
financial <str<strong>on</strong>g>report</str<strong>on</strong>g>ing based <strong>on</strong> our audit.<br />
We c<strong>on</strong>ducted our audit of internal c<strong>on</strong>trol over financial <str<strong>on</strong>g>report</str<strong>on</strong>g>ing in accordance with the standards of the Public Company<br />
Accounting Oversight Board (United States). Those standards require that we plan and per<strong>form</strong> the audit to obtain reas<strong>on</strong>able<br />
assurance about whether effective internal c<strong>on</strong>trol over financial <str<strong>on</strong>g>report</str<strong>on</strong>g>ing was maintained in all material respects. An audit of<br />
internal c<strong>on</strong>trol over financial <str<strong>on</strong>g>report</str<strong>on</strong>g>ing includes obtaining an understanding of internal c<strong>on</strong>trol over financial <str<strong>on</strong>g>report</str<strong>on</strong>g>ing, evaluating<br />
management’s assessment, testing and evaluating the design and operating effectiveness of internal c<strong>on</strong>trol, and per<strong>form</strong>ing such<br />
other procedures as we c<strong>on</strong>sider necessary in the circumstances. We believe that our audit provides a reas<strong>on</strong>able basis for our opini<strong>on</strong>.<br />
A company’s internal c<strong>on</strong>trol over financial <str<strong>on</strong>g>report</str<strong>on</strong>g>ing is a process designed to provide reas<strong>on</strong>able assurance regarding the reliability<br />
of financial <str<strong>on</strong>g>report</str<strong>on</strong>g>ing and the preparati<strong>on</strong> of c<strong>on</strong>solidated accounts for external purposes in accordance with generally accepted<br />
accounting standards and principles. A company’s internal c<strong>on</strong>trol over financial <str<strong>on</strong>g>report</str<strong>on</strong>g>ing includes those policies and procedures that<br />
(i) pertain to the maintenance of records that, in reas<strong>on</strong>able detail, accurately and fairly reflect the transacti<strong>on</strong>s and dispositi<strong>on</strong>s of the<br />
assets of the company; (ii) provide reas<strong>on</strong>able assurance that transacti<strong>on</strong>s are recorded as necessary to permit preparati<strong>on</strong> of financial<br />
statements in accordance with generally accepted accounting standards and principles, and that receipts and expenditures of the<br />
company are being made <strong>on</strong>ly in accordance with authorisati<strong>on</strong>s of management and directors of the company; and (iii) provide<br />
reas<strong>on</strong>able assurance regarding preventi<strong>on</strong> or timely detecti<strong>on</strong> of unauthorised acquisiti<strong>on</strong>, use, or dispositi<strong>on</strong> of the company’s assets<br />
that could have a material effect <strong>on</strong> the financial statements.<br />
Because of its inherent limitati<strong>on</strong>s, internal c<strong>on</strong>trol over financial <str<strong>on</strong>g>report</str<strong>on</strong>g>ing may not prevent or detect misstatements. Also, projecti<strong>on</strong>s<br />
of any evaluati<strong>on</strong> of effectiveness to future periods are subject to the risk that c<strong>on</strong>trols may become inadequate because of changes in<br />
c<strong>on</strong>diti<strong>on</strong>s, or that the degree of compliance with the policies or procedures may deteriorate.<br />
26 March 2007, Rotterdam, The Netherlands<br />
PricewaterhouseCoopers Accountants N.V<br />
As auditors of <strong>Unilever</strong> N.V.<br />
PricewaterhouseCoopers LLP<br />
L<strong>on</strong>d<strong>on</strong>, United Kingdom<br />
As auditors of <strong>Unilever</strong> PLC<br />
Prof Dr J A van Manen RA 26 March 2007<br />
<strong>Unilever</strong> <str<strong>on</strong>g>Annual</str<strong>on</strong>g> Report <strong>on</strong> Form 20-F <strong>2006</strong> 69<br />
Financial Statements (c<strong>on</strong>tinued)
Financial Statements (c<strong>on</strong>tinued)<br />
C<strong>on</strong>solidated income statement <strong>Unilever</strong> Group<br />
for the year ended 31 December<br />
70 <strong>Unilever</strong> <str<strong>on</strong>g>Annual</str<strong>on</strong>g> Report <strong>on</strong> Form 20-F <strong>2006</strong><br />
€ milli<strong>on</strong> € milli<strong>on</strong> € milli<strong>on</strong><br />
<strong>2006</strong> 2005 2004<br />
C<strong>on</strong>tinuing operati<strong>on</strong>s<br />
Turnover 2 39 642 38 401 37 168<br />
Operating profit 2<br />
After (charging)/crediting:<br />
5 408 5 074 3 981<br />
Restructuring 3 (704) (328) (913)<br />
Business disposals, impairments and other 3 196 (249) (908)<br />
Gain <strong>on</strong> US healthcare and UK pensi<strong>on</strong>s 3 266 – –<br />
Net finance costs 5 (721) (613) (623)<br />
Finance income 128 129 145<br />
Finance costs (590) (689) (714)<br />
Preference shares provisi<strong>on</strong> (300) – –<br />
Pensi<strong>on</strong>s and similar obligati<strong>on</strong>s 41 (53) (54)<br />
Share of net profit/(loss) of joint ventures 78 47 39<br />
Share of net profit/(loss) of associates 36 (25) 2<br />
Other income from n<strong>on</strong>-current investments 11 30 33 54<br />
Profit before taxati<strong>on</strong> 4 831 4 516 3 453<br />
Taxati<strong>on</strong> 6 (1 146) (1 181) (725)<br />
Net profit from c<strong>on</strong>tinuing operati<strong>on</strong>s 3 685 3 335 2 728<br />
Net profit from disc<strong>on</strong>tinued operati<strong>on</strong>s 27 1 330 640 213<br />
Net profit<br />
Attributable to:<br />
5 015 3 975 2 941<br />
Minority interests 270 209 186<br />
Shareholders’ equity 4 745 3 766 2 755<br />
€ € €<br />
Combined earnings per share 7 <strong>2006</strong> 2005 2004<br />
From c<strong>on</strong>tinuing operati<strong>on</strong>s<br />
Basic earnings per share 1.19 1.07 0.87<br />
Diluted earnings per share<br />
From disc<strong>on</strong>tinued operati<strong>on</strong>s<br />
1.15 1.04 0.84<br />
Basic earnings per share 0.46 0.22 0.07<br />
Diluted earnings per share<br />
From total operati<strong>on</strong>s<br />
0.45 0.21 0.07<br />
Basic earnings per share 1.65 1.29 0.94<br />
Diluted earnings per share 1.60 1.25 0.91<br />
References in the c<strong>on</strong>solidated income statement, c<strong>on</strong>solidated statement of recognised income and expense, c<strong>on</strong>solidated cash flow statement<br />
and c<strong>on</strong>solidated balance sheet relate to notes <strong>on</strong> pages 74 to 140, which <strong>form</strong> an integral part of the c<strong>on</strong>solidated financial statements.<br />
Accounting policies of the <strong>Unilever</strong> Group are set out in note 1 <strong>on</strong> pages 74 to 78.<br />
Variati<strong>on</strong>s from United States generally accepted accounting principles and Securities and Exchange Commissi<strong>on</strong> Financial Statement<br />
Requirements Regulati<strong>on</strong> S-X are outlined in notes 34 and 35 <strong>on</strong> pages 124 to 140.
C<strong>on</strong>solidated statement of recognised income and expense <strong>Unilever</strong> Group<br />
for the year ended 31 December<br />
€ milli<strong>on</strong> € milli<strong>on</strong> € milli<strong>on</strong><br />
<strong>2006</strong> 2005 2004<br />
Fair value gains/(losses) net of tax:<br />
On cash flow hedges 6 14 n/a<br />
On available-for-sale financial assets 15 – n/a<br />
Actuarial gains/(losses) <strong>on</strong> pensi<strong>on</strong> schemes net of tax 853 (49) (480)<br />
Currency retranslati<strong>on</strong> gains/(losses) net of tax (a) (335) 513 80<br />
Net income/(expense) recognised directly in equity 539 478 (400)<br />
Net profit 5 015 3 975 2 941<br />
Total recognised income and expense 21<br />
Attributable to:<br />
5 554 4 453 2 541<br />
Minority interests 242 249 167<br />
Shareholders’ equity 5 312 4 204 2 374<br />
(a) Includes fair value gains/(losses) <strong>on</strong> net investment hedges of €(779) milli<strong>on</strong> (2005: €332 milli<strong>on</strong>; 2004 n/a).<br />
<strong>Unilever</strong> <str<strong>on</strong>g>Annual</str<strong>on</strong>g> Report <strong>on</strong> Form 20-F <strong>2006</strong> 71<br />
Financial Statements (c<strong>on</strong>tinued)
Financial Statements (c<strong>on</strong>tinued)<br />
C<strong>on</strong>solidated balance sheet <strong>Unilever</strong> Group<br />
as at 31 December<br />
72 <strong>Unilever</strong> <str<strong>on</strong>g>Annual</str<strong>on</strong>g> Report <strong>on</strong> Form 20-F <strong>2006</strong><br />
€ milli<strong>on</strong> € milli<strong>on</strong><br />
<strong>2006</strong> 2005<br />
Goodwill 9 12 425 12 963<br />
Intangible assets 9 4 781 5 092<br />
Property, plant and equipment 10 6 276 6 492<br />
Pensi<strong>on</strong> asset for funded schemes in surplus 20 1 697 1 036<br />
Trade and other receivables due after more than <strong>on</strong>e year 14 252 231<br />
Deferred tax assets 12 1 266 1 703<br />
Other n<strong>on</strong>-current assets 11 874 841<br />
Total n<strong>on</strong>-current assets 27 571 28 358<br />
Inventories 13 3 796 4 107<br />
Trade and other current receivables 14 4 290 4 830<br />
Current tax assets 125 124<br />
Cash and cash equivalents 15 1 039 1 529<br />
Other financial assets 15 237 335<br />
Assets held for sale 27 14 217<br />
Total current assets 9 501 11 142<br />
Borrowings due within <strong>on</strong>e year 16 (4 362) (5 942)<br />
Trade payables and other current liabilities 18 (7 934) (8 228)<br />
Current tax liabilities (579) (554)<br />
Provisi<strong>on</strong>s 19 (1 009) (644)<br />
Liabilities associated with assets held for sale 27 – (26)<br />
Total current liabilities (13 884) (15 394)<br />
Net current assets/(liabilities) (4 383) (4 252)<br />
Total assets less current liabilities 23 188 24 106<br />
Borrowings due after more than <strong>on</strong>e year 16 4 239 6 457<br />
Trade payables and other liabilities due after more than <strong>on</strong>e year 18 399 389<br />
N<strong>on</strong>-current tax liabilities 272 213<br />
Pensi<strong>on</strong>s and post-retirement healthcare liabilities:<br />
Funded schemes in deficit 20 1 379 2 415<br />
Unfunded schemes 20 3 398 4 202<br />
Provisi<strong>on</strong>s 19 826 732<br />
Deferred tax liabilities 12 1 003 933<br />
Total n<strong>on</strong>-current liabilities 11 516 15 341<br />
Called up share capital 21 484 512<br />
Share premium account 21 165 162<br />
Other reserves 21 (2 143) (2 328)<br />
Retained profit 21 12 724 10 015<br />
Shareholders’ equity 11 230 8 361<br />
Minority interests 21 442 404<br />
Total equity 11 672 8 765<br />
Total capital employed 23 188 24 106<br />
Commitments and c<strong>on</strong>tingent liabilities are shown in note 25 <strong>on</strong> page 112.<br />
These financial statements were approved by the Directors <strong>on</strong> 26 March 2007.
C<strong>on</strong>solidated cash flow statement <strong>Unilever</strong> Group<br />
for the year ended 31 December<br />
€ milli<strong>on</strong> € milli<strong>on</strong> € milli<strong>on</strong><br />
<strong>2006</strong> 2005 2004<br />
Cash flow from operating activities 28 5 574 5 924 6 925<br />
Income tax paid (1 063) (1 571) (1 378)<br />
Net cash flow from operating activities 4 511 4 353 5 547<br />
Interest received 125 130 168<br />
Purchase of intangible assets (113) (92) (89)<br />
Purchase of property, plant and equipment (1 013) (914) (978)<br />
Disposal of property, plant and equipment 192 124 151<br />
Sale and leaseback transacti<strong>on</strong>s resulting in operating leases – 69 47<br />
Acquisiti<strong>on</strong> of group companies, joint ventures and associates (96) (20) (40)<br />
C<strong>on</strong>siderati<strong>on</strong> paid in respect of acquisiti<strong>on</strong>s made in previous years – – (158)<br />
Disposal of group companies, joint ventures and associates 1 873 804 413<br />
Payments received in advance for future disposals – – 101<br />
Acquisiti<strong>on</strong> of other n<strong>on</strong>-current investments (90) (50) (25)<br />
Disposal of other n<strong>on</strong>-current investments 61 83 68<br />
Dividends from joint ventures, associates and other n<strong>on</strong>-current investments 120 65 92<br />
(Purchase)/sale of financial assets 96 316 130<br />
Net cash flow from/(used in) investing activities 1 155 515 (120)<br />
Dividends paid <strong>on</strong> ordinary share capital (2 602) (1 804) (1 720)<br />
Interest and preference dividends paid (605) (643) (787)<br />
Additi<strong>on</strong>al borrowings and change in short-term borrowings 2 154 3 968 2 966<br />
Repayment of borrowings (5 364) (4 795) (6 008)<br />
Sale and leaseback transacti<strong>on</strong>s resulting in finance leases 2 – 211<br />
Capital element of finance lease rental payments (73) (53) (59)<br />
Movement <strong>on</strong> treasury stock 98 (1 276) (332)<br />
Dividends paid and other payments (to)/from minority shareholders and joint ventures (182) (218) (209)<br />
Net cash flow from/(used in) financing activities (6 572) (4 821) (5 938)<br />
Net increase/(decrease) in cash and cash equivalents (906) 47 (511)<br />
Cash and cash equivalents at the beginning of the year 1 265 1 406 1 428<br />
Effect of foreign exchange rate changes 351 (188) 489<br />
Cash and cash equivalents at the end of the year 15 710 1 265 1 406<br />
The cash flows of pensi<strong>on</strong> funds (other than c<strong>on</strong>tributi<strong>on</strong>s and other direct payments made by the Group in respect of pensi<strong>on</strong>s and similar<br />
obligati<strong>on</strong>s) are not included in the c<strong>on</strong>solidated cash flow statement. Cash flows relating to disc<strong>on</strong>tinued operati<strong>on</strong>s included above are set<br />
out in note 27 <strong>on</strong> page 114.<br />
<strong>Unilever</strong> <str<strong>on</strong>g>Annual</str<strong>on</strong>g> Report <strong>on</strong> Form 20-F <strong>2006</strong> 73<br />
Financial Statements (c<strong>on</strong>tinued)
Financial Statements (c<strong>on</strong>tinued)<br />
Notes to the c<strong>on</strong>solidated accounts <strong>Unilever</strong> Group<br />
1 Accounting in<strong>form</strong>ati<strong>on</strong> and policies<br />
The accounting policies adopted are essentially the same as those<br />
which applied for the previous financial year. Changes arising from<br />
interpretati<strong>on</strong>s or amendments of applicable accounting standards<br />
are set out below under the heading of ‘Companies legislati<strong>on</strong> and<br />
accounting standards’.<br />
<strong>Unilever</strong><br />
The two parent companies, NV and PLC, together with their group<br />
companies, operate as a single ec<strong>on</strong>omic entity (the <strong>Unilever</strong> Group,<br />
also referred to as <strong>Unilever</strong> or the Group). NV and PLC have the same<br />
Directors and are linked by a series of agreements, including an<br />
Equalisati<strong>on</strong> Agreement, which are designed so that the positi<strong>on</strong> of<br />
the shareholders of both companies is as nearly as possible the same<br />
as if they held shares in a single company.<br />
The Equalisati<strong>on</strong> Agreement provides that both companies adopt<br />
the same accounting principles and requires as a general rule<br />
the dividends and other rights and benefits (including rights <strong>on</strong><br />
liquidati<strong>on</strong>) attaching to each €0.16 nominal of ordinary share capital<br />
of NV to be equal in value at the relevant rate of exchange to the<br />
dividends and other rights and benefits attaching to each 3 1 ⁄9p<br />
nominal of ordinary share capital of PLC, as if each such unit of<br />
capital <strong>form</strong>ed part of the ordinary capital of <strong>on</strong>e and the same<br />
company. For additi<strong>on</strong>al in<strong>form</strong>ati<strong>on</strong> please refer to ‘Corporate<br />
governance’ <strong>on</strong> page 39.<br />
Basis of c<strong>on</strong>solidati<strong>on</strong><br />
Due to the operati<strong>on</strong>al and c<strong>on</strong>tractual arrangements referred to<br />
above, NV and PLC <strong>form</strong> a single <str<strong>on</strong>g>report</str<strong>on</strong>g>ing entity for the purposes<br />
of presenting c<strong>on</strong>solidated accounts. Accordingly, the accounts of<br />
<strong>Unilever</strong> are presented by both NV and PLC as their respective<br />
c<strong>on</strong>solidated accounts. Group companies included in the c<strong>on</strong>solidati<strong>on</strong><br />
are those companies c<strong>on</strong>trolled by NV or PLC. C<strong>on</strong>trol exists when the<br />
Group has the power to govern the financial and operating policies of<br />
an entity so as to obtain benefits from its activities.<br />
The net assets and results of acquired businesses are included in the<br />
c<strong>on</strong>solidated accounts from their respective dates of acquisiti<strong>on</strong>, being<br />
the date <strong>on</strong> which the Group obtains c<strong>on</strong>trol. The results of disposed<br />
businesses are included in the c<strong>on</strong>solidated accounts up to their date<br />
of disposal, being the date c<strong>on</strong>trol ceases.<br />
Companies legislati<strong>on</strong> and accounting standards<br />
The c<strong>on</strong>solidated accounts have been prepared in accordance with<br />
Internati<strong>on</strong>al Financial Reporting Standards (IFRS) as adopted by<br />
the EU, including interpretati<strong>on</strong>s from the Internati<strong>on</strong>al Financial<br />
Reporting Interpretati<strong>on</strong>s Committee (IFRIC) and the Standing<br />
Interpretati<strong>on</strong>s Committee (SIC), and with Book 2 of the Civil Code<br />
in the Netherlands and the United Kingdom Companies Act 1985.<br />
The accounts are prepared under the historical cost c<strong>on</strong>venti<strong>on</strong> unless<br />
otherwise indicated.<br />
The accounting policies adopted are c<strong>on</strong>sistent with those of the<br />
previous financial year except that the Group has adopted the<br />
following IFRIC interpretati<strong>on</strong>s with effect from 1 January <strong>2006</strong>.<br />
Adopti<strong>on</strong> of these interpretati<strong>on</strong>s did not have a material effect<br />
<strong>on</strong> the financial statements of the Group.<br />
• IFRIC 4 ‘Determining Whether an Arrangement C<strong>on</strong>tains a Lease’,<br />
provides guidance in determining whether arrangements c<strong>on</strong>tain<br />
a lease to which lease accounting must be applied.<br />
• IFRIC 5 ‘Rights to Interests Arising from Decommissi<strong>on</strong>ing,<br />
Restorati<strong>on</strong> and Envir<strong>on</strong>mental Rehabilitati<strong>on</strong> Funds’, establishes<br />
the accounting treatment for funds established to help finance<br />
decommissi<strong>on</strong>ing for a company’s assets.<br />
The Group also applied the amendment to IAS 39 ‘Financial<br />
Instruments: Recogniti<strong>on</strong> and Measurement’ and IFRS 4 ‘Insurance<br />
C<strong>on</strong>tracts’ which requires that financial guarantee c<strong>on</strong>tracts are<br />
accounted for as financial instruments, initially recognised at fair value.<br />
As the Group has no material external financial guarantees, the<br />
amendment did not have a material effect <strong>on</strong> the financial statements.<br />
74 <strong>Unilever</strong> <str<strong>on</strong>g>Annual</str<strong>on</strong>g> Report <strong>on</strong> Form 20-F <strong>2006</strong><br />
In additi<strong>on</strong>, the Group has applied the following changes in<br />
presentati<strong>on</strong> of the financial statements:<br />
• Within the income statement, costs and revenues relating<br />
to restructuring, business disposals and impairments are<br />
shown separately;<br />
• Within the balance sheet, current tax assets were previously shown<br />
net within current tax liabilities. These are now <str<strong>on</strong>g>report</str<strong>on</strong>g>ed separately<br />
<strong>on</strong> a gross basis; and<br />
• Sec<strong>on</strong>dary <str<strong>on</strong>g>report</str<strong>on</strong>g>ing segments are presented in four <str<strong>on</strong>g>report</str<strong>on</strong>g>ing<br />
segments, as opposed to six <str<strong>on</strong>g>report</str<strong>on</strong>g>ing segments in 2005. Further<br />
in<strong>form</strong>ati<strong>on</strong> is provided <strong>on</strong> page 81.<br />
Variati<strong>on</strong>s from United States generally accepted accounting principles<br />
and Securities and Exchange Commissi<strong>on</strong> Financial Statement<br />
Requirements Regulati<strong>on</strong> S-X are outlined in notes 34 and 35 <strong>on</strong><br />
pages 124 to 140.<br />
Foreign currencies<br />
Items included in the financial statements of group companies are<br />
measured using the currency of the primary ec<strong>on</strong>omic envir<strong>on</strong>ment in<br />
which each entity operates (its functi<strong>on</strong>al currency). The c<strong>on</strong>solidated<br />
financial statements are presented in euros. The functi<strong>on</strong>al currencies<br />
of NV and PLC are euros and sterling respectively.<br />
Foreign currency transacti<strong>on</strong>s are translated into the functi<strong>on</strong>al<br />
currency using the exchange rates prevailing at the dates of the<br />
transacti<strong>on</strong>s. Foreign exchange gains and losses resulting from the<br />
settlement of such transacti<strong>on</strong>s and from the translati<strong>on</strong> at year-end<br />
exchange rates of m<strong>on</strong>etary assets and liabilities denominated in<br />
foreign currencies are recognised in the income statement, except<br />
when deferred in equity as qualifying hedges. Those arising <strong>on</strong> trading<br />
transacti<strong>on</strong>s are taken to operating profit; those arising <strong>on</strong> cash,<br />
financial assets and borrowings are classified as finance income or cost.<br />
In preparing the c<strong>on</strong>solidated financial statements, the income<br />
statement, the cash flow statement and all other movements in assets<br />
and liabilities are translated at annual average rates of exchange.<br />
The balance sheet, other than the ordinary share capital of NV and<br />
PLC, is translated at year-end rates of exchange. In the case of hyperinflati<strong>on</strong>ary<br />
ec<strong>on</strong>omies, which are those in which inflati<strong>on</strong> exceeds<br />
100% cumulatively over a three-year period, the accounts are<br />
adjusted to reflect current price levels and remove the influences<br />
of inflati<strong>on</strong> before being translated.<br />
The ordinary share capital of NV and PLC is translated in accordance<br />
with the Equalisati<strong>on</strong> Agreement. The difference between the<br />
resulting value for PLC and the value derived by applying the year-end<br />
rate of exchange is taken to other reserves (see note 23 <strong>on</strong> page 110).<br />
The effects of exchange rate changes during the year <strong>on</strong> net<br />
assets at the beginning of the year are recorded as a movement in<br />
shareholders’ equity, as is the difference between profit of the year<br />
retained at average rates of exchange and at year-end rates of<br />
exchange. For these purposes net assets include loans between group<br />
companies and related foreign exchange c<strong>on</strong>tracts, if any, for which<br />
settlement is neither planned nor likely to occur in the foreseeable<br />
future. Exchange gains/losses <strong>on</strong> hedges of net assets are also<br />
recorded as a movement in equity.<br />
Cumulative exchange differences arising since the transiti<strong>on</strong> date<br />
of 1 January 2004 are <str<strong>on</strong>g>report</str<strong>on</strong>g>ed as a separate comp<strong>on</strong>ent of other<br />
reserves (see note 23 <strong>on</strong> page 110). In the event of disposal or part<br />
disposal of an interest in a group company either through sale or as<br />
a result of a repayment of capital, the cumulative exchange difference<br />
is recognised in the income statement as part of the profit or loss<br />
<strong>on</strong> disposal of group companies.<br />
Business Combinati<strong>on</strong>s<br />
Business combinati<strong>on</strong>s are accounted for using the acquisiti<strong>on</strong><br />
accounting method. This involves recognising identifiable assets<br />
and liabilities of the acquired business at fair value.<br />
Acquisiti<strong>on</strong>s of minority interests are accounted for using the parent<br />
entity method, whereby the difference between the c<strong>on</strong>siderati<strong>on</strong><br />
and the book value of the share of the net assets acquired is recognised<br />
as goodwill.
Notes to the c<strong>on</strong>solidated accounts <strong>Unilever</strong> Group<br />
1 Accounting in<strong>form</strong>ati<strong>on</strong> and policies (c<strong>on</strong>tinued)<br />
Goodwill<br />
Goodwill (being the difference between the fair value of c<strong>on</strong>siderati<strong>on</strong><br />
paid for new interests in group companies, joint ventures and<br />
associates and the fair value of the Group’s share of their net<br />
identifiable assets and c<strong>on</strong>tingent liabilities at the date of acquisiti<strong>on</strong>)<br />
is capitalised. Goodwill is not amortised, but is subject to an annual<br />
review for impairment (or more frequently if necessary). Any<br />
impairment is charged to the income statement as it arises.<br />
For the purpose of impairment testing, goodwill acquired in a<br />
business combinati<strong>on</strong> is, from the acquisiti<strong>on</strong> date, allocated to each<br />
of the Group’s cash generating units, or groups of cash generating<br />
units, that are expected to benefit from the synergies of the<br />
combinati<strong>on</strong>, irrespective of whether other assets or liabilities of the<br />
acquired business are assigned to those units or group of units. Each<br />
unit or group of units to which the goodwill is allocated represents<br />
the lowest level within the Group at which the goodwill is m<strong>on</strong>itored<br />
for internal management purposes, and is not larger than a segment<br />
based <strong>on</strong> either the Group’s primary or the Group’s sec<strong>on</strong>dary<br />
<str<strong>on</strong>g>report</str<strong>on</strong>g>ing <strong>form</strong>at.<br />
Intangible assets<br />
On acquisiti<strong>on</strong> of group companies, <strong>Unilever</strong> recognises any<br />
specifically identifiable intangible assets separately from goodwill,<br />
initially measuring the intangible assets at fair value. Separately<br />
purchased intangible assets are initially measured at cost. Finite-lived<br />
intangible assets mainly comprise patented and n<strong>on</strong>-patented<br />
technology, know-how and software. These assets are capitalised<br />
and amortised <strong>on</strong> a straight-line basis in the income statement over<br />
the period of their expected useful lives, or the period of legal rights<br />
if shorter, n<strong>on</strong>e of which exceeds ten years. Periods in excess of five<br />
years are used <strong>on</strong>ly where the Directors are satisfied that the life of<br />
these assets will clearly exceed that period.<br />
Indefinite-lived intangibles are not amortised, but are subject to<br />
review for impairment.<br />
<strong>Unilever</strong> m<strong>on</strong>itors the level of product development costs against<br />
all the criteria set out in IAS 38. These include the requirement to<br />
establish that a flow of ec<strong>on</strong>omic benefits is probable before costs are<br />
capitalised. For <strong>Unilever</strong> this is evident <strong>on</strong>ly shortly before a product is<br />
launched into the market. The level of costs incurred after these<br />
criteria have been met is currently insignificant.<br />
Property, plant and equipment<br />
Property, plant and equipment is stated at cost less depreciati<strong>on</strong><br />
and impairment. Depreciati<strong>on</strong> is provided <strong>on</strong> a straight-line basis at<br />
percentages of cost based <strong>on</strong> the expected average useful lives of the<br />
assets and their residual values. Estimated useful lives by major class<br />
of assets are as follows:<br />
Freehold buildings 40 years<br />
(no depreciati<strong>on</strong> <strong>on</strong> freehold land)<br />
Leasehold buildings 40 years*<br />
Plant and equipment 2–20 years<br />
*or life of lease if less than 40 years<br />
Property, plant and equipment is subject to review for impairment<br />
if triggering events or circumstances indicate that this is necessary.<br />
Any impairment is charged to the income statement as it arises.<br />
Other n<strong>on</strong>-current assets<br />
Joint ventures are undertakings in which the Group has an interest<br />
and which are jointly c<strong>on</strong>trolled by the Group and <strong>on</strong>e or more other<br />
parties. Associates are undertakings in which the Group has an<br />
investment and can exercise significant influence.<br />
Interests in joint ventures and associates are accounted for using the<br />
equity method and are stated in the c<strong>on</strong>solidated balance sheet at<br />
cost, adjusted for the movement in the Group’s share of their net<br />
assets and liabilities. The Group’s share of the profit or loss after tax<br />
of joint ventures and associates is included in the Group’s<br />
c<strong>on</strong>solidated profit before taxati<strong>on</strong>.<br />
Biological assets are stated at fair value less estimated<br />
point-of-sale costs.<br />
Financial instruments<br />
Financial instruments are recognised when the Group becomes party<br />
to the c<strong>on</strong>tract. They are initially measured at fair value (the transacti<strong>on</strong><br />
price) adjusted, in the case of instruments not classified as fair value<br />
through profit or loss, by directly attributable transacti<strong>on</strong> costs.<br />
Financial assets<br />
Market purchases and sales of financial assets are recognised using<br />
settlement date accounting. Financial assets, other than those which<br />
are financial assets at fair value through profit or loss, are initially<br />
recognised at fair value plus directly attributable transacti<strong>on</strong> costs. Any<br />
impairment of a financial asset is charged to the income statement as<br />
it arises.<br />
Financial assets are classified according to the purpose for which<br />
the investments were acquired. This gives rise to the following<br />
categories: held-to-maturity investments, loans and receivables,<br />
available-for-sale financial assets and financial assets at fair value<br />
through profit or loss. <strong>Unilever</strong> determines the classificati<strong>on</strong> of its<br />
investments at initial recogniti<strong>on</strong>.<br />
Held-to-maturity investments<br />
Held-to-maturity investments are n<strong>on</strong>-derivative financial assets with<br />
fixed or determinable payments and fixed maturities that management<br />
has the positive intenti<strong>on</strong> and ability to hold to maturity. They are<br />
included in n<strong>on</strong>-current investments at amortised cost using the effective<br />
interest method, less any amounts written off to reflect impairment.<br />
Loans and receivables<br />
Loans and receivables are n<strong>on</strong>-derivative financial assets with fixed<br />
or determinable payments that are not quoted in an active market.<br />
They arise when the Group provides m<strong>on</strong>ey, goods or services directly<br />
to a counterparty with no intenti<strong>on</strong> of trading the receivable. Loans<br />
and receivables are included in trade and other receivables in the<br />
balance sheet at amortised cost.<br />
Short-term loans and receivables are initially measured at original<br />
invoice amount and subsequently measured after deducting any<br />
provisi<strong>on</strong> for impairment.<br />
Available-for-sale financial assets<br />
Available-for-sale financial assets are n<strong>on</strong>-derivative financial assets<br />
that are either designated in this category or not classified in any of<br />
the other categories. They are included in n<strong>on</strong>-current assets unless<br />
management intends to dispose of the investment within 12 m<strong>on</strong>ths<br />
of the balance sheet date. When securities classified as available-forsale<br />
are sold or impaired, the accumulated fair value adjustments<br />
recognised in equity are included in the income statement as gains<br />
and losses from investment securities. Interest <strong>on</strong> available-for-sale<br />
securities calculated using the effective interest rate method is<br />
recognised in the income statement as part of other income.<br />
Dividends <strong>on</strong> available-for-sale equity instruments are recognised in<br />
the income statement as part of other income when the Group’s right<br />
to receive payment is established.<br />
Financial assets at fair value through profit or loss<br />
A financial asset is classified in this category if acquired principally for<br />
the purpose of selling in the short term or if so designated. Derivatives<br />
are also classified in this category unless they are designated as<br />
hedges. Assets in this category are classified as current assets if they<br />
are either held-for-trading or are expected to be realised within 12<br />
m<strong>on</strong>ths of the balance sheet date. Directly attributable transacti<strong>on</strong><br />
costs related to the purchase of the assets are expensed as incurred.<br />
Gains and losses arising from changes in fair value are included in the<br />
income statement.<br />
<strong>Unilever</strong> <str<strong>on</strong>g>Annual</str<strong>on</strong>g> Report <strong>on</strong> Form 20-F <strong>2006</strong> 75<br />
Financial Statements (c<strong>on</strong>tinued)
Financial Statements (c<strong>on</strong>tinued)<br />
Notes to the c<strong>on</strong>solidated accounts <strong>Unilever</strong> Group<br />
1 Accounting in<strong>form</strong>ati<strong>on</strong> and policies (c<strong>on</strong>tinued)<br />
Borrowings and other financial liabilities<br />
Borrowings are recognised initially at fair value, net of transacti<strong>on</strong><br />
costs incurred. Borrowings are subsequently stated at amortised cost<br />
unless they are part of a fair value hedge accounting relati<strong>on</strong>ship;<br />
any difference between the amount <strong>on</strong> initial recogniti<strong>on</strong> and the<br />
redempti<strong>on</strong> value is recognised in the income statement over the<br />
period of the borrowings using the effective interest method. Those<br />
borrowings that are part of a fair value hedge accounting relati<strong>on</strong>ship<br />
are also recorded <strong>on</strong> an amortised cost basis, plus or minus the fair<br />
value attributable to the risk being hedged with a corresp<strong>on</strong>ding entry<br />
in the income statement.<br />
Short-term financial liabilities are measured at original invoice<br />
amount. Borrowing costs are not capitalised as part of property,<br />
plant and equipment.<br />
Derivative financial instruments<br />
Derivatives are measured <strong>on</strong> the balance sheet at fair value. The<br />
activities of the Group expose it primarily to the financial risks of<br />
changes in foreign currency exchange rates and interest rates. The<br />
Group uses foreign exchange forward c<strong>on</strong>tracts, interest rate swap<br />
c<strong>on</strong>tracts and forward rate agreements to hedge these exposures.<br />
The Group also uses commodity c<strong>on</strong>tracts to hedge future<br />
requirements for certain raw materials, almost always for physical<br />
delivery. Those c<strong>on</strong>tracts that can also be settled in cash are treated<br />
as a financial instrument. The Group does not use derivative financial<br />
instruments for speculative purposes. The use of leveraged<br />
instruments is not permitted.<br />
Changes in the fair value of derivative financial instruments that<br />
are designated and effective as hedges of future cash flows are<br />
recognised directly in equity, and any ineffective porti<strong>on</strong> is recognised<br />
immediately in the income statement. If the cash flow hedge of a firm<br />
commitment or forecasted transacti<strong>on</strong> subsequently results in the<br />
recogniti<strong>on</strong> of a n<strong>on</strong>-financial asset or a liability, then, at the time the<br />
n<strong>on</strong>-financial asset or liability is recognised, the associated gains or<br />
losses <strong>on</strong> the derivative that had previously been recognised in equity<br />
are included in the initial measurement of the n<strong>on</strong>-financial asset or<br />
liability. For hedged items that do not result in the recogniti<strong>on</strong> of a<br />
n<strong>on</strong>-financial asset or a liability, amounts deferred in equity are<br />
recognised in the income statement in the same period in which<br />
the hedged item affects net profit or loss.<br />
Hedge accounting is disc<strong>on</strong>tinued when the hedging instrument no<br />
l<strong>on</strong>ger qualifies for hedge accounting. At that time, any cumulative<br />
gain or loss <strong>on</strong> the hedging instrument recognised in equity is<br />
retained in equity until the forecasted transacti<strong>on</strong> occurs. If a hedged<br />
transacti<strong>on</strong> is no l<strong>on</strong>ger expected to occur, the net cumulative gain<br />
or loss recognised in equity is transferred to the income statement.<br />
For an effective hedge of an exposure to changes in the fair value<br />
of recognised assets and liabilities, the hedged item is adjusted for<br />
changes in fair value attributable to the risk being hedged with<br />
the corresp<strong>on</strong>ding entry in the income statement. Gains or losses<br />
from re-measuring the derivative, or for n<strong>on</strong>-derivatives the foreign<br />
currency comp<strong>on</strong>ent of its carrying amount, are recognised in the<br />
income statement.<br />
Changes in fair value of net investment hedges in relati<strong>on</strong> to foreign<br />
subsidiaries are recognised directly in equity. Gains and losses<br />
accumulated in equity are included in the income statement when<br />
the foreign operati<strong>on</strong> is partially disposed of or sold.<br />
Changes in the fair value of derivative financial instruments that<br />
do not qualify for hedge accounting are recognised in the income<br />
statement as they arise.<br />
Derivatives embedded in other financial instruments or other host<br />
c<strong>on</strong>tracts are treated as separate derivatives when their risks and<br />
characteristics are not closely related to those of host c<strong>on</strong>tracts and<br />
the host c<strong>on</strong>tracts are carried at fair value with unrealised gains<br />
or losses <str<strong>on</strong>g>report</str<strong>on</strong>g>ed in the income statement.<br />
76 <strong>Unilever</strong> <str<strong>on</strong>g>Annual</str<strong>on</strong>g> Report <strong>on</strong> Form 20-F <strong>2006</strong><br />
Valuati<strong>on</strong> principles<br />
The fair values of quoted investments are based <strong>on</strong> current bid prices.<br />
For unlisted and for listed securities where the market for a financial<br />
asset is not active the Group establishes fair value using valuati<strong>on</strong><br />
techniques. These include the use of recent arm’s length transacti<strong>on</strong>s,<br />
reference to other instruments that are substantially the same and<br />
discounted cash flow analysis.<br />
Impairment of financial instruments<br />
At each balance sheet date the Group assesses whether there is<br />
objective evidence that a financial asset or a group of financial assets<br />
is impaired. In the case of equity securities classified as available-forsale,<br />
a significant or prol<strong>on</strong>ged decline in the fair value of the security<br />
below its cost is c<strong>on</strong>sidered in determining whether the securities are<br />
impaired. If any such evidence exists for available-for-sale financial<br />
assets, the cumulative loss – measured as the difference between the<br />
acquisiti<strong>on</strong> cost and the current fair value, less any impairment loss <strong>on</strong><br />
that financial asset previously recognised in profit or loss – is removed<br />
from equity and recognised in the income statement. Impairment<br />
losses recognised in the income statement <strong>on</strong> equity instruments are<br />
not subsequently reversed through the income statement.<br />
Inventories<br />
Inventories are valued at the lower of weighted average cost and net<br />
realisable value. Cost comprises direct costs and, where appropriate,<br />
a proporti<strong>on</strong> of attributable producti<strong>on</strong> overheads.<br />
Cash and cash equivalents<br />
For the purpose of preparati<strong>on</strong> of the cash flow statement, cash and<br />
cash equivalents includes cash at bank and in hand, highly liquid<br />
interest bearing securities with original maturities of three m<strong>on</strong>ths<br />
or less, and bank overdrafts.<br />
Pensi<strong>on</strong>s and similar obligati<strong>on</strong>s<br />
The operating and financing costs of defined benefit plans are<br />
recognised separately in the income statement. Service costs are<br />
systematically allocated over the service lives of employees, and<br />
financing costs are recognised in the periods in which they arise. The<br />
costs of individual events such as past service benefit enhancements,<br />
settlements and curtailments are recognised immediately in the<br />
income statement. Variati<strong>on</strong>s from expected costs, arising from the<br />
experience of the plans or changes in actuarial assumpti<strong>on</strong>s, are<br />
recognised immediately in the statement of recognised income<br />
and expense. The assets and liabilities of defined benefit plans<br />
are recognised at fair value in the balance sheet.<br />
The charges to the income statement for defined c<strong>on</strong>tributi<strong>on</strong> plans<br />
are the company c<strong>on</strong>tributi<strong>on</strong>s payable, and the assets and liabilities<br />
of such plans are not included in the balance sheet of the Group.<br />
All defined benefit plans are subject to regular actuarial review using<br />
the projected unit method, either by external c<strong>on</strong>sultants or by<br />
actuaries employed by <strong>Unilever</strong>. Group policy is that the most<br />
important plans, representing approximately 80% of the defined<br />
benefit liabilities, are <strong>form</strong>ally valued every year; other principal plans,<br />
accounting for approximately a further 15% of liabilities, have their<br />
liabilities updated each year. Group policy for the remaining plans<br />
requires a full actuarial valuati<strong>on</strong> at least every three years. Asset<br />
values for all plans are updated every year.<br />
Taxati<strong>on</strong><br />
Income tax <strong>on</strong> the profit or loss for the year comprises current and<br />
deferred tax. Income tax is recognised in the income statement except<br />
to the extent that it relates to items recognised directly in equity.<br />
Current tax is the expected tax payable <strong>on</strong> the taxable income for<br />
the year, using tax rates enacted or substantively enacted at the<br />
balance sheet date, and any adjustments to tax payable in respect<br />
of previous years.
Notes to the c<strong>on</strong>solidated accounts <strong>Unilever</strong> Group<br />
1 Accounting in<strong>form</strong>ati<strong>on</strong> and policies (c<strong>on</strong>tinued)<br />
Deferred taxati<strong>on</strong> is recognised using the liability method <strong>on</strong> taxable<br />
temporary differences between the tax base and the accounting base<br />
of items included in the balance sheet of the Group. The following<br />
temporary differences are not provided for: goodwill not deductible for<br />
tax purposes, the initial recogniti<strong>on</strong> of assets or liabilities that affect<br />
neither accounting nor taxable profit, and differences relating to<br />
investments in subsidiaries to the extent that they will probably not<br />
reverse in the forseeable future. The amount of deferred tax provided<br />
is based <strong>on</strong> the expected manner of realisati<strong>on</strong> or settlement of the<br />
carrying amount of assets and liabilities, using tax rates prevailing at the<br />
year end unless future rates have been enacted or substantively enacted.<br />
A deferred tax asset is recognised <strong>on</strong>ly to the extent that it is probable<br />
that future taxable profits will be available against which the asset can<br />
be utilised. Deferred tax assets are reduced to the extent that it is no<br />
l<strong>on</strong>ger probable that the related tax benefit will be realised.<br />
Provisi<strong>on</strong>s<br />
Provisi<strong>on</strong>s are recognised when either a legal or c<strong>on</strong>structive<br />
obligati<strong>on</strong>, as a result of a past event, exists at the balance sheet date<br />
and where the amount of the obligati<strong>on</strong> can be reliably estimated.<br />
Segment in<strong>form</strong>ati<strong>on</strong><br />
Segmental in<strong>form</strong>ati<strong>on</strong> is provided <strong>on</strong> the basis of geographical<br />
segments and product categories. The primary <strong>form</strong>at, geographic<br />
regi<strong>on</strong>s, is based <strong>on</strong> the management structure of the Group, which<br />
operates in three geographical regi<strong>on</strong>s.<br />
Revenue recogniti<strong>on</strong><br />
Turnover comprises sales of goods and services after deducti<strong>on</strong> of<br />
discounts and sales taxes. It does not include sales between group<br />
companies. Discounts given by <strong>Unilever</strong> include rebates, price<br />
reducti<strong>on</strong>s and incentives given to customers, promoti<strong>on</strong>al coup<strong>on</strong>ing<br />
and trade communicati<strong>on</strong> costs.<br />
Turnover is recognised when the risks and rewards of the underlying<br />
products and services have been substantially transferred to the<br />
customer. Revenue from services is recognised as the services<br />
are per<strong>form</strong>ed. Interest revenue is recognised as interest accrues<br />
using the effective interest method.<br />
Research and market support costs<br />
Expenditure <strong>on</strong> research and market support, such as advertising,<br />
is charged to the income statement when incurred.<br />
Leases<br />
Leases are classified as finance leases whenever the terms of the lease<br />
transfer substantially all the risks and rewards of ownership to the<br />
lessee. All other leases are classified as operating leases.<br />
Assets held under finance leases are recognised as n<strong>on</strong>-current assets<br />
of the Group at their fair value at the date of commencement of<br />
the lease or, if lower, at the present value of the minimum lease<br />
payments. The corresp<strong>on</strong>ding liability to the lessor is included in<br />
the balance sheet as a finance lease obligati<strong>on</strong>. Lease payments are<br />
apporti<strong>on</strong>ed between finance charges and reducti<strong>on</strong> of the lease<br />
obligati<strong>on</strong> so as to achieve a c<strong>on</strong>stant rate of interest <strong>on</strong> the<br />
remaining balance of the liability. Finance charges are charged<br />
directly against income.<br />
A profit or loss is recognised <strong>on</strong> a sale and leaseback transacti<strong>on</strong><br />
based <strong>on</strong> the difference between sales proceeds and the carrying<br />
amount of the asset. Where the transacti<strong>on</strong> results in a finance lease,<br />
the profit or loss is deferred and amortised over the lease term.<br />
Where the transacti<strong>on</strong> results in an operating lease, any profit or<br />
loss is recognised immediately with reference to the proceeds of<br />
sale and the fair value of the asset.<br />
Lease payments relating to operating leases are charged to the<br />
income statement <strong>on</strong> a straight-line basis over the lease term.<br />
Share-based payments<br />
The ec<strong>on</strong>omic cost of awarding shares and share opti<strong>on</strong>s to<br />
employees is reflected by recording a charge in the income statement<br />
equivalent to the fair value of the benefit awarded over the vesting<br />
period. The fair value is determined with reference to opti<strong>on</strong> pricing<br />
models, principally adjusted Black-Scholes models or a multinomial<br />
pricing model.<br />
Shares held by employee share trusts<br />
The assets and liabilities of certain PLC trusts, NV and group<br />
companies which purchase and hold NV and PLC shares to satisfy<br />
opti<strong>on</strong>s granted are included in the c<strong>on</strong>solidated accounts. The<br />
book value of shares held is deducted from other reserves, and trust<br />
borrowings are included in the Group’s borrowings. The costs of the<br />
trusts are included in the results of the Group. These shares are<br />
excluded from the calculati<strong>on</strong> of earnings per share.<br />
Assets held for sale<br />
Assets and groups of assets and liabilities which comprise disposal<br />
groups are classified as ‘held for sale’ when all of the following criteria<br />
are met: a decisi<strong>on</strong> has been made to sell, the assets are available for<br />
sale immediately, the assets are being actively marketed, and a sale<br />
has been or is expected to be c<strong>on</strong>cluded within twelve m<strong>on</strong>ths of<br />
the balance sheet date. Assets and disposal groups held for sale<br />
are valued at the lower of book value or fair value less disposal<br />
costs. Assets held for sale are not depreciated.<br />
Critical accounting estimates and judgements<br />
Estimates and judgements are c<strong>on</strong>tinually evaluated and are based<br />
<strong>on</strong> historical experience and other factors, including expectati<strong>on</strong>s<br />
of future events that are believed to be reas<strong>on</strong>able under the<br />
circumstances.<br />
The preparati<strong>on</strong> of financial statements under IFRS requires<br />
management to make estimates and assumpti<strong>on</strong>s c<strong>on</strong>cerning the<br />
future. The resulting accounting estimates will, by definiti<strong>on</strong>, seldom<br />
equal the related actual results. The estimates and assumpti<strong>on</strong>s that<br />
have a significant risk of causing a material adjustment to the carrying<br />
amounts of assets and liabilities within the next financial year are<br />
discussed below.<br />
Income statement presentati<strong>on</strong><br />
On the face of the income statement, costs and revenues relating<br />
to restructuring, business disposals and impairments are disclosed.<br />
In additi<strong>on</strong>, individual items judged to be significant are disclosed<br />
separately. These are material in terms of nature and amount. These<br />
disclosures are given in order to provide additi<strong>on</strong>al in<strong>form</strong>ati<strong>on</strong> to help<br />
users better understand financial per<strong>form</strong>ance.<br />
Impairment of goodwill and indefinite-lived intangible assets<br />
Impairment reviews in respect of goodwill and intangible assets are<br />
per<strong>form</strong>ed at least annually. More regular reviews are per<strong>form</strong>ed if<br />
events indicate that this is necessary. Examples of such triggering<br />
events would include a significant planned restructuring, a major<br />
change in market c<strong>on</strong>diti<strong>on</strong>s or technology, expectati<strong>on</strong>s of future<br />
operating losses, or negative cash flows.<br />
The recoverable amounts of cash-generating units are determined<br />
based <strong>on</strong> the higher of fair value less costs to sell and value-in-use<br />
calculati<strong>on</strong>s. These calculati<strong>on</strong>s require the use of estimates. Details<br />
of key assumpti<strong>on</strong>s made are set out in note 9 <strong>on</strong> page 89.<br />
Retirement benefits<br />
Pensi<strong>on</strong> accounting requires certain assumpti<strong>on</strong>s to be made in order<br />
to value our obligati<strong>on</strong>s and to determine the charges to be made<br />
to the income statement. These figures are particularly sensitive to<br />
assumpti<strong>on</strong>s for discount rates, mortality, inflati<strong>on</strong> rates and expected<br />
l<strong>on</strong>g-term rates of return <strong>on</strong> assets. Details of assumpti<strong>on</strong>s made are<br />
given in note 20 <strong>on</strong> pages 103 and 104.<br />
<strong>Unilever</strong> <str<strong>on</strong>g>Annual</str<strong>on</strong>g> Report <strong>on</strong> Form 20-F <strong>2006</strong> 77<br />
Financial Statements (c<strong>on</strong>tinued)
Financial Statements (c<strong>on</strong>tinued)<br />
Notes to the c<strong>on</strong>solidated accounts <strong>Unilever</strong> Group<br />
1 Accounting in<strong>form</strong>ati<strong>on</strong> and policies (c<strong>on</strong>tinued)<br />
Taxati<strong>on</strong><br />
The Group is subject to taxes in numerous jurisdicti<strong>on</strong>s. Significant<br />
judgement is required in determining worldwide provisi<strong>on</strong> for taxes.<br />
There are many transacti<strong>on</strong>s and calculati<strong>on</strong>s during the ordinary<br />
course of business for which the ultimate tax determinati<strong>on</strong> is<br />
uncertain. The Group recognises liabilities for anticipated tax audit<br />
issues based <strong>on</strong> estimates of whether additi<strong>on</strong>al taxes will be due.<br />
Where the final tax outcome of these matters is different from the<br />
amounts that were initially recorded, such differences will impact the<br />
income tax and deferred tax provisi<strong>on</strong>s in the period in which such<br />
determinati<strong>on</strong> is made.<br />
Provisi<strong>on</strong>s<br />
Provisi<strong>on</strong> is made, am<strong>on</strong>g other reas<strong>on</strong>s, for legal matters, disputed<br />
indirect taxes, employee terminati<strong>on</strong> costs and restructuring where<br />
a legal or c<strong>on</strong>structive obligati<strong>on</strong> exists at the balance sheet date and<br />
a reliable estimate can be made of the likely outcome. The nature of<br />
these costs is such that judgement has to be applied to estimate the<br />
timing and amount of cash outflows.<br />
Recent accounting developments<br />
IFRS 7, ‘Financial Instruments: Disclosures’, (effective from 1 January<br />
2007), introduces significant new disclosures to improve the<br />
in<strong>form</strong>ati<strong>on</strong> about financial instruments. It requires the disclosures<br />
of qualitative and quantitative in<strong>form</strong>ati<strong>on</strong> about exposure to risks<br />
arising from financial instruments, including specified minimum<br />
disclosures about credit risk, liquidity risk and market risk, including<br />
analysis of sensitivity to market risk. It replaces disclosure requirements<br />
in IAS 32, ‘Financial Instruments: Disclosure and Presentati<strong>on</strong>’.<br />
In additi<strong>on</strong> an amendment has been issued to IAS 1 ‘Presentati<strong>on</strong> of<br />
Financial Statements’ which requires <strong>Unilever</strong> to make new disclosures<br />
to enable the users of financial statements to evaluate the Group’s<br />
objectives, policies and processes for managing capital.<br />
<strong>Unilever</strong> will apply IFRS 7 and the amendment to IAS 1 from<br />
January 2007.<br />
78 <strong>Unilever</strong> <str<strong>on</strong>g>Annual</str<strong>on</strong>g> Report <strong>on</strong> Form 20-F <strong>2006</strong><br />
IFRS 8 ‘Operating Segments’ (effective from 1 January 2009)<br />
introduces a management <str<strong>on</strong>g>report</str<strong>on</strong>g>ing approach to segment <str<strong>on</strong>g>report</str<strong>on</strong>g>ing.<br />
The in<strong>form</strong>ati<strong>on</strong> <str<strong>on</strong>g>report</str<strong>on</strong>g>ed would be that which management uses<br />
internally for evaluating the per<strong>form</strong>ance of operating segments<br />
and allocating resources to those segments. It replaces disclosure<br />
requirements in IAS 14 ‘Segment Reporting’ and its impact is currently<br />
being assessed by the Group.<br />
The following interpretati<strong>on</strong>s, relevant to <strong>Unilever</strong>, have been released<br />
and will be adopted by <strong>Unilever</strong> <strong>on</strong> the dates as noted. Adopti<strong>on</strong> is<br />
not expected to have a material effect <strong>on</strong> the c<strong>on</strong>solidated results of<br />
operati<strong>on</strong>s or financial positi<strong>on</strong> of <strong>Unilever</strong>.<br />
• IFRIC 7, ‘Applying the Restatement Approach’ under IAS 29<br />
‘Financial Reporting in Hyperinflati<strong>on</strong>ary Ec<strong>on</strong>omies’ (effective for<br />
<strong>Unilever</strong> from 1 January 2007) provides guidance <strong>on</strong> how to apply<br />
the requirements of IAS 29 in a <str<strong>on</strong>g>report</str<strong>on</strong>g>ing period in which an entity<br />
identifies the existence of hyperinflati<strong>on</strong> in the ec<strong>on</strong>omy when that<br />
ec<strong>on</strong>omy was not hyperinflati<strong>on</strong>ary in the prior period.<br />
• IFRIC 9 ‘Reassessment of embedded derivatives’ (effective for<br />
<strong>Unilever</strong> from 1 January 2007) requires an entity to assess whether<br />
a c<strong>on</strong>tract c<strong>on</strong>tains an embedded derivative at the date an entity<br />
first becomes a party to the c<strong>on</strong>tract and prohibits reassessment<br />
unless there is a change to the c<strong>on</strong>tract that significantly modifies<br />
the cash flows.<br />
• IFRIC 10 ‘Interim Financial Reporting and Impairment’ (effective for<br />
<strong>Unilever</strong> from 1 January 2007) states that any impairment loss<br />
recognised for goodwill and equity instruments classified as<br />
available for sale in an interim period may not be reversed in<br />
subsequent interim periods.<br />
Recent changes in <str<strong>on</strong>g>report</str<strong>on</strong>g>ing requirements under US GAAP are<br />
discussed in note 34 <strong>on</strong> page 131.
Notes to the c<strong>on</strong>solidated accounts <strong>Unilever</strong> Group<br />
2 Segment in<strong>form</strong>ati<strong>on</strong><br />
Our primary <str<strong>on</strong>g>report</str<strong>on</strong>g>ing segments are geographic, comprising our three operating regi<strong>on</strong>s of Europe, The Americas and Asia Africa. The home<br />
countries of the <strong>Unilever</strong> Group are the Netherlands and the United Kingdom. Turnover for these two countries combined in <strong>2006</strong> was<br />
€3 710 milli<strong>on</strong> (2005: €3 679 milli<strong>on</strong>; 2004: €3 831 milli<strong>on</strong>). The combined operating profit in <strong>2006</strong> was €555 milli<strong>on</strong> (2005: €648 milli<strong>on</strong>;<br />
2004: €667 milli<strong>on</strong>). Turnover for the United States for <strong>2006</strong> was €7 627 milli<strong>on</strong> (2005: €7 550 milli<strong>on</strong>; 2004: €7 361 milli<strong>on</strong>). No other<br />
countries had turnover of more than 10% of the group total.<br />
The analysis of turnover by geographical area is stated <strong>on</strong> the basis of origin. Turnover <strong>on</strong> a destinati<strong>on</strong> basis would not be materially different.<br />
Inter-segment sales between geographical areas and between product areas as <strong>on</strong> page 81 are not material. Total assets and capital expenditure<br />
are based <strong>on</strong> the locati<strong>on</strong> of the assets. Segment results are presented <strong>on</strong> the basis of operating profit. Segment assets c<strong>on</strong>sist primarily of<br />
property, plant and equipment, goodwill and other intangible assets, inventories and receivables. Corporate assets c<strong>on</strong>sist of financial assets,<br />
cash and cash equivalents, other n<strong>on</strong>-current investments and pensi<strong>on</strong> and current and deferred tax assets. Segment liabilities c<strong>on</strong>sist primarily<br />
of trade payables and other liabilities. Corporate liabilities include borrowings, tax balances payable, provisi<strong>on</strong>s and pensi<strong>on</strong> and deferred tax<br />
liabilities. Capital expenditure comprises additi<strong>on</strong>s to property, plant and equipment and intangible assets, including additi<strong>on</strong>s resulting from<br />
acquisiti<strong>on</strong>s. Other n<strong>on</strong>-cash charges include charges to the income statement during the year in respect of share-based compensati<strong>on</strong>,<br />
restructuring and other provisi<strong>on</strong>s.<br />
Additi<strong>on</strong>al segment in<strong>form</strong>ati<strong>on</strong> relevant to <str<strong>on</strong>g>report</str<strong>on</strong>g>ing in the United States is set out in note 35 <strong>on</strong> pages 132 to 133.<br />
€ milli<strong>on</strong> € milli<strong>on</strong> € milli<strong>on</strong> € milli<strong>on</strong><br />
The Asia<br />
Analysis by geographical segment Europe Americas Africa Total<br />
<strong>2006</strong><br />
Turnover 15 000 13 779 10 863 39 642<br />
Operating profit 1 903 2 178 1 327 5 408<br />
Net finance costs (721)<br />
Share of net profit/(loss) of joint ventures 17 60 1 78<br />
Share of net profit/(loss) of associates 36 – – 36<br />
Other income from n<strong>on</strong>-current investments 30<br />
Profit before taxati<strong>on</strong> 4 831<br />
Taxati<strong>on</strong> (1 146)<br />
Net profit from c<strong>on</strong>tinuing operati<strong>on</strong>s 3 685<br />
Net profit from disc<strong>on</strong>tinued operati<strong>on</strong>s 1 330<br />
Net profit 5 015<br />
2005<br />
Turnover 14 940 13 179 10 282 38 401<br />
Operating profit 2 064 1 719 1 291 5 074<br />
Net finance costs (613)<br />
Share of net profit/(loss) of joint ventures 11 36 – 47<br />
Share of net profit/(loss) of associates (25) 1 (1) (25)<br />
Other income from n<strong>on</strong>-current investments 33<br />
Profit before taxati<strong>on</strong> 4 516<br />
Taxati<strong>on</strong> (1 181)<br />
Net profit from c<strong>on</strong>tinuing operati<strong>on</strong>s 3 335<br />
Net profit from disc<strong>on</strong>tinued operati<strong>on</strong>s 640<br />
Net profit 3 975<br />
2004<br />
Turnover 15 252 12 296 9 620 37 168<br />
Operating profit 2 045 896 1 040 3 981<br />
Net finance costs (623)<br />
Share of net profit/(loss) of joint ventures 6 31 2 39<br />
Share of net profit/(loss) of associates (2) 3 1 2<br />
Other income from n<strong>on</strong>-current investments 54<br />
Profit before taxati<strong>on</strong> 3 453<br />
Taxati<strong>on</strong> (725)<br />
Net profit from c<strong>on</strong>tinuing operati<strong>on</strong>s 2 728<br />
Net profit from disc<strong>on</strong>tinued operati<strong>on</strong>s 213<br />
Net profit 2 941<br />
<strong>Unilever</strong> <str<strong>on</strong>g>Annual</str<strong>on</strong>g> Report <strong>on</strong> Form 20-F <strong>2006</strong> 79<br />
Financial Statements (c<strong>on</strong>tinued)
Financial Statements (c<strong>on</strong>tinued)<br />
Notes to the c<strong>on</strong>solidated accounts <strong>Unilever</strong> Group<br />
2 Segment in<strong>form</strong>ati<strong>on</strong> (c<strong>on</strong>tinued)<br />
€ milli<strong>on</strong> € milli<strong>on</strong> € milli<strong>on</strong> € milli<strong>on</strong><br />
The Asia<br />
Analysis by geographical segment Europe Americas Africa Total<br />
Assets<br />
<strong>2006</strong><br />
Segment assets 14 445 11 550 5 875 31 870<br />
Joint ventures/associates 78 16 9 103<br />
Total assets by geographical segment 14 523 11 566 5 884 31 973<br />
Corporate assets 5 099<br />
Total assets 37 072<br />
2005<br />
Segment assets (a) 15 138 12 532 6 299 33 969<br />
Joint ventures/associates 26 37 21 84<br />
Total assets by geographical segment 15 164 12 569 6 320 34 053<br />
Corporate assets 5 447<br />
Total assets 39 500<br />
Liabilities<br />
<strong>2006</strong><br />
Segment liabilities 4 375 1 732 2 192 8 299<br />
Joint ventures/associates 18 11 5 34<br />
Total liabilities by geographical segment 4 393 1 743 2 197 8 333<br />
Corporate liabilities 17 067<br />
Total liabilities 25 400<br />
2005<br />
Segment liabilities 4 485 1 914 2 244 8 643<br />
Joint ventures/associates 20 11 6 37<br />
Total liabilities by geographical segment 4 505 1 925 2 250 8 680<br />
Corporate liabilities 22 055<br />
Total liabilities 30 735<br />
Capital expenditure<br />
<strong>2006</strong> 511 396 294 1 201<br />
2005 447 305 298 1 050<br />
Depreciati<strong>on</strong> of property, plant and equipment<br />
<strong>2006</strong> (368) (239) (180) (787)<br />
2005 (390) (230) (150) (770)<br />
2004 (429) (303) (217) (949)<br />
Amortisati<strong>on</strong> of finite-lived intangible assets and software<br />
<strong>2006</strong> (63) (76) (18) (157)<br />
2005 (52) (38) (9) (99)<br />
2004 (37) (24) (3) (64)<br />
(a) During the year the Directors have reassessed the allocati<strong>on</strong> of goodwill to segments following the implementati<strong>on</strong> of a new operating<br />
framework and establishment of primary segments based <strong>on</strong> geographies during 2005. The reassessment is based <strong>on</strong> the relative fair<br />
values of the segments at the time of the implementati<strong>on</strong> of the new operating framework and results in a reallocati<strong>on</strong> of goodwill (and<br />
associated currency retranslati<strong>on</strong> effects during 2005) from Europe and The Americas regi<strong>on</strong>s of €0.1 billi<strong>on</strong> and €1.1 billi<strong>on</strong> respectively<br />
into the Asia Africa regi<strong>on</strong>. Segmental amounts for 2005 have been amended to reflect this allocati<strong>on</strong>.<br />
80 <strong>Unilever</strong> <str<strong>on</strong>g>Annual</str<strong>on</strong>g> Report <strong>on</strong> Form 20-F <strong>2006</strong>
Notes to the c<strong>on</strong>solidated accounts <strong>Unilever</strong> Group<br />
2 Segment in<strong>form</strong>ati<strong>on</strong> (c<strong>on</strong>tinued)<br />
€ milli<strong>on</strong> € milli<strong>on</strong> € milli<strong>on</strong> € milli<strong>on</strong><br />
The Asia<br />
Analysis by geographical segment Europe Americas Africa Total<br />
Impairment charges<br />
<strong>2006</strong><br />
Goodwill (12) – – (12)<br />
Intangible assets – (2) – (2)<br />
Total impairment charge (12) (2) – (14)<br />
2005<br />
Goodwill – (129) (2) (131)<br />
Intangible assets – (241) (10) (251)<br />
Other – – (15) (15)<br />
Total impairment charge – (370) (27) (397)<br />
2004<br />
Goodwill (147) (793) (63) (1 003)<br />
Other n<strong>on</strong>-cash charges<br />
<strong>2006</strong> (679) (231) (52) (962)<br />
2005 (224) (311) (53) (588)<br />
2004 (417) (472) (194) (1 083)<br />
Although the Group’s operati<strong>on</strong>s are managed <strong>on</strong> a geographical basis, the two Foods and Home and Pers<strong>on</strong>al Care categories manage brands<br />
which we group into our principal product areas; these are our sec<strong>on</strong>dary <str<strong>on</strong>g>report</str<strong>on</strong>g>ing segments and are listed below. In <strong>2006</strong>, we reviewed the<br />
structure of our sec<strong>on</strong>dary <str<strong>on</strong>g>report</str<strong>on</strong>g>ing segments in the light of the planned disposal of the majority of our European frozen foods businesses. As<br />
a c<strong>on</strong>sequence we are presenting the main product areas in four <str<strong>on</strong>g>report</str<strong>on</strong>g>ing segments, as opposed to six <str<strong>on</strong>g>report</str<strong>on</strong>g>ing segments in 2005. We have<br />
presented the in<strong>form</strong>ati<strong>on</strong> <strong>on</strong> this basis, as the products in each of the four <str<strong>on</strong>g>report</str<strong>on</strong>g>ed segments are substantially similar in nature, and combining<br />
the segments provides more meaningful in<strong>form</strong>ati<strong>on</strong>. In<strong>form</strong>ati<strong>on</strong> for prior years has been restated accordingly.<br />
Savoury, dressings and spreads – including sales of soups, bouill<strong>on</strong>s, sauces, snacks, may<strong>on</strong>naise, salad dressings, olive oil, margarines and<br />
spreads, and cooking products such as liquid margarines.<br />
Ice cream and beverages – including sales of ice cream, tea, weight management products, and nutriti<strong>on</strong>ally enhanced staples sold in<br />
developing markets.<br />
Pers<strong>on</strong>al care – including sales of skin care and hair care products, deodorants and anti-perspirants, and oral care products.<br />
Home care and other operati<strong>on</strong>s – including sales of home care products, such as laundry powders and liquids, and a wide range of cleaning<br />
products. To support our c<strong>on</strong>sumer brands, we own tea plantati<strong>on</strong>s and palm oil plantati<strong>on</strong>s, the results of which are <str<strong>on</strong>g>report</str<strong>on</strong>g>ed within this segment.<br />
€ milli<strong>on</strong> € milli<strong>on</strong> € milli<strong>on</strong> € milli<strong>on</strong> € milli<strong>on</strong> € milli<strong>on</strong> € milli<strong>on</strong><br />
Home Home<br />
Savoury, Ice cream care and<br />
dressings and Pers<strong>on</strong>al and pers<strong>on</strong>al<br />
Analysis by product area and spreads beverages Foods care other care Total<br />
<strong>2006</strong><br />
Turnover 13 767 7 578 21 345 11 122 7 175 18 297 39 642<br />
Operating profit 1 993 900 2 893 1 913 602 2 515 5 408<br />
Net finance costs (721)<br />
Share of net profit/(loss) of joint ventures 13 64 77 1 – 1 78<br />
Share of net profit/(loss) of associates – – – – 36 36 36<br />
Other income from n<strong>on</strong>-current investments 30<br />
Profit before taxati<strong>on</strong> 4 831<br />
Taxati<strong>on</strong> (1 146)<br />
Net profit from c<strong>on</strong>tinuing operati<strong>on</strong>s 3 685<br />
Net profit from disc<strong>on</strong>tinued operati<strong>on</strong>s 1 330<br />
Net profit 5 015<br />
<strong>Unilever</strong> <str<strong>on</strong>g>Annual</str<strong>on</strong>g> Report <strong>on</strong> Form 20-F <strong>2006</strong> 81<br />
Financial Statements (c<strong>on</strong>tinued)
Financial Statements (c<strong>on</strong>tinued)<br />
Notes to the c<strong>on</strong>solidated accounts <strong>Unilever</strong> Group<br />
2 Segment in<strong>form</strong>ati<strong>on</strong> (c<strong>on</strong>tinued)<br />
€ milli<strong>on</strong> € milli<strong>on</strong> € milli<strong>on</strong> € milli<strong>on</strong> € milli<strong>on</strong> € milli<strong>on</strong> € milli<strong>on</strong><br />
Home Home<br />
Savoury, Ice cream care and<br />
dressings and Pers<strong>on</strong>al and pers<strong>on</strong>al<br />
Analysis by product area and spreads beverages Foods care other care Total<br />
2005<br />
Turnover 13 557 7 332 20 889 10 485 7 027 17 512 38 401<br />
Operating profit 2 026 609 2 635 1 793 646 2 439 5 074<br />
Net finance costs (613)<br />
Share of net profit/(loss) of joint ventures 10 36 46 1 – 1 47<br />
Share of net profit/(loss) of associates – – – – (25) (25) (25)<br />
Other income from n<strong>on</strong>-current investments 33<br />
Profit before taxati<strong>on</strong> 4 516<br />
Taxati<strong>on</strong> (1 181)<br />
Net profit from c<strong>on</strong>tinuing operati<strong>on</strong>s 3 335<br />
Net profit from disc<strong>on</strong>tinued operati<strong>on</strong>s 640<br />
Net profit 3 975<br />
2004<br />
Turnover 13 476 7 090 20 566 9 780 6 822 16 602 37 168<br />
Operating profit 1 880 (30) 1 850 1 508 623 2 131 3 981<br />
Net finance costs (623)<br />
Share of net profit/(loss) of joint ventures 5 31 36 1 2 3 39<br />
Share of net profit/(loss) of associates – – – – 2 2 2<br />
Other income from n<strong>on</strong>-current investments 54<br />
Profit before taxati<strong>on</strong> 3 453<br />
Taxati<strong>on</strong> (725)<br />
Net profit from c<strong>on</strong>tinuing operati<strong>on</strong>s 2 728<br />
Net profit from disc<strong>on</strong>tinued operati<strong>on</strong>s 213<br />
Net profit 2 941<br />
Assets<br />
<strong>2006</strong><br />
Segment assets 20 434 4 485 24 919 3 616 3 335 6 951 31 870<br />
Joint ventures/associates 29 24 53 7 43 50 103<br />
Total assets by product area 20 463 4 509 24 972 3 623 3 378 7 001 31 973<br />
Corporate assets 5 099<br />
Total assets 37 072<br />
2005<br />
Segment assets 21 289 5 455 26 744 3 622 3 603 7 225 33 969<br />
Joint ventures/associates 23 31 54 9 21 30 84<br />
Total assets by product area 21 312 5 486 26 798 3 631 3 624 7 255 34 053<br />
Corporate assets 5 447<br />
Total assets 39 500<br />
Capital expenditure<br />
<strong>2006</strong> 387 327 714 195 292 487 1 201<br />
2005 346 226 572 245 233 478 1 050<br />
82 <strong>Unilever</strong> <str<strong>on</strong>g>Annual</str<strong>on</strong>g> Report <strong>on</strong> Form 20-F <strong>2006</strong>
Notes to the c<strong>on</strong>solidated accounts <strong>Unilever</strong> Group<br />
3 Gross profit and operating costs<br />
€ milli<strong>on</strong> € milli<strong>on</strong> € milli<strong>on</strong><br />
<strong>2006</strong> 2005 2004<br />
Turnover 39 642 38 401 37 168<br />
Cost of sales (20 093) (19 539) (18 942)<br />
Gross profit 19 549 18 862 18 226<br />
Distributi<strong>on</strong> and selling costs (9 486) (9 078) (8 025)<br />
Administrative expenses (a) (4 655) (4 710) (6 220)<br />
Operating profit 5 408 5 074 3 981<br />
(a) Includes amortisati<strong>on</strong> of finite-lived intangible assets and impairment of goodwill and intangible assets.<br />
The following items are disclosed <strong>on</strong> the face of the income statement as separate disclosure provides additi<strong>on</strong>al in<strong>form</strong>ati<strong>on</strong> to users to help<br />
them better understand underlying business per<strong>form</strong>ance.<br />
€ milli<strong>on</strong> € milli<strong>on</strong> € milli<strong>on</strong><br />
<strong>2006</strong> 2005 2004<br />
Restructuring (704) (328) (913)<br />
Business disposals, impairments and other<br />
Gain/(loss) <strong>on</strong> disposals of group companies 179 132 264<br />
Impairments (14) (397) (1 003)<br />
(Provisi<strong>on</strong> for)/release of Brazilian sales tax 31 16 (169)<br />
Gains <strong>on</strong> US healthcare and UK pensi<strong>on</strong>s 266 – –<br />
Restructuring costs are incurred as the business c<strong>on</strong>tinues to reorganise operati<strong>on</strong>s and support functi<strong>on</strong>s. They primarily relate to redundancy<br />
and retirement costs. Business disposals generate both costs and revenues which are not reflective of underlying per<strong>form</strong>ance. Impairment<br />
charges are primarily recognised for goodwill other than where included in restructuring or as part of business disposals. In 2005 and 2004<br />
significant impairment charges were recognised in respect of Slim•Fast, respectively €363 milli<strong>on</strong> and €791 milli<strong>on</strong>.<br />
The gains <strong>on</strong> US healthcare arise from the introducti<strong>on</strong> of an annual cap <strong>on</strong> the benefits which each participant can claim. The gain in the UK<br />
results from reducing deferred pensi<strong>on</strong>s if they are taken early.<br />
Other items within operating costs include:<br />
€ milli<strong>on</strong> € milli<strong>on</strong> € milli<strong>on</strong><br />
<strong>2006</strong> 2005 2004<br />
Staff costs (5 355) (5 745) (5 708)<br />
Raw and packaging materials and goods purchased for resale (15 655) (15 106) (14 278)<br />
Amortisati<strong>on</strong> of finite-lived intangible assets and software (157) (99) (64)<br />
Depreciati<strong>on</strong> of property, plant and equipment (787) (770) (949)<br />
Advertising and promoti<strong>on</strong>s (5 203) (4 918) (4 365)<br />
Exchange gains/(losses) (25) 19 (97)<br />
Lease rentals (451) (421) (389)<br />
Minimum operating lease payments (455) (423) (393)<br />
C<strong>on</strong>tingent operating lease payments (3) (3) (5)<br />
Less: Sub-lease income relating to operating lease agreements 7 5 9<br />
Total expenditure <strong>on</strong> research and development in <strong>2006</strong>, including costs incurred under some of the headings <str<strong>on</strong>g>report</str<strong>on</strong>g>ed above, was €906 milli<strong>on</strong><br />
(2005: €932 milli<strong>on</strong>; 2004: €972 milli<strong>on</strong>).<br />
<strong>Unilever</strong> <str<strong>on</strong>g>Annual</str<strong>on</strong>g> Report <strong>on</strong> Form 20-F <strong>2006</strong> 83<br />
Financial Statements (c<strong>on</strong>tinued)
Financial Statements (c<strong>on</strong>tinued)<br />
Notes to the c<strong>on</strong>solidated accounts <strong>Unilever</strong> Group<br />
4 Staff costs<br />
€ milli<strong>on</strong> € milli<strong>on</strong> € milli<strong>on</strong><br />
Staff costs <strong>2006</strong> 2005 2004<br />
Remunerati<strong>on</strong> of employees (4 377) (4 456) (4 378)<br />
Emoluments of Executive Directors (8) (11) (12)<br />
Pensi<strong>on</strong>s and other post-employment benefits (a) (132) (384) (445)<br />
Social security costs (718) (702) (660)<br />
Share-based compensati<strong>on</strong> costs (120) (192) (213)<br />
(a) In <strong>2006</strong> includes gains of €266 milli<strong>on</strong> arising from changes in US post-retirement healthcare plans and UK pensi<strong>on</strong> plans.<br />
84 <strong>Unilever</strong> <str<strong>on</strong>g>Annual</str<strong>on</strong>g> Report <strong>on</strong> Form 20-F <strong>2006</strong><br />
(5 355) (5 745) (5 708)<br />
’000 ’000 ’000<br />
Average number of employees during the year <strong>2006</strong> 2005 2004<br />
Europe 47 51 53<br />
The Americas 46 46 48<br />
Asia Africa 96 115 126<br />
5 Net finance costs<br />
189 212 227<br />
€ milli<strong>on</strong> € milli<strong>on</strong> € milli<strong>on</strong><br />
Finance costs <strong>2006</strong> 2005 2004<br />
Finance costs (590) (689) (714)<br />
Bank loans and overdrafts (93) (90) (106)<br />
B<strong>on</strong>ds and other loans (505) (580) (612)<br />
Dividends paid <strong>on</strong> preference shares (a) (6) (11) n/a<br />
Exchange gains/(losses) 14 (8) 4<br />
Preference shares provisi<strong>on</strong> (b) (300) – –<br />
Finance income 128 129 145<br />
Pensi<strong>on</strong>s and similar obligati<strong>on</strong>s (c) 41 (53) (54)<br />
(721) (613) (623)<br />
(a) From 1 January 2005, <strong>Unilever</strong> has adopted IAS 32 ‘Financial Instruments: Disclosure and Presentati<strong>on</strong>’ which requires preference shares<br />
that provide for a fixed preference dividend to be classified as borrowings, and preference dividends to be recognised in the income<br />
statement as a finance cost. In accordance with the transiti<strong>on</strong> rules for IAS 32, 2004 comparatives have not been restated.<br />
(b) For further in<strong>form</strong>ati<strong>on</strong> please refer to note 19 <strong>on</strong> page 102.<br />
(c) Net finance costs in respect of pensi<strong>on</strong>s and similar obligati<strong>on</strong>s are analysed in note 20 <strong>on</strong> page 106.
Notes to the c<strong>on</strong>solidated accounts <strong>Unilever</strong> Group<br />
6 Taxati<strong>on</strong><br />
€ milli<strong>on</strong> € milli<strong>on</strong> € milli<strong>on</strong><br />
Tax charge in income statement <strong>2006</strong> 2005 2004<br />
Current tax<br />
Current year (1 171) (1 172) (1 534)<br />
Over/(under) provided in prior years (a) 206 107 330<br />
(965) (1 065) (1 204)<br />
Deferred tax<br />
Originati<strong>on</strong> and reversal of temporary differences (171) (123) 445<br />
Changes in tax rates (15) 2 34<br />
Utilisati<strong>on</strong> of unrecognised losses brought forward 5 5 –<br />
(a) Provisi<strong>on</strong>s have been released for amounts over provided for tax in prior years in a number of countries, n<strong>on</strong>e of which is<br />
individually material.<br />
(181) (116) 479<br />
(1 146) (1 181) (725)<br />
Europe is c<strong>on</strong>sidered to be <strong>Unilever</strong>’s domestic tax base. The rec<strong>on</strong>ciliati<strong>on</strong> between the computed weighted average rate of income tax<br />
expense, which is generally applicable to <strong>Unilever</strong>’s European companies, and the actual rate of taxati<strong>on</strong> charged is as follows:<br />
% % %<br />
Rec<strong>on</strong>ciliati<strong>on</strong> of effective tax rate <strong>2006</strong> 2005 2004<br />
Computed rate of tax (b) 30 31 32<br />
Differences due to:<br />
Other rates applicable to n<strong>on</strong>-European countries 1 – 1<br />
Incentive tax credits (7) (5) (5)<br />
Withholding tax <strong>on</strong> dividends 1 2 2<br />
Adjustments to previous years (4) (2) (10)<br />
Expenses not deductible for tax purposes 2 2 –<br />
Utilisati<strong>on</strong> of previously unrecognised tax losses – (1) –<br />
Other 1 (1) 1<br />
Effective tax rate 24 26 21<br />
(b) The computed tax rate used is the average of the standard rate of tax applicable in the European countries in which <strong>Unilever</strong> operates,<br />
weighted by the amount of profit before taxati<strong>on</strong> generated in each of those countries.<br />
<strong>Unilever</strong> <str<strong>on</strong>g>Annual</str<strong>on</strong>g> Report <strong>on</strong> Form 20-F <strong>2006</strong> 85<br />
Financial Statements (c<strong>on</strong>tinued)
Financial Statements (c<strong>on</strong>tinued)<br />
Notes to the c<strong>on</strong>solidated accounts <strong>Unilever</strong> Group<br />
6 Taxati<strong>on</strong> (c<strong>on</strong>tinued)<br />
The following tables analyse profit before taxati<strong>on</strong> and actual taxati<strong>on</strong> charges between those arising in Europe and elsewhere.<br />
86 <strong>Unilever</strong> <str<strong>on</strong>g>Annual</str<strong>on</strong>g> Report <strong>on</strong> Form 20-F <strong>2006</strong><br />
€ milli<strong>on</strong> € milli<strong>on</strong> € milli<strong>on</strong><br />
<strong>2006</strong> 2005 2004<br />
Profit before taxati<strong>on</strong><br />
Europe<br />
Parent and group companies 2 266 2 379 2 203<br />
Share of net profit/(loss) of joint ventures 17 11 7<br />
Share of net profit/(loss) of associates 36 (20) (2)<br />
2 319 2 370 2 208<br />
Outside Europe<br />
Group companies 2 451 2 115 1 209<br />
Share of net profit/(loss) of joint ventures 61 36 32<br />
Share of net profit/(loss) of associates – (5) 4<br />
2 512 2 146 1 245<br />
4 831 4 516 3 453<br />
Taxati<strong>on</strong><br />
Europe<br />
Parent and group companies:<br />
Current taxes payable (359) (414) (615)<br />
Deferred taxati<strong>on</strong> (174) (162) 164<br />
Accelerated depreciati<strong>on</strong> 2 22 54<br />
Pensi<strong>on</strong>s (196) (123) (63)<br />
Provisi<strong>on</strong>s 24 (25) 57<br />
Goodwill and intangible assets 4 (48) 109<br />
Other (8) 12 7<br />
Outside Europe<br />
Group companies:<br />
(533) (576) (451)<br />
Current taxes payable (606) (651) (589)<br />
Deferred taxati<strong>on</strong> (7) 46 315<br />
Accelerated depreciati<strong>on</strong> 25 (40) (20)<br />
Pensi<strong>on</strong>s (142) 28 (26)<br />
Provisi<strong>on</strong>s 16 (78) 205<br />
Goodwill and intangible assets 98 123 168<br />
Other (4) 13 (12)<br />
(613) (605) (274)<br />
(1 146) (1 181) (725)
Notes to the c<strong>on</strong>solidated accounts <strong>Unilever</strong> Group<br />
7 Combined earnings per share<br />
€ € €<br />
Combined earnings per share <strong>2006</strong> 2005 2004<br />
From c<strong>on</strong>tinuing operati<strong>on</strong>s<br />
Basic earnings per share 1.19 1.07 0.87<br />
Diluted earnings per share 1.15 1.04 0.84<br />
From disc<strong>on</strong>tinued operati<strong>on</strong>s<br />
Basic earnings per share 0.46 0.22 0.07<br />
Diluted earnings per share 0.45 0.21 0.07<br />
From total operati<strong>on</strong>s<br />
Basic earnings per share 1.65 1.29 0.94<br />
Diluted earnings per share 1.60 1.25 0.91<br />
Basis of calculati<strong>on</strong><br />
The calculati<strong>on</strong>s of combined earnings per share are based <strong>on</strong> the net profit attributable to ordinary capital divided by the average number of<br />
share units representing the combined ordinary capital of NV and PLC in issue during the year, after deducting shares held as treasury stock.<br />
Earnings per share are calculated <strong>on</strong> the basis of the revised nominal share values which have been applied since 22 May <strong>2006</strong> and which<br />
resulted in a <strong>on</strong>e-to-<strong>on</strong>e equivalence of ordinary shares of NV and PLC as regards their ec<strong>on</strong>omic interest in the Group. For further in<strong>form</strong>ati<strong>on</strong><br />
please refer to note 22 <strong>on</strong> page 109.<br />
The calculati<strong>on</strong>s of diluted earnings per share are based <strong>on</strong>: (i) c<strong>on</strong>versi<strong>on</strong> into PLC ordinary shares of the shares in a group company which are<br />
c<strong>on</strong>vertible in the year 2038, as described in Corporate governance <strong>on</strong> page 42; (ii) c<strong>on</strong>versi<strong>on</strong> of the €0.05 NV preference shares; (iii) the effect<br />
of share-based compensati<strong>on</strong> plans, details of which are set out in note 29 <strong>on</strong> pages 117 to 121; and (iv) the forward equity c<strong>on</strong>tract described<br />
in note 29 <strong>on</strong> page 121.<br />
On 15 February 2005, <strong>Unilever</strong> c<strong>on</strong>verted its €0.05 NV preference shares into ordinary €0.51 NV shares. The c<strong>on</strong>versi<strong>on</strong> was made using shares<br />
already held by <strong>Unilever</strong> for the purposes of satisfying the Group’s share-based compensati<strong>on</strong> plans. <strong>Unilever</strong> bought further ordinary shares in<br />
the market during 2005 to the extent required to restore the hedging positi<strong>on</strong>. Until the date of c<strong>on</strong>versi<strong>on</strong>, the €0.05 preference shares were<br />
potentially dilutive for the purposes of the calculati<strong>on</strong> of fully diluted earnings per share, as shown below. At midnight <strong>on</strong> 13 July 2005 the<br />
€0.05 NV preference shares were cancelled.<br />
Milli<strong>on</strong>s of share units<br />
Calculati<strong>on</strong> of average number of share units <strong>2006</strong> 2005 2004<br />
Average number of shares: NV 1 714.7 1 714.7 1 714.7<br />
PLC 1 310.2 1 310.2 1 310.2<br />
Less shares held by employee share trusts and companies (141.6) (111.9) (134.7)<br />
Combined average number of share units for all bases except diluted earnings per share 2 883.3 2 913.0 2 890.2<br />
Add shares issuable in 2038 70.9 70.9 70.9<br />
Add shares for c<strong>on</strong>versi<strong>on</strong> – 7.1 56.6<br />
Add dilutive effect of share-based compensati<strong>on</strong> plans and forward equity c<strong>on</strong>tract 18.3 16.0 14.9<br />
Adjusted combined average number of share units for diluted earnings per share basis 2 972.5 3 007.0 3 032.6<br />
€ milli<strong>on</strong> € milli<strong>on</strong> € milli<strong>on</strong><br />
Calculati<strong>on</strong> of earnings <strong>2006</strong> 2005 2004<br />
Net profit attributable to shareholders’ equity 4 745 3 766 2 755<br />
Less preference dividends n/a n/a (28)<br />
Net profit attributed to ordinary capital for basic earnings per share calculati<strong>on</strong>s 4 745 3 766 2 727<br />
Adjusted net profit attributed to ordinary capital for the diluted earnings per share calculati<strong>on</strong> (a) 4 745 3 769 2 748<br />
(a) In accordance with IAS 33, the net profit for diluted earnings per share has been adjusted for the preference dividend <strong>on</strong> shares for<br />
c<strong>on</strong>versi<strong>on</strong>, which in <strong>2006</strong> amounted to €nil (2005: €3 milli<strong>on</strong>; 2004: €21 milli<strong>on</strong>).<br />
<strong>Unilever</strong> <str<strong>on</strong>g>Annual</str<strong>on</strong>g> Report <strong>on</strong> Form 20-F <strong>2006</strong> 87<br />
Financial Statements (c<strong>on</strong>tinued)
Financial Statements (c<strong>on</strong>tinued)<br />
Notes to the c<strong>on</strong>solidated accounts <strong>Unilever</strong> Group<br />
8 Dividends <strong>on</strong> ordinary capital<br />
€ milli<strong>on</strong> € milli<strong>on</strong> € milli<strong>on</strong><br />
Dividends paid <strong>on</strong> ordinary capital during the year <strong>2006</strong> 2005 2004<br />
Final dividend 2003 paid in June 2004 – – (1 116)<br />
Interim dividend 2004 paid in November 2004 – – (603)<br />
Final dividend 2004 paid in June 2005 – (1 229) –<br />
Interim dividend 2005 paid in December 2005 – (638) –<br />
Final dividend 2005 paid in June <strong>2006</strong> (1 269) – –<br />
Interim dividend <strong>2006</strong> paid in December <strong>2006</strong> (664) – –<br />
One-off dividend paid in December <strong>2006</strong> (751) – –<br />
88 <strong>Unilever</strong> <str<strong>on</strong>g>Annual</str<strong>on</strong>g> Report <strong>on</strong> Form 20-F <strong>2006</strong><br />
(2 684) (1 867) (1 719)<br />
Per €0.16 NV ordinary share Per 3 1 /9p PLC ordinary share<br />
€ € € pence pence pence<br />
Dividends per share <strong>2006</strong> 2005 2004 <strong>2006</strong> 2005 2004<br />
Interim 0.23 0.22 0.21 15.62 15.04 14.07<br />
Final – 0.44 0.42 – 30.09 28.49<br />
Proposed final (a) 0.47 – – 32.04 – –<br />
0.70 0.66 0.63 47.66 45.13 42.56<br />
One-off 0.26 – – 17.66 – –<br />
0.96 0.66 0.63 65.32 45.13 42.56<br />
(a) The proposed final dividend <strong>on</strong> ordinary capital for the year <strong>2006</strong> has to be approved by shareholders at the <str<strong>on</strong>g>Annual</str<strong>on</strong>g> General Meetings.<br />
In accordance with IFRS, no provisi<strong>on</strong> for the amount of this dividend, estimated at €1 358 milli<strong>on</strong>, has been recognised in the financial<br />
statements for the year ended 31 December <strong>2006</strong>.<br />
Full details of dividends per share for the years 2002 to <strong>2006</strong> are given <strong>on</strong> page 155.<br />
9 Goodwill and intangible assets<br />
Indefinite-lived intangible assets principally comprise those trademarks for which there is no foreseeable limit to the period over which they are<br />
expected to generate net cash inflows. These are c<strong>on</strong>sidered to have an indefinite life, given the strength and durability of our brands and the<br />
level of marketing support. Brands that are classified as indefinite have been in the market for many years, and the nature of the industry we<br />
operate in is such that brand obsolescence is not comm<strong>on</strong>, if appropriately supported by advertising and marketing spend. Finite-lived intangible<br />
assets, which primarily comprise patented and n<strong>on</strong>-patented technology, know-how, and software, are capitalised and amortised in operating<br />
profit <strong>on</strong> a straight-line basis over the period of their expected useful lives, n<strong>on</strong>e of which exceeds ten years. The level of amortisati<strong>on</strong> for finitelived<br />
intangible assets is not expected to change materially over the next five years.<br />
€ milli<strong>on</strong> € milli<strong>on</strong><br />
At cost less amortisati<strong>on</strong> and impairment <strong>2006</strong> 2005<br />
Goodwill 12 425 12 963<br />
Indefinite-lived intangible assets 4 174 4 450<br />
Finite-lived intangible assets 343 416<br />
Software 264 226<br />
17 206 18 055<br />
€ milli<strong>on</strong> € milli<strong>on</strong> € milli<strong>on</strong> € milli<strong>on</strong> € milli<strong>on</strong><br />
Indefinite- Finitelived<br />
lived<br />
intangible intangible<br />
Movements during <strong>2006</strong> Goodwill assets assets Software Total<br />
Cost<br />
1 January <strong>2006</strong> 14 080 4 713 631 291 19 715<br />
Acquisiti<strong>on</strong>s of group companies 60 8 1 – 69<br />
Disposals of group companies (1) – – – (1)<br />
Change in useful life assumpti<strong>on</strong>s – (32) 32 – –<br />
Additi<strong>on</strong>s – – 3 110 113<br />
Currency retranslati<strong>on</strong> (685) (280) (25) (9) (999)<br />
31 December <strong>2006</strong> 13 454 4 409 642 392 18 897<br />
Amortisati<strong>on</strong> and impairment<br />
1 January <strong>2006</strong> (1 117) (263) (215) (65) (1 660)<br />
Amortisati<strong>on</strong> for the year – – (94) (63) (157)<br />
Impairment (12) – – (2) (14)<br />
Currency retranslati<strong>on</strong> 100 28 10 2 140<br />
31 December <strong>2006</strong> (1 029) (235) (299) (128) (1 691)<br />
Net book value 31 December <strong>2006</strong> 12 425 4 174 343 264 17 206
Notes to the c<strong>on</strong>solidated accounts <strong>Unilever</strong> Group<br />
9 Goodwill and intangible assets (c<strong>on</strong>tinued)<br />
€ milli<strong>on</strong> € milli<strong>on</strong> € milli<strong>on</strong> € milli<strong>on</strong> € milli<strong>on</strong><br />
Indefinite- Finitelived<br />
lived<br />
intangible intangible<br />
Movements during 2005 Goodwill assets assets Software Total<br />
Cost<br />
1 January 2005 12 887 4 251 597 193 17 928<br />
Acquisiti<strong>on</strong>s of group companies 13 – – – 13<br />
Disposals of group companies (49) (6) (16) (4) (75)<br />
Additi<strong>on</strong>s – 2 4 86 92<br />
Reversal of assets held for sale not included in final disposal 15 55 – – 70<br />
Currency retranslati<strong>on</strong> 1 214 411 46 16 1 687<br />
31 December 2005 14 080 4 713 631 291 19 715<br />
Amortisati<strong>on</strong> and impairment<br />
1 January 2005 (937) – (150) (27) (1 114)<br />
Disposals of group companies 42 1 3 2 48<br />
Amortisati<strong>on</strong> for the year (a) – – (62) (38) (100)<br />
Impairment losses (131) (251) – – (382)<br />
Currency retranslati<strong>on</strong> (91) (13) (6) (2) (112)<br />
31 December 2005 (1 117) (263) (215) (65) (1 660)<br />
Net book value 31 December 2005 12 963 4 450 416 226 18 055<br />
(a) Includes €(1) milli<strong>on</strong> relating to disc<strong>on</strong>tinued operati<strong>on</strong>s.<br />
There are no significant carrying amounts of goodwill and intangible assets that are allocated across multiple cash generating units (CGUs).<br />
Impairments charges in the year<br />
The impairments charged in <strong>2006</strong> principally relate to planned business disposals that will be completed during 2007.<br />
In <strong>2006</strong>, Slim•Fast was fully integrated into The Americas business as part of the North American beverage operati<strong>on</strong>s. As a result of the<br />
integrati<strong>on</strong>, Slim•Fast is no l<strong>on</strong>ger evaluated <strong>on</strong> a stand-al<strong>on</strong>e basis but as part of the North American beverage CGU. The <strong>2006</strong> impairment<br />
review <strong>on</strong> this basis and <strong>on</strong> a stand-al<strong>on</strong>e basis did not result in any impairments (2005: €363 milli<strong>on</strong>; 2004: €791 milli<strong>on</strong>).<br />
Significant CGUs<br />
The goodwill and indefinite-lived intangible assets (predominantly Knorr and Hellmann’s) held in the global savoury and dressings CGU,<br />
comprising €11.6 billi<strong>on</strong> (2005: €11.9 billi<strong>on</strong>) and €3.4 billi<strong>on</strong> (2005: €3.6 billi<strong>on</strong>) respectively, are c<strong>on</strong>sidered significant in comparis<strong>on</strong> to<br />
the total carrying amounts of goodwill and indefinite-lived intangible assets at 31 December <strong>2006</strong>. No other CGUs are c<strong>on</strong>sidered significant<br />
in this respect.<br />
During <strong>2006</strong>, we c<strong>on</strong>ducted an impairment review of the carrying value of these assets. Value in use of the global savoury and dressings CGU<br />
has been calculated as the present value of projected future cash flows. A pre-tax discount rate of 10% was used.<br />
The following key assumpti<strong>on</strong>s were used in the discounted cash flow projecti<strong>on</strong>s for the savoury and dressings CGU:<br />
• a l<strong>on</strong>ger-term sustainable growth rate of 3%, adjusted for market fade, used to determine an appropriate terminal value multiple;<br />
• average near-term nominal growth for the major product groups within the CGU of 3%; and<br />
• average operating margins for the major product groups within the CGU ranging from 16% to 19%.<br />
The growth rates and margins used to estimate future per<strong>form</strong>ance are based <strong>on</strong> past per<strong>form</strong>ance and our experience of growth rates and<br />
margins achievable in our key markets as a guide. We believe that the assumpti<strong>on</strong>s used in estimating the future per<strong>form</strong>ance of the savoury<br />
and dressings CGU are c<strong>on</strong>sistent with past per<strong>form</strong>ance.<br />
The projecti<strong>on</strong>s covered a period of ten years as we believe this to be a suitable timescale over which to review and c<strong>on</strong>sider annual<br />
per<strong>form</strong>ance before applying a fixed terminal value multiple to the final year cash flows of the detailed projecti<strong>on</strong>. Stopping the detailed<br />
projecti<strong>on</strong>s after five years and applying a terminal value multiple thereafter would not result in a value in use that would cause impairment.<br />
The growth rates used to estimate future per<strong>form</strong>ance bey<strong>on</strong>d the periods covered by our annual planning and strategic planning processes do<br />
not exceed the l<strong>on</strong>g-term average rates of growth for similar products.<br />
We have per<strong>form</strong>ed sensitivity analysis around the base case assumpti<strong>on</strong>s and have c<strong>on</strong>cluded that no reas<strong>on</strong>ably possible changes in key<br />
assumpti<strong>on</strong>s would cause the recoverable amount of the global savoury and dressings CGU to be less than the carrying amount.<br />
<strong>Unilever</strong> <str<strong>on</strong>g>Annual</str<strong>on</strong>g> Report <strong>on</strong> Form 20-F <strong>2006</strong> 89<br />
Financial Statements (c<strong>on</strong>tinued)
Financial Statements (c<strong>on</strong>tinued)<br />
Notes to the c<strong>on</strong>solidated accounts <strong>Unilever</strong> Group<br />
10 Property, plant and equipment<br />
€ milli<strong>on</strong> € milli<strong>on</strong><br />
At cost less depreciati<strong>on</strong> and impairment <strong>2006</strong> 2005<br />
Land and buildings 1 944 1 994<br />
Plant and equipment 4 332 4 498<br />
90 <strong>Unilever</strong> <str<strong>on</strong>g>Annual</str<strong>on</strong>g> Report <strong>on</strong> Form 20-F <strong>2006</strong><br />
6 276 6 492<br />
Includes freehold land 205 224<br />
Commitments for capital expenditure at 31 December 231 263<br />
€ milli<strong>on</strong> € milli<strong>on</strong> € milli<strong>on</strong><br />
Land and Plant and<br />
Movements during <strong>2006</strong> buildings equipment Total<br />
Gross<br />
1 January <strong>2006</strong> 3 014 10 845 13 859<br />
Acquisiti<strong>on</strong>s of group companies 2 6 8<br />
Disposals of group companies (130) (291) (421)<br />
Additi<strong>on</strong>s 150 921 1 071<br />
Disposals (80) (586) (666)<br />
Currency retranslati<strong>on</strong> (136) (446) (582)<br />
Reclassificati<strong>on</strong> as held for sale (a) 95 (69) 26<br />
Other adjustments 77 (9) 68<br />
31 December <strong>2006</strong> 2 992 10 371 13 363<br />
Depreciati<strong>on</strong><br />
1 January <strong>2006</strong> (1 020) (6 347) (7 367)<br />
Disposals of group companies 50 185 235<br />
Depreciati<strong>on</strong> charge for the year (b) (74) (731) (805)<br />
Disposals 45 512 557<br />
Currency retranslati<strong>on</strong> 38 251 289<br />
Reclassificati<strong>on</strong> as held for sale (a) (18) 69 51<br />
Other adjustments (69) 22 (47)<br />
31 December <strong>2006</strong> (1 048) (6 039) (7 087)<br />
Net book value 31 December <strong>2006</strong> 1 944 4 332 6 276<br />
Includes payments <strong>on</strong> account and assets in course of c<strong>on</strong>structi<strong>on</strong> 71 478 549<br />
(a) After reinstating certain assets with gross value of €112 milli<strong>on</strong> and accumulated depreciati<strong>on</strong> of €28 milli<strong>on</strong> which were previously<br />
classified as held for sale.<br />
(b) Includes €(18) milli<strong>on</strong> relating to disc<strong>on</strong>tinued operati<strong>on</strong>s.
Notes to the c<strong>on</strong>solidated accounts <strong>Unilever</strong> Group<br />
10 Property, plant and equipment (c<strong>on</strong>tinued)<br />
€ milli<strong>on</strong> € milli<strong>on</strong> € milli<strong>on</strong><br />
Land and Plant and<br />
Movements during 2005 buildings equipment Total<br />
Gross<br />
1 January 2005 2 859 10 013 12 872<br />
Disposals of group companies (26) (117) (143)<br />
Additi<strong>on</strong>s 163 795 958<br />
Disposals (95) (619) (714)<br />
Reversal of asset held for sale not included in final disposal 53 57 110<br />
Currency retranslati<strong>on</strong> 269 798 1 067<br />
Reclassificati<strong>on</strong> as held for sale (175) (116) (291)<br />
Other adjustments (34) 34 –<br />
31 December 2005 3 014 10 845 13 859<br />
Depreciati<strong>on</strong><br />
1 January 2005 (966) (5 855) (6 821)<br />
Disposals of group companies 12 91 103<br />
Depreciati<strong>on</strong> charge for the year (c) (77) (715) (792)<br />
Disposals 53 549 602<br />
Reversal of asset held for sale not included in final disposal (5) (50) (55)<br />
Currency retranslati<strong>on</strong> (83) (466) (549)<br />
Reclassificati<strong>on</strong> as held for sale 51 94 145<br />
Other adjustments (5) 5 –<br />
31 December 2005 (1 020) (6 347) (7 367)<br />
Net book value 31 December 2005 1 994 4 498 6 492<br />
Includes payments <strong>on</strong> account and assets in course of c<strong>on</strong>structi<strong>on</strong> 64 487 551<br />
(c) Includes €(22) milli<strong>on</strong> relating to disc<strong>on</strong>tinued operati<strong>on</strong>s.<br />
Included in the above is property, plant and equipment under a number of finance lease agreements, for which the book values are as follows:<br />
€ milli<strong>on</strong> € milli<strong>on</strong> € milli<strong>on</strong><br />
Plant and<br />
Net book value Buildings equipment Total<br />
Gross book value 62 369 431<br />
Depreciati<strong>on</strong> (20) (201) (221)<br />
31 December <strong>2006</strong> 42 168 210<br />
Gross book value 68 354 422<br />
Depreciati<strong>on</strong> (18) (202) (220)<br />
31 December 2005 50 152 202<br />
<strong>Unilever</strong> <str<strong>on</strong>g>Annual</str<strong>on</strong>g> Report <strong>on</strong> Form 20-F <strong>2006</strong> 91<br />
Financial Statements (c<strong>on</strong>tinued)
Financial Statements (c<strong>on</strong>tinued)<br />
Notes to the c<strong>on</strong>solidated accounts <strong>Unilever</strong> Group<br />
11 Other n<strong>on</strong>-current assets<br />
92 <strong>Unilever</strong> <str<strong>on</strong>g>Annual</str<strong>on</strong>g> Report <strong>on</strong> Form 20-F <strong>2006</strong><br />
€ milli<strong>on</strong> € milli<strong>on</strong><br />
<strong>2006</strong> 2005<br />
Interest in net assets of joint ventures 57 67<br />
Interest in net assets of associates 46 17<br />
Other n<strong>on</strong>-current assets 771 757<br />
874 841<br />
€ milli<strong>on</strong> € milli<strong>on</strong><br />
Movements during <strong>2006</strong> and 2005 <strong>2006</strong> 2005<br />
Joint ventures (a)<br />
1 January 67 32<br />
Additi<strong>on</strong>s (b) – 26<br />
Dividends received/reducti<strong>on</strong>s (85) (43)<br />
Share in net profit 78 47<br />
Currency retranslati<strong>on</strong> (3) 5<br />
31 December 57 67<br />
Associates (c)<br />
1 January (20) 6<br />
Acquisiti<strong>on</strong>s/(disposals) 5 7<br />
Dividends received/reducti<strong>on</strong>s (13) (11)<br />
Share in net profit 36 (25)<br />
Currency retranslati<strong>on</strong> 4 3<br />
12 (20)<br />
Of which: Net liabilities of Johns<strong>on</strong>Diversey reclassified to provisi<strong>on</strong>s 34 37<br />
31 December 46 17<br />
Other n<strong>on</strong>-current assets (d)<br />
1 January 757 731<br />
Additi<strong>on</strong>s/(reducti<strong>on</strong>s)/(impairments)/fair value movements 46 (22)<br />
Currency retranslati<strong>on</strong> (32) 48<br />
31 December 771 757<br />
(a) Our principal joint ventures are the FIMA business in Portugal and the Pepsi/Lipt<strong>on</strong> Partnership in the US.<br />
(b) Effect of the 2005 transacti<strong>on</strong> in c<strong>on</strong>necti<strong>on</strong> with our Foods business in Portugal (see note 26 <strong>on</strong> page 113).<br />
(c) Associates primarily comprise our investments in Johns<strong>on</strong>Diversey Holdings Inc., Palmci and Langholm Capital Partners. Other <strong>Unilever</strong><br />
Ventures assets (excluding Langholm) are included under ‘Other n<strong>on</strong>-current assets’ above.<br />
(d) Other n<strong>on</strong>-current assets are mainly available-for-sale assets, and predominantly c<strong>on</strong>sist of investments in a number of companies and<br />
financial instituti<strong>on</strong>s in India, Europe and the US, including €181 milli<strong>on</strong> (2005: €197 milli<strong>on</strong>) of assets in a trust to fund benefit obligati<strong>on</strong>s<br />
in the US (see also note 20 <strong>on</strong> page 103). Also included under this heading are biological assets with a fair value of €36 milli<strong>on</strong><br />
(2005: €37 milli<strong>on</strong>).<br />
€ milli<strong>on</strong> € milli<strong>on</strong><br />
Analysis of listed and unlisted investments <strong>2006</strong> 2005<br />
Investments listed <strong>on</strong> a recognised stock exchange 402 326<br />
Unlisted investments 369 431<br />
771 757<br />
€ milli<strong>on</strong> € milli<strong>on</strong> € milli<strong>on</strong><br />
Other income from n<strong>on</strong>-current investments <strong>2006</strong> 2005 2004<br />
Income from other n<strong>on</strong>-current investments 21 20 36<br />
Profit/(loss) <strong>on</strong> disposal 9 13 18<br />
30 33 54<br />
The joint ventures and associates have no significant c<strong>on</strong>tingent liabilities to which the Group is exposed, and the Group has no significant<br />
c<strong>on</strong>tingent liabilities in relati<strong>on</strong> to its interest in the joint ventures and associates.<br />
The Group has no outstanding capital commitments to joint ventures.<br />
Outstanding balances with joint ventures and associates are shown in note 30 <strong>on</strong> page 122.
Notes to the c<strong>on</strong>solidated accounts <strong>Unilever</strong> Group<br />
12 Deferred taxati<strong>on</strong><br />
€ milli<strong>on</strong> € milli<strong>on</strong> € milli<strong>on</strong> € milli<strong>on</strong> € milli<strong>on</strong><br />
As at 1 Acquisiti<strong>on</strong>s As at 31<br />
January Income and December<br />
Movements during the year <strong>2006</strong> statement (a) Equity (b) disposals <strong>2006</strong><br />
Pensi<strong>on</strong>s and similar obligati<strong>on</strong>s 1 478 (344) (415) (5) 714<br />
Provisi<strong>on</strong>s 666 40 (37) 23 692<br />
Goodwill and intangible assets (834) 102 49 (1) (684)<br />
Accelerated tax depreciati<strong>on</strong> (742) 55 29 9 (649)<br />
Tax losses 146 (36) (5) 8 113<br />
Fair value gains – (2) 1 – (1)<br />
Fair value losses – 7 (3) – 4<br />
Share-based payments 74 9 11 (2) 92<br />
Other (18) 13 (2) (11) (18)<br />
(a) Includes €25 milli<strong>on</strong> credit <str<strong>on</strong>g>report</str<strong>on</strong>g>ed under disc<strong>on</strong>tinued operati<strong>on</strong>s in the income statement.<br />
(b) Of the total movement in equity of €372 milli<strong>on</strong>, €39 milli<strong>on</strong> arises as a result of currency retranslati<strong>on</strong>.<br />
770 (156) (372) 21 263<br />
At the balance sheet date, the Group has unused tax losses of €1 621 milli<strong>on</strong> and tax credits amounting to €338 milli<strong>on</strong> available for offset<br />
against future taxable profits. Deferred tax assets have not been recognised in respect of unused tax losses of €1 243 milli<strong>on</strong> and tax credits<br />
of €338 milli<strong>on</strong>, as it is not probable that there will be future taxable profits within the entities against which the losses can be utilised. The<br />
majority of these tax losses and credits arise in tax jurisdicti<strong>on</strong>s where they do not expire with the excepti<strong>on</strong> of €494 milli<strong>on</strong> of state and<br />
federal tax losses in the USA which expire between now and 2026.<br />
Other deductible temporary differences of €199 milli<strong>on</strong> have not been recognised as a deferred tax asset. There is no expiry date for these<br />
differences.<br />
At the balance sheet date, the aggregate amount of temporary differences associated with undistributed earnings of subsidiaries for which<br />
deferred tax liabilities have not been recognised was €755 milli<strong>on</strong> (2005: €765 milli<strong>on</strong>). No liability has been recognised in respect of these<br />
differences because the Group is in a positi<strong>on</strong> to c<strong>on</strong>trol the timing of the reversal of the temporary differences, and it is probable that such<br />
differences will not reverse in the forseeable future.<br />
Deferred income tax assets and liabilities are offset when there is a legally enforceable right to set off current tax assets against current tax<br />
liabilities and when the deferred income taxes relate to the same fiscal authority. The following amounts, determined after appropriate<br />
offsetting, are shown in the c<strong>on</strong>solidated balance sheet:<br />
€ milli<strong>on</strong> € milli<strong>on</strong> € milli<strong>on</strong> € milli<strong>on</strong> € milli<strong>on</strong> € milli<strong>on</strong><br />
Assets Assets Liabilities Liabilities Total Total<br />
Deferred tax assets and liabilities <strong>2006</strong> 2005 <strong>2006</strong> 2005 <strong>2006</strong> 2005<br />
Pensi<strong>on</strong>s and similar obligati<strong>on</strong>s 925 1 709 (211) (231) 714 1 478<br />
Provisi<strong>on</strong>s 670 704 22 (38) 692 666<br />
Goodwill and intangible assets (194) (431) (490) (403) (684) (834)<br />
Accelerated tax depreciati<strong>on</strong> (328) (489) (321) (253) (649) (742)<br />
Tax losses 112 144 1 2 113 146<br />
Fair value gains (1) – – – (1) –<br />
Fair value losses 4 6 – (6) 4 –<br />
Share-based payments 92 74 – – 92 74<br />
Other (14) (14) (4) (4) (18) (18)<br />
1 266 1 703 (1 003) (933) 263 770<br />
Of which deferred tax to be recovered/(settled) after<br />
more than 12 m<strong>on</strong>ths 460 1 269 (621) (834) (161) 435<br />
<strong>Unilever</strong> <str<strong>on</strong>g>Annual</str<strong>on</strong>g> Report <strong>on</strong> Form 20-F <strong>2006</strong> 93<br />
Financial Statements (c<strong>on</strong>tinued)
Financial Statements (c<strong>on</strong>tinued)<br />
Notes to the c<strong>on</strong>solidated accounts <strong>Unilever</strong> Group<br />
13 Inventories<br />
€ milli<strong>on</strong> € milli<strong>on</strong><br />
Inventories <strong>2006</strong> 2005<br />
Raw materials and c<strong>on</strong>sumables 1 360 1 512<br />
Finished goods and goods for resale 2 436 2 595<br />
94 <strong>Unilever</strong> <str<strong>on</strong>g>Annual</str<strong>on</strong>g> Report <strong>on</strong> Form 20-F <strong>2006</strong><br />
3 796 4 107<br />
Inventories with a value of €96 milli<strong>on</strong> (2005: €123 milli<strong>on</strong>) are carried at net realisable value, this being lower than cost. During <strong>2006</strong>,<br />
€160 milli<strong>on</strong> (2005: €159 milli<strong>on</strong>) was charged to the income statement for damaged, obsolete and lost inventories. In <strong>2006</strong>, €34 milli<strong>on</strong><br />
(2005: €35 milli<strong>on</strong>) was utilised or released to the income statement from inventory provisi<strong>on</strong>s taken in earlier years.<br />
In <strong>2006</strong>, inventories with a carrying amount of €6 milli<strong>on</strong> were pledged as security for certain of the Group’s borrowings (2005: €8 milli<strong>on</strong>).<br />
14 Trade and other receivables<br />
€ milli<strong>on</strong> € milli<strong>on</strong><br />
Trade and other receivables <strong>2006</strong> 2005<br />
Due within <strong>on</strong>e year<br />
Trade receivables 3 054 3 345<br />
Prepayments and accrued income 477 833<br />
Other receivables 759 652<br />
4 290 4 830<br />
Due after more than <strong>on</strong>e year<br />
Other receivables 252 231<br />
Total trade and other receivables 4 542 5 061<br />
C<strong>on</strong>centrati<strong>on</strong>s of credit risk with respect to trade receivables are limited, due to the Group’s customer base being large and diverse.<br />
€ milli<strong>on</strong> € milli<strong>on</strong><br />
Impairment provisi<strong>on</strong> for trade receivables – movements during the year <strong>2006</strong> 2005<br />
1 January 258 232<br />
Charged to current year income statement 38 39<br />
Reducti<strong>on</strong>s/releases (107) (33)<br />
Currency retranslati<strong>on</strong> (9) 20<br />
31 December 180 258
Notes to the c<strong>on</strong>solidated accounts <strong>Unilever</strong> Group<br />
15 Cash and cash equivalents and other financial assets<br />
€ milli<strong>on</strong> € milli<strong>on</strong><br />
Cash and cash equivalents and other financial assets <strong>2006</strong> 2005<br />
Cash and cash equivalents<br />
Cash at bank and in hand 469 867<br />
Short-term deposits with maturity of less than three m<strong>on</strong>ths 390 412<br />
Other cash equivalents 180 250<br />
1 039 1 529<br />
Other financial assets<br />
Listed 47 36<br />
Unlisted 190 299<br />
237 335<br />
Total cash and cash equivalents and other financial assets 1 276 1 864<br />
Other financial assets include government securities and A minus or higher rated m<strong>on</strong>ey and capital market instruments.<br />
€ milli<strong>on</strong> € milli<strong>on</strong> € milli<strong>on</strong><br />
Cash and cash equivalents included in the cash flow statement <strong>2006</strong> 2005 2004<br />
Cash and cash equivalents as per balance sheet 1 039 1 529 1 590<br />
Cash and cash equivalents in businesses held for sale – 1 n/a<br />
Bank overdrafts (329) (265) (184)<br />
710 1 265 1 406<br />
Interest rate profile and currency analysis of financial assets<br />
The table set out below takes into account the various interest rate swaps and forward foreign currency c<strong>on</strong>tracts entered into by the Group,<br />
details of which are set out in note 17 <strong>on</strong> pages 99 and 100.<br />
The interest rate profiles of the Group’s financial assets analysed by principal currency are set out in the table below:<br />
€ milli<strong>on</strong> € milli<strong>on</strong> € milli<strong>on</strong><br />
Fixed Fixed Fixed Floating Floating<br />
rate rate rate rate rate Total<br />
Amount Average Weighted<br />
of fixing interest rate average Interest<br />
for following for following fixing rate for<br />
year year period 2007<br />
Assets – <strong>2006</strong><br />
Euro 1 3.1% 0.1 years 210 4.1% 211<br />
Sterling 1 549 5.3% 1.0 years 1 193 5.6% 2 742 (a)<br />
US dollar – 8 5.4% 8<br />
Indian rupee – 403 8.8% 403<br />
Other – 635 7.0% 635<br />
1 550 2 449 3 999<br />
Sterling leg of currency derivatives mainly relating to intra-group loans (a) (2 723)<br />
Total 1 276<br />
Assets – 2005 (b)<br />
Euro 14 3.1% 1.1 years 636 650<br />
Sterling – 57 57<br />
US dollar – 94 94<br />
Indian rupee – 346 346<br />
Other – 967 967<br />
Total 14 2 100 2 114 (c)<br />
(a) Includes the sterling leg of the currency derivatives mainly relating to intra-group loans, amounting to €2 723 milli<strong>on</strong> for <strong>2006</strong>. These<br />
derivatives create a sterling interest rate exposure. However, to rec<strong>on</strong>cile the assets with the balance sheet, the total value is eliminated<br />
again. The other leg of the currency derivatives is shown in note 16 as a liability.<br />
(b) Figures for 2005 have been restated to reflect the amount of fixing and related average interest rate for the following year.<br />
(c) Includes fair value of borrowing-related derivatives amounting to €250 milli<strong>on</strong>. For further in<strong>form</strong>ati<strong>on</strong> please refer to note 17 <strong>on</strong><br />
pages 99 and 100.<br />
<strong>Unilever</strong> <str<strong>on</strong>g>Annual</str<strong>on</strong>g> Report <strong>on</strong> Form 20-F <strong>2006</strong> 95<br />
Financial Statements (c<strong>on</strong>tinued)
Financial Statements (c<strong>on</strong>tinued)<br />
Notes to the c<strong>on</strong>solidated accounts <strong>Unilever</strong> Group<br />
16 Borrowings<br />
€ milli<strong>on</strong> € milli<strong>on</strong><br />
Borrowings <strong>2006</strong> 2005<br />
Preference shares 124 124<br />
Bank loans and overdrafts 1 307 1 456<br />
B<strong>on</strong>ds and other loans<br />
At amortised cost 6 561 8 609<br />
Subject to fair value hedge accounting 609 2 210<br />
96 <strong>Unilever</strong> <str<strong>on</strong>g>Annual</str<strong>on</strong>g> Report <strong>on</strong> Form 20-F <strong>2006</strong><br />
8 601 12 399<br />
€ milli<strong>on</strong> € milli<strong>on</strong><br />
Borrowings – additi<strong>on</strong>al details <strong>2006</strong> 2005<br />
The repayments fall due as follows<br />
Within <strong>on</strong>e year:<br />
Bank loans and overdrafts 743 786<br />
B<strong>on</strong>ds and other loans 3 619 5 156<br />
Total due within <strong>on</strong>e year 4 362 5 942<br />
After <strong>on</strong>e year but within two years 385 2 049<br />
After two years but within three years 311 180<br />
After three years but within four years 1 344 391<br />
After four years but within five years 2 1 493<br />
After five years 2 197 2 344<br />
Total due after more than <strong>on</strong>e year 4 239 6 457<br />
Secured borrowings – 8<br />
Of which secured against property, plant and equipment – –<br />
€ milli<strong>on</strong> € milli<strong>on</strong> € milli<strong>on</strong> € milli<strong>on</strong><br />
Issued,<br />
Number Nominal Number called up<br />
of shares value of shares and fully Statutory<br />
authorised Authorised per share issued paid Reserve Total<br />
Preference shares NV as at 31 December <strong>2006</strong><br />
7% Cumulative Preference 75 000 32 €428.57 29 000 12 1 13<br />
6% Cumulative Preference 200 000 86 €428.57 161 060 69 4 73<br />
4% Cumulative Preference 750 000 32 €42.86 750 000 32 2 34<br />
Share premium 4 4<br />
150 117 7 124<br />
Preference shares NV as at 31 December 2005<br />
7% Cumulative Preference 75 000 34 €453.78 29 000 13 – 13<br />
6% Cumulative Preference 200 000 91 €453.78 161 060 73 – 73<br />
4% Cumulative Preference 750 000 34 €45.38 750 000 34 – 34<br />
Share premium 4 – 4<br />
159 124 – 124<br />
The 7%, 6% and 4% cumulative preference shares of NV are entitled to dividends at the rates indicated. The 4% preference capital of NV is<br />
redeemable at par at the company‘s opti<strong>on</strong> either wholly or in part. The other classes of preferential share capital of NV are not redeemable.<br />
At the <str<strong>on</strong>g>Annual</str<strong>on</strong>g> General Meeting of NV held <strong>on</strong> 8 May <strong>2006</strong> it was agreed to c<strong>on</strong>vert the nominal value of all classes of shares from guilders into<br />
euros. The 7% and 6% preference shares with a nominal value of Fl.1 000 each, were c<strong>on</strong>verted into shares with a nominal value of €428.57<br />
each, and the 4% preference shares with a nominal value of Fl.100 each, were c<strong>on</strong>verted into shares with a nominal value of €42.86 each.<br />
The effect of this was to adjust their <str<strong>on</strong>g>report</str<strong>on</strong>g>ed value, with the difference being held as a statutory reserve.<br />
In order to maintain the same ec<strong>on</strong>omic rights for the preference shares as before the euro c<strong>on</strong>versi<strong>on</strong>, it was decided that their entitlement to<br />
dividend and liquidati<strong>on</strong> proceeds remains linked, using the official euro c<strong>on</strong>versi<strong>on</strong> rate, to the amount in Dutch guilders originally paid up <strong>on</strong><br />
these shares. As a c<strong>on</strong>sequence the amount paid out as preference dividends will remain the same euro amount as paid out in previous years.
Notes to the c<strong>on</strong>solidated accounts <strong>Unilever</strong> Group<br />
16 Borrowings (c<strong>on</strong>tinued)<br />
Borrowings – additi<strong>on</strong>al details<br />
The tables set out below and <strong>on</strong> page 95 take into account the various interest rate swaps and forward foreign currency c<strong>on</strong>tracts entered into<br />
by the Group, details of which are set out in note 17 <strong>on</strong> pages 99 and 100.<br />
Details of specific b<strong>on</strong>ds and other loans are also given below:<br />
€ milli<strong>on</strong> € milli<strong>on</strong> € milli<strong>on</strong> € milli<strong>on</strong><br />
Amortised Fair Amortised Fair<br />
cost value cost value<br />
<strong>2006</strong> <strong>2006</strong> (a) 2005 2005 (a)<br />
<strong>Unilever</strong> N.V.<br />
5.125% B<strong>on</strong>ds <strong>2006</strong> (€) – – – 1 010<br />
5.125% Notes <strong>2006</strong> (US $) – – 431 –<br />
4.250% B<strong>on</strong>ds 2007 (€) 505 500 513 507<br />
5.000% B<strong>on</strong>ds 2007 (US $) 490 – – 556<br />
3.375% B<strong>on</strong>ds 2015 (€) 747 – 747 –<br />
Commercial paper (€) – – 2 180 –<br />
Commercial paper (£) – – 491 –<br />
Commercial paper (US $) – – 348 –<br />
Commercial paper (Swiss francs) – – 53 –<br />
Other 7 – 36 –<br />
Total <strong>Unilever</strong> N.V. 1 749 500 4 799 2 073<br />
Other group companies<br />
Netherlands<br />
Commercial paper (€) 770 – – –<br />
Commercial paper (£) 532 – – –<br />
Commercial paper (US $) 236 – – –<br />
Commercial paper (Swiss francs) 63 – – –<br />
United States<br />
6.150% B<strong>on</strong>ds <strong>2006</strong> (US $) – – 253 –<br />
7.125% B<strong>on</strong>ds 2010 (US $) 1 321 – 1 467 –<br />
7.000% B<strong>on</strong>ds 2017 (US $) 110 – 120 –<br />
7.250% B<strong>on</strong>ds 2026 (US $) 217 – 239 –<br />
6.625% B<strong>on</strong>ds 2028 (US $) 166 – 185 –<br />
5.900% B<strong>on</strong>ds 2032 (US $) 746 – 829 –<br />
5.600% B<strong>on</strong>ds 2097 (US $) 69 – 77 –<br />
Commercial paper (US $) 259 – – –<br />
Other 8 – 12 –<br />
Japan<br />
Floating rate note <strong>2006</strong> (Japanese yen) – – 151 –<br />
Thailand<br />
3.300% B<strong>on</strong>ds 2007 (Thai baht) 139 – 134 –<br />
South Africa<br />
10.200% B<strong>on</strong>ds 2008 (South African rand) – 109 – 137<br />
Commercial paper (South African rand) 27 – 120 –<br />
Other countries 149 – 223 –<br />
Total other group companies 4 812 109 3 810 137<br />
Total b<strong>on</strong>ds and other loans 6 561 609 8 609 2 210<br />
(a) As required by fair value hedge accounting, the fair value of the b<strong>on</strong>ds and other loans is based <strong>on</strong> their amortised cost adjusted for the<br />
market value of the related derivative.<br />
Reclassificati<strong>on</strong>s<br />
During <strong>2006</strong> <strong>Unilever</strong> disc<strong>on</strong>tinued fair value accounting for 5.000% B<strong>on</strong>ds 2007. On the date the hedge accounting disc<strong>on</strong>tinued, the fair<br />
value became the new value at amortised cost.<br />
<strong>Unilever</strong> <str<strong>on</strong>g>Annual</str<strong>on</strong>g> Report <strong>on</strong> Form 20-F <strong>2006</strong> 97<br />
Financial Statements (c<strong>on</strong>tinued)
Financial Statements (c<strong>on</strong>tinued)<br />
Notes to the c<strong>on</strong>solidated accounts <strong>Unilever</strong> Group<br />
16 Borrowings (c<strong>on</strong>tinued)<br />
Undrawn committed facilities<br />
<strong>Unilever</strong> had the following undrawn committed facilities at 31 December <strong>2006</strong>:<br />
• revolving 364-day bilateral credit facilities of in aggregate US $4 263 milli<strong>on</strong> (2005: US $3 958 milli<strong>on</strong>) with a 364-day term out;<br />
• revolving five-year bilateral credit facilities of in aggregate US $334 milli<strong>on</strong> (2005: US $334 milli<strong>on</strong>);<br />
• revolving 364-day notes commitments of US $200 milli<strong>on</strong> (2005: US $200 milli<strong>on</strong>) with the ability to issue notes with a maturity up to<br />
364 days; and<br />
• 364-day bilateral m<strong>on</strong>ey market commitments of in aggregate US $1 420 milli<strong>on</strong> (2005: US $1 725 milli<strong>on</strong>), under which the underwriting<br />
banks agree, subject to certain c<strong>on</strong>diti<strong>on</strong>s, to subscribe for notes with maturities of up to three years.<br />
The facilities that matured in November <strong>2006</strong> and December <strong>2006</strong> have been renewed until November 2007.<br />
Interest rate<br />
The average interest rate <strong>on</strong> short-term borrowings in <strong>2006</strong> was 3.6% (2005: 3.0%).<br />
Interest rate profile and currency analysis of financial liabilities<br />
The interest rate profiles of the Group’s financial liabilities analysed by principal currency are set out in the table below:<br />
98 <strong>Unilever</strong> <str<strong>on</strong>g>Annual</str<strong>on</strong>g> Report <strong>on</strong> Form 20-F <strong>2006</strong><br />
€ milli<strong>on</strong> € milli<strong>on</strong> € milli<strong>on</strong><br />
Fixed Fixed Fixed Floating Floating<br />
rate rate rate rate rate Total<br />
Amount Average Weighted<br />
of fixing interest rate average Interest<br />
for following for following fixing rate for<br />
year year period 2007<br />
Liabilities – <strong>2006</strong><br />
Euro (a) 1 771 3.4% 4.5 years 351 4.1% 2 122<br />
Sterling 140 7.8% 20.8 years 140 5.6% 280<br />
US dollar 3 444 6.6% 12.2 years 2 687 5.4% 6 131<br />
Swedish kr<strong>on</strong>a – 830 3.8% 830<br />
Swiss francs – 519 2.4% 519<br />
Japanese yen 1 4.0% 0.5 years 377 0.8% 378<br />
Thai baht 139 3.2% 0.9 years 85 5.2% 224<br />
Other 102 11.7% 3.9 years 936 7.7% 1 038<br />
5 597 5 925 11 522<br />
Euro leg of currency derivatives mainly relating to intra-group loans (b) (2 723)<br />
Total 8 799 (c)<br />
Liabilities – 2005 (d)<br />
Euro (a) 1 897 3.0% 4.9 years 571 2 468<br />
Sterling 91 5.4% 0.7 years (52) 39<br />
US dollar 3 857 6.3% 12.9 years 2 517 6 374<br />
Japanese yen 2 4.0% 1.5 years 436 438<br />
Thai baht 153 3.2% 1.9 years 104 257<br />
Other 127 11.7% 4.8 years 2 913 3 040<br />
Total 6 127 6 489 12 616 (e)<br />
(a) Euro borrowings include €124 milli<strong>on</strong> preference shares that provide for a fixed preference dividend.<br />
(b) Includes the euro leg of the currency derivatives mainly relating to intra-group loans, amounting to €2 723 milli<strong>on</strong> for <strong>2006</strong>. These<br />
derivatives create an interest rate exposure in euro. However, to rec<strong>on</strong>cile the liability with the balance sheet, the total value is eliminated<br />
again. The other leg of the currency derivatives is shown in note 15 <strong>on</strong> page 95 as an asset.<br />
(c) Includes finance lease creditors amounting to €187 milli<strong>on</strong> and fair value of borrowing-related derivatives (see note 17 <strong>on</strong> page 99)<br />
amounting to €11 milli<strong>on</strong>.<br />
(d) Figures for 2005 have been restated to reflect the amount of fixing and related average interest rate for the following year.<br />
(e) Includes finance lease creditors amounting to €217 milli<strong>on</strong>.
Notes to the c<strong>on</strong>solidated accounts <strong>Unilever</strong> Group<br />
17 Financial instruments and treasury risk management<br />
The Group has comprehensive policies in place, approved by the Boards, covering the use of derivative financial instruments. These instruments<br />
are used for hedging purposes. Established c<strong>on</strong>trols are in place covering all financial instruments. These include policies, guidelines, exposure<br />
limits, a system of authorities and independent <str<strong>on</strong>g>report</str<strong>on</strong>g>ing. Per<strong>form</strong>ance is closely m<strong>on</strong>itored with independent reviews undertaken by internal<br />
audit. Hedge accounting principles are described in note 1 <strong>on</strong> page 74. The use of leveraged instruments is not permitted. Details of the<br />
instruments used for interest rate and foreign exchange exposure management, together with in<strong>form</strong>ati<strong>on</strong> <strong>on</strong> related exposures, are given below.<br />
<strong>Unilever</strong>’s interest rate management policy is described below. The Group’s exposure to interest rates is mainly fixed by fixed rate l<strong>on</strong>g-term<br />
debt issues and straightforward derivative financial instruments, such as interest rate swaps. In general, cash is invested short-term at floating<br />
interest rates.<br />
At the end of <strong>2006</strong>, interest rates were fixed <strong>on</strong> approximately 48% of the projected net of cash and borrowing positi<strong>on</strong>s for 2007 and 52%<br />
for 2008 (compared with 61% for <strong>2006</strong> and 49% for 2007 at the end of 2005).<br />
The separate amounts shown as assets and liabilities are not indicative of the amount of credit risk to which the Group is exposed as we have<br />
netting agreements in place with our principal banks. In case of a default, <strong>Unilever</strong> is allowed to net the assets and liabilities. There was no<br />
significant c<strong>on</strong>centrati<strong>on</strong> of credit risk with any single counterparty. Details of our policy for managing credit risk are given below.<br />
In the assessment of hedge effectiveness the credit risk element <strong>on</strong> the underlying hedged item has been excluded. Hedge ineffectiveness is<br />
immaterial.<br />
Fair values of derivatives used as cash flow hedges, fair value hedges and in c<strong>on</strong>necti<strong>on</strong> with purchases of own shares at 31 December <strong>2006</strong><br />
amounted in total to assets of €23 milli<strong>on</strong> (2005: €62 milli<strong>on</strong>) and liabilities of €9 milli<strong>on</strong> (2005: €22 milli<strong>on</strong>). Of these amounts, the fair value<br />
of borrowing-related derivatives at 31 December <strong>2006</strong> was €5 milli<strong>on</strong> (2005: €46 milli<strong>on</strong>).<br />
€ milli<strong>on</strong> € milli<strong>on</strong> € milli<strong>on</strong> € milli<strong>on</strong><br />
Assets Assets Liabilities Liabilities<br />
Fair values of derivatives used as hedges of net investments in foreign entities <strong>2006</strong> 2005 <strong>2006</strong> 2005<br />
Current<br />
Foreign exchange derivatives 11 250 350 1<br />
The fair value of borrowing-related derivatives included above at 31 December <strong>2006</strong> amounted to €(339) milli<strong>on</strong> (2005: €249 milli<strong>on</strong>). The<br />
impact of exchange rate movements <strong>on</strong> the fair value of forward exchange c<strong>on</strong>tracts used to hedge net investments is recognised in reserves.<br />
€ milli<strong>on</strong> € milli<strong>on</strong> € milli<strong>on</strong> € milli<strong>on</strong><br />
Assets Assets Liabilities Liabilities<br />
Fair values of natural hedges (a) <strong>2006</strong> 2005 <strong>2006</strong> 2005<br />
Current<br />
Interest rate derivatives 2 7 1 2<br />
Cross currency swaps – 253 6 1<br />
Foreign exchange derivatives 371 11 31 282<br />
373 271 38 285<br />
N<strong>on</strong>-current<br />
Interest rate derivatives – – 1 4<br />
Cross currency swaps – – 12 27<br />
– – 13 31<br />
373 271 51 316<br />
(a) A natural hedge – sometimes known as an ec<strong>on</strong>omic hedge – is where exposure to a risk is offset, or partly offset, by an opposite exposure<br />
to that same risk. Hedge accounting is not applied to these relati<strong>on</strong>ships.<br />
Of the fair values disclosed above, the fair value of borrowing-related derivatives at 31 December <strong>2006</strong> amounted to €323 milli<strong>on</strong><br />
(2005: €(45) milli<strong>on</strong>).<br />
Additi<strong>on</strong>al in<strong>form</strong>ati<strong>on</strong><br />
The fair values of forward foreign exchange c<strong>on</strong>tracts represent the unrealised gain or loss <strong>on</strong> revaluati<strong>on</strong> of the c<strong>on</strong>tracts at the year-end<br />
forward exchange rates. The fair values of interest rate derivatives are based <strong>on</strong> the net present value of the anticipated future cash flows.<br />
Embedded derivatives<br />
In accordance with IAS 39, 'Financial instruments: Recogniti<strong>on</strong> and Measurement', <strong>Unilever</strong> has reviewed all c<strong>on</strong>tracts for embedded derivatives<br />
that are required to be separately accounted for if they do not meet specific requirements set out in the standard; no such embedded<br />
derivatives have been identified.<br />
<strong>Unilever</strong> <str<strong>on</strong>g>Annual</str<strong>on</strong>g> Report <strong>on</strong> Form 20-F <strong>2006</strong> 99<br />
Financial Statements (c<strong>on</strong>tinued)
Financial Statements (c<strong>on</strong>tinued)<br />
Notes to the c<strong>on</strong>solidated accounts <strong>Unilever</strong> Group<br />
17 Financial instruments and treasury risk management (c<strong>on</strong>tinued)<br />
Fair values of financial assets and financial liabilities<br />
The following table summarises the fair values and carrying amounts of the various classes of financial assets and financial liabilities. All trade<br />
and other receivables and trade payables and other liabilities (other than finance lease creditors) and provisi<strong>on</strong>s have been excluded from the<br />
analysis below and from the interest rate and currency profiles in note 15 <strong>on</strong> page 95 and note 16 <strong>on</strong> page 96, as their carrying amounts are<br />
a reas<strong>on</strong>able approximati<strong>on</strong> of their fair value, because of their short-term nature.<br />
100 <strong>Unilever</strong> <str<strong>on</strong>g>Annual</str<strong>on</strong>g> Report <strong>on</strong> Form 20-F <strong>2006</strong><br />
€ milli<strong>on</strong> € milli<strong>on</strong> € milli<strong>on</strong> € milli<strong>on</strong><br />
Fair Fair Carrying Carrying<br />
value value amount amount<br />
<strong>2006</strong> 2005 <strong>2006</strong> 2005<br />
Financial assets<br />
Other n<strong>on</strong>-current assets 784 757 771 757<br />
Cash and cash equivalents 1 039 1 529 1 039 1 529<br />
Other financial assets 237 335 237 335<br />
Derivatives related to borrowings – 250 – 250<br />
2 060 2 871 2 047 2 871<br />
Financial liabilities<br />
Bank loans and overdrafts (1 307) (1 456) (1 307) (1 456)<br />
B<strong>on</strong>ds and other loans (7 402) (11 255) (7 170) (10 819)<br />
Finance lease creditors (192) (225) (187) (217)<br />
Preference shares (122) (124) (124) (124)<br />
Derivatives related to borrowings (11) – (11) –<br />
(9 034) (13 060) (8 799) (12 616)<br />
The fair values and the carrying amount of listed investments included in financial assets and preference shares included in financial liabilities are<br />
based <strong>on</strong> their market values. Cash and cash equivalents, other financial assets, bank loans and overdrafts have fair values that approximate to<br />
their carrying amounts because of their short-term nature. The fair values of listed b<strong>on</strong>ds are based <strong>on</strong> their market value; n<strong>on</strong>-listed b<strong>on</strong>ds and<br />
other loans are based <strong>on</strong> the net present value of the anticipated future cash flows associated with these instruments. Fair values for finance<br />
lease creditors have been assessed by reference tocurrent market rates for comparable leasing arrangements.<br />
Collateral<br />
Counterparties have deposited securities with a market value of €2 milli<strong>on</strong> (2005: €275 milli<strong>on</strong>) as collateral for their obligati<strong>on</strong>s in respect of<br />
derivative financial instruments. Such collateral is not regarded as an asset of <strong>Unilever</strong> and is excluded from the balance sheet.<br />
Commodity c<strong>on</strong>tracts<br />
<strong>Unilever</strong> purchases forward c<strong>on</strong>tracts to hedge future requirements for certain raw materials, almost always for physical delivery. Futures<br />
c<strong>on</strong>tracts may also be used to hedge future price movements.<br />
Treasury risk management<br />
<strong>Unilever</strong> manages a variety of market risks, including the effects of changes in foreign exchange rates, interest rates, liquidity and counterparty risks.<br />
<strong>Unilever</strong> has an interest rate management policy aimed at optimising net interest cost and reducing volatility. This is achieved by modifying the<br />
interest rate exposure of debt and cash positi<strong>on</strong>s through the use of interest rate swaps.<br />
Fixed rate investments and borrowings give rise to a fair value interest rate risk. The floating amounts give rise to a cash flow interest rate risk.<br />
Because of <strong>Unilever</strong>’s broad operati<strong>on</strong>al reach, it is subject to risks from changes in foreign currency values that could affect earnings. As a<br />
practical matter, it is not feasible to fully hedge these fluctuati<strong>on</strong>s. Additi<strong>on</strong>ally, <strong>Unilever</strong> believes that most currencies of major countries in<br />
which it operates will equalise against the euro over time. <strong>Unilever</strong> does have a foreign exchange policy that requires operating companies to<br />
manage trading and financial foreign exchange exposures within prescribed limits. This is achieved primarily through the use of forward foreign<br />
exchange c<strong>on</strong>tracts. Regi<strong>on</strong>al groups m<strong>on</strong>itor compliance with this policy. At the end of <strong>2006</strong>, there was no material exposure from companies<br />
holding assets and liabilities other than in their functi<strong>on</strong>al currency.<br />
In additi<strong>on</strong>, as <strong>Unilever</strong> c<strong>on</strong>ducts business in many foreign currencies but publishes its financial statements and measures its per<strong>form</strong>ance in<br />
euros, it is subject to exchange risk due to the effects that exchange rate movements have <strong>on</strong> the translati<strong>on</strong> of the underlying net assets of its<br />
foreign subsidiaries. <strong>Unilever</strong> aims to minimise its foreign exchange exposure in operating companies by borrowing in the local currency, except<br />
where inhibited by local regulati<strong>on</strong>s, lack of local liquidity or local market c<strong>on</strong>diti<strong>on</strong>s. For those countries that, in the view of management, have<br />
a substantial retranslati<strong>on</strong> risk, <strong>Unilever</strong> may hedge such net investment. Nevertheless, from time to time, currency revaluati<strong>on</strong>s <strong>on</strong> unhedged<br />
investments will trigger exchange translati<strong>on</strong> movements in the balance sheet.
Notes to the c<strong>on</strong>solidated accounts <strong>Unilever</strong> Group<br />
17 Financial instruments and treasury risk management (c<strong>on</strong>tinued)<br />
Liquidity risk is managed by maintaining access to global debt markets through an infrastructure of short-term and l<strong>on</strong>g-term debt programmes.<br />
In additi<strong>on</strong> to this, <strong>Unilever</strong> has committed credit facilities in place to support its commercial paper programmes and for general corporate<br />
purposes. See note 16 <strong>on</strong> page 96 for further details of these credit facilities.<br />
Counterparty exposures are minimised by restricting dealing counterparties to a limited number of financial instituti<strong>on</strong>s that have secure credit<br />
ratings, by working within agreed counterparty limits, by obtaining collateral for outstanding positi<strong>on</strong>s and by setting limits <strong>on</strong> the maturity of<br />
exposures. Counterparty credit ratings are closely m<strong>on</strong>itored and c<strong>on</strong>centrati<strong>on</strong> of credit risk with any single counterparty is avoided. There was<br />
no significant c<strong>on</strong>centrati<strong>on</strong> of credit risk with any single counterparty as at the year end.<br />
Master netting agreements are in place for the majority of interest rate derivative instruments. The risk in the event of default by a counterparty<br />
is determined by the extent to which market prices have moved since the c<strong>on</strong>tracts were made. The Group believes that the risk of incurring<br />
such losses is remote.<br />
Cash flow provides the funds to service the financing of the business and enhance shareholder return. A material and sustained shortfall<br />
in our cash flow could undermine our credit rating and overall investor c<strong>on</strong>fidence and could restrict the Group’s ability to raise funding.<br />
Sensitivity analysis<br />
The analysis below presents the sensitivity of the fair value of the financial instruments, including derivative financial instruments which the<br />
Group held at 31 December <strong>2006</strong>, to hypothetical changes in interest and foreign exchange rates.<br />
Interest rate sensitivity<br />
The fair values of debt, investments and related hedging instruments are affected by movements in interest rates. The analysis shows the<br />
sensitivity of the fair value of interest rate-sensitive instruments to a hypothetical 10% change in the interest rates across all maturities.<br />
Foreign exchange rate sensitivity<br />
The values of debt, investments and related hedging instruments, denominated in currencies other than the functi<strong>on</strong>al currency of the entities<br />
holding them, are subject to exchange rate movements. The analysis shows the income statement sensitivity of these values to a hypothetical<br />
10% change in foreign exchange rates.<br />
Sensitivity to a<br />
hypothetical 10% change in<br />
rates as at 31 December<br />
€ milli<strong>on</strong> € milli<strong>on</strong><br />
<strong>2006</strong> 2005<br />
Interest rate risk 167 193<br />
Foreign exchange rate risk 16 30<br />
The above-menti<strong>on</strong>ed interest rate sensitivity relates to financial instruments, including derivative financial instruments, with fair values<br />
amounting to €7 408 milli<strong>on</strong> at the end of <strong>2006</strong> (2005: €11 186 milli<strong>on</strong>). The above-menti<strong>on</strong>ed foreign exchange rate risk relates to a<br />
value of financial instruments and derivatives of €164 milli<strong>on</strong> at the end of <strong>2006</strong> (2005: €300 milli<strong>on</strong>).<br />
Sensitivity to not applying hedge accounting<br />
Derivatives have to be <str<strong>on</strong>g>report</str<strong>on</strong>g>ed at fair value. Those derivatives used for cash flow hedging for which we do not apply hedge accounting will<br />
cause volatility in the income statement. Such derivatives did not have a material impact <strong>on</strong> the <strong>2006</strong> income statement.<br />
Income statement sensitivity to changes in interest rates<br />
As menti<strong>on</strong>ed above <strong>on</strong> page 100, <strong>Unilever</strong> has an interest rate management policy aimed at optimising net interest costs and reducing<br />
volatility. Part of the interest rates <strong>on</strong> funds and debt are not fixed and are therefore subject to changes in floating interest rates. The analysis<br />
shows the sensitivity of the income statement to a hypothetical <strong>on</strong>e percentage point change in floating interest rates over both funds and debt<br />
<strong>on</strong> a full-year basis.<br />
Sensitivity to a hypothetical<br />
<strong>on</strong>e percentage point change in<br />
floating rates as at 31 December<br />
€ milli<strong>on</strong> € milli<strong>on</strong><br />
<strong>2006</strong> 2005<br />
Funds 24 21<br />
Debt (59) (66)<br />
<strong>Unilever</strong> <str<strong>on</strong>g>Annual</str<strong>on</strong>g> Report <strong>on</strong> Form 20-F <strong>2006</strong> 101<br />
Financial Statements (c<strong>on</strong>tinued)
Financial Statements (c<strong>on</strong>tinued)<br />
Notes to the c<strong>on</strong>solidated accounts <strong>Unilever</strong> Group<br />
18 Trade payables and other liabilities<br />
€ milli<strong>on</strong> € milli<strong>on</strong><br />
Trade and other payables <strong>2006</strong> 2005<br />
Due within <strong>on</strong>e year<br />
Trade payables 3 833 3 988<br />
Accruals 2 741 2 858<br />
Social security and sundry taxes 386 410<br />
Finance lease creditors 61 64<br />
Others 913 908<br />
7 934 8 228<br />
Due after more than <strong>on</strong>e year<br />
Accruals 197 153<br />
Finance lease creditors 126 153<br />
Others 76 83<br />
102 <strong>Unilever</strong> <str<strong>on</strong>g>Annual</str<strong>on</strong>g> Report <strong>on</strong> Form 20-F <strong>2006</strong><br />
399 389<br />
Total trade and other payables 8 333 8 617<br />
The amounts shown above do not include any creditors due after more than five years other than finance lease creditors described in note 25<br />
<strong>on</strong> page 112.<br />
19 Provisi<strong>on</strong>s<br />
€ milli<strong>on</strong> € milli<strong>on</strong><br />
Provisi<strong>on</strong>s <strong>2006</strong> 2005<br />
Due within <strong>on</strong>e year<br />
Restructuring provisi<strong>on</strong>s 439 391<br />
Preference shares provisi<strong>on</strong> 300 –<br />
Other provisi<strong>on</strong>s 270 253<br />
1 009 644<br />
Due after <strong>on</strong>e year<br />
Restructuring provisi<strong>on</strong>s 53 63<br />
Legal provisi<strong>on</strong>s 51 38<br />
Disputed indirect taxes 560 547<br />
Net liability of associate 34 37<br />
Other provisi<strong>on</strong>s 128 47<br />
826 732<br />
Total restructuring and other provisi<strong>on</strong>s 1 835 1 376<br />
€ milli<strong>on</strong> € milli<strong>on</strong> € milli<strong>on</strong> € milli<strong>on</strong> € milli<strong>on</strong> € milli<strong>on</strong> € milli<strong>on</strong><br />
Preference<br />
Restructuring Legal shares Disputed Net liability Other<br />
Movements during <strong>2006</strong> provisi<strong>on</strong>s provisi<strong>on</strong>s provisi<strong>on</strong> indirect taxes of associate provisi<strong>on</strong>s Total<br />
31 December 2005 454 38 – 547 37 300 1 376<br />
Disposal of group companies 1 – – – – 48 49<br />
Income statement:<br />
New charges 472 18 300 95 – 126 1 011<br />
Releases (89) (3) – (47) – (30) (169)<br />
Utilisati<strong>on</strong> (332) – – (22) – (35) (389)<br />
Currency retranslati<strong>on</strong> (14) (2) – (13) (3) (11) (43)<br />
31 December <strong>2006</strong> 492 51 300 560 34 398 1 835<br />
Restructuring provisi<strong>on</strong>s primarily relate to early retirement and redundancy costs; no projects are individually material.<br />
Legal provisi<strong>on</strong>s are comprised of many claims, of which n<strong>on</strong>e is individually material.<br />
<strong>Unilever</strong> announced <strong>on</strong> 8 November <strong>2006</strong> that it had agreed a settlement with the main parties in the legal dispute over its 1999 <strong>Unilever</strong> N.V.<br />
preference shares. The terms of the agreement are that NV will pay an amount of €1.38 plus interest of €0.16 compensati<strong>on</strong> per preference<br />
share held at the beginning of 24 March 2004, the day <strong>on</strong> which NV announced its intenti<strong>on</strong> to c<strong>on</strong>vert the preference shares into NV ordinary<br />
shares. NV also agreed to reimburse the parties who initiated the Enterprise Chamber procedure for costs and expenses. On 19 January 2007<br />
NV announced that the settlement offer will be extended to all those other <strong>form</strong>er preference shareholders who held preference shares at the<br />
beginning of 24 March 2004. <strong>Unilever</strong> has provided €300 milli<strong>on</strong> in respect of the settlement.<br />
The provisi<strong>on</strong> for disputed indirect taxes is comprised of a number of small disputed items. The largest elements of the provisi<strong>on</strong> relate to<br />
disputes with the Brazilian authorities. Because of the nature of the disputes, the timing of the utilisati<strong>on</strong> of the provisi<strong>on</strong>s, and any associated<br />
cash outflows, is uncertain. The majority of the disputed items attract an interest charge.<br />
No individual item within the other provisi<strong>on</strong>s balance is significant. <strong>Unilever</strong> expects that the issues relating to these restructuring, legal and<br />
other provisi<strong>on</strong>s will be substantively resolved over the next five years.
Notes to the c<strong>on</strong>solidated accounts <strong>Unilever</strong> Group<br />
20 Pensi<strong>on</strong>s and similar obligati<strong>on</strong>s<br />
Descripti<strong>on</strong> of plans<br />
In many countries the Group operates defined benefit pensi<strong>on</strong> plans based <strong>on</strong> employee pensi<strong>on</strong>able remunerati<strong>on</strong> and length of service.<br />
The majority of these plans are externally funded. The Group also provides other post-employment benefits, mainly post-employment medical<br />
plans in the United States. These plans are predominantly unfunded. The Group also operates a number of defined c<strong>on</strong>tributi<strong>on</strong> plans, the<br />
assets of which are held in external funds.<br />
The majority of the Group’s externally funded plans are established as trusts, foundati<strong>on</strong>s or similar entities. The operati<strong>on</strong> of these entities<br />
is governed by local regulati<strong>on</strong>s and practice in each country, as is the nature of the relati<strong>on</strong>ship between the Group and the trustees (or<br />
equivalent) and their compositi<strong>on</strong>.<br />
Exposure to risks<br />
Pensi<strong>on</strong> assets and liabilities (pre-tax) of €17 278 milli<strong>on</strong> and €20 358 milli<strong>on</strong> respectively are held <strong>on</strong> the Group’s balance sheet as at<br />
31 December <strong>2006</strong>. Movements in equity markets, interest rates, inflati<strong>on</strong> and life expectancy could materially affect the level of surpluses<br />
and deficits in these schemes, and could prompt the need for the Group to make additi<strong>on</strong>al pensi<strong>on</strong> c<strong>on</strong>tributi<strong>on</strong>s, or to reduce pensi<strong>on</strong><br />
c<strong>on</strong>tributi<strong>on</strong>s, in the future. The key assumpti<strong>on</strong>s used to value our pensi<strong>on</strong> liabilities are set out below and <strong>on</strong> page 104.<br />
Investment strategy<br />
The Group’s investment strategy in respect of its funded pensi<strong>on</strong> plans is implemented within the framework of the various statutory<br />
requirements of the territories where the plans are based. The Group has developed policy guidelines for the allocati<strong>on</strong> of assets to different<br />
classes with the objective of c<strong>on</strong>trolling risk and maintaining the right balance between risk and l<strong>on</strong>g-term returns in order to limit the cost to<br />
the company of the benefits provided. To achieve this, investments are well diversified, such that the failure of any single investment would not<br />
have a material impact <strong>on</strong> the overall level of assets. The plans invest the largest proporti<strong>on</strong> of the assets in equities which the Group believes<br />
offer the best returns over the l<strong>on</strong>g term commensurate with an acceptable level of risk. The pensi<strong>on</strong> funds also have a proporti<strong>on</strong> of assets<br />
invested in property, b<strong>on</strong>ds and cash. The majority of assets are managed by a number of external fund managers with a small proporti<strong>on</strong><br />
managed in-house. <strong>Unilever</strong> has a pooled investment vehicle (Univest) which it believes offers its pensi<strong>on</strong> plans around the world a simplified<br />
externally managed investment soluti<strong>on</strong> to implement their strategic asset allocati<strong>on</strong> models initially for equities. The aim is to provide a high<br />
quality, well diversified risk-c<strong>on</strong>trolled soluti<strong>on</strong>.<br />
Significant Items <strong>on</strong> the face of the Income Statement<br />
During <strong>2006</strong> we updated certain terms of the defined benefit plan in the UK which resulted in a <strong>on</strong>e-off credit to the income statement in<br />
<strong>2006</strong> of €120 milli<strong>on</strong>. During <strong>2006</strong> a number of initiatives were taken to reduce the cost of healthcare benefits, principally in the United States,<br />
through changes to the design of the plans. As a c<strong>on</strong>sequence, a reducti<strong>on</strong> in liability of €146 milli<strong>on</strong> was recognised in the income statement<br />
for <strong>2006</strong>.<br />
Assumpti<strong>on</strong>s<br />
With the objective of presenting the assets and liabilities of the pensi<strong>on</strong>s and other post-employment benefit plans at their fair value <strong>on</strong> the<br />
balance sheet, assumpti<strong>on</strong>s under IAS 19 are set by reference to market c<strong>on</strong>diti<strong>on</strong>s at the valuati<strong>on</strong> date. The actuarial assumpti<strong>on</strong>s used to<br />
calculate the benefit obligati<strong>on</strong>s vary according to the country in which the plan is situated. The following table shows the assumpti<strong>on</strong>s,<br />
weighted by liabilities, used to value the principal defined benefit pensi<strong>on</strong> plans (covering approximately 96% of pensi<strong>on</strong> liabilities – the<br />
‘principal pensi<strong>on</strong> plans’) and plans providing other post-employment benefits, and in additi<strong>on</strong> the expected l<strong>on</strong>g-term rates of return <strong>on</strong> assets,<br />
weighted by asset value.<br />
31 December <strong>2006</strong> 31 December 2005 31 December 2004<br />
Principal Other Principal Other Principal Other<br />
defined post- defined post- defined postbenefit<br />
employment benefit employment benefit employment<br />
pensi<strong>on</strong> benefit pensi<strong>on</strong> benefit pensi<strong>on</strong> benefit<br />
plans plans plans plans plans plans<br />
Discount rate 5.1% 5.9% 4.6% 5.5% 5.0% 5.7%<br />
Inflati<strong>on</strong> 2.5% n/a 2.4% n/a 2.4% n/a<br />
Rate of increase in salaries 3.7% 4.0% 3.5% 4.0% 3.6% 4.5%<br />
Rate of increase for pensi<strong>on</strong>s in payment 2.3% n/a 2.1% n/a 2.2% n/a<br />
Rate of increase for pensi<strong>on</strong>s in deferment (where provided) 2.7% n/a 2.5% n/a 2.6% n/a<br />
L<strong>on</strong>g-term medical cost inflati<strong>on</strong> n/a 5.0% n/a 4.8% n/a 4.8%<br />
Expected l<strong>on</strong>g-term rates of return:<br />
Equities 7.8% 7.4% 7.9%<br />
B<strong>on</strong>ds 4.9% 4.2% 4.5%<br />
Property 6.3% 5.8% 6.3%<br />
Others 6.3% 6.1% 6.1%<br />
Weighted average asset return 6.9% 6.4% 6.8%<br />
<strong>Unilever</strong> <str<strong>on</strong>g>Annual</str<strong>on</strong>g> Report <strong>on</strong> Form 20-F <strong>2006</strong> 103<br />
Financial Statements (c<strong>on</strong>tinued)
Financial Statements (c<strong>on</strong>tinued)<br />
Notes to the c<strong>on</strong>solidated accounts <strong>Unilever</strong> Group<br />
20 Pensi<strong>on</strong>s and similar obligati<strong>on</strong>s (c<strong>on</strong>tinued)<br />
The valuati<strong>on</strong>s of other post-employment benefit plans generally assume a higher initial level of medical cost inflati<strong>on</strong>, which falls from 9.9%<br />
to the l<strong>on</strong>g-term rate within the next five years. Assumed healthcare cost trend rates have a significant effect <strong>on</strong> the amounts <str<strong>on</strong>g>report</str<strong>on</strong>g>ed for<br />
healthcare plans. A <strong>on</strong>e percentage point change in assumed healthcare cost trend rates would have the following effect:<br />
€ milli<strong>on</strong> € milli<strong>on</strong><br />
1% point 1% point<br />
increase decrease<br />
Effect <strong>on</strong> total of service and interest cost comp<strong>on</strong>ents 4 (3)<br />
Effect <strong>on</strong> total benefit obligati<strong>on</strong> 51 (47)<br />
The expected rate of return <strong>on</strong> plan assets was determined, based <strong>on</strong> actuarial advice, by a process that takes the l<strong>on</strong>g-term rates of return <strong>on</strong><br />
government b<strong>on</strong>ds available at the balance sheet date and applies to these rates suitable risk premiums that take account of historic market<br />
returns and current market l<strong>on</strong>g-term expectati<strong>on</strong>s for each asset class.<br />
For the most important pensi<strong>on</strong> plans, representing approximately 80% of all defined benefit plans by liabilities, the assumpti<strong>on</strong>s used at<br />
31 December <strong>2006</strong>, 2005 and 2004 were:<br />
United Kingdom Netherlands<br />
Assumpti<strong>on</strong>s <strong>2006</strong> 2005 2004 <strong>2006</strong> 2005 2004<br />
Discount rate 5.1% 4.7% 5.3% 4.6% 4.0% 4.5%<br />
Inflati<strong>on</strong> 2.9% 2.7% 2.8% 1.9% 1.8% 1.8%<br />
Rate of increase in salaries 4.4% 4.2% 4.3% 2.4% 2.3% 2.3%<br />
Rate of increase for pensi<strong>on</strong>s in payment 2.9% 2.7% 2.9% 1.9% 1.8% 1.8%<br />
Rate of increase for pensi<strong>on</strong>s in deferment (where provided) 2.9% 2.7% 2.9% 1.9% 1.8% 1.8%<br />
Expected l<strong>on</strong>g-term rates of return:<br />
Equities 8.0% 7.6% 8.0% 7.6% 7.0% 7.6%<br />
B<strong>on</strong>ds 5.2% 4.5% 5.0% 4.4% 3.7% 4.1%<br />
Property 6.5% 6.1% 6.5% 6.1% 5.5% 6.1%<br />
Others 7.2% 6.7% 7.2% 4.0% 3.7% 3.5%<br />
Weighted average asset return 7.3% 6.9% 7.3% 6.6% 6.0% 6.6%<br />
104 <strong>Unilever</strong> <str<strong>on</strong>g>Annual</str<strong>on</strong>g> Report <strong>on</strong> Form 20-F <strong>2006</strong><br />
United States Germany<br />
<strong>2006</strong> 2005 2004 <strong>2006</strong> 2005 2004<br />
Discount rate 5.8% 5.5% 5.7% 4.6% 4.0% 4.5%<br />
Inflati<strong>on</strong> 2.5% 2.4% 2.5% 1.9% 1.8% 1.8%<br />
Rate of increase in salaries 4.0% 4.0% 4.5% 2.6% 2.5% 2.5%<br />
Rate of increase for pensi<strong>on</strong>s in payment 0.0% 0.0% 0.0% 1.9% 1.8% 1.8%<br />
Rate of increase for pensi<strong>on</strong>s in deferment (where provided) 0.0% 0.0% 0.0% 0.0% 0.0% 0.0%<br />
Expected l<strong>on</strong>g-term rates of return:<br />
Equities 8.3% 8.0% 8.4% 7.6% 7.0% 7.6%<br />
B<strong>on</strong>ds 5.2% 4.8% 4.7% 4.4% 3.7% 4.1%<br />
Property 6.8% 6.5% 6.9% 6.1% 5.5% 6.1%<br />
Others 4.8% 4.2% 2.1% 3.0% 3.7% 3.7%<br />
Weighted average asset return 7.4% 7.0% 7.3% 5.8% 5.3% 5.7%<br />
Demographic assumpti<strong>on</strong>s, such as mortality rates, are set having regard to the latest trends in life expectancy, plan experience and other<br />
relevant data. The assumpti<strong>on</strong>s are reviewed and updated as necessary as part of the periodic actuarial valuati<strong>on</strong> of the pensi<strong>on</strong> plans.<br />
Mortality assumpti<strong>on</strong>s for the most important countries are based <strong>on</strong> the following post-retirement mortality tables: (i) United Kingdom: PMA 92<br />
and PFA 92 with short cohort adjustment and scaling factor of 125% applied, projected to 2015 for current pensi<strong>on</strong>ers and to 2025 for future<br />
pensi<strong>on</strong>ers; (ii) the Netherlands: GBMV (1995-2000) with age set back of four years for males and two years for females; (iii) United States:<br />
RP2000 with a projecti<strong>on</strong> period of 10-15 years; and (iv) Germany: Heubeck 1998 (Periodentafel) with a scaling factor of 85%.<br />
These tables translate into the following years of life expectancy for current pensi<strong>on</strong>ers aged 65:<br />
United United<br />
Kingdom Netherlands States Germany<br />
Males 19 18 19 18<br />
Females 22 21 22 21<br />
As c<strong>on</strong>sidered appropriate having regard to the factors set out above, the assumpti<strong>on</strong>s and approach adopted allow for future improvements in<br />
life expectancy.<br />
Assumpti<strong>on</strong>s for the remaining defined benefit plans vary c<strong>on</strong>siderably, depending <strong>on</strong> the ec<strong>on</strong>omic c<strong>on</strong>diti<strong>on</strong>s of the countries where they<br />
are situated.
Notes to the c<strong>on</strong>solidated accounts <strong>Unilever</strong> Group<br />
20 Pensi<strong>on</strong>s and similar obligati<strong>on</strong>s (c<strong>on</strong>tinued)<br />
Balance Sheet<br />
The assets, liabilities and surplus/(deficit) positi<strong>on</strong> of the pensi<strong>on</strong> and other post-employment benefit plans and the expected rates of return <strong>on</strong><br />
the plan assets at the balance sheet date were:<br />
€ milli<strong>on</strong> € milli<strong>on</strong> % € milli<strong>on</strong> € milli<strong>on</strong> % € milli<strong>on</strong> € milli<strong>on</strong> %<br />
31 December <strong>2006</strong> 31 December 2005 31 December 2004<br />
Other post- L<strong>on</strong>g-term Other post- L<strong>on</strong>g-term Other post- L<strong>on</strong>g-term<br />
employment rates of employment rates of employment rates of<br />
Pensi<strong>on</strong> benefit return Pensi<strong>on</strong> benefit return Pensi<strong>on</strong> benefit return<br />
plans plans expected plans plans expected plans plans expected<br />
Assets of principal plans:<br />
Equities 10 274 – 7.8% 9 670 – 7.4% 8 050 – 7.9%<br />
B<strong>on</strong>ds 3 946 – 4.9% 3 854 – 4.2% 3 154 – 4.5%<br />
Property 1 421 – 6.3% 1 326 – 5.8% 1 229 – 6.3%<br />
Other 1 221 – 6.3% 752 – 6.1% 684 – 6.1%<br />
Assets of other plans 403 13 7.3% 387 17 6.9% 288 14 7.2%<br />
17 265 13 15 989 17 13 405 14<br />
Present value of liabilities:<br />
Principal plans (18 711) – (19 081) – (16 528) –<br />
Other plans (722) (925) (1 059) (1 306) (1 070) (1 175)<br />
(19 433) (925) (20 140) (1 306) (17 598) (1 175)<br />
Aggregate net deficit of the plans (2 168) (912) (4 151) (1 289) (4 193) (1 161)<br />
Irrecoverable surplus (a) – – (141) – (100) –<br />
Pensi<strong>on</strong> liability net of assets (2 168) (912) (4 292) (1 289) (4 293) (1 161)<br />
Of which in respect of<br />
Funded plans in surplus:<br />
Liabilities (5 200) – (4 728) – (4 176) –<br />
Assets 6 897 – 5 905 – 4 901 –<br />
Aggregate surplus 1 697 – 1 177 – 725 –<br />
Irrecoverable surplus (a) – – (141) – (100) –<br />
Pensi<strong>on</strong> asset net of liabilities<br />
Funded plans in deficit:<br />
1 697 – 1 036 – 625 –<br />
Liabilities (11 716) (44) (12 444) (72) (10 795) (62)<br />
Assets 10 368 13 10 084 17 8 504 14<br />
Pensi<strong>on</strong> liability net of assets (1 348) (31) (2 360) (55) (2 291) (48)<br />
Unfunded plans:<br />
Pensi<strong>on</strong> liability (2 517) (881) (2 968) (1 234) (2 627) (1 113)<br />
(a) The surplus in the plans is recoverable to the extent that the Group is able to benefit from either refunds or future c<strong>on</strong>tributi<strong>on</strong> reducti<strong>on</strong>s.<br />
The c<strong>on</strong>stituents of the ‘Principal plans’ have been extended during <strong>2006</strong>, such that some plans have been moved from ‘Other plans’ into<br />
‘Principal plans’.<br />
Equity securities include <strong>Unilever</strong> securities amounting to €32 milli<strong>on</strong> (0.2% of total plan assets) and €34 milli<strong>on</strong> (0.2% of total plan assets)<br />
at 31 December <strong>2006</strong> and 2005 respectively. Property includes property occupied by <strong>Unilever</strong> amounting to €75 milli<strong>on</strong> and €73 milli<strong>on</strong> at<br />
31 December <strong>2006</strong> and 2005 respectively.<br />
The pensi<strong>on</strong> assets above exclude the assets in a Special Benefits Trust amounting to €181 milli<strong>on</strong> (2005: €197 milli<strong>on</strong>) to fund pensi<strong>on</strong> and<br />
similar obligati<strong>on</strong>s in the US (see also note 11 <strong>on</strong> page 92).<br />
The sensitivity of the overall pensi<strong>on</strong> liabilities to changes in the weighted key financial assumpti<strong>on</strong>s are:<br />
Impact <strong>on</strong><br />
Change in overall<br />
assumpti<strong>on</strong> liabilities<br />
Discount rate Increase/decrease by 0.5% Decrease/increase by 6.8%<br />
Inflati<strong>on</strong> rate Increase/decrease by 0.5% Increase/decrease by 5.6%<br />
<strong>Unilever</strong> <str<strong>on</strong>g>Annual</str<strong>on</strong>g> Report <strong>on</strong> Form 20-F <strong>2006</strong> 105<br />
Financial Statements (c<strong>on</strong>tinued)
Financial Statements (c<strong>on</strong>tinued)<br />
Notes to the c<strong>on</strong>solidated accounts <strong>Unilever</strong> Group<br />
20 Pensi<strong>on</strong>s and similar obligati<strong>on</strong>s (c<strong>on</strong>tinued)<br />
Income statement<br />
The charge to the income statement comprises:<br />
106 <strong>Unilever</strong> <str<strong>on</strong>g>Annual</str<strong>on</strong>g> Report <strong>on</strong> Form 20-F <strong>2006</strong><br />
€ milli<strong>on</strong> € milli<strong>on</strong> € milli<strong>on</strong><br />
<strong>2006</strong> 2005 2004<br />
Charged to operating profit:<br />
Defined benefit pensi<strong>on</strong> and other benefit plans<br />
Current service cost (369) (349) (327)<br />
Employee c<strong>on</strong>tributi<strong>on</strong>s 13 18 31<br />
Special terminati<strong>on</strong> benefits (56) (73) (133)<br />
Past service cost 293 (12) (11)<br />
Settlements/curtailments 48 95 60<br />
Defined c<strong>on</strong>tributi<strong>on</strong> plans (61) (63) (65)<br />
Total operating cost (132) (384) (445)<br />
Charged to other finance income/(cost):<br />
Interest <strong>on</strong> retirement benefits (977) (984) (972)<br />
Expected return <strong>on</strong> assets 1 018 931 918<br />
Total other finance income/(cost) 41 (53) (54)<br />
Net impact <strong>on</strong> the income statement (before tax) (91) (437) (499)<br />
Cash flow<br />
Group cash flow in respect of pensi<strong>on</strong>s and similar benefits comprises company c<strong>on</strong>tributi<strong>on</strong>s paid to funded plans and benefits paid by the<br />
company in respect of unfunded plans. In <strong>2006</strong>, the benefits paid in respect of unfunded plans amounted to €333 milli<strong>on</strong> (2005: €328 milli<strong>on</strong>;<br />
2004: €324 milli<strong>on</strong>). Company c<strong>on</strong>tributi<strong>on</strong>s to funded defined benefit plans are subject to periodic review, taking account of local legislati<strong>on</strong>.<br />
In <strong>2006</strong>, c<strong>on</strong>tributi<strong>on</strong>s to funded defined benefit plans amounted to €758 milli<strong>on</strong> (2005: €508 milli<strong>on</strong>; 2004: €462 milli<strong>on</strong>). C<strong>on</strong>tributi<strong>on</strong>s to<br />
defined c<strong>on</strong>tributi<strong>on</strong> plans including 401k plans amounted to €61 milli<strong>on</strong> (2005: €63 milli<strong>on</strong>; 2004: €65 milli<strong>on</strong>). In 2005, a €15 milli<strong>on</strong> refund<br />
of assets was received out of unrecognised surplus from Finland. Total c<strong>on</strong>tributi<strong>on</strong>s by the Group to funded plans, net of refunds, are currently<br />
expected to be €371 milli<strong>on</strong> in 2007 (<strong>2006</strong> Actual: €758 milli<strong>on</strong>). Benefit payments by the Group in respect of unfunded plans are currently<br />
expected to be about €341 milli<strong>on</strong> in 2007 (<strong>2006</strong> Actual: €333 milli<strong>on</strong>).<br />
Statement of recognised income and expense<br />
Amounts recognised in the statement of recognised income and expense:<br />
€ milli<strong>on</strong> € milli<strong>on</strong> € milli<strong>on</strong> € milli<strong>on</strong><br />
Cumulative<br />
since<br />
1 January<br />
<strong>2006</strong> 2005 2004 2004<br />
Actual return less expected return <strong>on</strong> pensi<strong>on</strong> and other benefit plan assets 533 1 592 369 2 494<br />
Experience gains/(losses) arising <strong>on</strong> pensi<strong>on</strong> plan and other benefit plan liabilities 51 27 (47) 31<br />
Changes in assumpti<strong>on</strong>s underlying the present value of the pensi<strong>on</strong> and other benefit<br />
plan liabilities 474 (1 706) (1 047) (2 279)<br />
Actuarial gain/(loss) 1 058 (87) (725) 246<br />
Change in unrecognised surplus 142 (41) 2 103<br />
Refund of unrecognised assets – 15 – 15<br />
Net actuarial gain/(loss) recognised in statement of recognised income and expense (before tax) 1 200 (113) (723) 364
Notes to the c<strong>on</strong>solidated accounts <strong>Unilever</strong> Group<br />
20 Pensi<strong>on</strong>s and similar obligati<strong>on</strong>s (c<strong>on</strong>tinued)<br />
Rec<strong>on</strong>ciliati<strong>on</strong> of change in assets and liabilities<br />
Movements in assets and liabilities during the year:<br />
€ milli<strong>on</strong> € milli<strong>on</strong> € milli<strong>on</strong> € milli<strong>on</strong> € milli<strong>on</strong> € milli<strong>on</strong><br />
Assets Assets Assets Liabilities Liabilities Liabilities<br />
<strong>2006</strong> 2005 2004 <strong>2006</strong> 2005 2004<br />
1 January 16 006 13 419 12 819 (21 446) (18 773) (17 880)<br />
Acquisiti<strong>on</strong>s/disposals (63) (3) – 123 18 (6)<br />
Current service cost – – – (384) (367) (344)<br />
Employee c<strong>on</strong>tributi<strong>on</strong>s 14 19 32 – – –<br />
Special terminati<strong>on</strong> benefits – – – (54) (79) (135)<br />
Past service costs (b) – – – 293 (13) (13)<br />
Settlements/curtailments (17) (10) (23) 76 105 85<br />
Other finance income 1 021 931 918 – – –<br />
Other finance cost – – – (982) (986) (976)<br />
Actuarial gain/(loss) 533 1 592 369 525 (1 679) (1 094)<br />
Employer c<strong>on</strong>tributi<strong>on</strong>s 1 091 836 786 – – –<br />
Benefit payments (1 267) (1 247) (1 223) 1 267 1 247 1 223<br />
Reclassificati<strong>on</strong> of benefits (c) 38 39 (166) (32) (140) 166<br />
Currency retranslati<strong>on</strong> (78) 430 (93) 256 (779) 201<br />
31 December 17 278 16 006 13 419 (20 358) (21 446) (18 773)<br />
(b) The reducti<strong>on</strong> in liabilities in <strong>2006</strong> includes the €266 milli<strong>on</strong> <str<strong>on</strong>g>report</str<strong>on</strong>g>ed <strong>on</strong> the face of the income statement.<br />
(c) During 2004 some plans changed from defined benefit to defined c<strong>on</strong>tributi<strong>on</strong>. During 2005 certain obligati<strong>on</strong>s were reclassified as<br />
employee benefit obligati<strong>on</strong>s.<br />
History of experience gains and losses<br />
€ milli<strong>on</strong> € milli<strong>on</strong> € milli<strong>on</strong><br />
<strong>2006</strong> 2005 2004<br />
Actual return less expected return <strong>on</strong> plan assets (€ milli<strong>on</strong>) 533 1 592 369<br />
As % of plan assets at beginning of year 3.3% 11.9% 2.9%<br />
Experience gains/(losses) <strong>on</strong> plan liabilities (€ milli<strong>on</strong>) 51 27 (47)<br />
As % of present value of plan liabilities at beginning of year<br />
Changes in actuarial assumpti<strong>on</strong>s underlying the present value of the<br />
0.2% 0.1% (0.3)%<br />
pensi<strong>on</strong> benefit and other benefit plan liabilities (€ milli<strong>on</strong>) 474 (1 706) (1 047)<br />
As % of present value of plan liabilities at beginning of year 2.2% (9.1)% (5.9)%<br />
Total actuarial gain/(loss) (€ milli<strong>on</strong>) 1 058 (87) (725)<br />
As % of present value of plan liabilities at beginning of year 4.9% (0.5)% (4.1)%<br />
US GAAP disclosures<br />
Disclosures required for the <str<strong>on</strong>g>report</str<strong>on</strong>g>ing of pensi<strong>on</strong>s and similar obligati<strong>on</strong>s under US GAAP are set out in note 34 <strong>on</strong> pages 126 to 130.<br />
<strong>Unilever</strong> <str<strong>on</strong>g>Annual</str<strong>on</strong>g> Report <strong>on</strong> Form 20-F <strong>2006</strong> 107<br />
Financial Statements (c<strong>on</strong>tinued)
Financial Statements (c<strong>on</strong>tinued)<br />
Notes to the c<strong>on</strong>solidated accounts <strong>Unilever</strong> Group<br />
21 Equity<br />
108 <strong>Unilever</strong> <str<strong>on</strong>g>Annual</str<strong>on</strong>g> Report <strong>on</strong> Form 20-F <strong>2006</strong><br />
Shareholders’ equity Total equity<br />
€ milli<strong>on</strong> € milli<strong>on</strong> € milli<strong>on</strong> € milli<strong>on</strong> € milli<strong>on</strong> € milli<strong>on</strong> € milli<strong>on</strong><br />
Called up Share Total<br />
share premium Other Retained shareholders’ Minority Total<br />
C<strong>on</strong>solidated statement of changes in equity capital account reserves profit equity interests equity<br />
1 January 2004 642 1 530 (2 442) 7 006 6 736 439 7 175<br />
Total recognised income and expense for the year – – 218 2 156 2 374 167 2 541<br />
Preference dividends – – – (28) (28) – (28)<br />
Final dividends 2003 <strong>on</strong> ordinary capital – – – (1 116) (1 116) – (1 116)<br />
Interim dividends 2004 <strong>on</strong> ordinary capital – – – (603) (603) – (603)<br />
(Purchase)/sale/reducti<strong>on</strong> of treasury stock – – (331) 7 (324) – (324)<br />
Share-based payment credit (a) – – – 222 222 – 222<br />
Dividends paid to minority shareholders – – – – – (203) (203)<br />
Currency retranslati<strong>on</strong> gains/(losses) net of tax – – – 1 1 (6) (5)<br />
Other movements in equity – – – 2 2 (32) (30)<br />
31 December 2004 642 1 530 (2 555) 7 647 7 264 365 7 629<br />
Accounting policy change – preference shares (b) (130) (1 372) – – (1 502) – (1 502)<br />
Accounting policy change – other financial instruments (b) – – (19) 407 388 – 388<br />
Equity as restated at 1 January 2005 512 158 (2 574) 8 054 6 150 365 6 515<br />
Total recognised income and expense for the year – – 379 3 825 4 204 249 4 453<br />
Final dividends 2004 <strong>on</strong> ordinary capital – – – (1 229) (1 229) – (1 229)<br />
Interim dividends 2005 <strong>on</strong> ordinary capital – – – (638) (638) – (638)<br />
C<strong>on</strong>versi<strong>on</strong> of preference shares – – 1 129 (199) 930 – 930<br />
(Purchase)/sale/reducti<strong>on</strong> of treasury stock – – (1 262) – (1 262) – (1 262)<br />
Share-based payment credit (a) – – – 186 186 – 186<br />
Dividends paid to minority shareholders – – – – – (217) (217)<br />
Currency retranslati<strong>on</strong> gains/(losses) net of tax – 4 – – 4 9 13<br />
Other movements in equity – – – 16 16 (2) 14<br />
31 December 2005 512 162 (2 328) 10 015 8 361 404 8 765<br />
Total recognised income and expense for the year – – (263) 5 575 5 312 242 5 554<br />
Final dividends 2005 <strong>on</strong> ordinary capital – – – (1 269) (1 269) – (1 269)<br />
Interim dividends <strong>2006</strong> <strong>on</strong> ordinary capital – – – (664) (664) – (664)<br />
One-off dividend – – – (751) (751) – (751)<br />
(Purchase)/sale/reducti<strong>on</strong> of treasury stock (c) – – 403 (285) 118 – 118<br />
Share-based payment credit (a) – – – 111 111 – 111<br />
Dividends paid to minority shareholders – – – – – (184) (184)<br />
Currency retranslati<strong>on</strong> gains/(losses) net of tax (12) 3 14 – 5 (11) (6)<br />
Other movements in equity (16) – 31 (8) 7 (9) (2)<br />
31 December <strong>2006</strong> 484 165 (2 143) 12 724 11 230 442 11 672<br />
(a) The share-based payment credit relates to the reversal of the n<strong>on</strong>-cash charge recorded against operating profit in respect of the fair value<br />
of share opti<strong>on</strong>s and awards granted to employees.<br />
(b) From 1 January 2005, <strong>Unilever</strong> adopted IAS 32 ‘Financial Instruments: Disclosure and Presentati<strong>on</strong>’ and IAS 39 ‘Financial Instruments:<br />
Recogniti<strong>on</strong> and Measurement’.<br />
(c) Includes transfer from treasury stock to retained profit of share settled schemes arising from prior years and differences between exercise<br />
and grant price of share opti<strong>on</strong>s.
Notes to the c<strong>on</strong>solidated accounts <strong>Unilever</strong> Group<br />
22 Share capital<br />
€ milli<strong>on</strong> € milli<strong>on</strong><br />
Called up share capital <strong>2006</strong> 2005<br />
Ordinary share capital of NV 274 290<br />
Ordinary share capital of PLC 210 222<br />
484 512<br />
Issued, Issued,<br />
Number Nominal Number called up and called up and<br />
of shares Authorised Authorised value of shares fully paid fully paid<br />
Ordinary share capital authorised <strong>2006</strong> 2005 per share issued <strong>2006</strong> 2005<br />
€ milli<strong>on</strong> € milli<strong>on</strong> € milli<strong>on</strong> € milli<strong>on</strong><br />
NV ordinary shares 3 000 000 000 480 508 €0.16 1 714 727 700 274 290<br />
NV ordinary shares (shares numbered<br />
1 to 2 400 – ’Special Shares’) 1 1 €428.57 2 400 1 1<br />
Internal holdings eliminated<br />
<strong>on</strong> c<strong>on</strong>solidati<strong>on</strong> (€428.57 shares) – – (1) (1)<br />
481 509 274 290<br />
£ milli<strong>on</strong> £ milli<strong>on</strong> £ milli<strong>on</strong> £ milli<strong>on</strong><br />
PLC ordinary shares 4 377 075 492 136.2 136.2 3 1 ⁄9p 1 310 156 361 40.8 40.8<br />
PLC deferred stock 100 000 0.1 0.1 £1 stock 100 000 0.1 0.1<br />
Internal holding eliminated<br />
<strong>on</strong> c<strong>on</strong>solidati<strong>on</strong> (£1 stock) – – (0.1) (0.1)<br />
136.3 136.3 40.8 40.8<br />
Euro equivalent in milli<strong>on</strong>s (at £1.00 = €5.143) (2005: £1.00 = €5.445) 210 222<br />
For in<strong>form</strong>ati<strong>on</strong> <strong>on</strong> the rights of shareholders of NV and PLC and the operati<strong>on</strong> of the Equalisati<strong>on</strong> Agreement, see Corporate governance <strong>on</strong><br />
pages 39 to 40.<br />
At the <str<strong>on</strong>g>Annual</str<strong>on</strong>g> General Meetings of NV and PLC held <strong>on</strong> 8 May and 9 May <strong>2006</strong> respectively, shareholders approved proposals that the NV<br />
ordinary shares be split in the ratio 3 to 1 and that the PLC ordinary shares be c<strong>on</strong>solidated in the ratio 9 to 20. At the same time, amendments<br />
were made to NV’s Articles of Associati<strong>on</strong> to c<strong>on</strong>vert into euros the share capital amounts previously denominated in Dutch guilders. Following<br />
these changes, which became effective <strong>on</strong> 22 May <strong>2006</strong>, the nominal value of each NV ordinary share is €0.16 and the nominal value of each<br />
PLC ordinary share is 3 1 ⁄9p. In the case of the NV ordinary shares, the new nominal value per share does not, for reas<strong>on</strong>s of rounding, equate<br />
exactly to the equivalent value expressed in Dutch guilders. As a result, the <str<strong>on</strong>g>report</str<strong>on</strong>g>ed share capital issued at 31 December <strong>2006</strong> is €16 milli<strong>on</strong><br />
lower than in 2005, with a corresp<strong>on</strong>ding amount being included in other reserves (see note 23 <strong>on</strong> page 110). In the case of the PLC ordinary<br />
shares, the euro c<strong>on</strong>versi<strong>on</strong> rate is now £1.00 = €5.143. As at 31 December 2005 when the NV shares were denominated in Dutch guilders,<br />
the effective rate of exchange was £1.00 = €5.445. This rate change results in a reducti<strong>on</strong> in the euro equivalent of €12 milli<strong>on</strong> with a<br />
corresp<strong>on</strong>ding amount being included in other reserves (see note 23 <strong>on</strong> page 110). A nominal dividend of 6% is paid <strong>on</strong> the deferred stock<br />
of PLC, which is not redeemable.<br />
Internal holdings<br />
The ordinary shares numbered 1 to 2 400 (inclusive) in NV (‘Special Shares’) and deferred stock of PLC are held as to <strong>on</strong>e half of each class by<br />
N.V. Elma – a subsidiary of NV – and <strong>on</strong>e half by United Holdings Limited – a subsidiary of PLC. This capital is eliminated <strong>on</strong> c<strong>on</strong>solidati<strong>on</strong>. It<br />
carried the right to nominate pers<strong>on</strong>s for electi<strong>on</strong> as Directors at general meetings of shareholders. At NV’s AGM held <strong>on</strong> 8 May <strong>2006</strong> and at<br />
PLC’s AGM held <strong>on</strong> 9 May <strong>2006</strong> it was decided to aband<strong>on</strong> this right. Accordingly, NV’s and PLC’s Articles of Associati<strong>on</strong> were amended so<br />
that for an alterati<strong>on</strong> of the provisi<strong>on</strong>s within them relating to the unity of management between NV and PLC, prior approval is required from<br />
meetings of the holders of the NV Special Shares and the PLC Deferred Stock. The subsidiaries menti<strong>on</strong>ed above have waived their rights to<br />
dividends <strong>on</strong> their ordinary shares in NV.<br />
Share-based compensati<strong>on</strong><br />
The Group operates a number of share-based compensati<strong>on</strong> plans involving opti<strong>on</strong>s and awards of ordinary shares of NV and PLC. Full details<br />
of these plans are given in note 29 <strong>on</strong> pages 117 to 121.<br />
<strong>Unilever</strong> <str<strong>on</strong>g>Annual</str<strong>on</strong>g> Report <strong>on</strong> Form 20-F <strong>2006</strong> 109<br />
Financial Statements (c<strong>on</strong>tinued)
Financial Statements (c<strong>on</strong>tinued)<br />
Notes to the c<strong>on</strong>solidated accounts <strong>Unilever</strong> Group<br />
23 Other reserves<br />
110 <strong>Unilever</strong> <str<strong>on</strong>g>Annual</str<strong>on</strong>g> Report <strong>on</strong> Form 20-F <strong>2006</strong><br />
€ milli<strong>on</strong> € milli<strong>on</strong> € milli<strong>on</strong> € milli<strong>on</strong> € milli<strong>on</strong> € milli<strong>on</strong> € milli<strong>on</strong> € milli<strong>on</strong> € milli<strong>on</strong><br />
NV NV NV PLC PLC PLC Total Total Total<br />
<strong>2006</strong> 2005 2004 <strong>2006</strong> 2005 2004 <strong>2006</strong> 2005 2004<br />
Fair value reserves 9 (3) n/a 7 (2) n/a 16 (5) n/a<br />
Cash flow hedges 4 (3) n/a (3) (2) n/a 1 (5) n/a<br />
Available-for-sale financial assets 5 – n/a 10 – n/a 15 – n/a<br />
Currency retranslati<strong>on</strong> of group companies<br />
Adjustment <strong>on</strong> translati<strong>on</strong> of PLC’s ordinary<br />
318 548 160 (19) 35 58 299 583 218<br />
capital at 31 ⁄ 9p = €0.16 – – – (150) (164) (164) (150) (164) (164)<br />
Capital redempti<strong>on</strong> reserve 16 – – 16 16 16 32 16 16<br />
Book value treasury stock (1 623) (2 010) (2 065) (717) (748) (560) (2 340) (2 758) (2 625)<br />
(1 280) (1 465) (1 905) (863) (863) (650) (2 143) (2 328) (2 555)<br />
€ milli<strong>on</strong> € milli<strong>on</strong><br />
Cash flow hedges – movements during the year <strong>2006</strong> 2005<br />
1 January (5) (19)<br />
Additi<strong>on</strong>s 12 9<br />
Transfers to income statement (4) 1<br />
Transfers to inventories/n<strong>on</strong>-current assets (2) 4<br />
31 December 1 (5)<br />
<strong>Unilever</strong> acquired 3 010 666 ordinary shares of NV and 3 010 465 ordinary shares of PLC through purchases <strong>on</strong> the stock exchanges during<br />
the year. These shares are held as treasury stock as a separate comp<strong>on</strong>ent of other reserves. The total number held at 31 December <strong>2006</strong> is<br />
70 319 259 (2005: 74 179 011) NV shares and 64 656 456 (2005: 71 332 301) PLC shares. Of these, 55 514 379 NV shares and 53 100 244<br />
PLC shares were held in c<strong>on</strong>necti<strong>on</strong> with share-based compensati<strong>on</strong> plans (see note 29 <strong>on</strong> pages 117 to 121).<br />
€ milli<strong>on</strong> € milli<strong>on</strong><br />
Treasury stock – movements during the year <strong>2006</strong> 2005<br />
1 January (2 758) (2 625)<br />
Utilised for preference shares c<strong>on</strong>versi<strong>on</strong> at average book value – 1 129<br />
Purchases and other utilisati<strong>on</strong>s 418 (1 262)<br />
31 December (2 340) (2 758)<br />
€ milli<strong>on</strong> € milli<strong>on</strong><br />
Currency retranslati<strong>on</strong> reserve – movements during the year <strong>2006</strong> 2005<br />
1 January 583 218<br />
Currency retranslati<strong>on</strong> during the year 495 92<br />
Movement in net investment hedges (779) 332<br />
Recycled to income statement – (59)<br />
31 December 299 583
Notes to the c<strong>on</strong>solidated accounts <strong>Unilever</strong> Group<br />
24 Retained profit<br />
€ milli<strong>on</strong> € milli<strong>on</strong> € milli<strong>on</strong> € milli<strong>on</strong> € milli<strong>on</strong> € milli<strong>on</strong> € milli<strong>on</strong> € milli<strong>on</strong> € milli<strong>on</strong><br />
NV NV NV PLC PLC PLC Total Total Total<br />
Movements during the year <strong>2006</strong> 2005 2004 <strong>2006</strong> 2005 2004 <strong>2006</strong> 2005 2004<br />
31 December 2004 8 331 (684) 7 647<br />
Accounting policy change for<br />
financial instruments (a) (1 500) 1 907 407<br />
1 January<br />
Recognised income and expense through<br />
8 721 6 831 7 321 1 294 1 223 (315) 10 015 8 054 7 006<br />
retained profit 3 727 3 092 1 520 1 848 733 636 5 575 3 825 2 156<br />
Preference dividends (b) – – (28) – – – – – (28)<br />
Final dividends 2003 <strong>on</strong> ordinary capital – – (630) – – (486) – – (1 116)<br />
Interim dividends 2004 <strong>on</strong> ordinary capital – – (343) – – (260) – – (603)<br />
Final dividends 2004 <strong>on</strong> ordinary capital – (710) – – (519) – – (1 229) –<br />
Interim dividends 2005 <strong>on</strong> ordinary capital – (363) – – (275) – – (638) –<br />
Final dividends 2005 <strong>on</strong> ordinary capital (722) – – (547) – – (1 269) – –<br />
Interim dividends <strong>2006</strong> <strong>on</strong> ordinary capital (379) – – (285) – – (664) – –<br />
One-off dividend (428) – – (323) – – (751) – –<br />
C<strong>on</strong>versi<strong>on</strong> of preference shares – (199) – – – – – (199) –<br />
Utilisati<strong>on</strong> of treasury stock (217) – 7 (68) – – (285) – 7<br />
Share-based compensati<strong>on</strong> credit (c) Adjustment arising from change in structure<br />
70 132 152 41 54 70 111 186 222<br />
of group companies (d) (2 368) (70) 332 2 368 70 (332) – – –<br />
Other movements in retained profit – 8 – (8) 8 3 (8) 16 3<br />
31 December<br />
Of which retained by:<br />
8 404 8 721 8 331 4 320 1 294 (684) 12 724 10 015 7 647<br />
Parent companies 9 755 9 463 7 693 2 306 2 145 1 553 12 061 11 608 9 246<br />
Other group companies (1 294) (668) 731 2 006 (837) (2 235) 712 (1 505) (1 504)<br />
Joint ventures and associates (57) (74) (93) 8 (14) (2) (49) (88) (95)<br />
8 404 8 721 8 331 4 320 1 294 (684) 12 724 10 015 7 647<br />
(a) Due to the adopti<strong>on</strong> of IAS 32 and IAS 39 with effect from 1 January 2005, intra-group preference shares are now classified as debt<br />
instead of equity. The relative ownership of these preference shares has resulted in a realignment of balances between NV and PLC.<br />
(b) From 1 January 2005, <strong>Unilever</strong> adopted IAS 32 which requires preference shares that provide for a fixed preference dividend to be classified<br />
as borrowings and preference dividends to be recognised in the income statement. In accordance with the transiti<strong>on</strong> rules for IAS 32, 2004<br />
was not restated.<br />
(c) The share-based compensati<strong>on</strong> credit relates to the reversal of the n<strong>on</strong>-cash charge recorded against operating profit in respect of the fair<br />
value of share opti<strong>on</strong>s and awards granted to employees.<br />
(d) As part of the review of <strong>Unilever</strong>'s corporate structure, and in the light of the c<strong>on</strong>stituti<strong>on</strong>al and operati<strong>on</strong>al arrangements which enable<br />
<strong>Unilever</strong> N.V. and <strong>Unilever</strong> PLC to operate as nearly as practicable as a single company, the Directors have been authorised to take any<br />
acti<strong>on</strong> necessary or desirable in order to ensure that the ratio of the dividend generating capacity of <strong>Unilever</strong> PLC to that of <strong>Unilever</strong> N.V.<br />
does not differ substantially from the ratio of the dividend entitlement of ordinary shareholders in <strong>Unilever</strong> PLC to that of ordinary<br />
shareholders in <strong>Unilever</strong> N.V. Therefore, in <strong>2006</strong>, shareholdings in the <strong>Unilever</strong> companies in Czech Republic, Hungary, Russia and Turkey,<br />
as well as a part of indirect shareholdings in <strong>Unilever</strong> US, have been transferred from <strong>Unilever</strong> N.V. to <strong>Unilever</strong> PLC for no c<strong>on</strong>siderati<strong>on</strong>.<br />
In additi<strong>on</strong>, part of a dividend which would otherwise be due from a <strong>Unilever</strong> US intermediate company to a company within the<br />
<strong>Unilever</strong> N.V. part of the Group has instead been paid to a company within the <strong>Unilever</strong> PLC part of the Group. Re-organisati<strong>on</strong>s of<br />
group companies have produced similar types of adjustments in previous years.<br />
Cumulative goodwill written off directly to reserves prior to the transiti<strong>on</strong> to IFRS <strong>on</strong> 1 January 2004 was €5 199 milli<strong>on</strong> for NV and<br />
€2 063 milli<strong>on</strong> for PLC.<br />
<strong>Unilever</strong> <str<strong>on</strong>g>Annual</str<strong>on</strong>g> Report <strong>on</strong> Form 20-F <strong>2006</strong> 111<br />
Financial Statements (c<strong>on</strong>tinued)
Financial Statements (c<strong>on</strong>tinued)<br />
Notes to the c<strong>on</strong>solidated accounts <strong>Unilever</strong> Group<br />
25 Commitments and c<strong>on</strong>tingent liabilities<br />
€ milli<strong>on</strong> € milli<strong>on</strong> € milli<strong>on</strong> € milli<strong>on</strong> € milli<strong>on</strong> € milli<strong>on</strong><br />
Future Future<br />
minimum minimum<br />
lease Finance Present lease Finance Present<br />
payments cost value payments cost value<br />
L<strong>on</strong>g-term finance lease commitments <strong>2006</strong> <strong>2006</strong> <strong>2006</strong> 2005 2005 2005<br />
Buildings (a) 137 94 43 160 95 65<br />
Plant and machinery 159 15 144 170 18 152<br />
112 <strong>Unilever</strong> <str<strong>on</strong>g>Annual</str<strong>on</strong>g> Report <strong>on</strong> Form 20-F <strong>2006</strong><br />
296 109 187 330 113 217<br />
The commitments fall due as follows:<br />
Within 1 year 71 10 61 75 11 64<br />
After 1 year but within 2 years 68 8 60 60 10 50<br />
After 2 years but within 3 years 22 6 16 56 6 50<br />
After 3 years but within 4 years 17 6 11 14 6 8<br />
After 4 years but within 5 years 10 5 5 13 6 7<br />
After 5 years 108 74 34 112 74 38<br />
(a) All leased land is classified as operating leases.<br />
296 109 187 330 113 217<br />
€ milli<strong>on</strong> € milli<strong>on</strong><br />
L<strong>on</strong>g-term operating lease commitments <strong>2006</strong> 2005<br />
Land and buildings 1 257 1 472<br />
Plant and machinery 360 459<br />
1 617 1 931<br />
€ milli<strong>on</strong> € milli<strong>on</strong> € milli<strong>on</strong> € milli<strong>on</strong><br />
Other Other<br />
Operating Operating commit- commitleases<br />
leases ments ments<br />
Operating lease and other commitments fall due as follows <strong>2006</strong> 2005 <strong>2006</strong> 2005<br />
Within 1 year 342 339 471 365<br />
After 1 year but within 2 years 294 297 261 323<br />
After 2 years but within 3 years 243 267 192 62<br />
After 3 years but within 4 years 182 222 175 40<br />
After 4 years but within 5 years 156 209 153 23<br />
After 5 years 400 597 528 18<br />
1 617 1 931 1 780 831<br />
The Group has sublet part of the leased properties under operating leases. Future minimum sublease payments of €16 milli<strong>on</strong> are expected to<br />
be received.<br />
Other commitments principally comprise commitments under c<strong>on</strong>tracts to purchase materials and services. They do not include commitments<br />
for capital expenditure, which are <str<strong>on</strong>g>report</str<strong>on</strong>g>ed in note 10 <strong>on</strong> page 90. The increase in other commitments as at 31 December <strong>2006</strong> is due to<br />
outsourcing initiatives.<br />
C<strong>on</strong>tingent liabilities are either possible obligati<strong>on</strong>s that will probably not require a transfer of ec<strong>on</strong>omic benefits, or present obligati<strong>on</strong>s that<br />
may, but probably will not, require a transfer of ec<strong>on</strong>omic benefits. It is not appropriate to make provisi<strong>on</strong>s for c<strong>on</strong>tingent liabilities, but there<br />
is a chance that they will turn into an obligati<strong>on</strong> in the future. The Group believes that incurred losses in any of these matters would not have<br />
a material effect.<br />
Examples of the first type of c<strong>on</strong>tingent liability arise in respect of litigati<strong>on</strong> against group companies, investigati<strong>on</strong>s by competiti<strong>on</strong>, regulatory<br />
and fiscal authorities and obligati<strong>on</strong>s arising under envir<strong>on</strong>mental legislati<strong>on</strong>. The estimated total of such c<strong>on</strong>tingent liabilities at 31 December<br />
<strong>2006</strong> was some €439 milli<strong>on</strong> (2005: €349 milli<strong>on</strong>). This includes amounts relating to some of the legal proceedings menti<strong>on</strong>ed <strong>on</strong> page 8.<br />
Examples of the sec<strong>on</strong>d type of c<strong>on</strong>tingent liability are guarantees issued by group companies. At 31 December <strong>2006</strong> these amounted to<br />
some €105 milli<strong>on</strong> (2005: €113 milli<strong>on</strong>). Included in this are discounted trade bills with a value of €23 milli<strong>on</strong> (2005: €25 milli<strong>on</strong>). We believe<br />
that any loss arising in c<strong>on</strong>necti<strong>on</strong> with these would not have a material effect <strong>on</strong> the Group’s financial c<strong>on</strong>diti<strong>on</strong> or results of operati<strong>on</strong>s.<br />
Guarantees given by parent or group companies that relate to liabilities already included in these c<strong>on</strong>solidated accounts are excluded from<br />
this total.<br />
The total value of guarantees which arose or were revised in <strong>2006</strong> was €41 milli<strong>on</strong> (2005: €39 milli<strong>on</strong>). The fair value of guarantees is not<br />
material in either 2005 or <strong>2006</strong>.
Notes to the c<strong>on</strong>solidated accounts <strong>Unilever</strong> Group<br />
26 Acquisiti<strong>on</strong>s and disposals<br />
Acquisiti<strong>on</strong>s<br />
During <strong>2006</strong> we purchased minority interests in subsidiary companies in Greece and Algeria, trademarks in Czech Republic, distributi<strong>on</strong> in<br />
Tunisia and Vashisti business in India. Also an additi<strong>on</strong>al investment into Langholm Capital Partners Fund was made and classified as an<br />
acquisiti<strong>on</strong> of associates (see note 11 <strong>on</strong> page 92).<br />
The following table sets out the effect of acquisiti<strong>on</strong>s of group companies in <strong>2006</strong>, 2005 and 2004 <strong>on</strong> the c<strong>on</strong>solidated balance sheet. The fair<br />
values currently established for all acquisiti<strong>on</strong>s made in <strong>2006</strong> are provisi<strong>on</strong>al. The goodwill arising <strong>on</strong> these transacti<strong>on</strong>s has been capitalised<br />
and is subject to an annual review for impairment (or more frequently if necessary) in accordance with our accounting policies as set out in<br />
note 1 <strong>on</strong> page 74. Any impairment is charged to the income statement as it arises. Detailed in<strong>form</strong>ati<strong>on</strong> relating to goodwill is given in note 9<br />
<strong>on</strong> pages 88 and 89.<br />
€ milli<strong>on</strong> € milli<strong>on</strong> € milli<strong>on</strong><br />
Acquisiti<strong>on</strong>s <strong>2006</strong> 2005 2004<br />
Net assets acquired 42 7 33<br />
Goodwill arising in subsidiaries 60 13 7<br />
C<strong>on</strong>siderati<strong>on</strong> 102 20 40<br />
C<strong>on</strong>siderati<strong>on</strong> c<strong>on</strong>sisted wholly of cash.<br />
Disposals<br />
The results of disposed businesses are included in the c<strong>on</strong>solidated accounts up to their date of disposal.<br />
On 3 November <strong>2006</strong>, <strong>Unilever</strong> announced that it had reached a final agreement with Permira Funds to sell the majority of its European frozen<br />
foods business for €1.7 billi<strong>on</strong>. The <strong>Unilever</strong> businesses being sold in this transacti<strong>on</strong> include the frozen foods operati<strong>on</strong>s in Austria, Belgium,<br />
France, Germany, Ireland, Netherlands, Portugal and United Kingdom.<br />
Other disposals in <strong>2006</strong> were Mora in the Netherlands and Belgium, Finesse in the US, Canada and Sweden, Friol in Italy and Nihar and<br />
tea plantati<strong>on</strong>s in India.<br />
The principal disposals in 2005 were UCI across the world, Stant<strong>on</strong> Oil in UK and Ireland, Dextro in various countries in Europe, Opal in Peru,<br />
Karo and Knax in Mexico, spreads and cooking products in Australia and in New Zealand, Crispa, Mentadent, Marmite, Bovril and Maizena in<br />
South Africa, frozen pizza in Austria, Biop<strong>on</strong> in Hungary and tea plantati<strong>on</strong>s in India.<br />
In March 2005 <strong>Unilever</strong> completed the restructuring of its Portuguese foods business. Before the restructuring <strong>Unilever</strong> Portugal held an interest<br />
in FIMA/VG – Distribuição de Produtos Alimentares, Lda. (FIMA) foods business, a joint venture with Jerónimo Martins Group, in additi<strong>on</strong> to its<br />
wholly owned Bestfoods business acquired in 2000. As a result of the transacti<strong>on</strong> the two foods businesses – FIMA and <strong>Unilever</strong> Bestfoods<br />
Portugal – were unified and the joint venture stakes were re-balanced so that <strong>Unilever</strong> hold 49% of the combined foods business and Jerónimo<br />
Martins Group 51%. During the year, <strong>Unilever</strong> signed an agreement with Jerónimo Martins to restructure the ownership of the Portuguese<br />
operati<strong>on</strong>s effective 1 January 2007. Further in<strong>form</strong>ati<strong>on</strong> is provided in note 33 <strong>on</strong> page 123.<br />
In 2004, the principal disposals were Puget oils in France, the frozen pizza and baguette businesses in various countries in Europe, Rit, Niagara,<br />
Final Touch and Sunlight in North America, Capullo, Mazola and Inca in Chile and Mexico and Dalda oils in Pakistan. Our chemicals business<br />
in India (Hindustan Lever Chemicals) was merged with Tata Chemicals. Various other smaller brands were also sold as part of our Path to<br />
Growth strategy.<br />
€ milli<strong>on</strong> € milli<strong>on</strong> € milli<strong>on</strong><br />
Disposals <strong>2006</strong> 2005 2004<br />
Goodwill and intangible assets 1 150 23<br />
Other n<strong>on</strong>-current assets 242 78 52<br />
Current assets 354 207 145<br />
Trade creditors and other payables (157) (106) (34)<br />
Provisi<strong>on</strong>s for liabilities and charges (91) (15) (9)<br />
Minority interest – (1) (25)<br />
Net assets sold 349 313 152<br />
(Gain)/loss <strong>on</strong> recycling of currency retranslati<strong>on</strong> <strong>on</strong> disposal – (5) 2<br />
Profit <strong>on</strong> sale attributable to <strong>Unilever</strong> 1 528 655 338<br />
C<strong>on</strong>siderati<strong>on</strong> 1 877 963 492<br />
Cash 1 870 845 417<br />
Cash balances of businesses sold – (17) (4)<br />
Financial assets, cash deposits and borrowings of businesses sold (5) 8 39<br />
N<strong>on</strong>-cash items and deferred c<strong>on</strong>siderati<strong>on</strong> 12 26 40<br />
Payment received in prior year – 101 –<br />
<strong>Unilever</strong> <str<strong>on</strong>g>Annual</str<strong>on</strong>g> Report <strong>on</strong> Form 20-F <strong>2006</strong> 113<br />
Financial Statements (c<strong>on</strong>tinued)
Financial Statements (c<strong>on</strong>tinued)<br />
Notes to the c<strong>on</strong>solidated accounts <strong>Unilever</strong> Group<br />
27 Assets held for sale and disc<strong>on</strong>tinued operati<strong>on</strong>s<br />
Following the announcement <strong>on</strong> 9 February <strong>2006</strong> of the intenti<strong>on</strong> to dispose of the majority of <strong>Unilever</strong>’s European frozen foods businesses, the<br />
results of these businesses have been presented as disc<strong>on</strong>tinued operati<strong>on</strong>s. The sale of these businesses to Permira Funds was completed <strong>on</strong><br />
3 November <strong>2006</strong>. Also included under this heading are the results of <strong>Unilever</strong> Cosmetics Internati<strong>on</strong>al (UCI) following the sale of this business<br />
to Coty Inc. in July 2005.<br />
An analysis of the result of disc<strong>on</strong>tinued operati<strong>on</strong>s, and the result recognised <strong>on</strong> disposal of disc<strong>on</strong>tinued operati<strong>on</strong>s is as follows:<br />
€ milli<strong>on</strong> € milli<strong>on</strong> € milli<strong>on</strong><br />
Income statement of disc<strong>on</strong>tinued operati<strong>on</strong>s <strong>2006</strong> 2005 2004<br />
Turnover 1 033 1 501 1 940<br />
Expenses (863) (1 253) (1 648)<br />
Operating profit 170 248 292<br />
Net finance costs (3) (6) (7)<br />
Profit before tax 167 242 285<br />
Taxati<strong>on</strong> (25) (72) (98)<br />
Profit after taxati<strong>on</strong> 142 170 187<br />
Gain/(loss) <strong>on</strong> disposal of disc<strong>on</strong>tinued operati<strong>on</strong>s 1 349 513 39<br />
Recycling of currency retranslati<strong>on</strong> up<strong>on</strong> disposal – 5 –<br />
Taxati<strong>on</strong> arising <strong>on</strong> disposal (161) (48) (13)<br />
Gain/(loss) after taxati<strong>on</strong> <strong>on</strong> disposal 1 188 470 26<br />
Net profit from disc<strong>on</strong>tinued operati<strong>on</strong>s 1 330 640 213<br />
€ milli<strong>on</strong> € milli<strong>on</strong> € milli<strong>on</strong><br />
Segment analysis of disc<strong>on</strong>tinued operati<strong>on</strong>s <strong>2006</strong> 2005 2004<br />
Turnover<br />
Europe 1 033 1 397 1 702<br />
The Americas – 102 231<br />
Asia Africa – 2 7<br />
114 <strong>Unilever</strong> <str<strong>on</strong>g>Annual</str<strong>on</strong>g> Report <strong>on</strong> Form 20-F <strong>2006</strong><br />
1 033 1 501 1 940<br />
Foods 1 033 1 271 1 398<br />
Pers<strong>on</strong>al care – 230 542<br />
1 033 1 501 1 940<br />
Operating profit<br />
Europe 170 227 241<br />
The Americas – 20 47<br />
Asia Africa – 1 4<br />
170 248 292<br />
Foods 164 226 219<br />
Pers<strong>on</strong>al care 6 22 73<br />
170 248 292<br />
€ milli<strong>on</strong> € milli<strong>on</strong> € milli<strong>on</strong><br />
Summary cash flow statement of disc<strong>on</strong>tinued operati<strong>on</strong>s <strong>2006</strong> 2005 2004<br />
Net cash flow from/(used in) operating activities 79 62 314<br />
Net cash flow from/(used in) investing activities 1 618 621 44<br />
Net cash flow from/(used in) financing activities (1) (4) (5)<br />
Net increase/(decrease) in cash and cash equivalents 1 696 679 353
Notes to the c<strong>on</strong>solidated accounts <strong>Unilever</strong> Group<br />
27 Assets held for sale and disc<strong>on</strong>tinued operati<strong>on</strong>s (c<strong>on</strong>tinued)<br />
Various n<strong>on</strong>-current assets were held for sale at the year end, including a number of other producti<strong>on</strong> and distributi<strong>on</strong> facilities.<br />
€ milli<strong>on</strong> € milli<strong>on</strong><br />
Assets classified as held for sale <strong>2006</strong> 2005<br />
Disposal groups held for sale<br />
Goodwill – –<br />
Intangible assets – –<br />
Property, plant and equipment – 42<br />
Biological assets – 21<br />
Other n<strong>on</strong>-current investments – –<br />
Inventories – 18<br />
Trade and other receivables – 6<br />
Cash and cash equivalents – 1<br />
– 88<br />
N<strong>on</strong>-current assets held for sale<br />
Property, plant and equipment 14 129<br />
14 217<br />
€ milli<strong>on</strong> € milli<strong>on</strong><br />
Liabilities classified as held for sale (part of disposal groups) <strong>2006</strong> 2005<br />
Trade payables and other liabilities – (16)<br />
Restructuring and other provisi<strong>on</strong>s – –<br />
Pensi<strong>on</strong> liability for unfunded schemes – (1)<br />
Deferred taxati<strong>on</strong> – (9)<br />
Total assets at 31 December <strong>2006</strong> are included in the geographical segments as follows: Europe €9 milli<strong>on</strong>; The Americas €4 milli<strong>on</strong>;<br />
and Asia Africa €1 milli<strong>on</strong>.<br />
– (26)<br />
<strong>Unilever</strong> <str<strong>on</strong>g>Annual</str<strong>on</strong>g> Report <strong>on</strong> Form 20-F <strong>2006</strong> 115<br />
Financial Statements (c<strong>on</strong>tinued)
Financial Statements (c<strong>on</strong>tinued)<br />
Notes to the c<strong>on</strong>solidated accounts <strong>Unilever</strong> Group<br />
28 Rec<strong>on</strong>ciliati<strong>on</strong> of net profit to cash flow from operating activities<br />
€ milli<strong>on</strong> € milli<strong>on</strong> € milli<strong>on</strong><br />
Cash flow from operating activities <strong>2006</strong> 2005 2004<br />
Net profit 5 015 3 975 2 941<br />
Taxati<strong>on</strong> 1 332 1 301 836<br />
Share of net profit of joint ventures/associates and other income from n<strong>on</strong>-current investments (144) (55) (95)<br />
Net finance costs 725 618 631<br />
Finance income (138) (130) (145)<br />
Finance cost 602 693 717<br />
Preference shares provisi<strong>on</strong> 300 – –<br />
Pensi<strong>on</strong>s and similar obligati<strong>on</strong>s (39) 55 59<br />
Depreciati<strong>on</strong>, amortisati<strong>on</strong> and impairment 982 1 274 2 063<br />
Changes in working capital 87 193 547<br />
Inventories (156) (153) 221<br />
Trade and other current receivables (172) (36) 298<br />
Trade payables and other current liabilities 415 382 28<br />
Pensi<strong>on</strong>s and similar provisi<strong>on</strong>s less payments (1 038) (532) (472)<br />
Provisi<strong>on</strong>s less payments 107 (230) 574<br />
Eliminati<strong>on</strong> of (profits)/losses <strong>on</strong> disposals (1 620) (789) (308)<br />
N<strong>on</strong>-cash charge for share-based compensati<strong>on</strong> 120 192 218<br />
Other adjustments 8 (23) (10)<br />
Cash flow from operating activities 5 574 5 924 6 925<br />
The cash flows of pensi<strong>on</strong> funds (other than c<strong>on</strong>tributi<strong>on</strong>s and other direct payments made by the Group in respect of pensi<strong>on</strong>s and similar<br />
obligati<strong>on</strong>s) are not included in the Group cash flow statement.<br />
Major n<strong>on</strong>-cash transacti<strong>on</strong>s<br />
During <strong>2006</strong> the Group has taken a provisi<strong>on</strong> of €300 milli<strong>on</strong> for possible compensati<strong>on</strong> payments relating to the 2005 c<strong>on</strong>versi<strong>on</strong> of<br />
preference shares, issued by <strong>Unilever</strong> N.V. in 1999.<br />
During <strong>2006</strong> the Group entered into new finance lease arrangements in respect of equipment with a capital value at incepti<strong>on</strong> of the lease of<br />
€51 milli<strong>on</strong> (2005: €49 milli<strong>on</strong>).<br />
On 15 February 2005 €1 129 milli<strong>on</strong> of treasury stock was used in the c<strong>on</strong>versi<strong>on</strong> of the €0.05 preference shares into ordinary NV shares.<br />
116 <strong>Unilever</strong> <str<strong>on</strong>g>Annual</str<strong>on</strong>g> Report <strong>on</strong> Form 20-F <strong>2006</strong>
Notes to the c<strong>on</strong>solidated accounts <strong>Unilever</strong> Group<br />
29 Share-based compensati<strong>on</strong> plans<br />
As at 31 December <strong>2006</strong>, the Group had a number of share-based compensati<strong>on</strong> plans:<br />
(i) All-Employee Share Opti<strong>on</strong> Plans<br />
Local All-Employee Share Opti<strong>on</strong> Plans have been set up in 15 countries to enhance employee involvement with <strong>Unilever</strong> and its per<strong>form</strong>ance<br />
by providing a potential financial benefit linked to the <strong>Unilever</strong> share price. There are no individual per<strong>form</strong>ance targets to be met. The plans<br />
permit participati<strong>on</strong> by all permanent employees in the country where the relevant plan applies.<br />
(ii) Executive Opti<strong>on</strong> Plans<br />
The Executive Opti<strong>on</strong> Plans were introduced in 1985 to reward key employees throughout the world for their c<strong>on</strong>tributi<strong>on</strong> to the enhancement<br />
of the Group’s l<strong>on</strong>ger-term future and their commitment to the Group over a sustained period. The grants were dependent <strong>on</strong> per<strong>form</strong>ance of<br />
the Group and the individual.<br />
(iii) Global Per<strong>form</strong>ance Share Plan (GPSP)<br />
Introduced in 2005, under this plan managers can be awarded c<strong>on</strong>diti<strong>on</strong>al shares which will vest three years later at a level between 0%<br />
and 150% - 200% depending <strong>on</strong> <strong>Unilever</strong>’s achievement of set targets for Underlying Sales Growth and Ungeared Free Cash Flow over the<br />
three-year per<strong>form</strong>ance period.<br />
(iv) TSR L<strong>on</strong>g-Term Incentive Plan<br />
This plan was introduced in 2001 and, depending <strong>on</strong> the TSR ranking (see page 27) of <strong>Unilever</strong> in comparis<strong>on</strong> with its peer group, it will<br />
potentially award top executives <strong>on</strong> the vesting date three years later with between 0% and 200% of the original c<strong>on</strong>diti<strong>on</strong>al award.<br />
(v) North America Per<strong>form</strong>ance Share Programme<br />
A l<strong>on</strong>g-term incentive plan for North American managers, awarding <strong>Unilever</strong> shares if company targets are met over a three-year period.<br />
(vi) Other plans<br />
These comprise a Share Matching Plan, a Restricted Share Plan, and a cash-settled share-based retenti<strong>on</strong> plan.<br />
<strong>Unilever</strong> will not grant share opti<strong>on</strong>s in total in respect of Executive Opti<strong>on</strong> Plans for more than 5% of its issued ordinary capital, and<br />
for all Plans together, for more than 10% of its issued ordinary capital. The Board does not apporti<strong>on</strong> these limits to each plan separately.<br />
In recent years we have met the obligati<strong>on</strong>s under our share opti<strong>on</strong> and award plans by purchasing shares in advance and transferring them,<br />
in return for the exercise price, to Directors and employees as the opti<strong>on</strong>s are exercised or the awards vest.<br />
The numbers in this note include those for Executive Directors shown in the <str<strong>on</strong>g>report</str<strong>on</strong>g> of the Remunerati<strong>on</strong> Committee <strong>on</strong> pages 49 to 62<br />
and those for key management pers<strong>on</strong>nel shown in note 31 <strong>on</strong> page 122. No awards were made to Executive Directors in 2004, 2005<br />
and <strong>2006</strong> under the North America Per<strong>form</strong>ance Share Programme, the Restricted Share Plan or the cash-settled share-based retenti<strong>on</strong> plan.<br />
N<strong>on</strong>-Executive Directors do not participate in any of the share-based compensati<strong>on</strong> plans.<br />
The ec<strong>on</strong>omic fair value of the awards is calculated using an opti<strong>on</strong> pricing model (usually an adjusted Black-Scholes or multinomial model) and<br />
the resulting cost is recognised as remunerati<strong>on</strong> cost amortised over the vesting period of the grant. The actual remunerati<strong>on</strong> costs charged in<br />
each period is shown below, and relates almost wholly to equity settled plans:<br />
€ milli<strong>on</strong> € milli<strong>on</strong> € milli<strong>on</strong><br />
<strong>2006</strong> 2005 2004<br />
All-Employee Share Opti<strong>on</strong> Plans (12) (13) (17)<br />
Executive Opti<strong>on</strong> Plans (29) (63) (105)<br />
Global Per<strong>form</strong>ance Share Plan (17) (15) –<br />
TSR L<strong>on</strong>g-Term Incentive Plan (9) (10) (9)<br />
North America Per<strong>form</strong>ance Share Programme (31) (63) (64)<br />
Other Plans (22) (28) (23)<br />
(120) (192) (218)<br />
Disclosures, including a descripti<strong>on</strong> of the method and significant assumpti<strong>on</strong>s used to estimate the fair values of opti<strong>on</strong>s and the weighted<br />
average in<strong>form</strong>ati<strong>on</strong>, are given below for each type of plan, <strong>on</strong> a combined basis.<br />
In the tables for each plan or group of plans, opti<strong>on</strong> or award valuati<strong>on</strong>s are given <strong>on</strong> the basis of the weighted average of opti<strong>on</strong>s or awards<br />
granted during each period. For plans involving opti<strong>on</strong>s, the fair value per opti<strong>on</strong> is estimated using the Black-Scholes opti<strong>on</strong> pricing method.<br />
The expected opti<strong>on</strong> terms are based <strong>on</strong> historic data. Figures for expected volatility are set with regard to historic volatility over the last six<br />
years. The expected dividend yield is based <strong>on</strong> the dividend yield in the year of grant. Forfeiture rates are set annually with regard to historic<br />
forfeiture rates.<br />
<strong>Unilever</strong> <str<strong>on</strong>g>Annual</str<strong>on</strong>g> Report <strong>on</strong> Form 20-F <strong>2006</strong> 117<br />
Financial Statements (c<strong>on</strong>tinued)
Financial Statements (c<strong>on</strong>tinued)<br />
Notes to the c<strong>on</strong>solidated accounts <strong>Unilever</strong> Group<br />
29 Share-based compensati<strong>on</strong> plans (c<strong>on</strong>tinued)<br />
(i) All-Employee Share Opti<strong>on</strong> Plans<br />
<strong>Unilever</strong> has All-Employee Share Opti<strong>on</strong> Plans in 15 countries: Austria, Belgium, Denmark, Finland, France, Germany, Ireland, Italy,<br />
the Netherlands, Portugal, Spain, Sweden and Switzerland, and with a share save element in South Africa and the United Kingdom.<br />
The vesting periods range between three and five years (Netherlands nil) and the maximum term is five years.<br />
A summary of the status of the All-Employee Plans as at 31 December <strong>2006</strong>, 2005 and 2004 and changes during the years ended <strong>on</strong> these<br />
dates is presented below:<br />
<strong>2006</strong> 2005 2004<br />
Weighted Weighted Weighted<br />
average average average<br />
Number of exercise Number of exercise Number of exercise<br />
opti<strong>on</strong>s price opti<strong>on</strong>s price opti<strong>on</strong>s price<br />
Outstanding at 1 January 20 467 554 €19.11 22 155 623 €18.77 21 564 274 €18.71<br />
Granted 4 356 278 €17.65 4 884 012 €17.62 4 830 401 €17.79<br />
Exercised (1 921 936) €17.32 (3 077 008) €15.59 (563 445) €14.21<br />
Forfeited (1 683 941) €19.18 (1 967 127) €18.91 (2 150 074) €18.22<br />
Expired (3 224 609) €21.35 (1 527 946) €17.93 (1 525 533) €19.12<br />
Outstanding at 31 December 17 993 346 €18.54 20 467 554 €19.02 22 155 623 €18.64<br />
Exercisable at 31 December 6 484 654 €19.66 6 819 376 €20.88 5 988 657 €19.71<br />
The weighted average market price of the shares at the time of exercise was €19.92 (2005: €18.34; 2004: €17.12). As at 1 January <strong>2006</strong> there<br />
were 13 648 178 n<strong>on</strong>-vested opti<strong>on</strong>s at a weighted average fair value of €3.59. As at 31 December <strong>2006</strong> there were 11 508 692 n<strong>on</strong>-vested<br />
opti<strong>on</strong>s at a weighted average fair value of €3.30. During <strong>2006</strong> there were 5 132 333 opti<strong>on</strong>s vested at a weighted average fair value of €3.83.<br />
118 <strong>Unilever</strong> <str<strong>on</strong>g>Annual</str<strong>on</strong>g> Report <strong>on</strong> Form 20-F <strong>2006</strong><br />
<strong>2006</strong> 2005 2004<br />
Opti<strong>on</strong> value in<strong>form</strong>ati<strong>on</strong><br />
Fair value per opti<strong>on</strong> €3.10 €3.01 €3.18<br />
Valuati<strong>on</strong> assumpti<strong>on</strong>s:<br />
Expected opti<strong>on</strong> term 3.5 years 3.5 years 3.4 years<br />
Expected volatility 27.5% 27.5% 27.5%<br />
Expected dividend yield 3.8% 3.6% 3.3%<br />
Risk-free interest rate 3.8% 2.9% 3.5%<br />
The exercise prices and remaining life of the All-Employee Opti<strong>on</strong> Plans as at 31 December <strong>2006</strong> are as follows:<br />
Opti<strong>on</strong>s outstanding Opti<strong>on</strong>s exercisable<br />
Number Weighted Number<br />
Range of outstanding at average remaining Weighted average exercisable at Weighted average<br />
exercise prices 31 December <strong>2006</strong> c<strong>on</strong>tractual life exercise price 31 December <strong>2006</strong> exercise price<br />
€17.00 – €23.34 17 993 346 3 years €18.54 6 484 654 €19.66
Notes to the c<strong>on</strong>solidated accounts <strong>Unilever</strong> Group<br />
29 Share-based compensati<strong>on</strong> plans (c<strong>on</strong>tinued)<br />
(ii) Executive Opti<strong>on</strong> Plans<br />
Under the Executive Opti<strong>on</strong> Plans opti<strong>on</strong>s are granted to key employees of the Group <strong>on</strong> a discreti<strong>on</strong>ary basis. The exercise price is the market<br />
price at the date of grant. Since the introducti<strong>on</strong> of the Global Per<strong>form</strong>ance Share Plan in 2005, it is the intenti<strong>on</strong> to make no further grants<br />
under the Executive Opti<strong>on</strong> Plans, except for a few premium opti<strong>on</strong> grants which result from prior commitments. The plans are made up<br />
of the following:<br />
NV Executive Opti<strong>on</strong> Plan and PLC Executive Opti<strong>on</strong> Plan<br />
These plans provide for the granting of opti<strong>on</strong>s to purchase shares of <strong>Unilever</strong> N.V. and of <strong>Unilever</strong> PLC, at a price not lower than the market<br />
price <strong>on</strong> the day the opti<strong>on</strong>s were granted. These opti<strong>on</strong>s become exercisable after a three-year period from the date of grant. The opti<strong>on</strong>s have<br />
a maximum term of ten years.<br />
North America Executive Stock Opti<strong>on</strong> Programme<br />
This programme is covered by the <strong>Unilever</strong> North America 2002 Omnibus Equity Compensati<strong>on</strong> Plan and provides for the granting of opti<strong>on</strong>s to<br />
purchase a maximum of 121.5 milli<strong>on</strong> shares in <strong>Unilever</strong> N.V. of the New York Registry, and 117.9 milli<strong>on</strong> shares of <strong>Unilever</strong> PLC, at a price not<br />
lower than the market value <strong>on</strong> the day the opti<strong>on</strong>s are granted. These opti<strong>on</strong>s become exercisable over a three-year period from the date of<br />
grant and have a maximum term of ten years.<br />
Managers working in India can participate in an Executive Opti<strong>on</strong> Plan relating to Hindustan Lever Limited’s shares. As these are neither NV nor<br />
PLC shares, no figures for this plan are disclosed in this note, but the fair value costs for <strong>2006</strong> €1 milli<strong>on</strong> (2005: €2 milli<strong>on</strong>; 2004: €3 milli<strong>on</strong>)<br />
and are included in the costs of Executive Opti<strong>on</strong> Plans <strong>on</strong> page 117.<br />
A summary of the status of the Executive Opti<strong>on</strong> Plans as at 31 December <strong>2006</strong>, 2005 and 2004 and changes during the years ended <strong>on</strong> these<br />
dates is presented below:<br />
<strong>2006</strong> 2005 2004<br />
Weighted Weighted Weighted<br />
average average average<br />
Number of exercise Number of exercise Number of exercise<br />
opti<strong>on</strong>s price opti<strong>on</strong>s price opti<strong>on</strong>s price<br />
Outstanding at 1 January 94 304 917 €18.16 106 817 066 €18.18 101 146 875 €17.45<br />
Granted – – 994 780 €17.07 16 785 813 €17.03<br />
Exercised (12 458 411) €16.80 (6 387 147) €15.34 (5 079 787) €12.41<br />
Forfeited (3 487 375) €19.76 (7 078 325) €19.19 (6 035 835) €18.34<br />
Expired (55 912) €13.87 (41 457) €18.00 – –<br />
Outstanding at 31 December 78 303 219 €18.31 94 304 917 €18.29 106 817 066 €17.57<br />
Exercisable at 31 December 64 704 677 €18.46 59 766 857 €18.39 49 223 513 €16.54<br />
The weighted average market price of the shares at the time of exercise was €19.64 (2005: €18.82; 2004:€17.13). As at 1 January <strong>2006</strong> there<br />
were 34 538 060 n<strong>on</strong>-vested opti<strong>on</strong>s at a weighted average fair value of €4.13. As at 31 December <strong>2006</strong> there were 13 598 542 n<strong>on</strong>-vested<br />
opti<strong>on</strong>s at a weighted average fair value of €3.82. During <strong>2006</strong> 21 234 947 opti<strong>on</strong>s vested at a weighted average fair value of €4.32.<br />
<strong>2006</strong> 2005 2004<br />
Opti<strong>on</strong> value in<strong>form</strong>ati<strong>on</strong><br />
Fair value per opti<strong>on</strong> – €3.67 €3.72<br />
Valuati<strong>on</strong> assumpti<strong>on</strong>s:<br />
Expected opti<strong>on</strong> term – 6.0 years 5.9 years<br />
Expected volatility – 27.5% 27.5%<br />
Expected dividend yield – 3.8% 3.4%<br />
Risk-free interest rate – 4.0% 3.7%<br />
The exercise prices and remaining life of the Executive Opti<strong>on</strong> Plans as at 31 December <strong>2006</strong> are as follows:<br />
Opti<strong>on</strong>s outstanding Opti<strong>on</strong>s exercisable<br />
Number Weighted<br />
Range of outstanding at average remaining Weighted average Number exercisable at Weighted average<br />
exercise prices 31 December <strong>2006</strong> c<strong>on</strong>tractual life exercise price 31 December <strong>2006</strong> exercise price<br />
€8.58 – €11.65 1 165 006 4 years €11.51 1 165 006 €11.51<br />
€12.34 – €16.91 16 001 431 5 years €15.10 14 608 402 €14.95<br />
€17.19 – €24.66 61 136 782 5 years €19.28 48 931 269 €19.68<br />
<strong>Unilever</strong> <str<strong>on</strong>g>Annual</str<strong>on</strong>g> Report <strong>on</strong> Form 20-F <strong>2006</strong> 119<br />
Financial Statements (c<strong>on</strong>tinued)
Financial Statements (c<strong>on</strong>tinued)<br />
Notes to the c<strong>on</strong>solidated accounts <strong>Unilever</strong> Group<br />
29 Share-based compensati<strong>on</strong> plans (c<strong>on</strong>tinued)<br />
(iii) Global Per<strong>form</strong>ance Share Plan<br />
The GPSP was introduced in 2005. Under this plan, managers can be awarded c<strong>on</strong>diti<strong>on</strong>al shares which will vest three years later at a level<br />
between 0% and 150% (for middle management) or 200% (for higher executives) depending <strong>on</strong> <strong>Unilever</strong>’s achievement of set targets for<br />
Underlying Sales Growth and Free Cash Flow over the three-year per<strong>form</strong>ance period. The amount to be paid by participants to obtain the<br />
shares at vesting is zero.<br />
A summary of the status of the GPSP as at 31 December <strong>2006</strong> and 2005 and changes during the year is presented below:<br />
<strong>2006</strong> 2005<br />
Number of Number of<br />
shares shares<br />
Outstanding at 1 January 3 770 644 –<br />
Awarded 3 426 757 3 771 268<br />
Vested – –<br />
Forfeited (470 972) (624)<br />
Outstanding at 31 December 6 726 429 3 770 644<br />
Exercisable at 31 December – –<br />
120 <strong>Unilever</strong> <str<strong>on</strong>g>Annual</str<strong>on</strong>g> Report <strong>on</strong> Form 20-F <strong>2006</strong><br />
<strong>2006</strong> 2005<br />
Share award value in<strong>form</strong>ati<strong>on</strong><br />
Fair value per share award €17.07 €15.98<br />
As at 1 January <strong>2006</strong> there were 3 770 644 n<strong>on</strong>-vested share awards at a weighted average fair value of €15.87. As at 31 December <strong>2006</strong> there<br />
were 6 726 429 n<strong>on</strong>-vested share awards at a weighted average fair value of €16.47. During <strong>2006</strong> no share awards vested.<br />
(iv) TSR L<strong>on</strong>g-Term Incentive Plan<br />
Under this plan, introduced in 2001, grants are made to Executive Directors and some senior executives. The level of share award which will vest<br />
three years later will vary in accordance with the Total Shareholder Return in comparis<strong>on</strong> with a peer group (see descripti<strong>on</strong> <strong>on</strong> page 27). If the<br />
ranking is below the median, the share award will lapse; the higher the ranking above the median, the higher the share award. The amount to<br />
be paid to the company by participants to obtain the shares at vesting is zero.<br />
A summary of the status of the TSR L<strong>on</strong>g-Term Incentive Plan as at 31 December <strong>2006</strong>, 2005 and 2004 and changes during the year ended <strong>on</strong><br />
these dates is presented below:<br />
<strong>2006</strong> 2005 2004<br />
Number of Number of Number of<br />
shares shares shares<br />
Outstanding at 1 January 2 150 450 2 180 626 1 994 258<br />
Awarded 602 347 689 495 734 699<br />
Vested (a) – – (454 759)<br />
Forfeited (33 971) (21 944) (93 572)<br />
Expired (b) (771 570) (697 727) –<br />
Outstanding at 31 December 1 947 256 2 150 450 2 180 626<br />
Exercisable at 31 December – – –<br />
(a) 2001 award vested 100% as ranking was 6th.<br />
(b) 2002 and 2003 awards expired (zero vesting) as rankings were 13th and 14th respectively.<br />
<strong>2006</strong> 2005 2004<br />
Share award value in<strong>form</strong>ati<strong>on</strong><br />
Fair value per share award (c) €14.08 €13.48 €13.68<br />
(c) Estimated using opti<strong>on</strong> pricing models (M<strong>on</strong>te Carlo) taking account of peer group TSR volatilities and correlati<strong>on</strong>s.<br />
As at 1 January <strong>2006</strong> there were 2 150 450 n<strong>on</strong>-vested share awards at a weighted average fair value of €14.13. As at 31 December <strong>2006</strong><br />
there were 1 947 256 n<strong>on</strong>-vested share awards at a weighted average fair value of €13.83. During <strong>2006</strong> there were 771 570 share awards<br />
at a weighted average fair value of €14.84 which expired <strong>on</strong> the vesting date.
Notes to the c<strong>on</strong>solidated accounts <strong>Unilever</strong> Group<br />
29 Share-based compensati<strong>on</strong> plans (c<strong>on</strong>tinued)<br />
(v) North America Per<strong>form</strong>ance Share Programme<br />
This l<strong>on</strong>g-term incentive plan for North American managers, introduced in 2001, awards <strong>Unilever</strong> shares if company per<strong>form</strong>ance targets are<br />
met over a three-year period. The amount to be paid to the company by participants to obtain the shares at vesting is zero.<br />
A summary of the status of the North America Per<strong>form</strong>ance Share Programme as at 31 December <strong>2006</strong>, 2005 and 2004 and changes during<br />
the years ended <strong>on</strong> these dates is presented below:<br />
<strong>2006</strong> 2005 2004<br />
Number of Number of Number of<br />
shares shares shares<br />
Outstanding at 1 January 9 516 348 10 749 007 11 255 341<br />
Awarded 2 735 732 2 742 984 3 456 287<br />
Vested (3 057 630) (3 510 939) (3 819 424)<br />
Forfeited (650 699) (464 704) (143 197)<br />
Outstanding at 31 December 8 543 751 9 516 348 10 749 007<br />
Exercisable at 31 December – – –<br />
<strong>2006</strong> 2005 2004<br />
Share award value in<strong>form</strong>ati<strong>on</strong><br />
Fair value per share award €17.42 €19.02 €15.88<br />
As at 1 January <strong>2006</strong> there were 9 516 348 n<strong>on</strong>-vested share awards at a weighted average fair value of €16.14. As at 31 December <strong>2006</strong><br />
there were 8 543 751 n<strong>on</strong>-vested share awards at a weighted average fair value of €16.93. During <strong>2006</strong> there were 3 189 363 share awards<br />
vested at a weighted average fair value of €15.12.<br />
(vi) Other Plans<br />
The Group also provides a Share Matching Plan, a Restricted Share Plan, and a cash-settled share-based retenti<strong>on</strong> plan.<br />
Additi<strong>on</strong>al in<strong>form</strong>ati<strong>on</strong><br />
As a result of the share-based compensati<strong>on</strong> plans for employees, we are exposed to movements in our own share price. We take a flexible<br />
approach to the buying of shares to meet these obligati<strong>on</strong>s, not automatically buying shares at grant. In 2001, we entered into a c<strong>on</strong>tract with<br />
a bank for the forward purchase of <strong>Unilever</strong> shares. This c<strong>on</strong>tract was terminated in March <strong>2006</strong>.<br />
At 31 December <strong>2006</strong>, there were opti<strong>on</strong>s outstanding to purchase 87 114 773 (2005: 99 687 447) ordinary shares in NV or PLC in respect<br />
of share-based compensati<strong>on</strong> plans of NV and its subsidiaries and the North American plans, and 28 832 519 (2005: 33 703 439) ordinary<br />
shares in NV or PLC in respect of share-based compensati<strong>on</strong> plans of PLC and its subsidiaries.<br />
To satisfy the opti<strong>on</strong>s granted, certain NV group companies hold 91 935 752 (2005: 99 695 763) ordinary shares of NV or PLC, and trusts in<br />
Jersey and the United Kingdom hold 16 678 871 (2005: 19 454 453) PLC shares. The trustees of these trusts have agreed, until further notice,<br />
to waive dividends <strong>on</strong> these shares, save for the nominal sum of 0.01p per 3 1 ⁄9p ordinary share. Shares acquired during <strong>2006</strong> represent 0.2%<br />
of the Group’s called up capital. The balance at year end is 3.6% (2005: 3.9%).<br />
The book value of €1 836 milli<strong>on</strong> (2005: €2 258 milli<strong>on</strong>) of all shares held in respect of share-based compensati<strong>on</strong> plans for both NV and PLC<br />
is eliminated <strong>on</strong> c<strong>on</strong>solidati<strong>on</strong> by deducti<strong>on</strong> from other reserves (see note 23 <strong>on</strong> page 110). Their market value at 31 December <strong>2006</strong> was<br />
€2 279 milli<strong>on</strong> (2005: €2 261 milli<strong>on</strong>).<br />
At 31 December <strong>2006</strong> the exercise price of 14 989 001 (2005: 43 740 558) NV and PLC opti<strong>on</strong>s were above the market price of the shares.<br />
Shares held to satisfy opti<strong>on</strong>s are accounted for in accordance with IAS 32 and SIC 12. All differences between the purchase price of the shares<br />
held to satisfy opti<strong>on</strong>s granted and the proceeds received for the shares, whether <strong>on</strong> exercise or lapse, are charged to reserves. In <strong>2006</strong> this<br />
includes €7 milli<strong>on</strong> (2005: €7 milli<strong>on</strong>) for shares held to meet opti<strong>on</strong>s expiring in the short term which are priced above market value. The basis<br />
of the charge to operating profit for the ec<strong>on</strong>omic value of opti<strong>on</strong>s granted is discussed <strong>on</strong> page 117.<br />
Obligati<strong>on</strong>s over the following number of shares were granted, exercised, forfeited or expired between 31 December <strong>2006</strong> and 1 March 2007.<br />
In this period we have also, in line with prior years practice, purchased 206 871 NV New York Registry Shares and 259 522 PLC shares in the<br />
<strong>form</strong> of ADRs to satisfy awards under the North America Executive Opti<strong>on</strong> and Share Matching Plans.<br />
Exercised,<br />
Granted forfeited or expired<br />
Numbers of Numbers<br />
shares of shares<br />
All-Employee Opti<strong>on</strong> Plans – 443 488<br />
Executive Opti<strong>on</strong> Plans – 3 006 729<br />
Global Per<strong>form</strong>ance Share Plan – 20 083<br />
TSR L<strong>on</strong>g-Term Incentive Plan – –<br />
North America Per<strong>form</strong>ance Share Programme – 91 187<br />
<strong>Unilever</strong> <str<strong>on</strong>g>Annual</str<strong>on</strong>g> Report <strong>on</strong> Form 20-F <strong>2006</strong> 121<br />
Financial Statements (c<strong>on</strong>tinued)
Financial Statements (c<strong>on</strong>tinued)<br />
Notes to the c<strong>on</strong>solidated accounts <strong>Unilever</strong> Group<br />
30 Related party transacti<strong>on</strong>s<br />
The following related party balances existed with associate or joint venture businesses at 31 December:<br />
€ milli<strong>on</strong> € milli<strong>on</strong><br />
Related party balances <strong>2006</strong> 2005<br />
Trading and other balances due (to)/from joint ventures 91 85<br />
Trading balances due (to)/from associates (14) (8)<br />
Joint ventures<br />
As discussed in note 33 <strong>on</strong> page 123, <strong>Unilever</strong> completed the restructuring of its Portuguese business as at 1 January 2007. Balances owed by<br />
FIMA at 31 December <strong>2006</strong> were €91 milli<strong>on</strong> (2005: €85 milli<strong>on</strong>).<br />
Associates<br />
Following the sale of DiverseyLever, our instituti<strong>on</strong>al and industrial cleaning business, to Johns<strong>on</strong> Professi<strong>on</strong>al Holdings Inc. in 2002, <strong>Unilever</strong> has<br />
a <strong>on</strong>e-third equity stake in the combined Johns<strong>on</strong>Diversey business, with an opti<strong>on</strong> to exit the business from 2007. This opti<strong>on</strong> had a fair value<br />
of zero at 31 December <strong>2006</strong> and 31 December 2005. At 31 December <strong>2006</strong> the outstanding balance payable to Johns<strong>on</strong>Diversey Holdings<br />
Inc. was €14 milli<strong>on</strong> (2005: €8 milli<strong>on</strong>). Sales agency fees to Johns<strong>on</strong>Diversey were incurred of approximately €68 milli<strong>on</strong> in <strong>2006</strong><br />
(2005: €76 milli<strong>on</strong>; 2004: €68 milli<strong>on</strong>).<br />
Langholm Capital Partners invests in private European companies with above-average l<strong>on</strong>ger-term growth prospects. It has invested in: Lumene<br />
OY, a Finnish pers<strong>on</strong>al care business specialising in natural pers<strong>on</strong>al care for fair skins in harsh climates; Dorset Cereals, a UK manufacturer of<br />
cereal products aimed at the healthy eating and luxury niche of the cereals market; Just Retirement, a specialist financial services company<br />
based in the UK, providing customised retirement soluti<strong>on</strong> for those in and approaching retirement, and Elvi, a UK retailer of plus-size women’s<br />
clothing with 25 owned shops and 66 c<strong>on</strong>cessi<strong>on</strong> outlets. An IPO of Just Retirement took place in <strong>2006</strong>. As a result of sale of shares during the<br />
IPO, Langholm returned €13 milli<strong>on</strong> to <strong>Unilever</strong>. Langholm remains a majority shareholder of Just Retirement. To build business opportunities<br />
that fit our core business interests in Foods and Home and Pers<strong>on</strong>al Care, we have committed €97 milli<strong>on</strong> to Langholm Capital Partners <strong>on</strong> a<br />
total of €242 milli<strong>on</strong> funds raised. At 31 December <strong>2006</strong>, the outstanding balance with Langholm Capital Partners was €45 milli<strong>on</strong> (not<br />
material in 2005).<br />
Other related parties<br />
In September <strong>2006</strong> Harish Manwani, President Asia Africa and member of the <strong>Unilever</strong> Executive Team, and his wife purchased an apartment<br />
from Hindustan Lever Limited, a group company ultimately owned by PLC, for Rs.118 milli<strong>on</strong> (€2 042 255). The purchase was made at full<br />
market value via an open bidding/tendering process managed by independent property c<strong>on</strong>sultants. Mr Manwani is also N<strong>on</strong>-Executive<br />
Chairman of Hindustan Lever Limited a company listed <strong>on</strong>, am<strong>on</strong>g others, the Nati<strong>on</strong>al Stock Exchange of India and the Bombay Stock<br />
Exchange. The independent Directors of Hindustan Lever Limited, including the Chairman of the Audit Committee were fully c<strong>on</strong>sulted.<br />
31 Key management pers<strong>on</strong>nel<br />
For 2004 key management pers<strong>on</strong>nel included the Executive Directors, N<strong>on</strong>-Executive Directors and Business Presidents described <strong>on</strong> pages 68<br />
and 69 of the 2004 Report and Accounts. Following a change in the management structure which took place in 2005 key management for<br />
2005 and <strong>2006</strong> for <str<strong>on</strong>g>report</str<strong>on</strong>g>ing purposes became the members of the UEx together with the N<strong>on</strong>-Executive Directors described <strong>on</strong> page 46.<br />
€ milli<strong>on</strong> € milli<strong>on</strong> € milli<strong>on</strong><br />
Key management compensati<strong>on</strong> <strong>2006</strong> 2005 2004<br />
Salaries and short-term employee benefits (14) (13) (21)<br />
N<strong>on</strong>-Executive Directors’ fees (1) (1) (1)<br />
Post-employment benefits (3) (4) (5)<br />
Other l<strong>on</strong>g-term benefits (all share-based) (2) (1) (13)<br />
Terminati<strong>on</strong> payments – (1) (2)<br />
122 <strong>Unilever</strong> <str<strong>on</strong>g>Annual</str<strong>on</strong>g> Report <strong>on</strong> Form 20-F <strong>2006</strong><br />
(20) (20) (42)<br />
Of which:<br />
Executive Directors (11) (16) (24)<br />
N<strong>on</strong>-Executive Directors (1) (1) (1)<br />
Other (8) (3) (17)<br />
(20) (20) (42)<br />
Details of the remunerati<strong>on</strong> of Directors are given in the auditable part of the <str<strong>on</strong>g>report</str<strong>on</strong>g> of the Remunerati<strong>on</strong> Committee as defined <strong>on</strong> page 49.<br />
See also note 30 above for in<strong>form</strong>ati<strong>on</strong> <strong>on</strong> related party transacti<strong>on</strong>s.
Notes to the c<strong>on</strong>solidated accounts <strong>Unilever</strong> Group<br />
32 Remunerati<strong>on</strong> of auditors<br />
€ milli<strong>on</strong> € milli<strong>on</strong> € milli<strong>on</strong><br />
<strong>2006</strong> 2005 2004<br />
Audit fees (a) (24) (14) (13)<br />
Audit-related fees (b) (3) (3) (5)<br />
Tax fees (2) (3) (4)<br />
All other fees (1) (2) (2)<br />
(a) Excludes out of pocket expenses and fees paid in respect of services supplied for associated pensi<strong>on</strong> schemes.<br />
(b) Includes other audit services which comprises audit and similar work that regulati<strong>on</strong> for agreements with third parties requires the auditors<br />
to undertake.<br />
33 Events after the balance sheet date<br />
On 1 January 2007, <strong>Unilever</strong> completed the restructuring of its Portuguese businesses. The result of the reorganisati<strong>on</strong> is that <strong>Unilever</strong> now has<br />
a 55% share of the combined Portuguese entity, called <strong>Unilever</strong> Jerónimo Martins. The combined business includes the foods and home and<br />
pers<strong>on</strong>al care businesses. The remaining 45% interest is held by Jerónimo Martins Group. The structure of the agreement is such that there is<br />
joint c<strong>on</strong>trol of the newly <strong>form</strong>ed entity and so it will be accounted for by <strong>Unilever</strong> as a joint venture.<br />
On 12 March 2007, <strong>Unilever</strong> announced the commencement of a share buy-back programme. This will involve the purchase in 2007 of ordinary<br />
shares of NV or PLC, or a combinati<strong>on</strong> of the two, up to an aggregate market value of €1.5 billi<strong>on</strong>. The value of the shares purchased will be<br />
booked against equity under the heading of Other reserves, in line with established practice. As at 19 March 2007, 1 967 782 ordinary shares<br />
of NV had been purchased at prices between €19.55 and €21.41 per share. These shares will be held as treasury shares.<br />
<strong>Unilever</strong> <str<strong>on</strong>g>Annual</str<strong>on</strong>g> Report <strong>on</strong> Form 20-F <strong>2006</strong> 123<br />
Financial Statements (c<strong>on</strong>tinued)
Financial Statements (c<strong>on</strong>tinued)<br />
Notes to the c<strong>on</strong>solidated accounts <strong>Unilever</strong> Group<br />
34 Divergences from United States GAAP<br />
<strong>Unilever</strong>’s c<strong>on</strong>solidated accounts are prepared in accordance with accounting principles which differ in some respects from those applicable in<br />
the United States. The following is a summary of the effect <strong>on</strong> the Group’s net profit, combined earnings per share and equity of the applicati<strong>on</strong><br />
of accounting principles generally accepted in the United States (US GAAP).<br />
124 <strong>Unilever</strong> <str<strong>on</strong>g>Annual</str<strong>on</strong>g> Report <strong>on</strong> Form 20-F <strong>2006</strong><br />
€ milli<strong>on</strong> € milli<strong>on</strong> € milli<strong>on</strong><br />
<strong>2006</strong> 2005 2004<br />
Net profit as <str<strong>on</strong>g>report</str<strong>on</strong>g>ed in the c<strong>on</strong>solidated income statement 5 015 3 975 2 941<br />
US GAAP adjustments:<br />
Impairment of goodwill and intangible assets (12) (279) (152)<br />
Restructuring costs 23 (224) 275<br />
Pensi<strong>on</strong>s and similar obligati<strong>on</strong>s (464) (265) (230)<br />
Profit/(loss) <strong>on</strong> disposal of group companies (167) (217) (11)<br />
Currency retranslati<strong>on</strong> written back <strong>on</strong> disposals (81) (102) (8)<br />
Sale and leaseback (28) (56) –<br />
Financial Instruments (41) (6) (66)<br />
Taxati<strong>on</strong> effect of above adjustments including differences in deferred tax accounting 178 70 159<br />
Other (38) (41) (41)<br />
Net increase/(decrease) (630) (1 120) (74)<br />
Net income under US GAAP<br />
Attributable to:<br />
4 385 2 855 2 867<br />
Minority interests 270 209 181<br />
Shareholders’ equity 4 115 2 646 2 686<br />
Combined earnings per share under US GAAP € € €<br />
From c<strong>on</strong>tinuing operati<strong>on</strong>s<br />
Basic earnings per share 0.98 0.68 0.84<br />
Diluted earnings per share 0.93 0.68 0.80<br />
From total operati<strong>on</strong>s<br />
Basic earnings per share 1.45 0.90 0.92<br />
Diluted earnings per share 1.38 0.88 0.87<br />
€ milli<strong>on</strong> € milli<strong>on</strong><br />
<strong>2006</strong> 2005<br />
Total equity as <str<strong>on</strong>g>report</str<strong>on</strong>g>ed in the c<strong>on</strong>solidated balance sheet 11 672 8 765<br />
US GAAP adjustments:<br />
Goodwill 4 171 4 531<br />
Indefinite-lived intangible assets 1 246 1 402<br />
Restructuring costs 171 153<br />
Pensi<strong>on</strong>s and similar obligati<strong>on</strong>s 31 1 085<br />
Taxati<strong>on</strong> effect of above adjustments including differences in deferred tax accounting (464) (896)<br />
Other 241 356<br />
Net increase/(decrease) 5 396 6 631<br />
Equity under US GAAP 17 068 15 396<br />
Attributable to:<br />
Minority interests 442 404<br />
Shareholders’ equity 16 626 14 992
Notes to the c<strong>on</strong>solidated accounts <strong>Unilever</strong> Group<br />
34 Divergences from United States GAAP (c<strong>on</strong>tinued)<br />
The c<strong>on</strong>solidated accounts of the <strong>Unilever</strong> Group have been prepared in accordance with accounting principles which differ in certain respects<br />
from those generally accepted in the United States (US GAAP). The principal differences are set out below.<br />
Goodwill and intangible assets<br />
Under IFRS transiti<strong>on</strong>al rules, purchased goodwill and indefinite-lived intangible assets were recognised at the transiti<strong>on</strong> date to IFRS at deemed<br />
cost. For goodwill, the deemed cost at 1 January 2004 was the carrying value under previous GAAP at 31 December 2003. Under previous<br />
GAAP, goodwill arising from acquisiti<strong>on</strong>s after 1 January 1998 was capitalised and amortised over the period of its expected useful life, up to<br />
a maximum of 20 years. For intangible assets with indefinite lives, the deemed cost at the date of transiti<strong>on</strong> to IFRS is the original cost at which<br />
these intangible assets were initially recognised <strong>on</strong> the balance sheet at the time of the acquisiti<strong>on</strong>.<br />
Under US GAAP prior to 1 January 2002, purchased goodwill and indefinite-lived intangible assets were capitalised and amortised over their<br />
useful lives. From 1 January 2002, under Financial Accounting Standards Board Statement FAS 142 ‘Goodwill and Other Intangible Assets’,<br />
the amortisati<strong>on</strong> of goodwill and indefinite-lived intangible assets ceased. Intangible assets that have finite useful lives c<strong>on</strong>tinue to be amortised<br />
over their useful lives for both IFRS and US GAAP.<br />
The differences in equity between IFRS and US GAAP in accounting for goodwill and intangible assets are set out in the table below:<br />
€ milli<strong>on</strong> € milli<strong>on</strong><br />
<strong>2006</strong> 2005<br />
Pre-1998 goodwill and intangible assets 3 149 3 536<br />
Cessati<strong>on</strong> of goodwill amortisati<strong>on</strong> 1 633 1 631<br />
Cessati<strong>on</strong> of indefinite-lived intangible assets amortisati<strong>on</strong> (398) (329)<br />
Differences in calculati<strong>on</strong> of goodwill <strong>on</strong> acquisiti<strong>on</strong> 1 118 1 198<br />
Recognised impairments <strong>on</strong> goodwill and indefinite-lived intangible assets (106) (128)<br />
Cessati<strong>on</strong> of goodwill amortisati<strong>on</strong> <strong>on</strong> joint ventures and associates 21 25<br />
Total adjustment to equity 5 417 5 933<br />
Under US GAAP the carrying values and detailed rules for measuring and allocating an impairment loss differ from those rules under IFRS.<br />
The principal differences being that:<br />
• The impairment review is per<strong>form</strong>ed by reference to <str<strong>on</strong>g>report</str<strong>on</strong>g>ing units, which are defined differently from cash generating units. A <str<strong>on</strong>g>report</str<strong>on</strong>g>ing<br />
unit is at the <str<strong>on</strong>g>report</str<strong>on</strong>g>ing segment or <strong>on</strong>e level below; and<br />
• Fair value is determined by use of a relief-from-royalty valuati<strong>on</strong> method for indefinite-lived trademarks and through a present value of<br />
discounted cash flows methodology for the relevant <str<strong>on</strong>g>report</str<strong>on</strong>g>ing unit in respect of goodwill.<br />
In <strong>2006</strong>, the US GAAP impairment testing identified an additi<strong>on</strong>al €12 milli<strong>on</strong> of goodwill and intangible assets that were impaired (2005: €279<br />
milli<strong>on</strong>; 2004: €152 milli<strong>on</strong>).<br />
Goodwill<br />
An analysis of goodwill of group companies, joint ventures and associates by <str<strong>on</strong>g>report</str<strong>on</strong>g>ing segment is given below:<br />
€ milli<strong>on</strong> € milli<strong>on</strong> € milli<strong>on</strong> € milli<strong>on</strong><br />
The Asia<br />
Europe Americas Africa Total<br />
1 January 2005 (a) 8 515 5 937 1 960 16 412<br />
Acquisiti<strong>on</strong>s – – 13 13<br />
Disposals (149) (24) (4) (177)<br />
Impairment charged to income statement – (176) (3) (179)<br />
Currency retranslati<strong>on</strong> 56 1 123 381 1 560<br />
31 December 2005 8 422 6 860 2 347 17 629<br />
Acquisiti<strong>on</strong>s 43 – 17 60<br />
Disposals (111) (25) (4) (140)<br />
Impairment charged to income statement (17) (5) (2) (24)<br />
Currency retranslati<strong>on</strong> (5) (415) (388) (808)<br />
31 December <strong>2006</strong> 8 332 6 415 1 970 16 717<br />
(a) In 2005 <strong>Unilever</strong> implemented a new operating framework, which resulted in <strong>Unilever</strong> <str<strong>on</strong>g>report</str<strong>on</strong>g>ing its primary operating segments as<br />
geographies. In 2005 an allocati<strong>on</strong> of goodwill was made to the <str<strong>on</strong>g>report</str<strong>on</strong>g>able segments. During the year the Directors have reassessed the<br />
allocati<strong>on</strong> of goodwill to geographical segments based <strong>on</strong> the relative fair value of the segments at the time the new operating framework<br />
was introduced. As a result, we have amended the 1 January 2005 goodwill balances (and associated currency retranslati<strong>on</strong> effects in 2005)<br />
by reallocating goodwill from the Americas segment to the Asia Africa and Europe segments of €1.0 billi<strong>on</strong> and €0.3 billi<strong>on</strong> respectively.<br />
<strong>Unilever</strong> <str<strong>on</strong>g>Annual</str<strong>on</strong>g> Report <strong>on</strong> Form 20-F <strong>2006</strong> 125<br />
Financial Statements (c<strong>on</strong>tinued)
Financial Statements (c<strong>on</strong>tinued)<br />
Notes to the c<strong>on</strong>solidated accounts <strong>Unilever</strong> Group<br />
34 Divergences from United States GAAP (c<strong>on</strong>tinued)<br />
Indefinite-lived intangible assets<br />
Indefinite-lived intangible assets principally comprise trademarks. An analysis of the net book value of indefinite-lived intangible assets at cost<br />
less accumulated amortisati<strong>on</strong> is given below:<br />
126 <strong>Unilever</strong> <str<strong>on</strong>g>Annual</str<strong>on</strong>g> Report <strong>on</strong> Form 20-F <strong>2006</strong><br />
€ milli<strong>on</strong> € milli<strong>on</strong><br />
<strong>2006</strong> 2005<br />
Cost 6 878 7 471<br />
Accumulated amortisati<strong>on</strong> (1 458) (1 619)<br />
Net book value 31 December 5 420 5 852<br />
Restructuring costs<br />
Under <strong>Unilever</strong>’s accounting policy, costs relating to employee terminati<strong>on</strong>s and certain other costs are recognised when a restructuring plan has<br />
been announced as the Group is c<strong>on</strong>sidered to be ‘dem<strong>on</strong>strably committed’. Under US GAAP, employee terminati<strong>on</strong> costs are recognised when<br />
the company has a liability to the employee, unless further service is required from the employee, in which case costs are recognised as benefits<br />
are earned. Additi<strong>on</strong>ally, under US GAAP, liabilities relating to certain other exit costs are recognised when incurred.<br />
Pensi<strong>on</strong>s and similar obligati<strong>on</strong>s<br />
Under IAS 19, the expected costs of providing retirement benefits are charged to the income statement over the periods benefiting from the<br />
employees’ services. Variati<strong>on</strong>s from the expected cost are recognised as they occur in the statement of recognised income and expense. The<br />
assets and liabilities of pensi<strong>on</strong> plans are included in the Group balance sheet at fair value. Under previous US GAAP rules, pensi<strong>on</strong> and other<br />
post-retirement plan costs and liabilities were accounted for in accordance with the prescribed actuarial method and measurement principles<br />
of FAS 87, ‘Employers’ Accounting for Pensi<strong>on</strong>s’ and FAS 106, ‘Employers’ Accounting for Post-Retirement Benefits Other than Pensi<strong>on</strong>s’. The<br />
most significant difference between IFRS and US GAAP was that variati<strong>on</strong>s from the expected costs were recognised in the income statement<br />
over the expected service lives of the employees. Furthermore, an additi<strong>on</strong>al minimum liability was recognised and a charge made to other<br />
comprehensive income when the accumulated benefit obligati<strong>on</strong> exceeded the fair value of plan assets to the extent that the amount was not<br />
covered by the net liability recognised in the balance sheet.<br />
On 31 December <strong>2006</strong>, <strong>Unilever</strong> adopted FAS 158, ‘Employer’s Accounting for Defined Benefit Pensi<strong>on</strong> and Other Post-Retirement Plans’ as<br />
issued by the Financial Accounting Standards Board (FASB) in September <strong>2006</strong> in full. The standard requires the net surplus or deficit of plans to<br />
be shown in the statement of financial positi<strong>on</strong>. This standard was adopted by <strong>Unilever</strong> with effect from 31 December <strong>2006</strong>. The adopti<strong>on</strong> of<br />
FAS 158 means that the <strong>on</strong>ly significant difference from IFRS is that variati<strong>on</strong>s from the expected costs are recognised first in equity and then<br />
recycled in the income statement over the expected service life of the employees.<br />
Under US GAAP, the actuarial assumpti<strong>on</strong>s used to calculate the benefit obligati<strong>on</strong>s are set by reference to market c<strong>on</strong>diti<strong>on</strong>s at the balance<br />
sheet date, in a manner similar to that used under IAS 19. Following the adopti<strong>on</strong> of FAS 158 in <strong>2006</strong> the balance sheet accounting<br />
methodology is now similar to that under IAS 19. However, there is still <strong>on</strong>e significant difference since under US GAAP all costs are recognised<br />
in operating profit and certain cost items are amortised in the income statement even though they have already been recognised in equity.<br />
Under the provisi<strong>on</strong>s of FAS 158 earlier years have not been restated.<br />
The disclosures below show the benefit obligati<strong>on</strong>s, assets, funded status and balance sheet impact, as well as the periodic expense, cash flows<br />
and related ec<strong>on</strong>omic assumpti<strong>on</strong>s associated with the defined benefit pensi<strong>on</strong> plans and other post-employment benefit plans as computed<br />
in accordance with FAS 87, FAS 106 and FAS 158.<br />
Measurement dates<br />
All plan assets are valued at fair value at the balance sheet date. Liabilities in respect of the most important pensi<strong>on</strong> plans, comprising<br />
approximately 80% of the pensi<strong>on</strong> liabilities, are subject to actuarial valuati<strong>on</strong>s every year. The valuati<strong>on</strong>s use membership data for the current<br />
year with the liability projected forward to the balance sheet date. Valuati<strong>on</strong>s of all other plans are carried out every three years and in the case<br />
of the other principal pensi<strong>on</strong> plans, comprising approximately a further 15% of the liabilities, the valuati<strong>on</strong>s are updated each year.
Notes to the c<strong>on</strong>solidated accounts <strong>Unilever</strong> Group<br />
34 Divergences from United States GAAP (c<strong>on</strong>tinued)<br />
Benefit obligati<strong>on</strong>s<br />
The table below shows changes in benefit obligati<strong>on</strong>s during <strong>2006</strong> and 2005:<br />
€ milli<strong>on</strong> € milli<strong>on</strong> € milli<strong>on</strong> € milli<strong>on</strong><br />
Other post- Other post-<br />
Pensi<strong>on</strong> Pensi<strong>on</strong> employment employment<br />
plans plans benefit plans benefit plans<br />
Change in benefit obligati<strong>on</strong>s <strong>2006</strong> 2005 <strong>2006</strong> 2005<br />
1 January 19 927 17 512 1 306 1 175<br />
Service cost 338 321 28 28<br />
Interest cost 907 915 62 68<br />
Plan member c<strong>on</strong>tributi<strong>on</strong>s 14 19 – –<br />
Amendments (107) 13 (186) (56)<br />
Actuarial (gains)/losses (451) 1 665 (80) 12<br />
Acquisiti<strong>on</strong>s – – – –<br />
Disposals (118) (22) (5) (3)<br />
Settlements (16) (4) – (1)<br />
Curtailments (33) (36) (27) (3)<br />
Special terminati<strong>on</strong> benefits 54 79 – 1<br />
Gross benefits paid (1 177) (1 160) (79) (84)<br />
Less: Federal subsidy <strong>on</strong> benefit paid – – 6 –<br />
Reclassificati<strong>on</strong> of benefits (a) 27 18 1 10<br />
Currency retranslati<strong>on</strong> (137) 607 (101) 159<br />
31 December 19 228 19 927 925 1 306<br />
(a) During both <strong>2006</strong> and 2005, certain obligati<strong>on</strong>s were reclassified as employee benefit obligati<strong>on</strong>s.<br />
The weighted assumpti<strong>on</strong>s used to value the benefit obligati<strong>on</strong>s in respect of the principal plans are:<br />
% % % %<br />
Other post- Other post-<br />
Pensi<strong>on</strong> Pensi<strong>on</strong> employment employment<br />
Weighted average assumpti<strong>on</strong>s used to determine benefit obligati<strong>on</strong>s plans plans benefit plans benefit plans<br />
for the principal plans at 31 December <strong>2006</strong> 2005 <strong>2006</strong> 2005<br />
Discount rate 5.1 4.6 5.9 5.5<br />
Salary increases 3.7 3.5 4.0 4.0<br />
Pensi<strong>on</strong> increases 2.3 2.1 n/a n/a<br />
In setting the discount rate, the Group has regard to the yield <strong>on</strong> high quality corporate b<strong>on</strong>ds of suitable durati<strong>on</strong> to the liabilities. For the UK,<br />
we utilise the iBoxx 15+ year AA All Stock Index yield, for the Euroz<strong>on</strong>e we utilise the iBoxx Euro 10+ year AA All Stock index and for the US<br />
we utilise the Moody’s Corporate AA index yield.<br />
Assumpti<strong>on</strong>s for the remaining defined benefit plans vary c<strong>on</strong>siderably, depending <strong>on</strong> the ec<strong>on</strong>omic c<strong>on</strong>diti<strong>on</strong>s of the countries where they<br />
are situated.<br />
Post-employment healthcare benefits<br />
Additi<strong>on</strong>al assumpti<strong>on</strong>s in respect of healthcare benefits are:<br />
Weighted average healthcare trend rates at 31 December <strong>2006</strong> 2005<br />
Healthcare cost trend rate assumed for next year 9.9% 10.4%<br />
Rate to which the cost trend rate gradually declines 5.0% 4.8%<br />
Year that the assumed l<strong>on</strong>g-term rate is reached 2012 2012<br />
Assumed healthcare cost trend rates have a significant effect <strong>on</strong> the amounts <str<strong>on</strong>g>report</str<strong>on</strong>g>ed for the healthcare plans. A <strong>on</strong>e percentage point change<br />
in assumed healthcare cost trend rates would have the following effect:<br />
€ milli<strong>on</strong> € milli<strong>on</strong><br />
1% point 1% point<br />
increase decrease<br />
Effect <strong>on</strong> post-employment benefit obligati<strong>on</strong> 51 (47)<br />
<strong>Unilever</strong> <str<strong>on</strong>g>Annual</str<strong>on</strong>g> Report <strong>on</strong> Form 20-F <strong>2006</strong> 127<br />
Financial Statements (c<strong>on</strong>tinued)
Financial Statements (c<strong>on</strong>tinued)<br />
Notes to the c<strong>on</strong>solidated accounts <strong>Unilever</strong> Group<br />
34 Divergences from United States GAAP (c<strong>on</strong>tinued)<br />
Plan assets<br />
The table below shows the changes in the fair value of plan assets during <strong>2006</strong> and 2005:<br />
€ milli<strong>on</strong> € milli<strong>on</strong> € milli<strong>on</strong> € milli<strong>on</strong><br />
Other post- Other post-<br />
Pensi<strong>on</strong> Pensi<strong>on</strong> employment employment<br />
plans plans benefit plans benefit plans<br />
Change in the fair value of plan assets during the year <strong>2006</strong> 2005 <strong>2006</strong> 2005<br />
1 January 15 989 13 441 17 14<br />
Actual return <strong>on</strong> plan assets 1 558 2 483 (2) 3<br />
Acquisiti<strong>on</strong>s – – – –<br />
Disposals (63) (3) – –<br />
Settlements (16) (10) – –<br />
Employer c<strong>on</strong>tributi<strong>on</strong>s/surplus refunds 1 002 751 71 82<br />
Plan member c<strong>on</strong>tributi<strong>on</strong>s 14 19 – –<br />
Benefits paid from plan assets (1 177) (1 160) (73) (84)<br />
Reclassificati<strong>on</strong> of benefits (b) 38 39 – –<br />
Currency retranslati<strong>on</strong>s (80) 429 – 2<br />
31 December 17 265 15 989 13 17<br />
(b) During 2005, certain obligati<strong>on</strong>s were reclassified as employee benefit obligati<strong>on</strong>s.<br />
Asset allocati<strong>on</strong><br />
The asset allocati<strong>on</strong> for the Group’s principal pensi<strong>on</strong> plans at 31 December 2005 and <strong>2006</strong>, target allocati<strong>on</strong> for 2007, and expected l<strong>on</strong>g-term<br />
rates of return by asset category are as follows:<br />
L<strong>on</strong>g-term<br />
Target Percentage Percentage expected<br />
percentage of plan of plan return <strong>on</strong><br />
allocati<strong>on</strong> assets at assets at plan assets at<br />
for 31 December 31 December 31 December<br />
L<strong>on</strong>g-term asset category 2007 <strong>2006</strong> 2005 <strong>2006</strong><br />
Equity securities 60 61 61 7.8%<br />
Debt securities 26 24 25 4.9%<br />
Property 9 8 9 6.3%<br />
Other 5 7 5 6.0%<br />
128 <strong>Unilever</strong> <str<strong>on</strong>g>Annual</str<strong>on</strong>g> Report <strong>on</strong> Form 20-F <strong>2006</strong><br />
100 100 100<br />
Equity securities include <strong>Unilever</strong> securities amounting to €32 milli<strong>on</strong> (0.2% of total plan assets) and €34 milli<strong>on</strong> (0.2% of total plan assets) at<br />
31 December <strong>2006</strong> and 2005 respectively.<br />
Funded status<br />
The funded status of the plans, rec<strong>on</strong>ciled to the amount <str<strong>on</strong>g>report</str<strong>on</strong>g>ed in the statement of financial positi<strong>on</strong>, is as follows:<br />
€ milli<strong>on</strong> € milli<strong>on</strong> € milli<strong>on</strong> € milli<strong>on</strong><br />
Other post- Other post-<br />
Pensi<strong>on</strong> Pensi<strong>on</strong> employment employment<br />
plans plans benefit plans benefit plans<br />
<strong>2006</strong> 2005 <strong>2006</strong> 2005<br />
Fair value of plan assets 17 265 15 989 13 17<br />
Benefit obligati<strong>on</strong>s (19 228) (19 927) (925) (1 306)<br />
Funded status at 31 December (1 963) (3 938) (912) (1 289)<br />
Unrecognised net transiti<strong>on</strong> liability/(asset) – (46) – –<br />
Unrecognised net actuarial loss/(gain) – 3 008 – 319<br />
Unrecognised prior service cost – 91 – (59)<br />
Net amount recognised at 31 December (1 963) (885) (912) (1 029)<br />
Amount recognised in the statement of financial positi<strong>on</strong> c<strong>on</strong>sists of:<br />
Prepaid benefit cost n/a 1 603 n/a 3<br />
Accrued benefit liability n/a (2 488) n/a (1 032)<br />
Additi<strong>on</strong>al minimum liability n/a (2 442) n/a –<br />
Intangible asset n/a 52 n/a –<br />
Accumulated other comprehensive income n/a 2 390 n/a –<br />
Net amount recognised at 31 December n/a (885) n/a (1 029)<br />
Current assets 50 n/a – n/a<br />
N<strong>on</strong>-current assets 1 653 n/a 2 n/a<br />
Current liabilities (224) n/a (84) n/a<br />
N<strong>on</strong>-current liabilities (3 442) n/a (830) n/a<br />
Total net liability (1 963) n/a (912) n/a<br />
The projected benefit obligati<strong>on</strong> (PBO), accumulated benefit obligati<strong>on</strong> (ABO), and fair value of plan assets, in total and for pensi<strong>on</strong> plans where<br />
the projected benefit obligati<strong>on</strong> or accumulated benefit obligati<strong>on</strong> is in excess of plan assets are as follows:
Notes to the c<strong>on</strong>solidated accounts <strong>Unilever</strong> Group<br />
34 Divergences from United States GAAP (c<strong>on</strong>tinued)<br />
€ milli<strong>on</strong> € milli<strong>on</strong> € milli<strong>on</strong> € milli<strong>on</strong> € milli<strong>on</strong> € milli<strong>on</strong><br />
Plans where Plans where Plans where Plans where<br />
Pensi<strong>on</strong> Pensi<strong>on</strong> PBO exceeds PBO exceeds ABO exceeds ABO exceeds<br />
plans plans plan assets plan assets plan assets plan assets<br />
<strong>2006</strong> 2005 <strong>2006</strong> 2005 <strong>2006</strong> 2005<br />
As at 31 December:<br />
Projected benefit obligati<strong>on</strong>s 19 228 19 927 14 069 15 175 13 738 14 749<br />
Accumulated benefit obligati<strong>on</strong>s 18 152 18 687 13 350 14 290 12 967 13 849<br />
Fair value of plan assets 17 265 15 989 10 404 10 067 10 096 9 659<br />
Net periodic cost<br />
€ milli<strong>on</strong> € milli<strong>on</strong> € milli<strong>on</strong> € milli<strong>on</strong> € milli<strong>on</strong> € milli<strong>on</strong><br />
Other post- Other post- Other post-<br />
Pensi<strong>on</strong> Pensi<strong>on</strong> Pensi<strong>on</strong> employment employment employment<br />
plans plans plans benefit plans benefit plans benefit plans<br />
Comp<strong>on</strong>ents of net periodic benefit cost <strong>2006</strong> 2005 2004 <strong>2006</strong> 2005 2004<br />
Service cost (gross) 351 339 324 28 28 24<br />
Interest cost 907 915 909 62 68 64<br />
Expected returns <strong>on</strong> plan assets (1 020) (930) (917) (1) (1) –<br />
Employee c<strong>on</strong>tributi<strong>on</strong>s (14) (19) (32) – – –<br />
Amortisati<strong>on</strong> of prior service cost 23 30 33 (8) (2) –<br />
Amortisati<strong>on</strong> of transiti<strong>on</strong> (asset) (35) (35) (35) – – –<br />
Amortisati<strong>on</strong> of actuarial loss/(gain) 172 162 163 17 17 12<br />
Total before FAS 88 events 384 462 445 98 110 100<br />
Adjustments for FAS 88 events 42 81 120 (27) (3) 6<br />
Net periodic benefit cost 426 543 565 71 107 106<br />
The assumpti<strong>on</strong>s in respect of principal plans used to determine the periodic expense in the table above for pensi<strong>on</strong>s and other retirement<br />
benefits are given in the table below:<br />
% % % % % %<br />
Other post- Other post- Other post-<br />
Pensi<strong>on</strong> Pensi<strong>on</strong> Pensi<strong>on</strong> employment employment employment<br />
Weighted average assumpti<strong>on</strong>s used to determine net cost plans plans plans benefit plans benefit plans benefit plans<br />
for the principal plans for the years ended 31 December <strong>2006</strong> 2005 2004 <strong>2006</strong> 2005 2004<br />
Discount rate 4.6 5.1 5.5 5.5 5.7 6.1<br />
Expected l<strong>on</strong>g-term rate of return <strong>on</strong> plan assets 6.4 6.8 7.2 n/a n/a n/a<br />
Salary increases 3.5 3.6 3.7 4.0 4.5 4.5<br />
Pensi<strong>on</strong> increases 2.1 2.2 2.2 n/a n/a n/a<br />
Expected rate of return <strong>on</strong> plan assets<br />
The expected rate of return <strong>on</strong> plan assets was determined, based <strong>on</strong> actuarial advice, by a process that takes the current l<strong>on</strong>g-term rates of<br />
return available <strong>on</strong> government b<strong>on</strong>ds and applies to these rates suitable risk premiums that take account of historic market returns and current<br />
market expectati<strong>on</strong>s.<br />
Post-employment healthcare benefits<br />
Assumed healthcare cost trend rates have a significant effect <strong>on</strong> the amounts <str<strong>on</strong>g>report</str<strong>on</strong>g>ed for the healthcare plans. A <strong>on</strong>e percentage point change<br />
in assumed healthcare cost trend rates would have the following effects:<br />
€ milli<strong>on</strong> € milli<strong>on</strong><br />
1% point 1% point<br />
increase decrease<br />
Effect <strong>on</strong> total of service and interest cost comp<strong>on</strong>ents 4 (3)<br />
Other comprehensive income<br />
Other changes in plan assets and benefit obligati<strong>on</strong>s recognised in other comprehensive income.<br />
€ milli<strong>on</strong> € milli<strong>on</strong> € milli<strong>on</strong> € milli<strong>on</strong> € milli<strong>on</strong> € milli<strong>on</strong><br />
Other post- Other post- Other post-<br />
Pensi<strong>on</strong> Pensi<strong>on</strong> Pensi<strong>on</strong> employment employment employment<br />
plans plans plans benefit plans benefit plans benefit plans<br />
<strong>2006</strong> 2005 2004 <strong>2006</strong> 2005 2004<br />
Change in effect of additi<strong>on</strong>al minimum liability (2 388) n/a n/a – n/a n/a<br />
Total recognised in other comprehensive income (674) n/a n/a 17 n/a n/a<br />
Total recognised in net period benefit cost and other (248) n/a n/a 54 n/a n/a<br />
comprehensive income<br />
Amounts recognised in accumulated other comprehensive income:<br />
Additi<strong>on</strong>al minimum liability n/a (2 442) (2 208) n/a n/a n/a<br />
Net actuarial loss/(gain) 1 781 n/a n/a 207 n/a n/a<br />
Prior service cost/(credit) (56) n/a n/a (224) n/a n/a<br />
Transiti<strong>on</strong> obligati<strong>on</strong>/(asset) (11) n/a n/a – n/a n/a<br />
Total amount recognised 1 714 n/a n/a (17) n/a n/a<br />
<strong>Unilever</strong> <str<strong>on</strong>g>Annual</str<strong>on</strong>g> Report <strong>on</strong> Form 20-F <strong>2006</strong> 129<br />
Financial Statements (c<strong>on</strong>tinued)
Financial Statements (c<strong>on</strong>tinued)<br />
Notes to the c<strong>on</strong>solidated accounts <strong>Unilever</strong> Group<br />
34 Divergences from United States GAAP (c<strong>on</strong>tinued)<br />
€ milli<strong>on</strong> € milli<strong>on</strong><br />
Other post-<br />
Pensi<strong>on</strong> employment<br />
Estimated amortisati<strong>on</strong> amounts from accumulated plans benefit plans<br />
other comprehensive income into net periodic benefit cost during 2007 2007 2007<br />
Actuarial loss/(gain) 89 4<br />
Prior service cost/(credit) 2 (23)<br />
Transiti<strong>on</strong> obligati<strong>on</strong>/(asset) (35) –<br />
Total 56 (19)<br />
Expected cash flows<br />
During 2007, net of refunds, <strong>Unilever</strong> currently expects to make cash c<strong>on</strong>tributi<strong>on</strong>s of €371 milli<strong>on</strong> to funded defined benefit plans.<br />
This includes both mandatory and discreti<strong>on</strong>ary payments. In additi<strong>on</strong>, a further €82 milli<strong>on</strong> is expected to be c<strong>on</strong>tributed to defined<br />
c<strong>on</strong>tributi<strong>on</strong> plans.<br />
The table below shows the expected benefit payments from defined benefit plans. The benefits paid from funded plans include amounts<br />
funded by employee c<strong>on</strong>tributi<strong>on</strong>s. The benefits paid in respect of unfunded plans are made from the Group’s cash resources.<br />
€ milli<strong>on</strong> € milli<strong>on</strong> € milli<strong>on</strong><br />
Pensi<strong>on</strong> benefits Other benefits<br />
Federal subsidy<br />
Expected benefit payments Funded Unfunded Unfunded Unfunded<br />
2007 909 225 99 6<br />
2008 928 207 101 6<br />
2009 960 216 105 6<br />
2010 971 222 108 7<br />
2011 999 228 111 7<br />
2012-2016 5 302 1 262 557 36<br />
Effect of implementing FAS 158<br />
The following table shows the incremental effect of adopting FAS 158 as at 31 December <strong>2006</strong>:<br />
130 <strong>Unilever</strong> <str<strong>on</strong>g>Annual</str<strong>on</strong>g> Report <strong>on</strong> Form 20-F <strong>2006</strong><br />
€ milli<strong>on</strong> € milli<strong>on</strong> € milli<strong>on</strong><br />
Before Adjustments After<br />
adopting to adopt adopting<br />
FAS 158 FAS 158 FAS 158<br />
Assets:<br />
Current benefit asset – 50 50<br />
N<strong>on</strong>-current benefit asset 1 153 502 1 655<br />
Intangible asset 13 (13) –<br />
Deferred tax asset 611 (5) 606<br />
Liabilities:<br />
Current benefit liability (308) – (308)<br />
N<strong>on</strong>-current benefit liability (3 679) (593) (4 272)<br />
Shareholders’ equity:<br />
AOCI 1 144 (50) 1 094<br />
Deferred tax<br />
Under IFRS, a provisi<strong>on</strong> is made <strong>on</strong> unremitted earnings of c<strong>on</strong>trolled group companies to the extent that the distributi<strong>on</strong>s are c<strong>on</strong>sidered<br />
probable. US GAAP requires full provisi<strong>on</strong> to be made assuming all earnings will be distributed, unless those earnings can be recovered tax-free<br />
or will be permanently reinvested in the c<strong>on</strong>trolled group company.<br />
Under IFRS, deferred tax <strong>on</strong> share-based compensati<strong>on</strong> is provided based <strong>on</strong> the actual tax credit expected to be received using the fair market<br />
value of the share price at the year end (the intrinsic value). The deferred tax is credited to the income statement to the extent of the tax<br />
recognised <strong>on</strong> the share-based compensati<strong>on</strong> charge with the excess recognised directly in equity. Under US GAAP, up<strong>on</strong> adopti<strong>on</strong> of<br />
FAS 123(R), ‘Share Based Payments’, deferred tax is recognised to the extent of the cumulative amount of compensati<strong>on</strong> cost recognised<br />
through the income statement. Up<strong>on</strong> exercise, the deferred tax adjustment required is recognised in the income statement or equity, dependent<br />
<strong>on</strong> whether a windfall pool exists or not.
Notes to the c<strong>on</strong>solidated accounts <strong>Unilever</strong> Group<br />
34 Divergences from United States GAAP (c<strong>on</strong>tinued)<br />
Profit or loss <strong>on</strong> disposal of group companies<br />
Under both IFRS and US GAAP, <strong>Unilever</strong> calculates profit or loss <strong>on</strong> sale of group companies net of goodwill included <strong>on</strong> the balance sheet and<br />
after the write-back of cumulative currency retranslati<strong>on</strong> differences. Under previous GAAP, goodwill and intangible assets purchased prior to<br />
1 January 1998 were written off in the year of acquisiti<strong>on</strong> as a movement in profits retained. Under US GAAP, such goodwill and intangible<br />
assets were capitalised and, prior to 1 January 2002, were amortised over their useful lives. These different accounting treatments give rise<br />
to differences between net profit or loss calculated under IFRS and that calculated under US GAAP. In <strong>2006</strong>, the additi<strong>on</strong>al goodwill and<br />
intangibles recorded under US GAAP for disposals during the year means that the disposal profit was €167 milli<strong>on</strong> (2005: €217 milli<strong>on</strong>;<br />
2004: €11 milli<strong>on</strong>) lower than that <str<strong>on</strong>g>report</str<strong>on</strong>g>ed under IFRS.<br />
Under IFRS, cumulative currency retranslati<strong>on</strong> differences arising from the transiti<strong>on</strong> date to IFRS of 1 January 2004 are included in the<br />
calculati<strong>on</strong> whereas under US GAAP the profit or loss <strong>on</strong> disposal includes cumulative currency retranslati<strong>on</strong> differences which have arisen<br />
since the date that the businesses were originally acquired.<br />
Currency retranslati<strong>on</strong><br />
Under IFRS, the gain from cumulative translati<strong>on</strong> differences arising from the partial repayment of capital of a subsidiary is recognised within<br />
the income statement. Under US GAAP, currency translati<strong>on</strong> gains and losses are <strong>on</strong>ly recycled to the income statement <strong>on</strong> the sale or up<strong>on</strong><br />
the complete or substantially complete liquidati<strong>on</strong> of the investment.<br />
Financial instruments<br />
From 1 January 2005, <strong>Unilever</strong> recognises all derivative financial instruments <strong>on</strong> the balance sheet at fair value and applies hedge accounting to<br />
a porti<strong>on</strong> of its portfolio of derivative financial instruments, meaning that changes in the fair value of derivative financial instruments that are<br />
designated and effective as hedges of future cash flows are recognised directly in equity and any ineffective porti<strong>on</strong> is recognised immediately<br />
in the income statement. This is similar to requirements under FAS 133, ‘Accounting for Derivatives and Hedging Activities’.<br />
Prior to the adopti<strong>on</strong> of IAS 32 and IAS 39 <strong>on</strong> 1 January 2005, <strong>Unilever</strong> applied hedge accounting to its portfolio of derivative financial<br />
instruments, meaning that changes in the value of forward exchange c<strong>on</strong>tracts were recognised in the results in the same period as changes in<br />
the values of the assets and liabilities they were intended to hedge. Interest payments and receipts arising from interest rate derivatives such as<br />
swaps and forward rate agreements were matched to those arising from underlying debt and investment positi<strong>on</strong>s. Payments made or received<br />
in respect of the early terminati<strong>on</strong> of derivative instruments were spread over the original life of the instrument so l<strong>on</strong>g as the underlying<br />
exposure c<strong>on</strong>tinues to exist.<br />
Prior to 1 January 2005, <strong>Unilever</strong> had not designated any of its derivative financial instruments as qualifying hedge instruments under FAS 133<br />
and accordingly, under US GAAP, all derivative financial instruments were valued at fair value with changes in fair value reflected in the income<br />
statement.<br />
Sale and leaseback<br />
The test for determining if an asset qualifies for treatment as a sale in a sale and leaseback transacti<strong>on</strong> is stricter under US GAAP than that<br />
under IFRS, in particular where the lessee has c<strong>on</strong>tinuing involvement. As a result, certain sale and leaseback transacti<strong>on</strong>s entered into by<br />
<strong>Unilever</strong> are reversed for the purposes of US GAAP <str<strong>on</strong>g>report</str<strong>on</strong>g>ing.<br />
Other<br />
Other equity differences relate to joint ventures and associates, biological assets, preference shares, borrowing costs, outsourcing c<strong>on</strong>tracts, sale<br />
and leaseback and financial instruments. Other net profit differences relate to biological assets, dividends <strong>on</strong> preference shares, joint ventures<br />
and associates, borrowing costs and outsourcing c<strong>on</strong>tracts.<br />
Share-based payments<br />
<strong>Unilever</strong> has adopted FAS 123(R) as of 1 January <strong>2006</strong> <strong>on</strong> a prospective basis. Since the Group had already voluntarily adopted the fair value<br />
measurements from FAS 123 in prior years, the adopti<strong>on</strong> of this Standard has had no material impact <strong>on</strong> the c<strong>on</strong>solidated results from<br />
operati<strong>on</strong>s and financial positi<strong>on</strong> of <strong>Unilever</strong>.<br />
Recent accounting developments<br />
In June <strong>2006</strong>, the FASB issued FASB Interpretati<strong>on</strong> No. 48 (FIN 48), ‘Accounting for Uncertainty in Income Taxes’. The provisi<strong>on</strong>s of FIN 48 will<br />
be effective for all outstanding tax positi<strong>on</strong>s <strong>on</strong> adopti<strong>on</strong>, which for <strong>Unilever</strong> is 1 January 2007. FIN 48 prescribes a recogniti<strong>on</strong> threshold and<br />
measurement attribute for the financial statement recogniti<strong>on</strong> and measurement of a tax positi<strong>on</strong> taken or expected to be taken in a tax return.<br />
The impact of FIN 48 <strong>on</strong> the c<strong>on</strong>solidated results of the operati<strong>on</strong>s and financial positi<strong>on</strong> of <strong>Unilever</strong> is currently being assessed by the Group.<br />
In October <strong>2006</strong>, FASB issued FAS 157, ‘Fair Value Measurement’. The standard addresses how companies should measure fair value when they<br />
are required to use a fair value measure for recogniti<strong>on</strong> or disclosure purposes, and move toward a market-based measure instead of an entitybased<br />
measure, and expands disclosure requirements about fair value measurements. The standard is effective for fiscal years beginning after<br />
15 November 2007 and will be adopted by <strong>Unilever</strong> as at 1 January 2008. The impact of FAS 157 <strong>on</strong> the c<strong>on</strong>solidated results of operati<strong>on</strong>s and<br />
financial positi<strong>on</strong> of <strong>Unilever</strong> is currently being assessed by the Group.<br />
In February <strong>2006</strong>, the FASB issued FAS 155, ‘Accounting for Certain Hybrid Financial Instruments, an amendment of FAS 133 and FAS 140’.<br />
This statement simplifies accounting for certain hybrid financial instruments by permitting fair value remeasurement for any hybrid financial<br />
instrument that c<strong>on</strong>tains an embedded derivative that otherwise would require bifurcati<strong>on</strong>. FAS 155 is effective for <strong>Unilever</strong> for all financial<br />
instruments acquired, issued, or subject to a remeasurement (new basis) event occurring after 1 January 2007. The adopti<strong>on</strong> is not expected<br />
to have a material effect <strong>on</strong> the c<strong>on</strong>solidated results of operati<strong>on</strong>s or financial positi<strong>on</strong> of <strong>Unilever</strong>.<br />
In February 2007, the FASB issued FAS 159 ‘The Fair Value Opti<strong>on</strong> for Financial Assets and Financial Liabilities’. The standard provides companies<br />
with an opti<strong>on</strong> to <str<strong>on</strong>g>report</str<strong>on</strong>g> selected financial assets and liabilities at fair value. FAS 159 is effective for fiscal years beginning after 15 November<br />
2007, and will be adopted by <strong>Unilever</strong> as at 1 January 2008. The impact <strong>on</strong> the c<strong>on</strong>solidated results of operati<strong>on</strong>s and financial positi<strong>on</strong> of<br />
<strong>Unilever</strong> is currently being assessed by the Group.<br />
Documents <strong>on</strong> display in the United States<br />
<strong>Unilever</strong> files and furnishes <str<strong>on</strong>g>report</str<strong>on</strong>g>s and in<strong>form</strong>ati<strong>on</strong> with the United States Securities and Exchange Commissi<strong>on</strong> (SEC). Such <str<strong>on</strong>g>report</str<strong>on</strong>g>s and<br />
in<strong>form</strong>ati<strong>on</strong> can be inspected and copied at the SEC’s public reference facilities in Washingt<strong>on</strong> DC, Chicago and New York. Certain of our<br />
<str<strong>on</strong>g>report</str<strong>on</strong>g>s and other in<strong>form</strong>ati<strong>on</strong> that we file or furnish to the SEC are also available to the public over the internet <strong>on</strong> the SEC’s website at<br />
www.sec.gov.<br />
<strong>Unilever</strong> <str<strong>on</strong>g>Annual</str<strong>on</strong>g> Report <strong>on</strong> Form 20-F <strong>2006</strong> 131<br />
Financial Statements (c<strong>on</strong>tinued)
Financial Statements (c<strong>on</strong>tinued)<br />
Notes to the c<strong>on</strong>solidated accounts <strong>Unilever</strong> Group<br />
35 Additi<strong>on</strong>al in<strong>form</strong>ati<strong>on</strong> for US investors<br />
Presented below is additi<strong>on</strong>al in<strong>form</strong>ati<strong>on</strong> required for <str<strong>on</strong>g>report</str<strong>on</strong>g>ing in the United States, prepared <strong>on</strong> an IFRS basis:<br />
(i) Segment in<strong>form</strong>ati<strong>on</strong>; (ii) Summarised presentati<strong>on</strong> of the NV and PLC parts of the Group; and (iii) Guarantor statements.<br />
(i) Segment in<strong>form</strong>ati<strong>on</strong> (prepared <strong>on</strong> an IFRS basis)<br />
<strong>Unilever</strong> has reviewed the extent of its business with major customers, and has c<strong>on</strong>cluded that it has no customers that would require separate<br />
disclosure during the <str<strong>on</strong>g>report</str<strong>on</strong>g>ing periods covered by this filing.<br />
For management <str<strong>on</strong>g>report</str<strong>on</strong>g>ing purposes, <strong>Unilever</strong> uses a number of measures of segment per<strong>form</strong>ance at c<strong>on</strong>stant average rates of exchange (that<br />
is, the same rates as in the preceding year). The internal management measure of profit that is most c<strong>on</strong>sistent with operating profit <str<strong>on</strong>g>report</str<strong>on</strong>g>ed<br />
in the accounts is ‘Trading Result’. This differs from operating profit, mainly because Trading Result includes a number of statistical and other<br />
adjustments including the applicati<strong>on</strong> of an inflati<strong>on</strong> charge <strong>on</strong> working capital which is added back to arrive at operating profit.<br />
€ milli<strong>on</strong> € milli<strong>on</strong> € milli<strong>on</strong> € milli<strong>on</strong><br />
The Asia<br />
Analysis by geographical segment Europe Americas Africa Total<br />
<strong>2006</strong><br />
Turnover<br />
At c<strong>on</strong>stant 2005 exchange rates 14 967 13 591 10 983 39 541<br />
Exchange rate adjustments 33 188 (120) 101<br />
At current <strong>2006</strong> exchange rates<br />
Trading result<br />
15 000 13 779 10 863 39 642<br />
At c<strong>on</strong>stant 2005 exchange rates 1 966 2 096 1 320 5 382<br />
Exchange rate adjustments 5 20 (9) 16<br />
At current <strong>2006</strong> exchange rates 1 971 2 116 1 311 5 398<br />
Other adjustments 10<br />
Operating profit 5 408<br />
2005<br />
Turnover<br />
At c<strong>on</strong>stant 2004 exchange rates 14 879 12 715 10 281 37 875<br />
Exchange rate adjustments 61 464 1 526<br />
At current 2005 exchange rates<br />
Trading result<br />
14 940 13 179 10 282 38 401<br />
At c<strong>on</strong>stant 2004 exchange rates 2 101 1 942 1 234 5 277<br />
Exchange rate adjustments 6 58 (3) 61<br />
At current 2005 exchange rates 2 107 2 000 1 231 5 338<br />
Other adjustments (264)<br />
Operating profit 5 074<br />
2004<br />
Turnover<br />
At c<strong>on</strong>stant 2003 exchange rates 15 246 13 380 10 122 38 748<br />
Exchange rate adjustments 6 (1 084) (502) (1 580)<br />
At current 2004 exchange rates<br />
Trading result<br />
15 252 12 296 9 620 37 168<br />
At c<strong>on</strong>stant 2003 exchange rates 2 236 2 153 1 090 5 479<br />
Exchange rate adjustments 5 (186) (57) (238)<br />
At current 2004 exchange rates 2 241 1 967 1 033 5 241<br />
Other adjustments (1 260)<br />
Operating profit 3 981<br />
Depreciati<strong>on</strong>, amortisati<strong>on</strong> and impairment<br />
<strong>2006</strong><br />
At c<strong>on</strong>stant 2005 exchange rates (442) (313) (200) (955)<br />
Exchange rate adjustments (1) (4) 2 (3)<br />
At current <strong>2006</strong> exchange rates<br />
2005<br />
(443) (317) (198) (958)<br />
At c<strong>on</strong>stant 2004 exchange rates (442) (630) (184) (1 256)<br />
Exchange rate adjustments – (8) (2) (10)<br />
At current 2005 exchange rates<br />
2004<br />
(442) (638) (186) (1 266)<br />
At c<strong>on</strong>stant 2003 exchange rates (613) (1 236) (297) (2 146)<br />
Exchange rate adjustments – 116 14 130<br />
At current 2004 exchange rates (613) (1 120) (283) (2 016)<br />
132 <strong>Unilever</strong> <str<strong>on</strong>g>Annual</str<strong>on</strong>g> Report <strong>on</strong> Form 20-F <strong>2006</strong>
Notes to the c<strong>on</strong>solidated accounts <strong>Unilever</strong> Group<br />
35 Additi<strong>on</strong>al in<strong>form</strong>ati<strong>on</strong> for US investors (c<strong>on</strong>tinued)<br />
(i) Segment in<strong>form</strong>ati<strong>on</strong> (c<strong>on</strong>tinued)<br />
€ milli<strong>on</strong> € milli<strong>on</strong> € milli<strong>on</strong> € milli<strong>on</strong><br />
The Asia<br />
Capital expenditure Europe Americas Africa Total<br />
<strong>2006</strong><br />
At c<strong>on</strong>stant 2005 exchange rates 507 389 296 1 192<br />
Exchange rate adjustments 4 7 (2) 9<br />
At current <strong>2006</strong> exchange rates<br />
2005<br />
511 396 294 1 201<br />
At c<strong>on</strong>stant 2004 exchange rates 446 291 298 1 035<br />
Exchange rate adjustments 1 14 – 15<br />
At current 2005 exchange rates 447 305 298 1 050<br />
€ milli<strong>on</strong> € milli<strong>on</strong> € milli<strong>on</strong> € milli<strong>on</strong><br />
United<br />
Kingdom & United<br />
Analysis by geographical area (a) Netherlands States Other Total<br />
Turnover<br />
<strong>2006</strong><br />
At c<strong>on</strong>stant 2005 exchange rates 3 703 7 688 28 150 39 541<br />
Exchange rate adjustments 7 (61) 155 101<br />
At current <strong>2006</strong> exchange rates 3 710 7 627 28 305 39 642<br />
2005<br />
At c<strong>on</strong>stant 2004 exchange rates 3 700 7 587 26 588 37 875<br />
Exchange rate adjustments (21) (37) 584 526<br />
At current 2005 exchange rates 3 679 7 550 27 172 38 401<br />
2004<br />
At c<strong>on</strong>stant 2003 exchange rates 3 779 8 093 26 876 38 748<br />
Exchange rate adjustments 52 (732) (900) (1 580)<br />
At current 2004 exchange rates 3 831 7 361 25 976 37 168<br />
Property, plant and equipment<br />
<strong>2006</strong> 967 1 060 4 249 6 276<br />
2005 1 018 1 140 4 334 6 492<br />
(a) For the United Kingdom and the Netherlands, which are the home countries of the parent companies, the combined operating profit in<br />
<strong>2006</strong> was €555 milli<strong>on</strong> (2005: €648 milli<strong>on</strong>; 2004: €667 milli<strong>on</strong>).<br />
<strong>Unilever</strong> <str<strong>on</strong>g>Annual</str<strong>on</strong>g> Report <strong>on</strong> Form 20-F <strong>2006</strong> 133<br />
Financial Statements (c<strong>on</strong>tinued)
Financial Statements (c<strong>on</strong>tinued)<br />
Notes to the c<strong>on</strong>solidated accounts <strong>Unilever</strong> Group<br />
35 Additi<strong>on</strong>al in<strong>form</strong>ati<strong>on</strong> for US investors (c<strong>on</strong>tinued)<br />
(ii) Summarised presentati<strong>on</strong> of the NV and PLC parts of the Group (prepared <strong>on</strong> an IFRS basis)<br />
NV and PLC and their group companies c<strong>on</strong>stitute a single <str<strong>on</strong>g>report</str<strong>on</strong>g>ing entity for the purposes of presenting c<strong>on</strong>solidated accounts. The following<br />
supplemental in<strong>form</strong>ati<strong>on</strong> shows the c<strong>on</strong>solidated income statement and balance sheet of the Group analysed according to the relative legal<br />
ownership of individual entities by NV or PLC.<br />
€ milli<strong>on</strong> € milli<strong>on</strong> € milli<strong>on</strong> € milli<strong>on</strong> € milli<strong>on</strong> € milli<strong>on</strong><br />
NV NV NV PLC PLC PLC<br />
Income statement for the year ended 31 December <strong>2006</strong> 2005 2004 <strong>2006</strong> 2005 2004<br />
C<strong>on</strong>tinuing operati<strong>on</strong>s:<br />
Turnover 27 376 26 479 25 328 12 266 11 922 11 840<br />
Operating profit 3 608 3 552 2 666 1 800 1 522 1 315<br />
Net finance costs (686) (470) (375) (35) (143) (248)<br />
Share in net profit of joint ventures 59 35 30 19 12 9<br />
Share in net profit of associates – (12) 8 36 (13) (6)<br />
Other income from n<strong>on</strong>-current investments 13 20 35 17 13 19<br />
Profit before taxati<strong>on</strong> 2 994 3 125 2 364 1 837 1 391 1 089<br />
Taxati<strong>on</strong> (727) (774) (471) (419) (407) (254)<br />
Net profit from c<strong>on</strong>tinuing operati<strong>on</strong>s 2 267 2 351 1 893 1 418 984 835<br />
Net profit from disc<strong>on</strong>tinued operati<strong>on</strong>s 836 455 131 494 185 82<br />
Net profit 3 103 2 806 2 024 1 912 1 169 917<br />
Attributable to:<br />
Minority interest 66 57 56 204 152 130<br />
Shareholders’ equity 3 037 2 749 1 968 1 708 1 017 787<br />
€ milli<strong>on</strong> € milli<strong>on</strong> € milli<strong>on</strong> € milli<strong>on</strong><br />
NV NV PLC PLC<br />
Balance sheet as at 31 December <strong>2006</strong> 2005 <strong>2006</strong> 2005<br />
Goodwill and intangible assets 12 569 14 152 4 637 3 903<br />
Property, plant and equipment 3 642 4 321 2 634 2 171<br />
Pensi<strong>on</strong> asset for funded schemes in surplus 1 484 966 213 70<br />
Deferred tax assets 755 961 511 742<br />
Other n<strong>on</strong>-current assets 723 695 403 377<br />
Total n<strong>on</strong>-current assets 19 173 21 095 8 398 7 263<br />
Inventories 2 141 2 661 1 655 1 446<br />
Trade and other current receivables 2 744 3 628 1 546 1 202<br />
Cash and cash equivalents 565 941 474 588<br />
Other financial assets 143 317 219 142<br />
Assets held for sale 7 166 7 51<br />
Total current assets 5 600 7 713 3 901 3 429<br />
Borrowings due within <strong>on</strong>e year (3 925) (5 506) (437) (436)<br />
Trade payables and other current liabilities (5 469) (6 114) (3 044) (2 668)<br />
Provisi<strong>on</strong>s (806) (460) (203) (184)<br />
Liabilities associated with assets held for sale – (16) – (10)<br />
Total current liabilities (10 200) (12 096) (3 684) (3 298)<br />
Net current assets/(liabilities) (4 600) (4 383) 217 131<br />
Total assets less current liabilities 14 573 16 712 8 615 7 394<br />
Borrowings due after more than <strong>on</strong>e year 3 172 5 484 1 067 973<br />
Pensi<strong>on</strong> and post-retirement healthcare liabilities:<br />
Funded schemes in deficit 465 757 914 1 658<br />
Unfunded schemes 2 097 3 040 1 301 1 162<br />
Provisi<strong>on</strong>s 674 635 152 97<br />
Deferred tax liabilities 888 770 115 163<br />
Other n<strong>on</strong>-current liabilities 247 338 424 264<br />
Total n<strong>on</strong>-current liabilities 7 543 11 024 3 973 4 317<br />
Intra-group – NV/PLC (368) (1 932) 368 1 932<br />
Shareholders’ equity 7 360 7 571 3 870 790<br />
Minority interests 38 49 404 355<br />
Total equity 7 398 7 620 4 274 1 145<br />
Total capital employed 14 573 16 712 8 615 7 394<br />
134 <strong>Unilever</strong> <str<strong>on</strong>g>Annual</str<strong>on</strong>g> Report <strong>on</strong> Form 20-F <strong>2006</strong>
Notes to the c<strong>on</strong>solidated accounts <strong>Unilever</strong> Group<br />
35 Additi<strong>on</strong>al in<strong>form</strong>ati<strong>on</strong> for US investors (c<strong>on</strong>tinued)<br />
(iii) Guarantor statements (prepared <strong>on</strong> an IFRS basis)<br />
On 2 October 2000, NV and <strong>Unilever</strong> Capital Corporati<strong>on</strong> (UCC) filed a US $15 billi<strong>on</strong> Shelf registrati<strong>on</strong>, which is unc<strong>on</strong>diti<strong>on</strong>ally and fully<br />
guaranteed, jointly and severally, by NV, PLC and <strong>Unilever</strong> United States, Inc. (UNUS). Of the US $15 billi<strong>on</strong> Shelf registrati<strong>on</strong>, US $2.75 billi<strong>on</strong><br />
of Notes were outstanding at 31 December <strong>2006</strong> (2005: US $2.75 billi<strong>on</strong>; 2004: US $4.25 billi<strong>on</strong>) with coup<strong>on</strong>s ranging from 5.90% to<br />
7.125%. These Notes are repayable between 1 November 2010 and 15 November 2032.<br />
Provided below are the income statements, cash flow statements and balance sheets of each of the companies discussed above, together with<br />
the income statement, cash flow statement and balance sheet of n<strong>on</strong>-guarantor subsidiaries. These have been prepared under the historical<br />
cost c<strong>on</strong>venti<strong>on</strong>, and, aside from the basis of accounting for investments at net asset value (equity accounting), comply in all material respects<br />
with Internati<strong>on</strong>al Financial Reporting Standards. We have not provided rec<strong>on</strong>ciliati<strong>on</strong>s from the accounting principles used by <strong>Unilever</strong> to US<br />
GAAP for the columns relating to the guarantor entities, as such rec<strong>on</strong>ciliati<strong>on</strong>s would not materially affect an investor’s understanding of the<br />
nature of this guarantee. The financial in<strong>form</strong>ati<strong>on</strong> in respect of NV, PLC and UNUS has been prepared with all subsidiaries accounted for <strong>on</strong> an<br />
equity basis. The financial in<strong>form</strong>ati<strong>on</strong> in respect of the n<strong>on</strong>-guarantor subsidiaries has been prepared <strong>on</strong> a c<strong>on</strong>solidated basis.<br />
€ milli<strong>on</strong> € milli<strong>on</strong> € milli<strong>on</strong> € milli<strong>on</strong> € milli<strong>on</strong> € milli<strong>on</strong> € milli<strong>on</strong><br />
<strong>Unilever</strong> <strong>Unilever</strong> <strong>Unilever</strong><br />
Capital N.V. United<br />
Corporati<strong>on</strong> parent <strong>Unilever</strong> PLC States Inc. N<strong>on</strong>-<br />
Income statement subsidiary issuer/ parent subsidiary guarantor <strong>Unilever</strong><br />
for the year ended 31 December <strong>2006</strong> issuer guarantor guarantor guarantor subsidiaries Eliminati<strong>on</strong>s Group<br />
C<strong>on</strong>tinuing operati<strong>on</strong>s:<br />
Turnover – – – – 39 642 – 39 642<br />
Operating profit (1) (126) (108) (16) 5 659 – 5 408<br />
Finance income – 38 5 1 84 – 128<br />
Finance costs (169) (662) – – (59) – (890)<br />
Pensi<strong>on</strong>s and similar obligati<strong>on</strong>s – (5) – (61) 107 – 41<br />
Intercompany finance costs 187 805 (20) (29) (943) – –<br />
Dividends – 1 916 1 337 – (3 253) – –<br />
Share of net profit/(loss) of joint ventures – – – – 78 – 78<br />
Share of net profit/(loss) of associates – – – – 36 – 36<br />
Other income from n<strong>on</strong>-current investments – – – – 30 – 30<br />
Profit before taxati<strong>on</strong> 17 1 966 1 214 (105) 1 739 – 4 831<br />
Taxati<strong>on</strong> (6) (119) 16 76 (1 113) – (1 146)<br />
Net profit from c<strong>on</strong>tinuing operati<strong>on</strong>s 11 1 847 1 230 (29) 626 – 3 685<br />
Net profit from disc<strong>on</strong>tinued operati<strong>on</strong>s – – 180 – 1 150 – 1 330<br />
Equity earnings of subsidiaries – 2 898 3 335 567 – (6 800) –<br />
Net profit 11 4 745 4 745 538 1 776 (6 800) 5 015<br />
Attributable to:<br />
Minority interest – – – – 270 – 270<br />
Shareholders’ equity 11 4 745 4 745 538 1 506 (6 800) 4 745<br />
Income statement<br />
for the year ended 31 December 2005<br />
C<strong>on</strong>tinuing operati<strong>on</strong>s:<br />
Turnover – – – – 38 401 – 38 401<br />
Operating profit – 87 (61) (3) 5 051 – 5 074<br />
Finance income – 61 11 – 57 – 129<br />
Finance costs (241) (274) (2) (3) (169) – (689)<br />
Pensi<strong>on</strong>s and similar obligati<strong>on</strong>s – (5) – (61) 13 – (53)<br />
Intercompany finance costs 256 509 (11) (40) (714) – –<br />
Dividends – 1 043 856 – (1 899) – –<br />
Share of net profit/(loss) of joint ventures – – – – 47 – 47<br />
Share of net profit/(loss) of associates – – – – (25) – (25)<br />
Other income from n<strong>on</strong>-current investments – – – – 33 – 33<br />
Profit before taxati<strong>on</strong> 15 1 421 793 (107) 2 394 – 4 516<br />
Taxati<strong>on</strong> (5) (118) 36 45 (1 139) – (1 181)<br />
Net profit from c<strong>on</strong>tinuing operati<strong>on</strong>s 10 1 303 829 (62) 1 255 – 3 335<br />
Net profit from disc<strong>on</strong>tinued operati<strong>on</strong>s – – – – 640 – 640<br />
Equity earnings of subsidiaries – 2 463 2 937 732 – (6 132) –<br />
Net profit 10 3 766 3 766 670 1 895 (6 132) 3 975<br />
Attributable to:<br />
Minority interest – – – – 209 – 209<br />
Shareholders’ equity 10 3 766 3 766 670 1 686 (6 132) 3 766<br />
<strong>Unilever</strong> <str<strong>on</strong>g>Annual</str<strong>on</strong>g> Report <strong>on</strong> Form 20-F <strong>2006</strong> 135<br />
Financial Statements (c<strong>on</strong>tinued)
Financial Statements (c<strong>on</strong>tinued)<br />
Notes to the c<strong>on</strong>solidated accounts <strong>Unilever</strong> Group<br />
35 Additi<strong>on</strong>al in<strong>form</strong>ati<strong>on</strong> for US investors (c<strong>on</strong>tinued)<br />
(iii) Guarantor statements (c<strong>on</strong>tinued)<br />
€ milli<strong>on</strong> € milli<strong>on</strong> € milli<strong>on</strong> € milli<strong>on</strong> € milli<strong>on</strong> € milli<strong>on</strong> € milli<strong>on</strong><br />
<strong>Unilever</strong> <strong>Unilever</strong> <strong>Unilever</strong><br />
Capital N.V. United<br />
Corporati<strong>on</strong> parent <strong>Unilever</strong> PLC States Inc. N<strong>on</strong>-<br />
Income statement subsidiary issuer/ parent subsidiary guarantor <strong>Unilever</strong><br />
for the year ended 31 December 2004 issuer guarantor guarantor guarantor subsidiaries Eliminati<strong>on</strong>s Group<br />
C<strong>on</strong>tinuing operati<strong>on</strong>s:<br />
Turnover – – – – 37 168 – 37 168<br />
Operating profit – 59 33 6 3 883 – 3 981<br />
Finance income – 26 6 – 113 – 145<br />
Finance costs (282) (160) (2) (3) (267) – (714)<br />
Pensi<strong>on</strong>s and similar obligati<strong>on</strong>s – (6) – (10) (38) – (54)<br />
Intercompany finance costs 296 211 (3) (22) (482) – –<br />
Dividends – 1 960 770 – (2 730) – –<br />
Share of net profit/(loss) of joint ventures – – – – 39 – 39<br />
Share of net profit/(loss) of associates – – – – 2 – 2<br />
Other income from n<strong>on</strong>-current investments – – – – 54 – 54<br />
Profit before taxati<strong>on</strong> 14 2 090 804 (29) 574 – 3 453<br />
Taxati<strong>on</strong> (5) 35 16 11 (782) – (725)<br />
Net profit from c<strong>on</strong>tinuing operati<strong>on</strong>s 9 2 125 820 (18) (208) – 2 728<br />
Net profit from disc<strong>on</strong>tinued operati<strong>on</strong>s – – – – 213 – 213<br />
Equity earnings of subsidiaries – 630 1 935 (76) – (2 489) –<br />
Net profit 9 2 755 2 755 (94) 5 (2 489) 2 941<br />
Attributable to:<br />
Minority interest – – – – 186 – 186<br />
Shareholders’ equity 9 2 755 2 755 (94) (181) (2 489) 2 755<br />
136 <strong>Unilever</strong> <str<strong>on</strong>g>Annual</str<strong>on</strong>g> Report <strong>on</strong> Form 20-F <strong>2006</strong>
Notes to the c<strong>on</strong>solidated accounts <strong>Unilever</strong> Group<br />
35 Additi<strong>on</strong>al in<strong>form</strong>ati<strong>on</strong> for US investors (c<strong>on</strong>tinued)<br />
(iii) Guarantor statements (c<strong>on</strong>tinued)<br />
€ milli<strong>on</strong> € milli<strong>on</strong> € milli<strong>on</strong> € milli<strong>on</strong> € milli<strong>on</strong> € milli<strong>on</strong> € milli<strong>on</strong><br />
<strong>Unilever</strong> <strong>Unilever</strong> <strong>Unilever</strong><br />
Capital N.V. United<br />
Corporati<strong>on</strong> parent <strong>Unilever</strong> PLC States Inc. N<strong>on</strong>subsidiary<br />
issuer/ parent subsidiary guarantor <strong>Unilever</strong><br />
Balance sheet as at 31 December <strong>2006</strong> issuer guarantor guarantor guarantor subsidiaries Eliminati<strong>on</strong>s Group<br />
Goodwill and intangible assets – 53 46 – 17 107 – 17 206<br />
Property, plant and equipment – – – 8 6 268 – 6 276<br />
Pensi<strong>on</strong> asset for funded schemes in surplus – – – 83 1 614 – 1 697<br />
Deferred tax assets – – – 941 325 – 1 266<br />
Other n<strong>on</strong>-current assets – – – 9 1 117 – 1 126<br />
Amounts due from group companies after <strong>on</strong>e year 2 567 2 269 67 – (4 903) – –<br />
Net assets of subsidiaries (equity accounted) – 28 775 12 453 5 946 (29 790) (17 384) –<br />
Total n<strong>on</strong>-current assets 2 567 31 097 12 566 6 987 (8 262) (17 384) 27 571<br />
Inventories – – – – 3 796 – 3 796<br />
Amounts due from group companies within <strong>on</strong>e year – 3 289 163 – (3 452) – –<br />
Trade and other current receivables – 445 34 7 3 804 – 4 290<br />
Current tax assets – – – 40 85 – 125<br />
Other financial assets – – – – 237 – 237<br />
Cash and cash equivalents – 7 – (5) 1 037 – 1 039<br />
Assets held for sale – – – – 14 – 14<br />
Total current assets – 3 741 197 42 5 521 – 9 501<br />
Borrowings due within <strong>on</strong>e year (258) (1 503) – – (2 601) – (4 362)<br />
Amounts due to group companies within <strong>on</strong>e year – (18 490) (1 363) – 19 853 – –<br />
Provisi<strong>on</strong>s – – – (1) (1 008) – (1 009)<br />
Trade payables and other current liabilities (22) (612) (39) (7) (7 254) – (7 934)<br />
Current tax liabilities (6) (38) (121) – (414) – (579)<br />
Liabilities held for sale – – – – – – –<br />
Total current liabilities (286) (20 643) (1 523) (8) 8 576 – (13 884)<br />
Net current assets/(liabilities) (286) (16 902) (1 326) 34 14 097 – (4 383)<br />
Total assets less current liabilities 2 281 14 195 11 240 7 021 5 835 (17 384) 23 188<br />
Borrowings due after <strong>on</strong>e year 2 066 866 – – 1 307 – 4 239<br />
Amounts due to group companies after <strong>on</strong>e year – 1 522 – 279 (1 801) – –<br />
Pensi<strong>on</strong> liability for funded schemes in deficit – – – 133 1 246 – 1 379<br />
Pensi<strong>on</strong> liability for unfunded schemes – 149 – 879 2 370 – 3 398<br />
Provisi<strong>on</strong>s – 340 – 2 484 – 826<br />
Deferred tax liabilities – 27 10 62 904 – 1 003<br />
Other n<strong>on</strong>-current liabilities – 61 – 193 417 – 671<br />
Total n<strong>on</strong>-current liabilities 2 066 2 965 10 1 548 4 927 – 11 516<br />
Shareholders’ equity attributable to:<br />
PLC – 3 807 – – – (3 807) –<br />
NV – – 7 423 – – (7 423) –<br />
Called up share capital – 274 210 – – – 484<br />
Share premium account – 25 140 – – – 165<br />
Other reserves (4) (1 280) (863) (467) (418) 889 (2 143)<br />
Retained profit 219 8 404 4 320 5 940 884 (7 043) 12 724<br />
Total shareholders’ equity 215 11 230 11 230 5 473 466 (17 384) 11 230<br />
Minority interests – – – – 442 – 442<br />
Total equity 215 11 230 11 230 5 473 908 (17 384) 11 672<br />
Total capital employed 2 281 14 195 11 240 7 021 5 835 (17 384) 23 188<br />
<strong>Unilever</strong> <str<strong>on</strong>g>Annual</str<strong>on</strong>g> Report <strong>on</strong> Form 20-F <strong>2006</strong> 137<br />
Financial Statements (c<strong>on</strong>tinued)
Financial Statements (c<strong>on</strong>tinued)<br />
Notes to the c<strong>on</strong>solidated accounts <strong>Unilever</strong> Group<br />
35 Additi<strong>on</strong>al in<strong>form</strong>ati<strong>on</strong> for US investors (c<strong>on</strong>tinued)<br />
(iii) Guarantor statements (c<strong>on</strong>tinued)<br />
€ milli<strong>on</strong> € milli<strong>on</strong> € milli<strong>on</strong> € milli<strong>on</strong> € milli<strong>on</strong> € milli<strong>on</strong> € milli<strong>on</strong><br />
<strong>Unilever</strong> <strong>Unilever</strong> <strong>Unilever</strong><br />
Capital N.V. United<br />
Corporati<strong>on</strong> parent <strong>Unilever</strong> PLC States Inc. N<strong>on</strong>subsidiary<br />
issuer/ parent subsidiary guarantor <strong>Unilever</strong><br />
Balance sheet as at 31 December 2005 issuer guarantor guarantor guarantor subsidiaries Eliminati<strong>on</strong>s Group<br />
Goodwill and intangible assets – 32 54 – 17 969 – 18 055<br />
Property, plant and equipment – – – 6 6 486 – 6 492<br />
Pensi<strong>on</strong> asset for funded schemes in surplus – – – 67 969 – 1 036<br />
Deferred tax assets – – – 1 012 691 – 1 703<br />
Other n<strong>on</strong>-current assets – 16 – 11 1 045 – 1 072<br />
Amounts due from group companies after <strong>on</strong>e year 2 512 6 628 102 1 281 (10 523) – –<br />
Net assets of subsidiaries (equity accounted) – 11 176 9 823 6 234 (14 593) (12 640) –<br />
Total n<strong>on</strong>-current assets 2 512 17 852 9 979 8 611 2 044 (12 640) 28 358<br />
Inventories – – – – 4 107 – 4 107<br />
Amounts due from group companies within <strong>on</strong>e year – 19 619 294 – (19 913) – –<br />
Trade and other current receivables – 635 1 34 4 160 – 4 830<br />
Current tax assets – – – 43 81 – 124<br />
Other financial assets – – – – 335 – 335<br />
Cash and cash equivalents 35 163 – (3) 1 334 – 1 529<br />
Assets held for sale – – – – 217 – 217<br />
Total current assets 35 20 417 295 74 (9 679) – 11 142<br />
Borrowings due within <strong>on</strong>e year – (4 548) – – (1 394) – (5 942)<br />
Amounts due to group companies within <strong>on</strong>e year – (22 027) (1 871) – 23 898 – –<br />
Provisi<strong>on</strong>s – (16) – (5) (623) – (644)<br />
Trade payables and other current liabilities (31) (514) (4) (100) (7 579) – (8 228)<br />
Current tax liabilities – (20) (26) – (508) – (554)<br />
Liabilities held for sale – – – – (26) – (26)<br />
Total current liabilities (31) (27 125) (1 901) (105) 13 768 – (15 394)<br />
Net current assets/(liabilities) 4 (6 708) (1 606) (31) 4 089 – (4 252)<br />
Total assets less current liabilities 2 516 11 144 8 373 8 580 6 133 (12 640) 24 106<br />
Borrowings due after <strong>on</strong>e year 2 296 2 442 – – 1 719 – 6 457<br />
Amounts due to group companies after <strong>on</strong>e year – – – – – – –<br />
Pensi<strong>on</strong> liability for funded schemes in deficit – – – 372 2 043 – 2 415<br />
Pensi<strong>on</strong> liability for unfunded schemes – 159 – 1 260 2 783 – 4 202<br />
Provisi<strong>on</strong>s – 32 – 3 697 – 732<br />
Deferred tax liabilities – 94 12 – 827 – 933<br />
Other n<strong>on</strong>-current liabilities – 56 – 202 344 – 602<br />
Total n<strong>on</strong>-current liabilities 2 296 2 783 12 1 837 8 413 – 15 341<br />
Shareholders’ equity attributable to:<br />
PLC – 790 – – – (790) –<br />
NV – – 7 571 – – (7 571) –<br />
Called up share capital – 290 222 – – – 512<br />
Share premium account – 25 137 – – – 162<br />
Other reserves (5) (1 465) (863) (291) (393) 689 (2 328)<br />
Retained profit 225 8 721 1 294 7 034 (2 291) (4 968) 10 015<br />
Total shareholders’ equity 220 8 361 8 361 6 743 (2 684) (12 640) 8 361<br />
Minority interests – – – – 404 – 404<br />
Total equity 220 8 361 8 361 6 743 (2 280) (12 640) 8 765<br />
Total capital employed 2 516 11 144 8 373 8 580 6 133 (12 640) 24 106<br />
138 <strong>Unilever</strong> <str<strong>on</strong>g>Annual</str<strong>on</strong>g> Report <strong>on</strong> Form 20-F <strong>2006</strong>
Notes to the c<strong>on</strong>solidated accounts <strong>Unilever</strong> Group<br />
35 Additi<strong>on</strong>al in<strong>form</strong>ati<strong>on</strong> for US investors (c<strong>on</strong>tinued)<br />
(iii) Guarantor statements (c<strong>on</strong>tinued)<br />
€ milli<strong>on</strong> € milli<strong>on</strong> € milli<strong>on</strong> € milli<strong>on</strong> € milli<strong>on</strong> € milli<strong>on</strong> € milli<strong>on</strong><br />
<strong>Unilever</strong> <strong>Unilever</strong> <strong>Unilever</strong><br />
Capital N.V. United<br />
Corporati<strong>on</strong> parent <strong>Unilever</strong> PLC States Inc. N<strong>on</strong>-<br />
Cash flow statement subsidiary issuer/ parent subsidiary guarantor <strong>Unilever</strong><br />
for the year ended 31 December <strong>2006</strong> issuer guarantor guarantor guarantor subsidiaries Eliminati<strong>on</strong>s Group<br />
Cash flow from operating activities 1 (336) (17) (408) 6 334 – 5 574<br />
Income tax paid – (163) 42 (33) (909) – (1 063)<br />
Net cash flow from operating activities 1 (499) 25 (441) 5 425 – 4 511<br />
Interest received 187 995 5 – 33 (1 095) 125<br />
Net capital expenditure – (28) – (3) (903) – (934)<br />
Acquisiti<strong>on</strong>s and disposals – – 212 – 1 565 – 1 777<br />
Other investing activities (324) 3 799 – 480 (7 302) 3 534 187<br />
Net cash flow from/(used in) investing activities (137) 4 766 217 477 (6 607) 2 439 1 155<br />
Dividends paid <strong>on</strong> ordinary share capital – 460 154 – (3 216) – (2 602)<br />
Interest and preference dividends paid (170) (349) (20) (28) (1 133) 1 095 (605)<br />
Change in borrowings and finance leases 274 (4 621) (420) – 5 020 (3 534) (3 281)<br />
Movement <strong>on</strong> treasury stock – 88 48 (15) (23) – 98<br />
Other finance activities – – – – (182) – (182)<br />
Net cash flow from/(used in) financing activities 104 (4 422) (238) (43) 466 (2 439) (6 572)<br />
Net increase/(decrease) in cash and<br />
cash equivalents (32) (155) 4 (7) (716) – (906)<br />
Cash and cash equivalents at the beginning<br />
of the year 35 162 – (3) 1 071 – 1 265<br />
Effect of foreign exchange rate changes (3) – – 5 349 – 351<br />
Cash and cash equivalents at the end of the year – 7 4 (5) 704 – 710<br />
Cash flow statement<br />
for the year ended 31 December 2005<br />
Cash flow from operating activities – (5) (156) 33 6 052 – 5 924<br />
Income tax paid – (86) (19) (177) (1 289) – (1 571)<br />
Net cash flow from operating activities – (91) (175) (144) 4 763 – 4 353<br />
Interest received 253 285 10 – (106) (312) 130<br />
Net capital expenditure – (24) (3) (2) (784) – (813)<br />
Acquisiti<strong>on</strong>s and disposals – – – – 784 – 784<br />
Other investing activities 1 796 (689) – 189 443 (1 325) 414<br />
Net cash flow from/(used in) investing activities 2 049 (428) 7 187 337 (1 637) 515<br />
Dividends paid <strong>on</strong> ordinary share capital – 28 37 – (1 869) – (1 804)<br />
Interest and preference dividends paid (253) (181) (7) (43) (471) 312 (643)<br />
Change in borrowings and finance leases (1 774) 1 623 309 – (2 363) 1 325 (880)<br />
Movement <strong>on</strong> treasury stock – (1 068) (171) – (37) – (1 276)<br />
Other finance activities – – – – (218) – (218)<br />
Net cash flow from/(used in) financing activities (2 027) 402 168 (43) (4 958) 1 637 (4 821)<br />
Net increase/(decrease) in cash and<br />
cash equivalents 22 (117) – – 142 – 47<br />
Cash and cash equivalents at the beginning<br />
of the year 10 279 – (3) 1 120 – 1 406<br />
Effect of foreign exchange rate changes 3 – – – (191) – (188)<br />
Cash and cash equivalents at the end of the year 35 162 – (3) 1 071 – 1 265<br />
<strong>Unilever</strong> <str<strong>on</strong>g>Annual</str<strong>on</strong>g> Report <strong>on</strong> Form 20-F <strong>2006</strong> 139<br />
Financial Statements (c<strong>on</strong>tinued)
Financial Statements (c<strong>on</strong>tinued)<br />
Notes to the c<strong>on</strong>solidated accounts <strong>Unilever</strong> Group<br />
35 Additi<strong>on</strong>al in<strong>form</strong>ati<strong>on</strong> for US investors (c<strong>on</strong>tinued)<br />
(iii) Guarantor statements (c<strong>on</strong>tinued)<br />
€ milli<strong>on</strong> € milli<strong>on</strong> € milli<strong>on</strong> € milli<strong>on</strong> € milli<strong>on</strong> € milli<strong>on</strong> € milli<strong>on</strong><br />
<strong>Unilever</strong> <strong>Unilever</strong> <strong>Unilever</strong><br />
Capital N.V. United<br />
Corporati<strong>on</strong> parent <strong>Unilever</strong> PLC States Inc. N<strong>on</strong>-<br />
Cash flow statement subsidiary issuer/ parent subsidiary guarantor <strong>Unilever</strong><br />
for the year ended 31 December 2004 issuer guarantor guarantor guarantor subsidiaries Eliminati<strong>on</strong>s Group<br />
Cash flow from operating activities 6 58 45 (200) 7 016 – 6 925<br />
Income tax paid – (96) (126) (145) (1 011) – (1 378)<br />
Net cash flow from operating activities 6 (38) (81) (345) 6 005 – 5 547<br />
Interest received 295 356 6 – 106 (595) 168<br />
Net capital expenditure – (9) (17) (1) (842) – (869)<br />
Acquisiti<strong>on</strong>s and disposals – – – – 316 – 316<br />
Other investing activities (311) 2 375 – 372 288 (2 459) 265<br />
Net cash flow from/(used in) investing activities (16) 2 722 (11) 371 (132) (3 054) (120)<br />
Dividends paid <strong>on</strong> ordinary share capital – 971 – – (2 691) – (1 720)<br />
Interest and preference dividends paid (282) (249) (3) (24) (824) 595 (787)<br />
Change in borrowings and finance leases 302 (3 402) 116 – (2 365) 2 459 (2 890)<br />
Movement <strong>on</strong> treasury stock – (148) (21) (2) (161) – (332)<br />
Other finance activities – – – – (209) – (209)<br />
Net cash flow from/(used in) financing activities 20 (2 828) 92 (26) (6 250) 3 054 (5 938)<br />
Net increase/(decrease) in cash and<br />
cash equivalents 10 (144) – – (377) – (511)<br />
Cash and cash equivalents at the beginning<br />
of the year 1 423 – (3) 1 007 – 1 428<br />
Effect of foreign exchange rate changes (1) – – – 490 – 489<br />
Cash and cash equivalents at the end of the year 10 279 – (3) 1 120 – 1 406<br />
140 <strong>Unilever</strong> <str<strong>on</strong>g>Annual</str<strong>on</strong>g> Report <strong>on</strong> Form 20-F <strong>2006</strong>
Selected ffinancial data <strong>Unilever</strong> Group<br />
Selected financial data under IFRS<br />
In the schedules below, figures within the income statement and for earnings per share reflect the classificati<strong>on</strong> between c<strong>on</strong>tinuing and<br />
disc<strong>on</strong>tinued operati<strong>on</strong>s which is applicable for our <strong>2006</strong> <str<strong>on</strong>g>report</str<strong>on</strong>g>ing. This classificati<strong>on</strong> differs from that which would have applied under our<br />
<str<strong>on</strong>g>report</str<strong>on</strong>g>ing basis for 2005.<br />
€ milli<strong>on</strong> € milli<strong>on</strong> € milli<strong>on</strong><br />
C<strong>on</strong>solidated income statement <strong>2006</strong> 2005 2004<br />
C<strong>on</strong>tinuing operati<strong>on</strong>s:<br />
Turnover 39 642 38 401 37 168<br />
Operating profit 5 408 5 074 3 981<br />
Net finance costs (721) (613) (623)<br />
Income from n<strong>on</strong>-current investments 144 55 95<br />
Profit before taxati<strong>on</strong> 4 831 4 516 3 453<br />
Taxati<strong>on</strong> (1 146) (1 181) (725)<br />
Net profit from c<strong>on</strong>tinuing operati<strong>on</strong>s 3 685 3 335 2 728<br />
Net profit from disc<strong>on</strong>tinued operati<strong>on</strong>s 1 330 640 213<br />
Net profit 5 015 3 975 2 941<br />
Attributable to:<br />
Minority interests 270 209 186<br />
Shareholders’ equity 4 745 3 766 2 755<br />
€ € €<br />
Combined earnings per share (a) <strong>2006</strong> 2005 2004<br />
C<strong>on</strong>tinuing operati<strong>on</strong>s<br />
Basic earnings per share 1.19 1.07 0.87<br />
Diluted earnings per share 1.15 1.04 0.84<br />
Total operati<strong>on</strong>s<br />
Basic earnings per share 1.65 1.29 0.94<br />
Diluted earnings per share 1.60 1.25 0.91<br />
€ milli<strong>on</strong> € milli<strong>on</strong> € milli<strong>on</strong><br />
C<strong>on</strong>solidated balance sheet <strong>2006</strong> 2005 2004<br />
N<strong>on</strong>-current assets 27 571 28 358 26 368<br />
Current assets 9 501 11 142 10 490<br />
Current liabilities (13 884) (15 394) (14 186)<br />
Total assets less current liabilities 23 188 24 106 22 672<br />
N<strong>on</strong>-current liabilities 11 516 15 341 15 043<br />
Shareholders’ equity 11 230 8 361 7 264<br />
Minority interests 442 404 365<br />
Total equity 11 672 8 765 7 629<br />
Total capital employed 23 188 24 106 22 672<br />
€ milli<strong>on</strong> € milli<strong>on</strong> € milli<strong>on</strong><br />
C<strong>on</strong>solidated cash flow statement <strong>2006</strong> 2005 2004<br />
Net cash flow from operating activities 4 511 4 353 5 547<br />
Net cash flow from/(used in) investing activities 1 155 515 (120)<br />
Net cash flow from/(used in) financing activities (6 572) (4 821) (5 938)<br />
Net increase/(decrease) in cash and cash equivalents (906) 47 (511)<br />
Cash and cash equivalents at the beginning of the year 1 265 1 406 1 428<br />
Effect of foreign exchange rates 351 (188) 489<br />
Cash and cash equivalents at the end of the year 710 1 265 1 406<br />
Ratios and other metrics <strong>2006</strong> 2005 2004<br />
Operating margin (%) 13.6 13.2 10.7<br />
Net profit margin (%) (b) 12.0 9.8 7.4<br />
Ungeared free cash flow (€ milli<strong>on</strong>) (c) 4 222 4 011 5 346<br />
Return <strong>on</strong> invested capital (%) (c) 14.6 12.5 10.7<br />
Ratio of earnings to fixed charges (times) (d) 7.5 6.5 5.1<br />
(a) For the basis of the calculati<strong>on</strong>s of combined earnings per share see note 7 <strong>on</strong> page 87.<br />
(b) Net profit margin is expressed as net profit attributable to shareholders’ equity as a percentage of turnover from c<strong>on</strong>tinuing operati<strong>on</strong>s.<br />
(c) As defined <strong>on</strong> page 25.<br />
(d) In the ratio of earnings to fixed charges, earnings c<strong>on</strong>sist of net profit from c<strong>on</strong>tinuing operati<strong>on</strong>s excluding net profit or loss of joint<br />
ventures and associates increased by fixed charges, income taxes and dividends received from joint ventures and associates. Fixed charges<br />
c<strong>on</strong>sist of interest payable <strong>on</strong> debt and a porti<strong>on</strong> of lease costs determined to be representative of interest. This ratio takes no account of<br />
interest receivable although <strong>Unilever</strong>’s treasury operati<strong>on</strong>s involve both borrowing and depositing funds.<br />
<strong>Unilever</strong> <str<strong>on</strong>g>Annual</str<strong>on</strong>g> Report <strong>on</strong> Form 20-F <strong>2006</strong> 141<br />
Financial Statements (c<strong>on</strong>tinued)
Financial Statements (c<strong>on</strong>tinued)<br />
Selected financial data (c<strong>on</strong>tinued) <strong>Unilever</strong> Group<br />
Selected financial data under IFRS (c<strong>on</strong>tinued)<br />
€ milli<strong>on</strong> € milli<strong>on</strong> € milli<strong>on</strong><br />
By geographical area <strong>2006</strong> 2005 2004<br />
Turnover<br />
Europe 15 000 14 940 15 252<br />
The Americas 13 779 13 179 12 296<br />
Asia Africa 10 863 10 282 9 620<br />
142 <strong>Unilever</strong> <str<strong>on</strong>g>Annual</str<strong>on</strong>g> Report <strong>on</strong> Form 20-F <strong>2006</strong><br />
39 642 38 401 37 168<br />
Operating profit<br />
Europe 1 903 2 064 2 045<br />
The Americas 2 178 1 719 896<br />
Asia Africa 1 327 1 291 1 040<br />
5 408 5 074 3 981<br />
Total assets<br />
Europe 14 523 15 164 15 586<br />
The Americas 11 566 12 569 11 486<br />
Asia Africa 5 884 6 320 4 369<br />
Corporate 5 099 5 447 5 417<br />
37 072 39 500 36 858<br />
Capital expenditure<br />
Europe 511 447 497<br />
The Americas 396 305 297<br />
Asia Africa 294 298 305<br />
1 201 1 050 1 099<br />
€ milli<strong>on</strong> € milli<strong>on</strong> € milli<strong>on</strong><br />
By operati<strong>on</strong> <strong>2006</strong> 2005 2004<br />
Turnover<br />
Foods 21 345 20 889 20 566<br />
Home and Pers<strong>on</strong>al Care 18 297 17 512 16 602<br />
39 642 38 401 37 168<br />
Operating profit<br />
Foods 2 893 2 635 1 850<br />
Home and Pers<strong>on</strong>al Care 2 515 2 439 2 131<br />
5 408 5 074 3 981<br />
Total assets<br />
Foods 24 972 26 798 25 382<br />
Home and Pers<strong>on</strong>al Care 7 001 7 255 6 059<br />
Corporate 5 099 5 447 5 417<br />
37 072 39 500 36 858<br />
Capital expenditure<br />
Foods 714 572 588<br />
Home and Pers<strong>on</strong>al Care 487 478 511<br />
1 201 1 050 1 099
Selected financial data (c<strong>on</strong>tinued) <strong>Unilever</strong> Group<br />
Selected financial data under previous GAAP<br />
<strong>Unilever</strong> adopted Internati<strong>on</strong>al Financial Reporting Standards as adopted by the EU with effect from 1 January 2005, with a transiti<strong>on</strong> date of<br />
1 January 2004. In<strong>form</strong>ati<strong>on</strong> for the period from 2002 to 2004 as <str<strong>on</strong>g>report</str<strong>on</strong>g>ed under our previous accounting policies (which is not directly<br />
comparable with IFRS) is set out below and <strong>on</strong> pages 144 and 145.<br />
This in<strong>form</strong>ati<strong>on</strong> is derived from the audited c<strong>on</strong>solidated accounts of the <strong>Unilever</strong> Group for the years 2002 to 2004, and should be read in<br />
the c<strong>on</strong>text of those accounts and notes. Those accounts were prepared under the accounting policies which the Group applied prior to its<br />
adopti<strong>on</strong> of IFRS. These were based <strong>on</strong> United Kingdom accounting standards and applicable Dutch and UK law. Further in<strong>form</strong>ati<strong>on</strong> can<br />
be found in the ‘Accounting in<strong>form</strong>ati<strong>on</strong> and policies’ secti<strong>on</strong>s of the Report and Accounts for the years in questi<strong>on</strong>.<br />
The adopti<strong>on</strong>, in 2003, of UK Financial Reporting Standard 17 <strong>on</strong> pensi<strong>on</strong>s accounting was reflected by restating the c<strong>on</strong>solidated profit and<br />
loss accounts for the years ended and the balance sheets as at 31 December 2002 and 31 December 2001.<br />
€ milli<strong>on</strong> € milli<strong>on</strong> € milli<strong>on</strong><br />
C<strong>on</strong>solidated profit and loss account 2004 2003 2002<br />
Group turnover 40 169 42 693 48 270<br />
Group operating profit<br />
After charging:<br />
3 411 5 483 5 007<br />
Excepti<strong>on</strong>al items (1 595) (97) (707)<br />
Amortisati<strong>on</strong> of goodwill and intangible assets (1 086) (1 139) (1 245)<br />
Income from fixed investments 117 68 111<br />
Interest (689) (1 013) (1 065)<br />
Profit <strong>on</strong> ordinary activities before taxati<strong>on</strong> 2 839 4 538 4 053<br />
Profit <strong>on</strong> ordinary activities after taxati<strong>on</strong> 2 057 3 011 2 448<br />
Net profit 1 876 2 762 2 136<br />
Preference dividends (28) (27) (42)<br />
Dividends <strong>on</strong> ordinary capital (1 815) (1 682) (1 659)<br />
Result for the year retained 33 1 053 435<br />
Combined earnings per share €0.64 €0.94 €0.71<br />
Ordinary dividends<br />
NV – euros per €0.16 of ordinary capital 0.6300 0.5800 0.5666<br />
PLC – pounds per 3 1 ⁄9p of ordinary capital 0.4256 0.4018 0.3565<br />
€ milli<strong>on</strong> € milli<strong>on</strong> € milli<strong>on</strong><br />
C<strong>on</strong>solidated balance sheet 2004 2003 2002<br />
Goodwill and intangible assets 15 338 17 713 20 274<br />
Other fixed assets and investments 6 473 6 854 8 115<br />
Stocks 3 758 4 175 4 500<br />
Debtors 5 703 5 881 6 571<br />
Total cash and current investments 2 603 3 345 2 904<br />
Total assets 33 875 37 968 42 364<br />
Creditors due within <strong>on</strong>e year (14 570) (17 074) (19 955)<br />
Total assets less current liabilities 19 305 20 894 22 409<br />
Creditors due after <strong>on</strong>e year 7 610 9 130 11 574<br />
Provisi<strong>on</strong>s for liabilities and charges 5 799 5 404 5 514<br />
Total l<strong>on</strong>g-term liabilities 13 409 14 534 17 088<br />
Minority interests 362 440 619<br />
Capital and reserves 5 534 5 920 4 702<br />
Total capital employed 19 305 20 894 22 409<br />
<strong>Unilever</strong> <str<strong>on</strong>g>Annual</str<strong>on</strong>g> Report <strong>on</strong> Form 20-F <strong>2006</strong> 143<br />
Financial Statements (c<strong>on</strong>tinued)
Financial Statements (c<strong>on</strong>tinued)<br />
Selected financial data (c<strong>on</strong>tinued) <strong>Unilever</strong> Group<br />
Selected financial data under previous GAAP (c<strong>on</strong>tinued)<br />
€ milli<strong>on</strong> € milli<strong>on</strong> € milli<strong>on</strong><br />
By geographical area 2004 2003 2002<br />
Group turnover<br />
Europe 17 314 18 208 19 573<br />
The Americas 13 120 14 146 17 879<br />
Asia Africa 9 735 10 339 10 818<br />
144 <strong>Unilever</strong> <str<strong>on</strong>g>Annual</str<strong>on</strong>g> Report <strong>on</strong> Form 20-F <strong>2006</strong><br />
40 169 42 693 48 270<br />
Group operating profit<br />
Europe 1 827 2 563 1 598<br />
The Americas 617 1 429 2 046<br />
Asia Africa 967 1 491 1 363<br />
3 411 5 483 5 007<br />
Net operating assets<br />
Europe 9 748 11 306 12 301<br />
The Americas 8 869 11 033 13 441<br />
Asia Africa 2 294 2 582 2 445<br />
20 911 24 921 28 187<br />
Capital expenditure<br />
Europe 461 471 552<br />
The Americas 262 316 468<br />
Asia Africa 282 251 278<br />
1 005 1 038 1 298<br />
€ milli<strong>on</strong> € milli<strong>on</strong> € milli<strong>on</strong><br />
By operati<strong>on</strong> 2004 2003 2002<br />
Group turnover<br />
Foods 22 530 23 971 26 937<br />
Home and Pers<strong>on</strong>al Care 17 639 18 722 21 333<br />
40 169 42 693 48 270<br />
Group operating profit<br />
Foods 1 267 2 648 2 083<br />
Home and Pers<strong>on</strong>al Care 2 144 2 835 2 924<br />
3 411 5 483 5 007<br />
Net operating assets<br />
Foods 19 014 22 469 25 156<br />
Home and Pers<strong>on</strong>al Care 1 897 2 452 3 031<br />
20 911 24 921 28 187<br />
Capital expenditure<br />
Foods 532 602 805<br />
Home and Pers<strong>on</strong>al Care 473 436 493<br />
1 005 1 038 1 298
Selected financial data (c<strong>on</strong>tinued) <strong>Unilever</strong> Group<br />
Selected financial data under previous GAAP (c<strong>on</strong>tinued)<br />
€ milli<strong>on</strong> € milli<strong>on</strong> € milli<strong>on</strong><br />
C<strong>on</strong>solidated cash flow statement 2004 2003 2002<br />
Cash flow from operating activities 6 853 6 780 7 883<br />
Dividends from joint ventures 60 52 83<br />
Returns <strong>on</strong> investments and servicing of finance (807) (1 180) (1 386)<br />
Taxati<strong>on</strong> (1 378) (1 423) (1 817)<br />
Capital expenditure and financial investment (1 044) (1 024) (1 706)<br />
Acquisiti<strong>on</strong>s and disposals 316 622 1 755<br />
Dividends paid <strong>on</strong> ordinary share capital (1 720) (1 715) (1 580)<br />
Cash flow before management of liquid resources and financing 2 280 2 112 3 232<br />
Management of liquid resources (31) (41) (592)<br />
Financing (2 921) (2 917) (3 078)<br />
Increase/(decrease) in cash in the period (672) (846) (438)<br />
Ratios 2004 2003 2002<br />
Net profit margin (%) (b) 4.7 6.5 4.4<br />
Return <strong>on</strong> invested capital (%) (c) 10.8 12.5 9.8<br />
Ratio of earnings to fixed charges (times) (d) 4.3 4.6 3.6<br />
(b) As defined <strong>on</strong> page 141.<br />
(c) As defined <strong>on</strong> page 25.<br />
(d) As defined <strong>on</strong> page 141.<br />
Selected financial data and key ratios <strong>on</strong> a US GAAP basis<br />
€ milli<strong>on</strong> € milli<strong>on</strong> € milli<strong>on</strong> € milli<strong>on</strong> € milli<strong>on</strong><br />
<strong>2006</strong> 2005 2004 2003 2002<br />
Turnover (total operati<strong>on</strong>s) (a) 40 675 39 902 39 108 41 455 46 933<br />
Net profit attributable to shareholders’ equity (total operati<strong>on</strong>s) 4 115 2 646 2 686 3 807 4 210<br />
Net profit (c<strong>on</strong>tinuing operati<strong>on</strong>s) 3 055 2 215 2 654 n/a n/a<br />
Shareholders’ equity 16 626 14 992 14 012 13 349 11 772<br />
Total assets 42 467 45 296 41 625 44 145 48 146<br />
Basic earnings per share (total operati<strong>on</strong>s) – (Euros) (b)(c) 1.45 0.90 0.92 1.30 1.42<br />
Diluted earnings per share (total operati<strong>on</strong>s) – (Euros) 1.38 0.88 0.87 1.26 1.38<br />
Return <strong>on</strong> invested capital (%) 12.4 10.0 10.5 11.4 11.3<br />
Net profit margin (%) (d) 10.1 6.6 6.9 9.2 9.0<br />
Ratio of earnings to fixed charges (e) 6.3 5.0 4.7 n/a n/a<br />
(a) Turnover from c<strong>on</strong>tinuing operati<strong>on</strong>s for the year was €39 642 milli<strong>on</strong> (2005: €38 401 milli<strong>on</strong>; 2004: €37 168 milli<strong>on</strong>).<br />
(b) For the basis of the calculati<strong>on</strong> of earnings per share see note 7 <strong>on</strong> page 87.<br />
(c) For in<strong>form</strong>ati<strong>on</strong> <strong>on</strong> earnings per share for c<strong>on</strong>tinuing operati<strong>on</strong>s, please refer to note 34 <strong>on</strong> page 124.<br />
(d) Net profit margin is expressed as net profit attributable to shareholders’ equity as a percentage of turnover from total operati<strong>on</strong>s.<br />
(e) In the ratio of earnings to fixed charges, earnings c<strong>on</strong>sist of net profit from c<strong>on</strong>tinuing operati<strong>on</strong>s excluding net profit or loss of joint<br />
ventures and associates increased by fixed charges, income taxes and dividends received from joint ventures and associates. Fixed charges<br />
c<strong>on</strong>sist of interest payable <strong>on</strong> debt and a porti<strong>on</strong> of lease costs determined to be representative of interest. This ratio takes no account of<br />
interest receivable although <strong>Unilever</strong>’s treasury operati<strong>on</strong>s involve both borrowing and depositing funds.<br />
<strong>Unilever</strong> <str<strong>on</strong>g>Annual</str<strong>on</strong>g> Report <strong>on</strong> Form 20-F <strong>2006</strong> 145<br />
Financial Statements (c<strong>on</strong>tinued)
Financial Statements (c<strong>on</strong>tinued)<br />
Selected financial data (c<strong>on</strong>tinued) <strong>Unilever</strong> Group<br />
Exchange rates<br />
The in<strong>form</strong>ati<strong>on</strong> in the following table is based <strong>on</strong> exchange rates between euros and US dollars and euros and sterling. These translati<strong>on</strong> rates<br />
were used in preparati<strong>on</strong> of the accounts:<br />
<strong>2006</strong> 2005 2004 2003 2002<br />
Year end<br />
€1 = $ 1.317 1.184 1.366 1.261 1.049<br />
€1 = £ 0.671 0.686 0.707 0.708 0.651<br />
<str<strong>on</strong>g>Annual</str<strong>on</strong>g> average<br />
€1 = $ 1.254 1.244 1.238 1.126 0.940<br />
€1 = £ 0.682 0.684 0.678 0.691 0.628<br />
No<strong>on</strong> Buying Rates in New York for cable transfers in foreign currencies as certified for customs purposes by the Federal Reserve Bank of<br />
New York were as follows:<br />
<strong>2006</strong> 2005 2004 2003 2002<br />
Year end<br />
€1 = $ 1.320 1.184 1.354 1.260 1.049<br />
<str<strong>on</strong>g>Annual</str<strong>on</strong>g> average<br />
€1 = $ 1.256 1.245 1.239 1.132 0.945<br />
High<br />
€1 = $ 1.333 1.348 1.363 1.260 1.049<br />
Low<br />
€1 = $ 1.186 1.167 1.180 1.036 0.859<br />
High and low exchange rate values for each of the last six m<strong>on</strong>ths:<br />
September October November December January February<br />
<strong>2006</strong> <strong>2006</strong> <strong>2006</strong> <strong>2006</strong> 2007 2007<br />
High<br />
€1 = $ 1.283 1.277 1.326 1.333 1.329 1.325<br />
Low<br />
€1 = $ 1.265 1.250 1.271 1.307 1.290 1.293<br />
On 1 March 2007, the exchange rates between euros and US dollars and euros and sterling were as follows: €1.00 = US $1.322 and<br />
€1.00 = £0.674.<br />
146 <strong>Unilever</strong> <str<strong>on</strong>g>Annual</str<strong>on</strong>g> Report <strong>on</strong> Form 20-F <strong>2006</strong>
Principal group companies and n<strong>on</strong>-current investments <strong>Unilever</strong> Group<br />
as at 31 December <strong>2006</strong><br />
The companies listed below and <strong>on</strong> page 148 are those which, in the<br />
opini<strong>on</strong> of the Directors, principally affect the amount of profit and<br />
assets shown in the <strong>Unilever</strong> Group accounts. The Directors c<strong>on</strong>sider<br />
that those companies not listed are not significant in relati<strong>on</strong> to<br />
<strong>Unilever</strong> as a whole.<br />
Full in<strong>form</strong>ati<strong>on</strong> as required by Articles 379 and 414 of Book 2 of the<br />
Civil Code in the Netherlands has been filed by <strong>Unilever</strong> N.V. with the<br />
Commercial Registry in Rotterdam.<br />
Particulars of PLC group companies and other significant holdings<br />
as required by the United Kingdom Companies Act 1985 will be<br />
annexed to the next <str<strong>on</strong>g>Annual</str<strong>on</strong>g> Return of <strong>Unilever</strong> PLC.<br />
Unless otherwise indicated, the companies are incorporated and<br />
principally operate in the countries under which they are shown.<br />
The aggregate percentage of equity capital directly or indirectly held<br />
by NV or PLC is shown in the margin, except where it is 100%. All<br />
these percentages are rounded down to the nearest whole number.<br />
The percentage of <strong>Unilever</strong>’s shareholdings held either directly or<br />
indirectly by NV and PLC are identified in the tables according to the<br />
following code:<br />
NV 100% a<br />
PLC 100% b<br />
NV 60%; PLC 40% c<br />
NV 85%; PLC 15% d<br />
NV 19%; PLC 81% e<br />
NV 46%; PLC 54% f<br />
NV 24%; PLC 76% g<br />
NV 56%; PLC 44% h<br />
Due to the inclusi<strong>on</strong> of certain partnerships in the c<strong>on</strong>solidated<br />
group accounts of <strong>Unilever</strong>, para 264(b) of the German trade law<br />
grants an exempti<strong>on</strong> from the duty to prepare individual statutory<br />
financial statements and management <str<strong>on</strong>g>report</str<strong>on</strong>g>s in accordance with the<br />
requirements for limited liability companies and to have these audited<br />
and published.<br />
Group companies<br />
% Ownership<br />
Argentina<br />
<strong>Unilever</strong> de Argentina S.A. d<br />
Australia<br />
<strong>Unilever</strong> Australia Ltd. b<br />
Belgium<br />
<strong>Unilever</strong> Belgium BVBA/SPRL (Unibel) d<br />
Brazil<br />
<strong>Unilever</strong> Brasil Ltda. d<br />
Canada<br />
<strong>Unilever</strong> Canada Inc. e<br />
Chile<br />
<strong>Unilever</strong> Chile Home and Pers<strong>on</strong>al Care Ltda. d<br />
China<br />
<strong>Unilever</strong> (China) Investing Company Ltd. a<br />
<strong>Unilever</strong> Services (Hefei) Limited a<br />
France<br />
Amora Maille Société Industrielle S.A.S d<br />
Cogesal-Miko S.A.S d<br />
99 Lever Fabergé France S.A.S d<br />
<strong>Unilever</strong> France Holdings S.A.S d<br />
Group companies (c<strong>on</strong>tinued)<br />
% Ownership<br />
Germany<br />
Maizena Grundstücksverwaltungs<br />
GmbH & Co. OHG d<br />
Pfanni GmbH & Co. OHG Stavenhagen d<br />
Pfanni Werke Grundstücksverwaltungs<br />
GmbH & Co. OHG d<br />
UBG Vermietungs GmbH & Co. OHG d<br />
<strong>Unilever</strong> Deutschland GmbH d<br />
<strong>Unilever</strong> Deutschland Holding GmbH d<br />
<strong>Unilever</strong> Deutschland Immobilien Leasing<br />
GmbH & Co. OHG d<br />
Wiz<strong>on</strong>a IPR GmbH & Co. OHG d<br />
Greece<br />
84 Elais-<strong>Unilever</strong> S.A. a<br />
<strong>Unilever</strong> Hellas A.E.B.E. a<br />
India<br />
51 Hindustan Lever Ltd. b<br />
Ind<strong>on</strong>esia<br />
85 P.T. <strong>Unilever</strong> Ind<strong>on</strong>esia Tbk a<br />
Italy<br />
<strong>Unilever</strong> Italia SrL d<br />
Japan<br />
<strong>Unilever</strong> Japan KK a<br />
Mexico<br />
<strong>Unilever</strong> de México S. de R.L. de C.V. d<br />
The Netherlands<br />
Mixhold B.V. d<br />
<strong>Unilever</strong> Finance Internati<strong>on</strong>al B.V. a<br />
<strong>Unilever</strong> N.V. (a)<br />
<strong>Unilever</strong> Nederland B.V. d<br />
UNUS Holding B.V. h<br />
Poland<br />
<strong>Unilever</strong> Polska S.A. d<br />
Russia<br />
<strong>Unilever</strong> SNG g<br />
South Africa<br />
59 <strong>Unilever</strong> South Africa Foods (Pty) Limited f<br />
<strong>Unilever</strong> South Africa Home and<br />
Pers<strong>on</strong>al Care (Pty) Ltd. b<br />
Spain<br />
<strong>Unilever</strong> España S.A. a<br />
<strong>Unilever</strong> Foods España S.A. a<br />
Sweden<br />
<strong>Unilever</strong> Sverige AB a<br />
Switzerland<br />
<strong>Unilever</strong> Supply Chain Company AG a<br />
<strong>Unilever</strong> Schweiz GmbH d<br />
Thailand<br />
<strong>Unilever</strong> Thai Trading Ltd. d<br />
(a) See ‘Basis of c<strong>on</strong>solidati<strong>on</strong>’ in note 1 <strong>on</strong> page 74<br />
<strong>Unilever</strong> <str<strong>on</strong>g>Annual</str<strong>on</strong>g> Report <strong>on</strong> Form 20-F <strong>2006</strong> 147<br />
Financial Statements (c<strong>on</strong>tinued)
Financial Statements (c<strong>on</strong>tinued)<br />
Principal group companies and n<strong>on</strong>-current investments (c<strong>on</strong>tinued) <strong>Unilever</strong> Group<br />
as at 31 December <strong>2006</strong><br />
Group companies (c<strong>on</strong>tinued)<br />
Turkey<br />
<strong>Unilever</strong> Sanayi ve Ticaret Türk A.S,. b<br />
United Kingdom<br />
Lever Fabergé Ltd. e<br />
<strong>Unilever</strong> Bestfoods UK Ltd. e<br />
<strong>Unilever</strong> PLC (a)<br />
<strong>Unilever</strong> UK Holdings Ltd. b<br />
<strong>Unilever</strong> UK & CN Holdings Ltd. e<br />
United States of America<br />
C<strong>on</strong>opco, Inc. c<br />
<strong>Unilever</strong> Capital Corporati<strong>on</strong> c<br />
<strong>Unilever</strong> United States, Inc. c<br />
(a) See ‘Basis of c<strong>on</strong>solidati<strong>on</strong>’ in note 1 <strong>on</strong> page 74<br />
Joint ventures<br />
% Ownership<br />
Portugal<br />
49 FIMA/VG-Distribuição de Produtos<br />
Alimentares, Lda. a<br />
United States of America<br />
50 Pepsi/Lipt<strong>on</strong> Partnership c<br />
Associates<br />
% Ownership<br />
Côte d’Ivoire<br />
40 Palmci b<br />
United Kingdom<br />
40 Langholm Capital Partners L.P. b<br />
United States of America<br />
33 Johns<strong>on</strong>Diversey Holdings, Inc. a<br />
In additi<strong>on</strong>, we have revenues from operati<strong>on</strong>s in the following<br />
locati<strong>on</strong>s: Abu Dhabi, Algeria, Austria, Bahrain, Bangladesh, Bolivia,<br />
Bulgaria, Cambodia, Camero<strong>on</strong>, Colombia, Costa Rica, Côte d’Ivoire,<br />
Croatia, Cuba, Cyprus, Czech Republic, Democratic Republic of<br />
C<strong>on</strong>go, Denmark, Dominican Republic, Dubai, Ecuador, Egypt,<br />
El Salvador, Est<strong>on</strong>ia, Finland, Ghana, Guatemala, H<strong>on</strong>duras,<br />
H<strong>on</strong>g K<strong>on</strong>g, Hungary, Iran, Ireland, Israel, Jordan, Kenya, Latvia,<br />
Leban<strong>on</strong>, Lithuania, Malawi, Malaysia, Morocco, Mozambique,<br />
Namibia, Nepal, Netherlands Antilles, New Zealand, Nicaragua, Niger,<br />
Nigeria, Norway, Oman, Pakistan, Palestine, Panama, Paraguay, Peru,<br />
Philippines, Portugal, Puerto Rico, Romania, Saudi Arabia, Senegal,<br />
Serbia, Singapore, Slovakia, Slovenia, South Korea, Sri Lanka, Sudan,<br />
Syria, Taiwan, Tanzania, Trinidad & Tobago, Tunisia, Uganda, Ukraine,<br />
United Arab Emirates, Uruguay, Venezuela, Vietnam, Zambia<br />
and Zimbabwe.<br />
148 <strong>Unilever</strong> <str<strong>on</strong>g>Annual</str<strong>on</strong>g> Report <strong>on</strong> Form 20-F <strong>2006</strong>
Shareholder in<strong>form</strong>ati<strong>on</strong><br />
Analysis of shareholding<br />
Significant shareholders of NV<br />
As far as we are aware the <strong>on</strong>ly holders of more than 5% (as referred to in the Act <strong>on</strong> Financial Supervisi<strong>on</strong> in the Netherlands) in<br />
the NV share capital (apart from the Foundati<strong>on</strong> <strong>Unilever</strong> NV Trust Office, see page 41) are ING Groep N.V. and Aeg<strong>on</strong> N.V. The voting<br />
rights of such shareholders are the same as for other holders of the class of share indicated. ING Groep N.V. and Aeg<strong>on</strong> N.V. have each<br />
notified the Netherlands Authority for the Financial Markets (AFM) that as of 1 November <strong>2006</strong> respectively ING Groep N.V. holds<br />
indirectly an interest in the NV issued share capital of 22.17% and Aeg<strong>on</strong> N.V. holds indirectly an interest of 5.57%. Both interests<br />
are mainly held in cumulative preference shares as shown hereunder.<br />
ING Groep N.V.<br />
• 26 828 546 (1.57%) ordinary shares (€4 292 567)<br />
• 20 665 (71.26%) 7% cumulative preference shares (€8 856 399)<br />
• 120 088 (74.56%) 6% cumulative preference shares (€51 466 114)<br />
• 504 440 (67.26%) 4% cumulative preference shares (€21 620 298)<br />
Aeg<strong>on</strong> N.V.<br />
• 836 409 (0.05%) ordinary shares (€133 825)<br />
• 4 995 (17.22%) 7% cumulative preference shares (€2 140 707)<br />
• 29 540 (18.34%) 6% cumulative preference shares (€12 659 957)<br />
• 157 106 (20.95%) 4% cumulative preference shares (€6 733 563)<br />
There have been no material changes to the holdings of significant shareholders of NV during the three years up to and including <strong>2006</strong>.<br />
Significant shareholders of PLC<br />
The following table gives notified details of shareholders who held more than 3% of, or 3% of voting rights attributable to, PLC’s<br />
shares or deferred stock (excluding treasury shares) <strong>on</strong> 1 March 2007. The voting rights of such shareholders are the same as for other<br />
holders of the class of share indicated.<br />
Number of Approximate<br />
Title of class Name of holder shares held % held<br />
Deferred Stock Naamlooze Vennootschap Elma 50 000 50<br />
United Holdings Limited 50 000 50<br />
Ordinary shares Trustees of the Leverhulme Trust and the<br />
Leverhulme Trade Charities Trust 70 566 764 5<br />
Legal & General Group plc 45 027 609 3<br />
Barclays PLC 40 319 254 3<br />
Between 1 January 2004 and 31 December <strong>2006</strong>, Barclays PLC, The Capital Group Companies, inc., Fidelity Management and Research<br />
Company, and Legal & General Group plc have held more than 3% of, or 3% of voting rights attributable to, PLC’s ordinary shares.<br />
During this period, and as notified, certain of these holdings reduced to below the <str<strong>on</strong>g>report</str<strong>on</strong>g>ing 3% threshold. The table above sets out<br />
the notifiable interest of shares or voting rights attributable to PLC as at 1 March 2007.<br />
<strong>Unilever</strong> <str<strong>on</strong>g>Annual</str<strong>on</strong>g> Report <strong>on</strong> Form 20-F <strong>2006</strong> 149<br />
Shareholder in<strong>form</strong>ati<strong>on</strong>
Shareholder in<strong>form</strong>ati<strong>on</strong> (c<strong>on</strong>tinued)<br />
Shareholder in<strong>form</strong>ati<strong>on</strong> (c<strong>on</strong>tinued)<br />
Analysis of PLC registered holdings<br />
At 31 December <strong>2006</strong> PLC had 67 462 ordinary shareholdings.<br />
The following table analyses the registered holdings of PLC’s 31 ⁄9p ordinary shares at 31 December <strong>2006</strong>:<br />
Number Total<br />
Number of shares of holdings % shares held %<br />
1 – 1 000 43 107 63.90 17 802 194 1.36<br />
1 001 – 2 500 14 326 21.24 22 820 193 1.74<br />
2 501 – 5 000 5 637 8.36 19 850 051 1.52<br />
5 001 – 10 000 2 256 3.34 15 431 690 1.18<br />
10 001 – 25 000 970 1.44 14 471 304 1.10<br />
25 001 – 50 000 307 0.45 10 773 983 0.82<br />
50 001 – 100 000 209 0.31 14 935 085 1.14<br />
100 001 –1 000 000 488 0.72 166 272 636 12.69<br />
Over1 000 000 162 0.24 1 027 799 225 78.45<br />
Share purchases during <strong>2006</strong><br />
150 <strong>Unilever</strong> <str<strong>on</strong>g>Annual</str<strong>on</strong>g> Report <strong>on</strong> Form 20-F <strong>2006</strong><br />
67 462 100.00 1 310 156 361 100.00<br />
€ milli<strong>on</strong><br />
Total number of Maximum value that<br />
shares purchased may yet be purchased<br />
Total number of Average price as part of publicly as part of publicly<br />
shares purchased paid per share announced plans announced plans (a)<br />
January – – – –<br />
February 2 175 461 €19.56 – –<br />
March 933 604 €19.31 – –<br />
April 25 941 €18.77 – –<br />
May 1 236 949 €18.38 – –<br />
June 66 932 €17.08 – –<br />
July – – – –<br />
August 237 632 €17.92 – –<br />
September 320 446 €19.28 – –<br />
October – – – –<br />
November 707 025 €20.26 – –<br />
December 317 141 €20.49 – –<br />
Total 6 021 131 €19.30 – –<br />
(a) The above share purchases were made to satisfy commitments to deliver shares under our Share Based Plans which are described in<br />
note 29 <strong>on</strong> page 117. In <strong>2006</strong>, we replaced the originally planned share buy back of €500 milli<strong>on</strong> for <strong>2006</strong> by a <strong>on</strong>e-off dividend<br />
of €750 milli<strong>on</strong>, paid at the time of and in additi<strong>on</strong> to the normal interim dividend.<br />
Exchange c<strong>on</strong>trols affecting security holders<br />
Under the Dutch External Financial Relati<strong>on</strong>s Act of 25 March 1994 the Minister of Finance is authorised to issue regulati<strong>on</strong>s relating to<br />
financial transacti<strong>on</strong>s c<strong>on</strong>cerning the movement of capital to or from third countries with respect to direct investments, establishment,<br />
the per<strong>form</strong>ing of financial services, the admissi<strong>on</strong> of negotiable instruments or goods with respect to which regulati<strong>on</strong>s have been<br />
issued under the Import and Export Act in the interest of the internati<strong>on</strong>al legal system or an arrangement relevant thereto. These<br />
regulati<strong>on</strong>s may c<strong>on</strong>tain a prohibiti<strong>on</strong> to per<strong>form</strong> any of the acti<strong>on</strong>s indicated in those regulati<strong>on</strong>s without a licence. To date no<br />
regulati<strong>on</strong>s of this type have been issued which are applicable to <strong>Unilever</strong> N.V.<br />
The Central Bank of the Netherlands is authorised to issue regulati<strong>on</strong>s with respect to <str<strong>on</strong>g>report</str<strong>on</strong>g>ing obligati<strong>on</strong>s. Pursuant to this<br />
authorisati<strong>on</strong> it has issued the Reporting Obligati<strong>on</strong>s Balance of Payments 2003 (the ‘RR 2003’). <strong>Unilever</strong> N.V. has been appointed by<br />
the Central Bank as an instituti<strong>on</strong> subject to the <str<strong>on</strong>g>report</str<strong>on</strong>g>ing obligati<strong>on</strong>s and <strong>Unilever</strong> N.V. complies with such obligati<strong>on</strong>s.<br />
There are currently no exchange c<strong>on</strong>trols affecting PLC shareholders.
Shareholder in<strong>form</strong>ati<strong>on</strong> (c<strong>on</strong>tinued)<br />
Nature of the trading market<br />
The principal trading markets up<strong>on</strong> which <strong>Unilever</strong> shares are<br />
listed are Eur<strong>on</strong>ext Amsterdam for NV ordinary and preference<br />
shares and the L<strong>on</strong>d<strong>on</strong> Stock Exchange for PLC ordinary shares.<br />
NV ordinary shares mainly trade in the <strong>form</strong> of depositary receipts<br />
for shares.<br />
In the United States, NV ordinary shares and PLC American<br />
Depositary Receipts, are traded <strong>on</strong> the New York Stock Exchange.<br />
Citibank, N.A. acts for NV and PLC as issuer, transfer agent and,<br />
in respect of the American Depositary Receipts, depositary.<br />
There have not been any significant trading suspensi<strong>on</strong>s in the<br />
past three years.<br />
At 1 March 2007 there were 6 269 registered holders of NV<br />
New York Registry shares and 747 registered holders of PLC<br />
American Depositary Receipts in the United States. We estimate<br />
that approximately 21% of NV’s ordinary shares were held in the<br />
United States (approximately 28% in 2005), based <strong>on</strong> the<br />
distributi<strong>on</strong> of the <strong>2006</strong> interim dividend payments, while<br />
most holders of PLC ordinary shares are registered in the<br />
United Kingdom – approximately 99% in <strong>2006</strong> and in 2005.<br />
NV and PLC are separate companies with separate stock exchange<br />
listings and different shareholders. Shareholders cannot c<strong>on</strong>vert<br />
or exchange the shares of <strong>on</strong>e for shares of the other and the<br />
relative share prices <strong>on</strong> the various markets can, and do,<br />
fluctuate. Following the decisi<strong>on</strong>s taken at the NV AGM held <strong>on</strong><br />
8 May <strong>2006</strong> and the PLC AGM held <strong>on</strong> 9 May <strong>2006</strong> to simplify<br />
the relati<strong>on</strong>ship between the NV and PLC ordinary shares, each<br />
NV ordinary share now represents the same underlying ec<strong>on</strong>omic<br />
interest in the <strong>Unilever</strong> Group as each PLC ordinary share (save for<br />
exchange rate fluctuati<strong>on</strong>s).<br />
If you are a shareholder of NV, you have an interest in a Dutch<br />
legal entity, your dividends will be paid in euros (c<strong>on</strong>verted into<br />
US dollars if you have shares registered in the United States) and<br />
you will be subject to tax in the Netherlands. If you are a<br />
shareholder of PLC, your interest is in a United Kingdom legal<br />
entity, your dividends will be paid in sterling (c<strong>on</strong>verted into US<br />
dollars if you have American Depositary Receipts) and you will be<br />
subject to United Kingdom tax. Nevertheless, the Equalisati<strong>on</strong><br />
Agreement means that as a shareholder of either company you<br />
effectively have an interest in the whole of <strong>Unilever</strong>. You have<br />
largely equal rights over our combined net profit and capital<br />
reserves as shown in the c<strong>on</strong>solidated accounts. See Taxati<strong>on</strong> for<br />
US residents <strong>on</strong> pages 153 and 154 and Equalisati<strong>on</strong> Agreement<br />
<strong>on</strong> pages 39 and 40.<br />
The high and low trading prices for the separate stock exchange<br />
listings are shown in the tables <strong>on</strong> the following page.<br />
<strong>Unilever</strong> <str<strong>on</strong>g>Annual</str<strong>on</strong>g> Report <strong>on</strong> Form 20-F <strong>2006</strong> 151<br />
Shareholder in<strong>form</strong>ati<strong>on</strong> (c<strong>on</strong>tinued)
Shareholder in<strong>form</strong>ati<strong>on</strong> (c<strong>on</strong>tinued)<br />
Shareholder in<strong>form</strong>ati<strong>on</strong> (c<strong>on</strong>tinued)<br />
Nature of the trading market (c<strong>on</strong>tinued)<br />
Share prices at 31 December <strong>2006</strong><br />
The share price of the ordinary shares at the end of the year were as follows:<br />
NV per €0.16 ordinary share in Amsterdam €20.70<br />
NV per €0.16 ordinary share in New York $27.25<br />
PLC per 31 ⁄9p ordinary share in L<strong>on</strong>d<strong>on</strong> £14.28<br />
PLC per American Depositary Receipt in New York $27.82<br />
M<strong>on</strong>thly high and low prices for the most recent six m<strong>on</strong>ths:<br />
September October November December January February<br />
NV per €0.16 ordinary share in Amsterdam (in €) High 19.59 19.69 20.62 20.84 21.04 20.96<br />
Low 18.56 19.22 19.22 19.67 20.29 19.59<br />
NV per €0.16 ordinary share in New York (in $) High 24.90 24.93 26.49 27.32 27.43 27.21<br />
Low 23.74 24.20 24.49 26.13 26.27 25.94<br />
PLC per 3 1 ⁄9p ordinary share in L<strong>on</strong>d<strong>on</strong> (in £) High 13.25 13.29 14.12 14.28 14.42 14.24<br />
Low 12.55 12.97 12.94 13.47 13.78 13.61<br />
PLC per American Depositary Receipt in New York (in $) High 25.19 25.11 26.93 27.95 28.06 28.02<br />
Low 23.85 24.28 24.68 26.79 26.94 26.66<br />
Quarterly high and low prices for <strong>2006</strong> and 2005<br />
152 <strong>Unilever</strong> <str<strong>on</strong>g>Annual</str<strong>on</strong>g> Report <strong>on</strong> Form 20-F <strong>2006</strong><br />
<strong>2006</strong> 1st 2nd 3rd 4th<br />
NV per €0.16 ordinary share in Amsterdam (in €) High 19.78 19.27 19.59 20.84<br />
Low 18.53 16.53 17.26 19.22<br />
NV per €0.16 ordinary share in New York (in $) High 23.86 24.34 24.90 27.32<br />
Low 22.69 20.72 21.74 24.20<br />
PLC per 3 1 ⁄9p ordinary share in L<strong>on</strong>d<strong>on</strong> (in £) High 13.54 13.16 13.25 14.28<br />
Low 12.74 11.25 11.84 12.94<br />
PLC per American Depositary Receipt in New York (in $) High 23.79 24.31 25.19 27.95<br />
Low 22.45 20.66 21.77 24.28<br />
2005 1st 2nd 3rd 4th<br />
NV per €0.16 ordinary share in Amsterdam (in €) High 17.58 18.32 19.93 20.27<br />
Low 16.13 16.59 17.72 18.88<br />
NV per €0.16 ordinary share in New York (in $) High 22.89 22.98 23.97 24.02<br />
Low 20.89 21.38 21.55 22.18<br />
PLC per 3 1 ⁄9p ordinary share in L<strong>on</strong>d<strong>on</strong> (in £) High 11.71 12.30 13.26 13.39<br />
Low 10.83 11.01 11.96 12.43<br />
PLC per American Depositary Receipt in New York (in $) High 22.32 22.85 23.67 23.60<br />
Low 20.34 21.16 21.20 21.55<br />
<str<strong>on</strong>g>Annual</str<strong>on</strong>g> high and low prices<br />
<strong>2006</strong> 2005 2004 2003 2002<br />
NV per €0.16 ordinary share in Amsterdam (in €) High 20.84 20.27 19.92 19.98 24.01<br />
Low 16.53 16.13 14.80 15.27 16.55<br />
NV per €0.16 ordinary share in New York (in $) High 27.32 24.02 24.80 21.63 22.30<br />
Low 20.72 20.89 18.94 17.65 16.70<br />
PLC per 3 1 ⁄9p ordinary share in L<strong>on</strong>d<strong>on</strong> (in £) High 14.28 13.39 12.80 13.96 14.64<br />
Low 11.25 10.83 9.85 10.56 10.50<br />
PLC per American Depositary Receipt in New York (in $) High 27.95 23.67 24.17 21.93 21.91<br />
Low 20.66 20.34 18.22 17.46 16.58
Shareholder in<strong>form</strong>ati<strong>on</strong> (c<strong>on</strong>tinued)<br />
Taxati<strong>on</strong> for US residents holding shares in NV<br />
The following notes are provided for guidance. US residents should<br />
c<strong>on</strong>sult their local tax advisers, particularly in c<strong>on</strong>necti<strong>on</strong> with<br />
potential liability to pay US taxes <strong>on</strong> disposal, lifetime gift or bequest<br />
of their shares.<br />
Taxati<strong>on</strong> <strong>on</strong> dividends in the Netherlands<br />
Until the end of <strong>2006</strong> dividends of companies in the Netherlands were<br />
in principle subject to dividend withholding tax of 25%. Where a<br />
shareholder is entitled to the benefits of the current Income Tax<br />
C<strong>on</strong>venti<strong>on</strong> (‘the C<strong>on</strong>venti<strong>on</strong>’) c<strong>on</strong>cluded <strong>on</strong> 18 December 1992<br />
between the United States and the Netherlands, when dividends are<br />
paid by NV to:<br />
• a United States resident;<br />
• a corporati<strong>on</strong> organised under the laws of the United States<br />
(or any territory of it) having no permanent establishment in the<br />
Netherlands of which such shares <strong>form</strong> a part of the business<br />
property; or<br />
• any other legal pers<strong>on</strong> subject to United States Federal income<br />
tax with respect to its worldwide income, having no permanent<br />
establishment in the Netherlands of which such shares <strong>form</strong> a part<br />
of the business property;<br />
these dividends qualify for a reducti<strong>on</strong> of withholding tax <strong>on</strong><br />
dividends in the Netherlands from 25% to 15% (to 5% if the<br />
beneficial owner is a company which directly holds at least 10%<br />
of the voting power of NV shares and to 0% if the beneficial owner<br />
is a qualified ‘Exempt Organisati<strong>on</strong>’ as defined in Article 36 of the<br />
C<strong>on</strong>venti<strong>on</strong>). As of 1 January 2007 dividends of companies in the<br />
Netherlands are in principle subject to dividend withholding tax<br />
of 15%.<br />
Where a United States resident or corporati<strong>on</strong> has a permanent<br />
establishment in the Netherlands, which has shares in NV <strong>form</strong>ing<br />
part of its business property, dividends it receives <strong>on</strong> those shares are<br />
included in that establishment’s profit. They are subject to income tax<br />
or corporati<strong>on</strong> tax in the Netherlands, as appropriate, and tax <strong>on</strong><br />
dividends in the Netherlands will generally be applied at the full rate<br />
of 25% until the end of <strong>2006</strong> and 15% as from 1 January 2007. This<br />
tax will be treated as foreign income tax eligible for credit against the<br />
shareholder’s United States income taxes.<br />
Under the C<strong>on</strong>venti<strong>on</strong>, qualifying United States organisati<strong>on</strong>s that are<br />
generally exempt from United States taxes and that are c<strong>on</strong>stituted<br />
and operated exclusively to administer or provide pensi<strong>on</strong>, retirement<br />
or other employee benefits may be exempt at source from<br />
withholding tax <strong>on</strong> dividends received from a Dutch corporati<strong>on</strong>.<br />
An agreement published by the US Internal Revenue Service <strong>on</strong><br />
20 April 2000 in release IR-INT-2000-9 between the United States<br />
and tax authorities in the Netherlands describes the eligibility of these<br />
US organisati<strong>on</strong>s for benefits under the C<strong>on</strong>venti<strong>on</strong>.<br />
A United States trust, company or organisati<strong>on</strong> that is operated<br />
exclusively for religious, charitable, scientific, educati<strong>on</strong>al or public<br />
purposes was subject to an initial 25% withholding tax rate until<br />
the end of <strong>2006</strong> and 15% as from 1 January 2007. Such an exempt<br />
organisati<strong>on</strong> is entitled to reclaim from Tax Authorities in the<br />
Netherlands a refund of the Dutch dividend tax, if and to the extent<br />
that it is exempt from United States Federal Income Tax and it would<br />
be exempt from tax in the Netherlands if it were organised and<br />
carried <strong>on</strong> all its activities there.<br />
If you are an NV shareholder resident in any country other than the<br />
United States or the Netherlands, any exempti<strong>on</strong> from, or reducti<strong>on</strong> or<br />
refund of, dividend withholding tax in the Netherlands may be<br />
governed by the ‘Tax Regulati<strong>on</strong> for the Kingdom of the Netherlands’<br />
or by the tax c<strong>on</strong>venti<strong>on</strong>, if any, between the Netherlands and your<br />
country of residence.<br />
United States taxati<strong>on</strong> <strong>on</strong> dividends<br />
If you are a United States shareholder, the dividend (including the<br />
withheld amount) up to the amount of our earnings and profits for<br />
United States Federal income tax purposes will be ordinary dividend<br />
income. Dividends received by an individual during taxable years<br />
before 2011 will be taxed at a maximum rate of 15%, provided the<br />
individual has held the shares for more than 60 days during the 121day<br />
period beginning 60 days before the ex-dividend date, that NV is<br />
a qualified foreign corporati<strong>on</strong> and that certain other c<strong>on</strong>diti<strong>on</strong>s are<br />
satisfied. NV is a qualified foreign corporati<strong>on</strong> for this purpose.<br />
Dividends received by an individual for taxable years after 2010 will be<br />
subject to tax at ordinary income rates. The dividends are not eligible<br />
for the dividends received deducti<strong>on</strong> allowed to corporati<strong>on</strong>s.<br />
For US foreign tax credit purposes, the dividend is foreign source<br />
income, and withholding tax in the Netherlands is a foreign income<br />
tax that is eligible for credit against the shareholder’s United States<br />
income taxes. However, the rules governing the US foreign tax credit<br />
are complex, and additi<strong>on</strong>al limitati<strong>on</strong>s <strong>on</strong> the credit apply to<br />
individuals receiving dividends eligible for the 15% maximum tax rate<br />
<strong>on</strong> dividends described above.<br />
Any porti<strong>on</strong> of the dividend that exceeds our United States earnings<br />
and profits is subject to different rules. This porti<strong>on</strong> is a tax free return<br />
of capital to the extent of your basis in our shares, and thereafter is<br />
treated as a gain <strong>on</strong> a dispositi<strong>on</strong> of the shares.<br />
Under a provisi<strong>on</strong> of the Dividend Tax Act in the Netherlands, NV<br />
is entitled to a credit (up to a maximum of 3% of the gross dividend<br />
from which dividend tax is withheld) against the amount of dividend<br />
tax withheld before remittance to tax authorities in the Netherlands.<br />
The United States tax authority may take the positi<strong>on</strong> that<br />
withholding tax in the Netherlands eligible for credit should be<br />
limited accordingly.<br />
Taxati<strong>on</strong> <strong>on</strong> capital gains in the Netherlands<br />
Under the C<strong>on</strong>venti<strong>on</strong>, if you are a United States resident or<br />
corporati<strong>on</strong> and you have capital gains <strong>on</strong> the sale of shares of a<br />
Dutch company, these are generally not subject to taxati<strong>on</strong> by the<br />
Netherlands. An excepti<strong>on</strong> to this rule generally applies if you have a<br />
permanent establishment in the Netherlands and the capital gain is<br />
derived from the sale of shares which <strong>form</strong> part of that permanent<br />
establishment’s business property.<br />
Successi<strong>on</strong> duty and gift taxes in the Netherlands<br />
Under the Estate and Inheritance Tax C<strong>on</strong>venti<strong>on</strong> between the United<br />
States and the Netherlands of 15 July 1969, United States individual<br />
residents who are not Dutch citizens who have shares will generally<br />
not be subject to successi<strong>on</strong> duty in the Netherlands <strong>on</strong> the<br />
individual’s death, unless the shares are part of the business property<br />
of a permanent establishment situated in the Netherlands.<br />
A gift of shares of a Dutch company by a pers<strong>on</strong> who is not a resident<br />
or a deemed resident of the Netherlands is generally not subject to<br />
gift tax in the Netherlands. A n<strong>on</strong>-resident Netherlands citizen,<br />
however, is still treated as a resident of the Netherlands for gift tax<br />
purposes for ten years and any other n<strong>on</strong>-resident pers<strong>on</strong> for <strong>on</strong>e year<br />
after leaving the Netherlands.<br />
<strong>Unilever</strong> <str<strong>on</strong>g>Annual</str<strong>on</strong>g> Report <strong>on</strong> Form 20-F <strong>2006</strong> 153<br />
Shareholder in<strong>form</strong>ati<strong>on</strong> (c<strong>on</strong>tinued)
Shareholder in<strong>form</strong>ati<strong>on</strong> (c<strong>on</strong>tinued)<br />
Shareholder in<strong>form</strong>ati<strong>on</strong> (c<strong>on</strong>tinued)<br />
Taxati<strong>on</strong> for US residents holding shares in PLC<br />
The following notes are provided for guidance. US residents should<br />
c<strong>on</strong>sult their local tax advisers, particularly in c<strong>on</strong>necti<strong>on</strong> with<br />
potential liability to pay US taxes <strong>on</strong> disposal, lifetime gift or<br />
bequest of their shares.<br />
United Kingdom taxati<strong>on</strong> <strong>on</strong> dividends<br />
Under United Kingdom law, income tax is not withheld from<br />
dividends paid by United Kingdom companies. Shareholders, whether<br />
resident in the United Kingdom or not, receive the full amount of the<br />
dividend actually declared.<br />
United States taxati<strong>on</strong> <strong>on</strong> dividends<br />
If you are a shareholder resident in the US, the dividend up to the<br />
amount of our earnings and profits for United States Federal income<br />
tax purposes will be ordinary dividend income. Dividends received by<br />
an individual during taxable years before 2011 will be taxed at a<br />
maximum rate of 15%, provided the individual has held the shares<br />
for more than 60 days during the 121-day period beginning 60<br />
days before the ex-dividend date, that PLC is a qualified foreign<br />
corporati<strong>on</strong> and certain other c<strong>on</strong>diti<strong>on</strong>s are satisfied. PLC is a<br />
qualified foreign corporati<strong>on</strong> for this purpose. Dividends received by<br />
an individual for taxable years after 2010 will be subject to tax at<br />
ordinary income rates. The dividend is not eligible for the dividends<br />
received deducti<strong>on</strong> allowable to corporati<strong>on</strong>s. The dividend is foreign<br />
source income for US foreign tax credit purposes.<br />
Any porti<strong>on</strong> of the dividend that exceeds our United States earnings<br />
and profits is subject to different rules. This porti<strong>on</strong> is a tax free return<br />
of capital to the extent of your basis in our shares, and thereafter is<br />
treated as a gain <strong>on</strong> a dispositi<strong>on</strong> of the shares.<br />
154 <strong>Unilever</strong> <str<strong>on</strong>g>Annual</str<strong>on</strong>g> Report <strong>on</strong> Form 20-F <strong>2006</strong><br />
UK taxati<strong>on</strong> <strong>on</strong> capital gains<br />
Under United Kingdom law, when you sell shares you may be liable to<br />
pay capital gains tax. However, if you are either:<br />
• an individual who is neither resident nor ordinarily resident in the<br />
United Kingdom; or<br />
• a company which is not resident in the United Kingdom;<br />
you will not be liable to United Kingdom tax <strong>on</strong> any capital gains<br />
made <strong>on</strong> disposal of your shares.<br />
The excepti<strong>on</strong> is if the shares are held in c<strong>on</strong>necti<strong>on</strong> with a trade or<br />
business which is c<strong>on</strong>ducted in the United Kingdom through a<br />
branch or an agency.<br />
UK inheritance tax<br />
Under the current estate and gift tax c<strong>on</strong>venti<strong>on</strong> between the United<br />
States and the United Kingdom, ordinary shares held by an<br />
individual shareholder who is:<br />
• domiciled for the purposes of the c<strong>on</strong>venti<strong>on</strong> in the United<br />
States; and<br />
• is not for the purposes of the c<strong>on</strong>venti<strong>on</strong> a nati<strong>on</strong>al of the<br />
United Kingdom;<br />
will not be subject to United Kingdom inheritance tax <strong>on</strong>:<br />
• the individual’s death; or<br />
• <strong>on</strong> a gift of the shares during the individual’s lifetime.<br />
The excepti<strong>on</strong> is if the shares are part of the business property of a<br />
permanent establishment of the individual in the United Kingdom or,<br />
in the case of a shareholder who per<strong>form</strong>s independent pers<strong>on</strong>al<br />
services, pertain to a fixed base situated in the United Kingdom.
Shareholder in<strong>form</strong>ati<strong>on</strong> (c<strong>on</strong>tinued)<br />
Dividend record<br />
Our interim ordinary dividends are normally announced in November and paid in December. Final ordinary dividends are normally<br />
proposed in February and, if approved by shareholders at the <str<strong>on</strong>g>Annual</str<strong>on</strong>g> General Meetings, paid in June.<br />
The following tables show the dividends paid by NV and PLC for the last five years, expressed in terms of the revised share<br />
denominati<strong>on</strong>s which became effective from 22 May <strong>2006</strong>. Dividends have been translated into US dollars at the exchange rates<br />
prevailing <strong>on</strong> the dates of declarati<strong>on</strong> of the dividend. Differences between the amounts ultimately received by US holders of NV<br />
and PLC shares are the result of changes in exchange rate between the equalisati<strong>on</strong> of the dividends and the date of payment.<br />
The interim dividend is normally 35% of the previous year’s total normal dividend per share, based <strong>on</strong> the str<strong>on</strong>ger of our two parent<br />
currencies over the first nine m<strong>on</strong>ths of the year. Equalisati<strong>on</strong> of the interim dividend in the other currency takes place at the average<br />
exchange rate of the third quarter. Equalisati<strong>on</strong> of the final dividend takes place at the average exchange rate for the full year.<br />
Final dividends for <strong>2006</strong> are payable <strong>on</strong> 21 June 2007, subject to approval at the AGMs. For purposes of illustrati<strong>on</strong>, the amounts<br />
payable in respect of NV New York Registry Shares and PLC ADRs have been translated in the table below at rates of exchange <strong>on</strong><br />
8 February 2007, which is the date <strong>on</strong> which the proposed dividends were announced. The actual amounts payable in US dollars will<br />
be calculated by reference totheexchange rates <strong>on</strong> the day <strong>on</strong> which the dividends are approved (15 May 2007 in the case of NV<br />
and 16 May 2007 in the case of PLC).<br />
The dividend timetable for 2007 is shown <strong>on</strong> page 158.<br />
NV Dividends<br />
<strong>2006</strong> 2005 2004 2003 2002<br />
Interim dividend per €0.16 (Euros) 0.2300 0.2200 0.2100 0.1967 0.1833<br />
Final dividend per €0.16 (Euros) – 0.4400 0.4200 0.3833 0.3833<br />
Proposed final dividend per €0.16 (Euros) 0.4700 – – – –<br />
One-off dividend per €0.16 (Euros) 0.2600 – – – –<br />
Interim dividend per €0.16 (US Registry) (Dollars) 0.2934 0.2638 0.2685 0.2296 0.1800<br />
Final dividend per €0.16 (US Registry) (Dollars) – 0.5613 0.5399 0.4545 0.4380<br />
Proposed final dividend per €0.16 (US Registry) (Dollars) 0.6103 – – – –<br />
One-off dividend per €0.16 (US Registry) (Dollars) 0.3316 – – – –<br />
PLC Dividends<br />
<strong>2006</strong> 2005 2004 2003 2002<br />
Interim dividend per 3 1 ⁄9p (Pounds) 0.1562 0.1504 0.1407 0.1369 0.1158<br />
Final dividend per 3 1 ⁄9p (Pounds) – 0.3009 0.2849 0.2649 0.2407<br />
Proposed final dividend per 3 1 ⁄9p (Pounds) 0.3204 – – – –<br />
One-off dividend per 3 1 ⁄9p (Pounds) 0.1766 – – – –<br />
Interim dividend per 3 1 ⁄9p (US Registry) (Dollars) 0.2983 0.2655 0.2586 0.2315 0.1804<br />
Final dividend per 3 1 ⁄9p (US Registry) (Dollars) – 0.5583 0.5366 0.4694 0.3866<br />
Proposed final dividend per 3 1 ⁄9p (US Registry) (Dollars) 0.6317 – – – –<br />
One-off dividend per 3 1 ⁄9p (US Registry) (Dollars) 0.3372 – – – –<br />
<strong>Unilever</strong> <str<strong>on</strong>g>Annual</str<strong>on</strong>g> Report <strong>on</strong> Form 20-F <strong>2006</strong> 155<br />
Shareholder in<strong>form</strong>ati<strong>on</strong> (c<strong>on</strong>tinued)
Shareholder in<strong>form</strong>ati<strong>on</strong> (c<strong>on</strong>tinued)<br />
Shareholder in<strong>form</strong>ati<strong>on</strong> (c<strong>on</strong>tinued)<br />
Glossary<br />
The following is intended to provide a general guide to the meanings of various terms which may be used in this <str<strong>on</strong>g>report</str<strong>on</strong>g>.<br />
Term used in this <str<strong>on</strong>g>report</str<strong>on</strong>g> US equivalent or brief descripti<strong>on</strong><br />
Accounts Financial statements<br />
Associate A business which is not a subsidiary or a joint venture, but in which the Group has<br />
a shareholding and exercises significant influence<br />
Called up share capital Ordinary shares, issued and fully paid<br />
Creditors Accounts payable/Payables<br />
Creditors: amounts due after more than <strong>on</strong>e year L<strong>on</strong>g-term accounts payable<br />
Creditors: amounts due within <strong>on</strong>e year Current accounts payable<br />
Debtors Accounts receivable/Receivables<br />
Finance cost Interest expense<br />
Finance income Interest income<br />
Finance lease Capital lease<br />
Freehold Ownership with absolute rights in perpetuity<br />
Gearing Leverage<br />
Group, or c<strong>on</strong>solidated, accounts C<strong>on</strong>solidated financial statements<br />
Joint venture A business which is jointly c<strong>on</strong>trolled by the Group and <strong>on</strong>e or more<br />
external partners<br />
Nominal value Par value<br />
Operating margin Operating profit expressed as a percentage of turnover<br />
Operating profit Net operating income<br />
Profit Income (or earnings)<br />
Profit and loss account Income statement<br />
Profit attributable to ordinary shareholders Net income attributable to ordinary stockholders<br />
Profit retained Retained earnings<br />
Provisi<strong>on</strong>s Liabilities other than debt and specific accounts payable<br />
Reserves Stockholders’ equity other than paid-up capital<br />
Share capital Capital stock or comm<strong>on</strong> stock<br />
Share opti<strong>on</strong> Stock opti<strong>on</strong><br />
Share premium account Additi<strong>on</strong>al paid-in capital relating to proceeds of sale of stock in excess of par value or<br />
paid-in surplus<br />
Shareholders’ equity Stockholders’ equity<br />
Shares in issue Shares outstanding<br />
Statement of recognised income and expense Statement of comprehensive income<br />
Turnover Sales revenues<br />
Weighted average cost of capital The cost of equity multiplied by the market capitalisati<strong>on</strong>, plus the after taxati<strong>on</strong> interest<br />
cost of debt multiplied by the market value of the net debt, divided by the sum of the<br />
market values of debt and equity<br />
156 <strong>Unilever</strong> <str<strong>on</strong>g>Annual</str<strong>on</strong>g> Report <strong>on</strong> Form 20-F <strong>2006</strong>
Shareholder in<strong>form</strong>ati<strong>on</strong> (c<strong>on</strong>tinued)<br />
Cross reference to Form 20-F<br />
PART I<br />
1 Identity of directors, senior management<br />
and advisers n/a<br />
2 Offer statistics and expected timetable n/a<br />
3 Key in<strong>form</strong>ati<strong>on</strong><br />
3A Selected financial data 109, 141-146, 155<br />
3B Capitalisati<strong>on</strong> and indebtedness n/a<br />
3C Reas<strong>on</strong>s for the offer and use of proceeds n/a<br />
3D Risk factors 9-10, 100-101<br />
4 In<strong>form</strong>ati<strong>on</strong> <strong>on</strong> the company<br />
4A History and development of<br />
the company 1, 5-10, 13-32, 113, 170<br />
4B Business overview 5-10, 13-32, 79-82<br />
4C Organisati<strong>on</strong>al structure 33, 147-148<br />
4D Property, plant and equipment 8, 90<br />
4A Unresolved staff comments n/a<br />
5 Operating and financial review and prospects<br />
5A Operating results 13-32, 76, 99-101<br />
5B Liquidity and capital resources 23-32, 66-67, 90, 95-102, 112<br />
5C Research and development, patents and<br />
licences, etc. 5-10, 13-22, 83<br />
5D Trend in<strong>form</strong>ati<strong>on</strong> 3-4, 11-32<br />
5E Off balance sheet arrangements 31, 99-101<br />
5F Tabular disclosure of c<strong>on</strong>tractual obligati<strong>on</strong>s 30-32<br />
5G Safe harbour 1, Inside back cover<br />
6 Directors, senior management and employees<br />
6A Directors and senior management 33-47<br />
6B Compensati<strong>on</strong> 49-62, 84, 103-107, 117-122<br />
6C Board practices 3, 33-64<br />
6D Employees 6-7<br />
6E Share ownership 49-62, 117-121<br />
7 Major shareholders and related party transacti<strong>on</strong>s<br />
7A Major shareholders 41-42, 149-152<br />
7B Related party transacti<strong>on</strong>s 6, 122<br />
7C Interests of experts and counsel n/a<br />
8 Financial in<strong>form</strong>ati<strong>on</strong><br />
8A C<strong>on</strong>solidated statements<br />
and other financial in<strong>form</strong>ati<strong>on</strong> 69-146, 155<br />
8B Significant changes 32, 123<br />
9 The offer and listing<br />
9A Offer and listing details 151-152<br />
9B Plan of distributi<strong>on</strong> n/a<br />
9C Markets Inside fr<strong>on</strong>t cover, 151-152<br />
9D Selling shareholders n/a<br />
9E Diluti<strong>on</strong> n/a<br />
9F Expenses of the issue n/a<br />
10 Additi<strong>on</strong>al in<strong>form</strong>ati<strong>on</strong><br />
10A Share capital n/a<br />
10B Memorandum and articles of associati<strong>on</strong> 33-47, 96, 109<br />
10C Material c<strong>on</strong>tracts 29, 33, 39-41<br />
10D Exchange c<strong>on</strong>trols 150<br />
10E Taxati<strong>on</strong> 153-154<br />
10F Dividends and paying agents n/a<br />
10G Statement by experts n/a<br />
10H Documents <strong>on</strong> display 131<br />
10I Subsidiary in<strong>form</strong>ati<strong>on</strong> n/a<br />
11 Quantitative and qualitative disclosures about<br />
market risk 9-10, 94-102<br />
12 Descripti<strong>on</strong> of securities other than equity securities n/a<br />
PART II<br />
13 Defaults, dividend arrearages and delinquencies n/a<br />
14 Material modificati<strong>on</strong>s to the rights of security<br />
holders and use of proceeds n/a<br />
15 C<strong>on</strong>trols and procedures 66-69<br />
16 Reserved<br />
16A Audit Committee financial expert 37<br />
16B Code of Ethics 33, 45<br />
16C Principal accountant fees and services 63, 123<br />
16D Exempti<strong>on</strong>s from the Listing Standards for<br />
Audit Committees n/a<br />
16E Purchases of equity securities by the issuer and<br />
affiliated purchasers 150<br />
PART III<br />
17 Financial statements n/a<br />
18 Financial statements 69-140<br />
19 Exhibits*<br />
*Filed with the United States Securities and Exchange Commissi<strong>on</strong>.<br />
<strong>Unilever</strong>’s agent in the United States is Mr R Soiefer, Senior Vice-<br />
President, General Counsel and Secretary, <strong>Unilever</strong> United States,<br />
Inc., 700 Sylvan Avenue, Englewood Cliffs, NJ 07632.<br />
<strong>Unilever</strong> <str<strong>on</strong>g>Annual</str<strong>on</strong>g> Report <strong>on</strong> Form 20-F <strong>2006</strong> 157<br />
Shareholder in<strong>form</strong>ati<strong>on</strong> (c<strong>on</strong>tinued)
Shareholder in<strong>form</strong>ati<strong>on</strong> (c<strong>on</strong>tinued)<br />
Shareholder in<strong>form</strong>ati<strong>on</strong> (c<strong>on</strong>tinued)<br />
Financial calendar<br />
<str<strong>on</strong>g>Annual</str<strong>on</strong>g> General Meetings<br />
NV 10:30 am Tuesday 15 May 2007 Rotterdam<br />
PLC 11:00 am Wednesday 16 May 2007 L<strong>on</strong>d<strong>on</strong><br />
Announcements of results<br />
First Quarter 3 May 2007 Third Quarter 1 November 2007<br />
First Half Year 2 August 2007 Final for Year 7 February 2008<br />
Final ordinary dividends for <strong>2006</strong><br />
Announced 8 February 2007 and to be declared 15 May 2007 (NV) and 16 May 2007 (PLC).<br />
158 <strong>Unilever</strong> <str<strong>on</strong>g>Annual</str<strong>on</strong>g> Report <strong>on</strong> Form 20-F <strong>2006</strong><br />
Ex-dividend Record Payment<br />
date date date<br />
NV 17 May 2007 21 May 2007 21 June 2007<br />
PLC 23 May 2007 25 May 2007 21 June 2007<br />
NV – New York Registry Shares 17 May 2007 21 May 2007 21 June 2007<br />
PLC – American Depositary Receipts 23 May 2007 25 May 2007 21 June 2007<br />
Interim dividends for 2007<br />
To be announced 1 November 2007.<br />
Ex-dividend Record Payment<br />
date date date<br />
NV 2 November 2007 6 November 2007 5 December 2007<br />
PLC 7 November 2007 9 November 2007 5 December 2007<br />
NV – New York Registry Shares 2 November 2007 6 November 2007 5 December 2007<br />
PLC – American Depositary Receipts 7 November 2007 9 November 2007 5 December 2007<br />
Preferential dividends – NV<br />
Ex-dividend Record Payment<br />
Announced date date date<br />
4% Cumulative Preference 7 December 2007 10 December 2007 12 December 2007 2 January 2008<br />
6% Cumulative Preference 7 September 2007 10 September 2007 12 September 2007 1 October 2007<br />
7% Cumulative Preference 7 September 2007 10 September 2007 12 September 2007 1 October 2007<br />
C<strong>on</strong>tact details<br />
Rotterdam L<strong>on</strong>d<strong>on</strong> New York<br />
<strong>Unilever</strong> N.V. <strong>Unilever</strong> PLC <strong>Unilever</strong> United States, Inc.<br />
Investor Relati<strong>on</strong>s Department Investor Relati<strong>on</strong>s Department Investor Relati<strong>on</strong>s Department<br />
Weena 455, PO Box 760 PO Box 68, <strong>Unilever</strong> House 700 Sylvan Avenue, Englewood Cliffs<br />
3000 DK Rotterdam 100 Victoria Embankment NJ 07632<br />
The Netherlands L<strong>on</strong>d<strong>on</strong> EC4P 4BQ USA<br />
United Kingdom<br />
Teleph<strong>on</strong>e +44 (0)20 7822 6830 Teleph<strong>on</strong>e +44 (0)20 7822 6830 Teleph<strong>on</strong>e +1 (0)201 894 2615<br />
Telefax +44 (0)20 7822 5754 Telefax +44 (0)20 7822 5754 Telefax +1 (0)201 894 2222<br />
Any queries can also be sent to us electr<strong>on</strong>ically via www.unilever.com/c<strong>on</strong>tactus.
Shareholder in<strong>form</strong>ati<strong>on</strong> (c<strong>on</strong>tinued)<br />
Website<br />
Shareholders are encouraged to visit our website<br />
www.unilever.com, which has a wealth of in<strong>form</strong>ati<strong>on</strong><br />
about <strong>Unilever</strong>.<br />
There is a secti<strong>on</strong> designed specifically for investors at<br />
www.unilever.com/investorcentre. It includes detailed coverage<br />
of the <strong>Unilever</strong> share price, our quarterly and annual results,<br />
per<strong>form</strong>ance charts, financial news and investor relati<strong>on</strong>s<br />
speeches and presentati<strong>on</strong>s. It also includes c<strong>on</strong>ference and<br />
investor/analyst presentati<strong>on</strong>s.<br />
You can also view this year’s and prior years’ <str<strong>on</strong>g>Annual</str<strong>on</strong>g> Review<br />
and <str<strong>on</strong>g>Annual</str<strong>on</strong>g> Report and Accounts documents at<br />
www.unilever.com/investorcentre.<br />
PLC shareholders can elect not to receive paper copies of<br />
the <str<strong>on</strong>g>Annual</str<strong>on</strong>g> Review, the <str<strong>on</strong>g>Annual</str<strong>on</strong>g> Report and Accounts and<br />
other shareholder documents by registering at<br />
www.unilever.com/shareholderservices if they prefer to view<br />
these <strong>on</strong> our website.<br />
Share registrati<strong>on</strong><br />
The Netherlands<br />
N.V. Algemeen Nederlands<br />
Trustkantoor ANT<br />
PO Box 11063<br />
1001 GB Amsterdam<br />
Teleph<strong>on</strong>e +31 (0)20 522 2555<br />
Telefax +31 (0)20 522 2500<br />
Email registers@ant-trust.nl<br />
UK<br />
Computershare Investor Services PLC<br />
PO Box 82<br />
The Pavili<strong>on</strong>s<br />
Bridgwater Road<br />
Bristol BS99 7NH<br />
Teleph<strong>on</strong>e +44 (0)870 600 3977<br />
Telefax +44 (0)870 703 6119<br />
Website www.unilever.com/shareholderservices<br />
Email web-queries@computershare.co.uk<br />
USA<br />
Citibank Shareholder Services<br />
PO Box 43077<br />
Providence RI 02940-3077<br />
Toll free ph<strong>on</strong>e (inside US) 888 502 6356<br />
Toll ph<strong>on</strong>e (outside US) +1 816 843 4281<br />
Website www.citibank.com/adr<br />
Email citibank@shareholders-<strong>on</strong>line.com<br />
Publicati<strong>on</strong>s<br />
Copies of the following publicati<strong>on</strong>s can be accessed directly<br />
or ordered through www.unilever.com/investorcentre or<br />
www.unilever.nl/<strong>on</strong>sbedrijf/beleggers.<br />
<strong>Unilever</strong> <str<strong>on</strong>g>Annual</str<strong>on</strong>g> Review <strong>2006</strong><br />
Including Summary Financial Statement. Available in English or<br />
Dutch, with financial in<strong>form</strong>ati<strong>on</strong> in euros, pounds sterling and<br />
US dollars.<br />
<strong>Unilever</strong> <str<strong>on</strong>g>Annual</str<strong>on</strong>g> Report and Accounts <strong>2006</strong><br />
Available in English or Dutch, with figures in euros. It <strong>form</strong>s<br />
the basis for the Form 20-F that is filed with the United States<br />
Securities and Exchange Commissi<strong>on</strong>.<br />
Quarterly Results Announcements<br />
Available in English or Dutch, with figures in euros; supplements<br />
in English, with pounds sterling or US dollar figures, are<br />
also available.<br />
<strong>Unilever</strong> <str<strong>on</strong>g>Annual</str<strong>on</strong>g> Report <strong>on</strong> Form 20-F<br />
Filed with the SEC at www.sec.gov. Printed copies are available,<br />
free of charge, up<strong>on</strong> request to <strong>Unilever</strong> United States, Inc.,<br />
Investor Relati<strong>on</strong>s Department, 700 Sylvan Avenue,<br />
Englewood Cliffs, NJ 07632, USA.<br />
<strong>Unilever</strong> <str<strong>on</strong>g>Annual</str<strong>on</strong>g> Report <strong>on</strong> Form 20-F <strong>2006</strong> 159<br />
Shareholder in<strong>form</strong>ati<strong>on</strong> (c<strong>on</strong>tinued)
Shareholder in<strong>form</strong>ati<strong>on</strong> (c<strong>on</strong>tinued)<br />
Index<br />
Accounting policies 1, 23-24, 74-78<br />
Acquisiti<strong>on</strong>s 29, 74, 113<br />
Advertising and promoti<strong>on</strong> 24<br />
Americas, The 16-17, 79-81<br />
<str<strong>on</strong>g>Annual</str<strong>on</strong>g> General Meetings 38, 158<br />
Asia Africa 18-19, 79-81<br />
Associates 92, 122<br />
Audit Committee 37, 63<br />
Auditors 63, 69, 123<br />
Balance sheet 30, 72<br />
Biographical details 46-47<br />
Biological assets 92<br />
Board committees 37-38<br />
Board remunerati<strong>on</strong> 49-62<br />
Boards 34<br />
Borrowings 76, 96-98<br />
Brands 6, 20<br />
Capital expenditure 80, 82, 90-91<br />
Cash 76, 95<br />
Cash flow 31, 73, 116<br />
Categories 5<br />
Chairman 3-4, 35<br />
Commitments 112<br />
Competiti<strong>on</strong> 5<br />
C<strong>on</strong>tingent liabilities 112<br />
Corporate governance 33-47<br />
Corporate resp<strong>on</strong>sibility 9<br />
Corporate Resp<strong>on</strong>sibility and Reputati<strong>on</strong> Committee 37, 64<br />
Deferred tax 24, 93<br />
Depreciati<strong>on</strong> 80, 90-91<br />
Directors’ resp<strong>on</strong>sibilities 66-67<br />
Disc<strong>on</strong>tinued operati<strong>on</strong>s 114-115<br />
Disposals 29, 113<br />
Distributi<strong>on</strong> 5<br />
Diversity 7<br />
Dividends 29, 88, 155, 158<br />
Earnings per share 41, 70, 87<br />
Employees 6-7<br />
Equalisati<strong>on</strong> Agreement 39-40<br />
Equity 108<br />
Europe 14-15, 79-81<br />
Exchange rates 24, 74, 146<br />
Executive Directors 35-36, 46, 51-53, 55-60<br />
Exports 6<br />
Finance and liquidity 31<br />
Finance costs and income 84<br />
Financial calendar 158<br />
Financial instruments 23, 75-76, 99-101<br />
Financial review 23-32<br />
Foods 6, 81-82<br />
Functi<strong>on</strong>s 5<br />
Goodwill 23, 75, 88-89<br />
Gross profit 83<br />
Group Chief Executive 11-12, 35<br />
Group structure 1<br />
Guarantor statements 135-140<br />
Home and Pers<strong>on</strong>al Care 6, 81-82<br />
Home care 6, 81-82<br />
Ice cream and beverages 6, 81-82<br />
Impairment 88-89<br />
Income statement 70<br />
In<strong>form</strong>ati<strong>on</strong> technology 7<br />
Innovati<strong>on</strong> 20-22<br />
Intangible assets 23, 75, 88-89<br />
160 <strong>Unilever</strong> <str<strong>on</strong>g>Annual</str<strong>on</strong>g> Report <strong>on</strong> Form 20-F <strong>2006</strong><br />
Intellectual property 7<br />
Internal and disclosure c<strong>on</strong>trols 66<br />
Internati<strong>on</strong>al Financial Reporting Standards (IFRS) 1, 74, 141-142<br />
Inventories 76, 94<br />
Joint ventures 92, 122<br />
Key management 122<br />
Key per<strong>form</strong>ance indicators 5<br />
Laws and regulati<strong>on</strong> 8<br />
Leases 77, 112<br />
Legal proceedings 8-9<br />
Market capitalisati<strong>on</strong> 29<br />
Net debt 27<br />
Nominati<strong>on</strong> Committee 37, 48<br />
N<strong>on</strong>-Executive Directors 36, 46, 53, 61-62<br />
N<strong>on</strong>-GAAP measures 24<br />
Off-balance sheet arrangements 31<br />
Operating costs 83<br />
Operating profit 79-82<br />
Operating review 13-22<br />
Payables 102<br />
Pensi<strong>on</strong>s and similar obligati<strong>on</strong>s 23-24, 32, 76, 103-107, 126-130<br />
Pers<strong>on</strong>al care 6, 81-82<br />
Post balance sheet events 32, 123<br />
Preference shares and dividends 96, 158<br />
Principal group companies 147-148<br />
Property, plant and equipment 8, 75, 90-91<br />
Provisi<strong>on</strong>s 24, 77, 102<br />
Receivables 94<br />
Regi<strong>on</strong>s 5, 13-19<br />
Related party transacti<strong>on</strong>s 6, 122<br />
Remunerati<strong>on</strong> Committee 37, 49-62<br />
Research and development 20-21<br />
Reserves 110<br />
Restructuring 83, 102<br />
Retained profit 111<br />
Return <strong>on</strong> invested capital (ROIC) 24-26<br />
Revenue recogniti<strong>on</strong> 77<br />
Risk management 9, 63, 100-101<br />
Sarbanes-Oxley 68<br />
Savoury, dressings and spreads 6, 81-82<br />
Seas<strong>on</strong>ality 6<br />
Segment in<strong>form</strong>ati<strong>on</strong> 77, 79-82, 132-133<br />
Share-based payments 77, 117-121<br />
Share capital 41, 109<br />
Shareholders 38-39, 149-150<br />
Share prices 152<br />
Share registrati<strong>on</strong> 159<br />
Staff costs 84<br />
Statement of recognised income and expense 71<br />
Strategy 5<br />
Taxati<strong>on</strong> 76-77, 85-86<br />
Total shareholder return (TSR) 24, 27<br />
Treasury 31<br />
Turnover 79-82<br />
<strong>Unilever</strong> Executive (UEx) 47<br />
<strong>Unilever</strong> Foodsoluti<strong>on</strong>s 6<br />
Underlying sales growth (USG) 25<br />
Ungeared free cash flow (UFCF) 24-26<br />
US GAAP 124-140, 145<br />
Ventures 6<br />
Vitality 21<br />
Voting 39<br />
Website 159
Cauti<strong>on</strong>ary statement<br />
This document may c<strong>on</strong>tain forward-looking statements, including ‘forward-looking statements’ within the meaning of the United States Private Securities Litigati<strong>on</strong><br />
Re<strong>form</strong> Act of 1995. Words such as ‘expects’, ‘anticipates’, ‘intends’ or the negative of these terms and other similar expressi<strong>on</strong>s of future per<strong>form</strong>ance or results,<br />
including financial objectives to 2010, and their negatives are intended to identify such forward-looking statements. These forward-looking statements are based<br />
up<strong>on</strong> current expectati<strong>on</strong>s and assumpti<strong>on</strong>s regarding anticipated developments and other factors affecting the Group. They are not historical facts, nor are they<br />
guarantees of future per<strong>form</strong>ance. Because these forward-looking statements involve risks and uncertainties, there are important factors that could cause actual<br />
results to differ materially from those expressed or implied by these forward-looking statements, including, am<strong>on</strong>g others, competitive pricing and activities,<br />
c<strong>on</strong>sumpti<strong>on</strong> levels, costs, the ability to maintain and manage key customer relati<strong>on</strong>ships and supply chain sources, currency values, interest rates, the ability to<br />
integrate acquisiti<strong>on</strong>s and complete planned divestitures, physical risks, envir<strong>on</strong>mental risks, the ability to manage regulatory, tax and legal matters and resolve<br />
pending matters within current estimates, legislative, fiscal and regulatory developments, political, ec<strong>on</strong>omic and social c<strong>on</strong>diti<strong>on</strong>s in the geographic markets where<br />
the Group operates and new or changed priorities of the Boards. Further details of potential risks and uncertainties affecting the Group are described in the Group’s<br />
filings with the L<strong>on</strong>d<strong>on</strong> Stock Exchange, Eur<strong>on</strong>ext Amsterdam and the US Securities and Exchange Commissi<strong>on</strong>, including the <str<strong>on</strong>g>Annual</str<strong>on</strong>g> Report <strong>on</strong> Form 20-F. These<br />
forward-looking statements speak <strong>on</strong>ly as of the date of this document. Except as required by any applicable law or regulati<strong>on</strong>, the Group expressly disclaims any<br />
obligati<strong>on</strong> or undertaking to release publicly any updates or revisi<strong>on</strong>s to any forward-looking statements c<strong>on</strong>tained herein to reflect any change in the Group’s<br />
expectati<strong>on</strong>s with regard thereto or any change in events, c<strong>on</strong>diti<strong>on</strong>s or circumstances <strong>on</strong> which any such statement is based.<br />
Designed and produced by <strong>Unilever</strong> Communicati<strong>on</strong>s<br />
in c<strong>on</strong>juncti<strong>on</strong> with Addis<strong>on</strong> Corporate Marketing<br />
Photography by Igor Emmerich<br />
Typeset by Pauffley, L<strong>on</strong>d<strong>on</strong><br />
Printed by St Ives Westerham Press Ltd. ISO 14001:2004<br />
This document is printed <strong>on</strong> Greencoat Plus Velvet which<br />
has been independently certified according to the rules<br />
of the Forest Stewardship Council (FSC). Greencoat Plus<br />
Velvet c<strong>on</strong>tains 80% recycled fibre. The manufacturing<br />
mill is accredited with the ISO 14001 Envir<strong>on</strong>mental<br />
Standard. In recogniti<strong>on</strong> of its recycled c<strong>on</strong>tent Greencoat<br />
Plus Velvet has also been awarded the NAPM recycled<br />
mark. This document is completely recyclable. If you have<br />
finished with it and no l<strong>on</strong>ger wish to retain it, please pass<br />
it <strong>on</strong> to other interested readers or dispose of it in your<br />
recycled paper waste, thank you.
<strong>Unilever</strong> N.V.<br />
Weena 455, PO Box 760<br />
3000 DK Rotterdam<br />
The Netherlands<br />
T +31 (0)10 217 4000<br />
F +31 (0)10 217 4798<br />
Commercial Register Rotterdam<br />
Number: 24051830<br />
<strong>Unilever</strong> PLC<br />
PO Box 68, <strong>Unilever</strong> House<br />
100 Victoria Embankment<br />
L<strong>on</strong>d<strong>on</strong> EC4P 4BQ<br />
United Kingdom<br />
T +44 (0)20 7822 5252<br />
F +44 (0)20 7822 5951<br />
<strong>Unilever</strong> PLC registered office<br />
<strong>Unilever</strong> PLC<br />
Port Sunlight<br />
Wirral<br />
Merseyside CH62 4ZD<br />
United Kingdom<br />
Registered in England and Wales<br />
Company Number: 41424<br />
<strong>Unilever</strong> United States, Inc.<br />
Investor Relati<strong>on</strong>s Department<br />
700 Sylvan Avenue<br />
Englewood Cliffs<br />
NJ 07632<br />
USA<br />
T +1 201 894 2615<br />
F +1 201 894 2222<br />
www.unilever.com