Manual on sea level measurement and ... - unesdoc - Unesco
Manual on sea level measurement and ... - unesdoc - Unesco
Manual on sea level measurement and ... - unesdoc - Unesco
- No tags were found...

Create successful ePaper yourself
Turn your PDF publications into a flip-book with our unique Google optimized e-Paper software.
<str<strong>on</strong>g>Manual</str<strong>on</strong>g>s <strong>and</strong> Guides 14Intergovernmental Oceanographic Commissi<strong>on</strong><str<strong>on</strong>g>Manual</str<strong>on</strong>g> <strong>on</strong> Sea LevelMeasurement <strong>and</strong> Interpretati<strong>on</strong>Volume IV: An Update to 2006JCOMM Technical Report No. 31WMO/TD. No. 1339........... . . . . . . . .
The designati<strong>on</strong>s employed <strong>and</strong> the presentati<strong>on</strong> of the material in this publicati<strong>on</strong> do not imply the expressi<strong>on</strong> of any opini<strong>on</strong> whatsoever <strong>on</strong> the partof the Secretariats of UNESCO <strong>and</strong> IOC c<strong>on</strong>cerning the legal status of any country or territory, or its authorities, or c<strong>on</strong>cerning the delimitati<strong>on</strong> of the fr<strong>on</strong>tiersof any country or territory.Layout <strong>and</strong> design by Eric LoddéFor bibliographic purposes, this document should be cited as follows:<str<strong>on</strong>g>Manual</str<strong>on</strong>g> <strong>on</strong> Sea-<strong>level</strong> Measurements <strong>and</strong> Interpretati<strong>on</strong>, Volume IV : An update to 2006. Paris, Intergovernmental Oceanographic Commissi<strong>on</strong> of UNESCO. 78 pp.(IOC <str<strong>on</strong>g>Manual</str<strong>on</strong>g>s <strong>and</strong> Guides No.14, vol. IV ; JCOMM Technical Report No.31; WMO/TD. No. 1339) (English)Rev. 2006/09Printed in 2006by the United Nati<strong>on</strong>s Educati<strong>on</strong>al, Scientific <strong>and</strong> Cultural Organizati<strong>on</strong>7, place de F<strong>on</strong>tenoy, 75352 Paris 07 SP© UNESCO 2006Printed in France(SC-2006/WS/38)
Sea Level Measurement <strong>and</strong> Interpretati<strong>on</strong>Table of c<strong>on</strong>tents1. Introducti<strong>on</strong> .......................................................................................................... 12. The Nature of Sea Level Variati<strong>on</strong>s ..................................................................... 22.1 Introducti<strong>on</strong> ...................................................................................................................................22.2 Surface Waves ................................................................................................................................32.3 Seiches ...........................................................................................................................................42.4 Tides ..............................................................................................................................................42.4.1 Tidal Analysis .................................................................................................................................52.5 Storm surges ..................................................................................................................................62.6 Tsunamis ........................................................................................................................................72.7 Mean Sea Level <strong>and</strong> Trends ............................................................................................................72.8 Estimati<strong>on</strong> of Extreme Sea Levels ....................................................................................................72.8.1 Introducti<strong>on</strong> ..................................................................................................................................72.8.2 The Annual Maximum Method (AMM) .........................................................................................82.8.3 The Joint Probabilities Method (JPM) .............................................................................................82.8.4 The Revised Joint Probabilities Method (RJPM) ..............................................................................92.8.5 The Exceedance Probabilities Method ...........................................................................................92.8.6 Spatial Estimati<strong>on</strong> of Extremes ......................................................................................................93. Instruments for the Measurement of Sea Level .............................................. 103.1 Introducti<strong>on</strong> .................................................................................................................................103.1.1 The Choice of a Tide Gauge Site ................................................................................................ 103.2 The Stilling Well ...........................................................................................................................123.2.1 Datum Switches ..........................................................................................................................123.3. Pressure Gauges ..........................................................................................................................133.3.1 Pneumatic Bubbler Gauges .........................................................................................................133.3.2 Pressure Sensor Gauges ..............................................................................................................143.3.3 The Datum of a Pressure System .................................................................................................153.3.4 Multiple Pressure Transducer Systems (‘B’ gauges) ......................................................................163.3.5 Pressure Transducers in Stilling Wells ...........................................................................................163.3.6 Bottom-mounted Pressure Gauges .............................................................................................163.4 Acoustic Tide Gauges ...................................................................................................................173.4.1 Acoustic Gauges with Sounding Tubes .......................................................................................173.4.2 Acoustic Gauges without Sounding Tubes ..................................................................................173.5 Radar Gauges ...............................................................................................................................193.6 Summary of the Merits of Different Technologies .........................................................................21iii
Sea Level Measurement <strong>and</strong> Interpretati<strong>on</strong>4. Datum C<strong>on</strong>trol <strong>and</strong> Levelling ............................................................................. 284.1 Datums <strong>and</strong> Benchmarks ..............................................................................................................284.1.1 Tide Gauge Benchmark (TGBM) ..................................................................................................294.1.2 GPS Benchmark (GPSBM) ............................................................................................................294.1.3 Gauge C<strong>on</strong>tact Point (CP) ...........................................................................................................294.1.4 Tide Gauge Zero (TGZ) ................................................................................................................294.1.5 Revised Local Reference (RLR) Datum ..........................................................................................294.1.6 Nati<strong>on</strong>al Levelling Network .........................................................................................................294.1.7 Chart Datum ...............................................................................................................................304.1.8 Working Datums .........................................................................................................................304.2 Levelling Between Local Benchmarks ............................................................................................304.3 Levelling Between Wider Area Marks ...........................................................................................304.4 Geodetic Fixing of Tide Gauge Benchmarks ..................................................................................314.4.1 Introducti<strong>on</strong> ............................................................................................................................... 314.4.2 GPS Measurements .....................................................................................................................324.4.3 DORIS Measurements ................................................................................................................ 334.4.4 Absolute Gravity Measurements ................................................................................................ 334.4.5 Geocentric Co-ordinates <strong>and</strong> Vertical L<strong>and</strong> Movements of Tide Gauge Benchmarks .................. 345. Real Time Data Transmissi<strong>on</strong> ............................................................................. 355.1 Introducti<strong>on</strong> .................................................................................................................................355.2 Choice of a System ......................................................................................................................385.3 Data Transmissi<strong>on</strong> Systems ......................................................................................................................395.3.1 Systems already well established .................................................................................................395.3.2 Systems now being applied or c<strong>on</strong>sidered for applicati<strong>on</strong>in the transmissi<strong>on</strong> of <strong>sea</strong> <strong>level</strong> data ............................................................................................395.3.3 The Global Telecommunicati<strong>on</strong>s System (GTS) ............................................................................415.4 Data Transmissi<strong>on</strong> Formats ...........................................................................................................416. Quality C<strong>on</strong>trol of Data ...................................................................................... 427. Training Materials <strong>and</strong> C<strong>on</strong>tacts ........................................................................ 438. New Techniques for Sea Level Measurements ................................................. 458.1 GPS <strong>on</strong> Buoys ...............................................................................................................................458.2 GNSS Reflectometry .....................................................................................................................46References ............................................................................................................... 48Appendices .............................................................................................................. 52I. GLOSS Requirements for Tide Gauges .............................................................................................52II. Previous Volumes of the IOC <str<strong>on</strong>g>Manual</str<strong>on</strong>g> ..............................................................................................53III. List of Websites ..............................................................................................................................55IV. List of Acr<strong>on</strong>yms ............................................................................................................................56iv
Sea Level Measurement <strong>and</strong> Interpretati<strong>on</strong>V. C<strong>on</strong>tributed Practical Experiences with Various Tide Gauge Technologies ...................................................58FLOAT GAUGES IN STILLING WELLS: EXPERIENCE IN NORWAY ...........................................................58D. Hareide, H. Hodnesdal, T. Tørresen <strong>and</strong> T. Ellef Hansen ØstebøvikTHE ESEAS-RI SEA LEVEL PILOT STATION IN VILAGARCÍA DE AROUSA ...............................................61B. Martín, B. Pérez, E. Alvarez FanjulCOMPARISON OF RADAR DEVICES IN GERMANY ...............................................................................65C. J. Blasi <strong>and</strong> U. BarjenbruchEXPERIENCE WITH SRD TIDE GAUGES AND REASONINGBEHIND CHANGE TO RADAR TIDE GAUGES .......................................................................................67R. FarrePRESSURE GAUGE BASED GLOSS SEA LEVEL STATIONAT TAKORADI HARBOUR (GHANA, WEST AFRICA): EXPERIENCES OVER A YEAR ................................69A. Joseph, P. Mehra, J. Odammetey <strong>and</strong> N. E. KofiCHILEAN SEA LEVEL NETWORK ..........................................................................................................72J. FierroGAUGES FOR TSUNAMI WARNING ....................................................................................................75B. Kil<strong>on</strong>skyODINAFRICA TIDE GAUGE SPECIFICATION AUGUST 2005 ..................................................................76P. FodenTIDETOOL – A SOFTWARE PACKAGE TO DISPLAY AND DECODE SEA LEVEL DATATRANSMITTED OVER THE WMO GLOBAL TELECOMMUNICATIONS SYSTEM ......................................77L. K<strong>on</strong>gv
Sea Level Measurement <strong>and</strong> Interpretati<strong>on</strong>1. Introducti<strong>on</strong>This is the fourth in the series of IOC <str<strong>on</strong>g>Manual</str<strong>on</strong>g>s <strong>on</strong> SeaLevel Measurement <strong>and</strong> Interpretati<strong>on</strong>. It incorporatesthe changes in tide gauge technology <strong>and</strong> <strong>measurement</strong>techniques in the five years since the thirdmanual was written, <strong>and</strong> includes material from theWorkshop <strong>on</strong> New Technical Developments in Sea <strong>and</strong>L<strong>and</strong> Level Observing Systems (UNESCO, Paris, 14–16October 2003). In additi<strong>on</strong>, it reflects to a great extentthe changes in priorities for tide gauges in a globalnetwork which have taken place in recent years. Forexample, it is inc<strong>on</strong>ceivable now that most gaugesinstalled in the GLOSS network will be without a realtimereporting capability <strong>and</strong> a capacity to provide dataof use to a tsunami warning system.The manual includes some secti<strong>on</strong>s of text from theearlier editi<strong>on</strong>s, updated as appropriate. However,for reas<strong>on</strong>s of space it does not include some othersecti<strong>on</strong>s from the earlier versi<strong>on</strong>s, even though theyare still valid <strong>and</strong> useful (e.g. the discussi<strong>on</strong> of dataquality c<strong>on</strong>trol <strong>and</strong> filters in Volume III, see the presentAppendix II). The earlier editi<strong>on</strong>s c<strong>on</strong>tinue to be readilyavailable <strong>on</strong> the web at http://www.pol.ac.uk/psmsl/manuals/.In order to provide a fresh perspective, this volumehas been largely written by new people. A c<strong>on</strong>sultant(Dr. Ian Vassie) produced a first draft. Drs. Tilo Schöne<strong>and</strong> Georg Beyerle of GFZ, Postdam, c<strong>on</strong>tributed thetext for secti<strong>on</strong> 8. The first drafts were commented<strong>on</strong> <strong>and</strong> edited by the GLOSS Technical Subcommittee(Chair Dr. Begoña Pérez) <strong>and</strong> the volume was subsequentlyreviewed by members of the GLOSS Groupof Experts <strong>and</strong> Mr David Meldrum provided additi<strong>on</strong>alcomments <strong>on</strong> Secti<strong>on</strong> 5.The following secti<strong>on</strong> provides a brief overview of<strong>sea</strong> <strong>level</strong> variati<strong>on</strong>s which may be of general interest,including a discussi<strong>on</strong> of estimati<strong>on</strong> of extreme <strong>level</strong>sthat was missing from earlier editi<strong>on</strong>s. However, thevolume is largely c<strong>on</strong>cerned with tide gauge <strong>and</strong> datacommunicati<strong>on</strong>s technologies <strong>and</strong> aimed at peoplewho work in those fields. These are rapidly developingtopics, <strong>and</strong> <strong>on</strong>es in which the sharing of experti<strong>sea</strong>m<strong>on</strong>g groups is essential. Some readers of this volumemay, therefore, have different perspectives <strong>on</strong> <strong>sea</strong> <strong>level</strong><strong>measurement</strong>s. Some of these independent views areexpressed in the c<strong>on</strong>tributi<strong>on</strong>s given in Appendix V.Each of these authors has expressed willingness to provideadvice to others as required.We thank every<strong>on</strong>e who c<strong>on</strong>tributed material for, <strong>and</strong>advice <strong>on</strong>, this volume. In particular, we thank RobertSmith of the Proudman Oceanographic Laboratory forhis technical assistance <strong>and</strong> Ray C. Griffiths for editorialassistance.Thorkild Aarup(GLOSS Technical Secretary)Mark Merrifield(Chair GLOSS Group of Experts)Begoña Pérez(Chair GLOSS Technical Subcommittee)Ian Vassie(C<strong>on</strong>sultant)Philip Woodworth(Director, Permanent Service for Mean Sea Level)June 2006IOC <str<strong>on</strong>g>Manual</str<strong>on</strong>g>s <strong>and</strong> Guides No 14 vol IV1
Sea Level Measurement <strong>and</strong> Interpretati<strong>on</strong>2. The Nature of Sea LevelVariati<strong>on</strong>s2.1 Introducti<strong>on</strong>The study of <strong>sea</strong> <strong>level</strong> has many different facets. It is notsimply the <strong>measurement</strong> of the <strong>sea</strong> <strong>level</strong> that requirestechnical expertise. The data must be carefully calibrated,checked <strong>and</strong> evaluated. The <strong>measurement</strong>s should be tiedto local benchmarks that in turn are fixed into a country’snati<strong>on</strong>al <strong>level</strong>ling network <strong>and</strong> further fixed into the globalnetwork using modern geodetic techniques. The recordeddata need to be archived, documented <strong>and</strong> protectedfor future studies. Only then is it of benefit as a valuableresource <strong>and</strong> can be used for studies ranging from localengineering projects to l<strong>on</strong>g-term global climate change.Variati<strong>on</strong>s in <strong>sea</strong> <strong>level</strong> c<strong>on</strong>tain c<strong>on</strong>tributi<strong>on</strong>s from differentphysical sources that are usually distinguished bytheir period. Comp<strong>on</strong>ents range from surface gravitywaves with periods of 1 to 20 sec<strong>on</strong>ds; seiches <strong>and</strong>tsunamis with periods of minutes to over an hour; tidescentred around 1/2 <strong>and</strong> 1 day; meteorological effectsof several days to 1 year; interannual <strong>and</strong> decadalvariability; <strong>and</strong> l<strong>on</strong>g-term trends in the mean <strong>level</strong>caused by geological <strong>and</strong> climatological effects. Themagnitudes of these comp<strong>on</strong>ents vary enormously.Surface gravity waves can have amplitudes up to 30 m.Tsumanis tend to be less than 1 m in the deep oceanbut may be several metres near the coast. Tides arerelatively small in the ocean but may be 10 metres nearthe coast. Storm surges may be of the order of a fewmetres in shallow <strong>sea</strong>s. Within this mix <strong>on</strong>e is tryingto estimate l<strong>on</strong>g-term trends in the mean <strong>level</strong> of theorder of 1 mm per year. The fact that this is possible,<strong>and</strong> has been for over 100 years, is testim<strong>on</strong>y to theexpertise <strong>and</strong> dedicati<strong>on</strong> of the engineers <strong>and</strong> scientistswho are involved in <strong>sea</strong> <strong>level</strong> re<strong>sea</strong>rch.The majority of historical <strong>sea</strong> <strong>level</strong> data were collected fromfloat <strong>and</strong> stilling-well tide gauges with analogue charts,many of which are still in existence, but superseded by themodern trend to the digital systems described below. Withdigital technology it is possible to improve the accuracy<strong>and</strong> reliability of the data <strong>and</strong> make the data available tothe user in real time.In analogue form the charts were always available forre-analysis <strong>and</strong> errors could be rectified by reappraisal ofthe chart <strong>and</strong> re-sampling of the pen-trace, if necessary.In digital form a corresp<strong>on</strong>ding re-analysis is not alwayspossible. The decisi<strong>on</strong> has to be made in advance as towhat is a reas<strong>on</strong>able sampling (or averaging) interval. Onecannot return <strong>and</strong> re-sample the data at a more frequentinterval. In the past, the generally accepted sampling (oraveraging) rate was 1 hour, since this allowed the studyof all processes, from tides to mean <strong>sea</strong> <strong>level</strong> (IOC, 1990).Waves were, by their nature, c<strong>on</strong>sidered a different scientificprovince <strong>and</strong> were filtered out of the data. Morerecently, the sampling frequency has been increased to 15minutes, 6 minutes <strong>and</strong> even higher rates.The disastrous tsunami of 26 December 2004 in theIndian Ocean made it clear that the normal tide gaugesampling would be inadequate <strong>and</strong> that it would be necessaryto increase it to 1 minute or ideally to 15 sec<strong>on</strong>ds.This places c<strong>on</strong>straints <strong>on</strong> the tide gauge technology <strong>and</strong>increases the dem<strong>and</strong> <strong>on</strong> the storage <strong>and</strong> transmissi<strong>on</strong>requirements of a tide gauge network. There is a balanceto be struck between the need to capture the essence ofthe data <strong>and</strong> the need to store <strong>and</strong> perhaps transmit largevolumes of data.2IOC <str<strong>on</strong>g>Manual</str<strong>on</strong>g>s <strong>and</strong> Guides No 14 vol IV
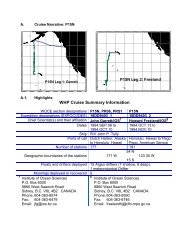
Sea Level Measurement <strong>and</strong> Interpretati<strong>on</strong>Figure 2.1 Spectrum of Sea Level Variati<strong>on</strong>s. The l<strong>on</strong>g-period variati<strong>on</strong>s <strong>and</strong> mean <strong>sea</strong> <strong>level</strong> changes are part of theenhanced energy at low frequencies.A sec<strong>on</strong>d important issue is that, historically, a tide gaugewas attended c<strong>on</strong>tinuously by a trained observer whocollected ancillary tide-pole informati<strong>on</strong>, <strong>and</strong> height <strong>and</strong>datum correcti<strong>on</strong>s were appended to the chart weekly.This produced a very stable reference <strong>and</strong> of course meantthat faults were quickly identified. In modern systems thedatum <strong>and</strong> calibrati<strong>on</strong>s tend to be checked less frequently.Thus greater reliance is placed <strong>on</strong> the accuracy <strong>and</strong> stabilityof the measuring equipment. Fortunately, modern technologicalimprovements have allowed this, not <strong>on</strong>ly throughbetter equipment, but with two-way communicati<strong>on</strong> the<strong>sea</strong> <strong>level</strong> stati<strong>on</strong> can be interrogated <strong>and</strong> its operati<strong>on</strong>alcharacteristics adjusted as necessary.The need for an operator to be permanently at the tidegauge has been removed. Perhaps <strong>on</strong>e can speculate thatit is time to withdraw all manual interventi<strong>on</strong>. Certainly,with the growing requirement for real-time data, manualinterventi<strong>on</strong> will not always be possible. In the future, the<strong>on</strong>ly viable approach might be to check <strong>and</strong> authenticatethe data automatically at source before transmissi<strong>on</strong>. It canthen be passed to the end user <strong>and</strong> be placed in a formthat can be entered directly into the global <strong>sea</strong> <strong>level</strong> databanks without interventi<strong>on</strong>.2.2 Surface WavesSurface waves are probably the most noticeable variati<strong>on</strong>of the <strong>sea</strong> surface to a casual observer. They have beenrelatively little discussed in previous editi<strong>on</strong>s of this manual,as most tide gauges are designed to filter out such waves.However a brief descripti<strong>on</strong> of their characteristics is worthincluding, as the design of a tide gauge relies <strong>on</strong> an underst<strong>and</strong>ingof their general characteristics.Waves are characterized as wind-waves or swell. Windwavesare generated by the effect of the wind <strong>on</strong> the local<strong>sea</strong> surface <strong>and</strong> have a relatively broad spectrum. Swell isproduced when the waves propagate out of a storm area.They occupy a narrower part of the spectrum. In general,wind waves have periods from 1 to 15 sec<strong>on</strong>ds, <strong>and</strong> swell,from 12 to 25 sec<strong>on</strong>ds, although this definiti<strong>on</strong> is notexclusive. Outside this range of periods, wave amplitudesare small. Wave period is usually calculated via the timebetween successive zero up-crosses of the wave (T z ).Wave heights are usually defined in terms of theirpeak-to-trough range in height, although wave amplitudeis sometimes calculated as the height above amean <strong>level</strong>. Significant wave height (Hs) is the usuallyquoted parameter which closely approximatesthe height of the highest <strong>on</strong>e-third of the waves in agiven period of time. Traditi<strong>on</strong>ally, a wave record hasa durati<strong>on</strong> of 20 minutes <strong>and</strong> is re-sampled every 3hours, choices which were derived originally from thestochastic properties of storm durati<strong>on</strong>. It is difficultto give an overall figure for maximum wave height,as it depends critically <strong>on</strong> locati<strong>on</strong>. Waves are subjectto amplificati<strong>on</strong>, dispersi<strong>on</strong>, refracti<strong>on</strong> <strong>and</strong> focusing.In general, significant wave heights of several metresare comm<strong>on</strong> during a storm, but individual waves upto 30 metres have been measured.IOC <str<strong>on</strong>g>Manual</str<strong>on</strong>g>s <strong>and</strong> Guides No 14 vol IV3
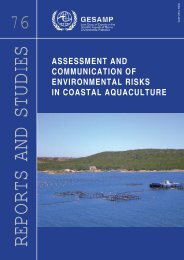
Sea Level Measurement <strong>and</strong> Interpretati<strong>on</strong>Wave activity with a period of a few minutes can becaused by n<strong>on</strong>-linear effects; e.g. when the wavesencounter a current or a change in bottom topography.These l<strong>on</strong>ger-period waves occur because the height ofsuccessive waves is not uniform; they occur in groupsof higher or lower waves. This leads to the popularmisc<strong>on</strong>cepti<strong>on</strong> that every seventh wave is the highest.In fact, the wave groups are not of equal length butthey do produce n<strong>on</strong>-linear effects that have periodsrelated to the period of the wave groups. The mostsignificant effect of this, as far as the study of <strong>sea</strong> <strong>level</strong>is c<strong>on</strong>cerned, is that the wave groups produce ‘set-up’of the <strong>sea</strong> <strong>level</strong> near the coast. The degree of ‘set-up’depends <strong>on</strong> many factors, of which the shape of thebeach is the most critical. Set-up can be of the order ofa few tens of centimetres during a severe storm.Waves have directi<strong>on</strong>al properties as well as a magnitude.Many early recordings were <strong>on</strong>ly c<strong>on</strong>cerned withwave height, because instruments capable of measuringdirecti<strong>on</strong> were not available. Wave riders from thisera were moored to the <strong>sea</strong> bed <strong>on</strong> a flexible coupling<strong>and</strong> c<strong>on</strong>tained accelerometers which were integratedtwice to obtain wave height. However, modern mooringsare now available which are capable of measuringpitch <strong>and</strong> roll of the surface buoy, from which directi<strong>on</strong>alinformati<strong>on</strong> can be derived.Coastal tide gauges tend not to be located optimallyto measure wave c<strong>on</strong>diti<strong>on</strong>s in the nearby deep ocean.However, they can at times provide useful informati<strong>on</strong>with the correct (pressure) gauge technology. Vassieet al. (2004) provide a recent descripti<strong>on</strong> of the useof pressure tide gauges to measure swell at oceanisl<strong>and</strong>s.2.3 SeichesSeiches are periodic variati<strong>on</strong>s in the surface <strong>level</strong> usuallyset in moti<strong>on</strong> by a disturbance such as a str<strong>on</strong>g wind or current,a sudden change in atmospheric pressure or even atsunami. In lakes <strong>and</strong> gulfs their period is c<strong>on</strong>trolled by thedimensi<strong>on</strong>s of the basin <strong>and</strong> their lifetime is determined byfricti<strong>on</strong>al effects. Typical periods are in the range of a fewminutes to a few hours (between wind waves <strong>and</strong> tides),<strong>and</strong> typical amplitudes are centimetric to decimetric. Theycan be seen <strong>on</strong> tide gauge records from almost all regi<strong>on</strong>s.Seiches have largely been ignored in most <strong>sea</strong> <strong>level</strong> studies,owing to their primarily local origin, but knowledgeof them is important for coastal <strong>and</strong> harbour engineeringas well as for harbour operati<strong>on</strong>s, where small-amplitudeseiches may be associated with str<strong>on</strong>g currents at theentrance of the harbour. On the other h<strong>and</strong>, they can havea major effect <strong>on</strong> other <strong>sea</strong> <strong>level</strong> studies. For example, iftheir amplitude is large enough, <strong>and</strong> if the sampling rate ofthe tide gauge is insufficiently high, then their energy canbe aliased into tidal <strong>and</strong> other <strong>sea</strong> <strong>level</strong> signals.2.4 TidesThe oceans resp<strong>on</strong>d to the gravitati<strong>on</strong>al attracti<strong>on</strong> of theMo<strong>on</strong> <strong>and</strong> the Sun, <strong>and</strong> the solar radiati<strong>on</strong>, to producethe tides, which are normally the predominant signalsin <strong>sea</strong> <strong>level</strong> records. The tides are easy to distinguishfrom other comp<strong>on</strong>ents of <strong>sea</strong> <strong>level</strong> variati<strong>on</strong> (e.g. stormsurges) because they have well defined periods, whereasother processes tend to occur at irregular intervals.An examinati<strong>on</strong> of the forces causing the tides leadssome way towards an underst<strong>and</strong>ing of their nature. Thisexaminati<strong>on</strong> is usually via discussi<strong>on</strong> of the EquilibriumTide (Doods<strong>on</strong> <strong>and</strong> Warburg, 1941; Forrester, 1983;Pugh, 1987; Open University, 1989). The gravitati<strong>on</strong>alattracti<strong>on</strong> of the Mo<strong>on</strong> <strong>and</strong> Sun <strong>on</strong> the Earth producesa semi-diurnal (2 cycles per day) ‘tidal bulge’, whichis usually oriented at an angle to the equator producingthe diurnal (1 cycle per day) tidal comp<strong>on</strong>ents. Thediurnal <strong>and</strong> semi-diurnal waves both have a planetaryspace scale. As the Earth rotates about its axis, signalsc<strong>on</strong>taining the above periods, but usually dominated bythe semi-diurnal comp<strong>on</strong>ent, should appear in the <strong>sea</strong><strong>level</strong> record. A lunar day is slightly l<strong>on</strong>ger than a solar dayby approximately 50 minutes, leading to lunar <strong>and</strong> solartides of differing periods which interact over 14 days toproduce the Spring-Neap cycle.Study of the celestial moti<strong>on</strong> of the Earth–Mo<strong>on</strong>–Sunsystem leads to a more complex form of the tidal potential(or Equilibrium Tide) in which the main c<strong>on</strong>stituentsare modulated at periods of 1 m<strong>on</strong>th, 1 year, 8.85 years,18.61 years <strong>and</strong> 21,000 years. The effect of the modulati<strong>on</strong>is to split the tides into additi<strong>on</strong>al c<strong>on</strong>stituents butwith periods close to 1 <strong>and</strong> 2 cycles per day. This groupingis termed ‘tidal species’.The tidal potential so far discussed explains <strong>on</strong>ly the diurnal<strong>and</strong> semi-diurnal species of the tide, but can be extendedto include ter-diurnal (third of a day period) tides <strong>and</strong> tidesof even shorter period. A power spectrum of a tidal recordclearly shows that higher-order species do exist, exceptsometimes when <strong>measurement</strong>s are made at an oceaniclocati<strong>on</strong>. These ‘compound tides’ are primarily generatedby the main tidal comp<strong>on</strong>ents in shallow water as theyencounter fricti<strong>on</strong>al forces. They have periods of 2, 4 <strong>and</strong> 6cycles per day (<strong>and</strong> even 12 cpd in very shallow areas), witheach species dem<strong>on</strong>strating separate tidal characteristics.The tidal regime varies enormously in different partsof the world. In most regi<strong>on</strong>s the tide is dominated bysemi-diurnal comp<strong>on</strong>ents, reflecting the importance ofthe main semi-diurnal terms in the Equilibrium Tide.However, there are many areas where the tides are predominantlydiurnal (e.g. Persian Gulf), <strong>and</strong> some wherethe regime is ‘mixed’ (i.e. the diurnal <strong>and</strong> semi-diurnalcomp<strong>on</strong>ents have a comparable magnitude). Examplesof these various regimes are shown in Figure 2.2.4IOC <str<strong>on</strong>g>Manual</str<strong>on</strong>g>s <strong>and</strong> Guides No 14 vol IV
Sea Level Measurement <strong>and</strong> Interpretati<strong>on</strong>Figure 2.2 Tidal characteristics at five stati<strong>on</strong>s, showing different regimes: diurnal, mixed, semi-diurnal with str<strong>on</strong>gspring-neap modulati<strong>on</strong> in the Indian Ocean, semi-diurnal with smaller amplitudes at a N.Atlantic site, <strong>and</strong> shallowwater distorti<strong>on</strong>s.While the temporal characteristics of the tide in the realocean are similar to those of tidal potential (EquilibriumTide), their spatial characteristics are very different. Thisdifference is caused by the dynamical resp<strong>on</strong>se of theocean basins, causing the tides to propagate as progressivewaves <strong>and</strong> to generate st<strong>and</strong>ing waves in some areas.Tides in the deep ocean have amplitudes of typically1 m or less, c<strong>on</strong>siderably lower than the amplitudes <strong>on</strong>c<strong>on</strong>tinental shelves where local res<strong>on</strong>ances can producelarge amplitudes. In all oceans (deep oceans as well as theenclosed <strong>sea</strong> areas of c<strong>on</strong>tinental shelves) there are regi<strong>on</strong>sof no tide, called amphidromic points, which are a c<strong>on</strong>sequenceof the st<strong>and</strong>ing waves.Tide gauges, such as those described in this manual,remain the primary source of tidal knowledge in coastalregi<strong>on</strong>s, although new techniques are under c<strong>on</strong>tinuousdevelopment (secti<strong>on</strong> 8). The tides of the deep oceancan also now be well measured, with the use of bottompressure recorders (Cartwright et al., 1980; Filloux, 1980;Spencer <strong>and</strong> Vassie, 1997), <strong>and</strong> more recently by means ofaltimeter satellites (Shum et al., 1997).2.4.1 Tidal AnalysisThe model that has been derived for the Equilibrium Tide isnot completely without use, as it does provide the knowledgethat the tide is composed of a finite number of c<strong>on</strong>stituentsof calculable frequency. It also provides a measureof their relative amplitudes so that we have an idea whichc<strong>on</strong>stituents are important in the real tide.The analysis c<strong>on</strong>sists in reducing a set of <strong>measurement</strong>s,which amounts to 8,760 hourly values in anormal year, to a manageable set of parameters whichcompletely specify the tidal comp<strong>on</strong>ent of the record.The tides can then be removed to reveal the remainingIOC <str<strong>on</strong>g>Manual</str<strong>on</strong>g>s <strong>and</strong> Guides No 14 vol IV5
Sea Level Measurement <strong>and</strong> Interpretati<strong>on</strong>comp<strong>on</strong>ents of the <strong>sea</strong> <strong>level</strong> variati<strong>on</strong>s (e.g. storm surges,tsunami) <strong>and</strong> the l<strong>on</strong>g-term trend.Many organizati<strong>on</strong>s have developed their own methodof tidal analysis. Apart from the Resp<strong>on</strong>se Method (Munk<strong>and</strong> Cartwright, 1966), these methods generally fit, insome optimal way, a set of harm<strong>on</strong>ic c<strong>on</strong>stituents tothe data. This can be d<strong>on</strong>e in several different ways. TheAdmiralty Semi-Graphic Method <strong>and</strong> those of Doods<strong>on</strong>(1928) were designed for h<strong>and</strong> calculati<strong>on</strong>s. Most moderntechniques (Murray, 1963; Foreman, 1997) rely <strong>on</strong> theability of the computer to solve large sets of simultaneousequati<strong>on</strong>s. Many have been c<strong>on</strong>verted to ‘user friendly’packages <strong>and</strong> are available from the following website:http://www.pol.ac.uk/psmsl/training/analysis.html.2.5 Storm SurgesThe exchange of energy between the atmosphere <strong>and</strong> theocean is <strong>on</strong>e of the most important topics in geophysics.Storm surges are am<strong>on</strong>g the more spectacular examplesof energy transfer in which the energy c<strong>on</strong>tained in winds<strong>and</strong> time-dependent changes in air pressure are absorbedby the <strong>sea</strong> to produce str<strong>on</strong>g currents <strong>and</strong> high <strong>sea</strong> <strong>level</strong>s.In the open <strong>sea</strong> these currents decay by the acti<strong>on</strong> of dissipativeforces. Where the current is impeded by the presenceof a c<strong>on</strong>tinental shelf or other disc<strong>on</strong>tinuity in depth,or by a coastline, more of the kinetic energy of the <strong>sea</strong>tends to be c<strong>on</strong>verted into potential energy. Abnormalelevati<strong>on</strong>s of <strong>sea</strong> <strong>level</strong> may then occur, with disastrousresults if the coast is low-lying.Physically, the atmosphere acts <strong>on</strong> the <strong>sea</strong> in two distinctlydifferent ways. The first is the ‘Inverse Barometer (IB)Effect’ wherein a 1-hPa (mbar) increase of atmosphericpressure decreases <strong>sea</strong> <strong>level</strong> by 1 centimetre. (Dynamicaleffects can complicate this simple IB descripti<strong>on</strong> at shorttime-scales.) The sec<strong>on</strong>d is due to the drag (or ‘stress’)of the wind <strong>on</strong> the <strong>sea</strong> surface, which is proporti<strong>on</strong>al (toa first approximati<strong>on</strong>) to the square of the wind speed.This force sets up <strong>sea</strong> <strong>level</strong> gradients which are proporti<strong>on</strong>alto wind stress divided by water depth, <strong>and</strong> whichresult in the storm surges in shallow water regi<strong>on</strong>s. Thedynamics of surges in shallow water result in flow beingin the directi<strong>on</strong> of the wind, differing from a deeperwater situati<strong>on</strong> in which the transport is at right anglesto the wind (to the right in the northern hemisphere).Recordings of <strong>sea</strong> <strong>level</strong> at any coastal stati<strong>on</strong> c<strong>on</strong>tainsome evidence of the influence of winds <strong>and</strong> pressure,but some areas are particularly susceptible to largesurges. The Baltic, being virtually an enclosed <strong>sea</strong> <strong>and</strong>subject <strong>on</strong> occasi<strong>on</strong> to severe gales, experiences largesurges. In 1924 St. Petersburg (Leningrad) was floodedby a surge 4 m high. The North Sea, with its southernextremity almost closed, resp<strong>on</strong>ds readily to northerlywinds; the vulnerable coastlines of the German Bight,eastern Engl<strong>and</strong> <strong>and</strong> more particularly the Low Countrieshave repeatedly been inundated by great surges. Thestorm surge of 1953 resulted in many deaths in TheNetherl<strong>and</strong>s <strong>and</strong> Engl<strong>and</strong>. The Hamburg disaster of1962 was more localized, mainly affecting the GermanBight <strong>and</strong> the River Elbe, where the surge reached morethan 3 m in height.Hurricanes travelling towards the Atlantic <strong>sea</strong>board ofthe United States are no less effective in generatingdestructive surges. The Japanese isl<strong>and</strong>s are also subjectto typho<strong>on</strong> surges. Events <strong>on</strong> this scale dem<strong>and</strong> as completean underst<strong>and</strong>ing of the phenomena as possibleso that they may be forecast (using forecast meteorologicalinformati<strong>on</strong>) <strong>and</strong> their c<strong>on</strong>sequences mitigated.After the immediate danger of flooding, the subsequentdislocati<strong>on</strong> of normal services, such as water supplies<strong>and</strong> sewerage, gives rise to serious dangers. Also, <strong>on</strong>ceflooded by <strong>sea</strong> water, previously fertile l<strong>and</strong>s are unsuitablefor growing crops for several years because ofthe saline deposit which remains after the floods havereceded.For scientific analysis <strong>and</strong> for systems designed for surgepredicti<strong>on</strong>, it is usual to distinguish between tropical <strong>and</strong>extra-tropical surges.Tropical surges are generated by tropical storms that aresmall <strong>and</strong> very intense. These storms are generated at<strong>sea</strong>, from where they move in an irregular way until theymeet the coast. Here they produce excepti<strong>on</strong>ally largeflood <strong>level</strong>s over a regi<strong>on</strong> of perhaps 10–50 km of coastline.Tropical storms are difficult to m<strong>on</strong>itor offshore <strong>and</strong>their effects <strong>on</strong> a particular stretch of coastline cannot beestimated from the statistics of observed floods becausesuch storms are relatively rare events in any particularregi<strong>on</strong>. A combinati<strong>on</strong> of numerical <strong>and</strong> statistical modelsmay be used to estimate the maximum flood <strong>level</strong>s,but their exact locati<strong>on</strong> depends <strong>on</strong> the track of eachindividual storm.Extra-tropical surges are generated by storms whichextend over several hundred kilometres <strong>and</strong> which aregenerally slow moving. They affect large areas of coastover periods that may extend to several days. At theircentre is a regi<strong>on</strong> of low atmospheric pressure. They aremore amenable to study by hydrodynamic modellingtaking into account the distributi<strong>on</strong> of atmospheric pressure<strong>and</strong> wind fields, <strong>sea</strong> bed bathymetry, the coastaltopography <strong>and</strong> the effects of the Earth’s rotati<strong>on</strong>.A tide gauge network by which the storm surge canbe m<strong>on</strong>itored is of key importance in providing data toenhance the performance of operati<strong>on</strong>al hydrodynamictide–surge models used in flood warning. Data canbe used in the verificati<strong>on</strong> of the models <strong>and</strong> for dataassimilati<strong>on</strong> into them (Flather, 2000; Alvarez Fanjul,2001). Such a network clearly has to be capable ofremote telemetry <strong>on</strong> a near-real-time basis.6IOC <str<strong>on</strong>g>Manual</str<strong>on</strong>g>s <strong>and</strong> Guides No 14 vol IV
Sea Level Measurement <strong>and</strong> Interpretati<strong>on</strong>2.6 TsunamisA tsunami is a wave train generated by a vertical displacementof the water column. Earthquakes, l<strong>and</strong>slides,volcanic erupti<strong>on</strong>s, explosi<strong>on</strong>s, <strong>and</strong> even the impactof cosmic bodies, such as meteorites, can generatetsunamis. Where they impact a coastline, theycan cause severe property damage <strong>and</strong> loss of life.Tsunamis may have wavelengths in excess of 100 km<strong>and</strong> periods of minutes to over an hour, depending<strong>on</strong> the generati<strong>on</strong> mechanism. As a result of its l<strong>on</strong>gwavelength compared to the water depth, a tsunamibehaves like a shallow-water wave <strong>and</strong> propagates ata speed that is equal to the square root of the productof the accelerati<strong>on</strong> of gravity (9.8 m.s -2 ) <strong>and</strong> the waterdepth. In a typical ocean depth of 4,000 m, a tsunamitravels at about 200 m.s -1 , or over 700 km.hr -1 . Becausethe rate at which a wave loses its energy is inverselyrelated to its wavelength, tsunamis not <strong>on</strong>ly propagateat high speeds, they can also travel great distanceswithout loss of energy (Figure 2.3). Tsunamis are <strong>on</strong>lyabout a metre high, at the most, in the open ocean.However, where they impact the coast, amplitudes aresignificantly higher <strong>and</strong> can be as large as 10 m (30m in extreme cases). Wave refracti<strong>on</strong>, caused by segmentsof the wave moving at different speeds as thewater depth varies, can cause extreme amplificati<strong>on</strong> inlocalized areas.Figure 2.3 The 26 December 2004 Sumatra tsunamisignal at a distant tide gauge (Port Louis, Mauritius) withan amplitude over 1 m.The ability to warn of the approach of a tsunami depends<strong>on</strong> a variety of <strong>measurement</strong>s (especially seismic data), butalso <strong>on</strong> a network of tide gauges to m<strong>on</strong>itor the progressof the wave <strong>and</strong> thereby forecast the time of arrival at adistant coast <strong>and</strong> the likely affected areas. Because thepropagati<strong>on</strong> speed of the waves is large, it is essential tohave real-time data transmissi<strong>on</strong> without any significanttime delay. Decisi<strong>on</strong>-making <strong>and</strong> mitigati<strong>on</strong> procedureshave to be c<strong>on</strong>sidered before warnings are issued to therelevant authorities.2.7 Mean Sea Level <strong>and</strong> TrendsThe determinati<strong>on</strong> of mean <strong>sea</strong> <strong>level</strong> (MSL) <strong>and</strong> its l<strong>on</strong>gtermtrend is probably the most exacting comp<strong>on</strong>ent of atide gauge data set. Whereas the accuracy of an instrumentin determining the properties of the tides or a stormsurge need <strong>on</strong>ly be about 1 cm, the l<strong>on</strong>g-term trend in <strong>sea</strong><strong>level</strong> has a magnitude of around 1 mm per year. Henceprecise <strong>measurement</strong> not <strong>on</strong>ly relies <strong>on</strong> the accuracy of theinstrument but also <strong>on</strong> its l<strong>on</strong>g-term stability. This in turnimplies an ability to maintain the datum of a tide gaugewithin a local <strong>level</strong>ling network. The <strong>level</strong>ling between,<strong>and</strong> geocentric fixing of, tide gauge benchmarks, is dealtwith in secti<strong>on</strong> 4.The data from the existing global network of tide gaugesclearly shows a rise in <strong>sea</strong> <strong>level</strong> over the last century. Theirdata are fundamental in studies of climate change, <strong>and</strong>especially as an aid in the development of atmosphere–ocean general circulati<strong>on</strong> models that have a capability topredict future <strong>sea</strong> <strong>level</strong> change. The mean value is extractedfrom the observed data by the applicati<strong>on</strong> of numericalfilters discussed in Volume 1 of the IOC <str<strong>on</strong>g>Manual</str<strong>on</strong>g> <strong>on</strong>Sea Level Measurement <strong>and</strong> Interpretati<strong>on</strong>. M<strong>on</strong>thly <strong>and</strong>annual mean <strong>sea</strong> <strong>level</strong> series are collected <strong>and</strong> publishedby the Permanent Service for Mean Sea Level (PSMSL),together with details of gauge locati<strong>on</strong>, <strong>and</strong> definiti<strong>on</strong>sof the datums to which the <strong>measurement</strong>s are referred.Data are held for over 2,000 stati<strong>on</strong>s, of which 112 havedata from before 1900. The l<strong>on</strong>gest record held is fromBrest, France, which begins in 1806. The physical locati<strong>on</strong>of gauges <strong>on</strong> the network is not ideal: the vast majority ofgauges operate in the northern hemisphere <strong>and</strong> carefulanalysis is necessary to avoid bias in the interpretati<strong>on</strong> oftheir data. There is a c<strong>on</strong>tinuing need for more data fromthe southern hemisphere, <strong>and</strong> from oceanic isl<strong>and</strong>s.The change in mean <strong>sea</strong> <strong>level</strong> relative to a fixed point <strong>on</strong>l<strong>and</strong> is a measure of the difference between the verticalmovements of the <strong>sea</strong>’s surface <strong>and</strong> of the l<strong>and</strong> itself. L<strong>on</strong>gtermchanges of measured <strong>sea</strong> <strong>level</strong> are termed ‘secular’changes. Global changes in the mean <strong>sea</strong> <strong>level</strong> are called‘eustatic’ changes. Vertical l<strong>and</strong> movements of regi<strong>on</strong>alextent are called eperiogenic movements. Examples ofsuch l<strong>on</strong>g-term changes can be obtained from the PSMSLwebsite. Study of the records will show that there aremany similarities between stati<strong>on</strong>s which can be c<strong>on</strong>sidered‘nearby’ relative to ocean <strong>and</strong> geological space-scales. Theclose agreement between stati<strong>on</strong>s using different kindsof instruments shows that the oceanographic variability ismuch greater than the errors in the <strong>measurement</strong>s.2.8 Estimati<strong>on</strong> of Extreme Sea Levels2.8.1 Introducti<strong>on</strong>The aim of this secti<strong>on</strong> is to summarize the key methodswhich can be used for the estimati<strong>on</strong> of extremeIOC <str<strong>on</strong>g>Manual</str<strong>on</strong>g>s <strong>and</strong> Guides No 14 vol IV7
Sea Level Measurement <strong>and</strong> Interpretati<strong>on</strong><strong>sea</strong> <strong>level</strong>s. It begins with the classical method of AnnualExtremes, which first appeared in the early 1960s <strong>and</strong>c<strong>on</strong>tinued to be developed for some time thereafter.Following this, the Joint Probability Method, which wasdeveloped in the late 1970s, is c<strong>on</strong>sidered. This makesmore efficient use of data by incorporating our extensiveknowledge of the tides <strong>and</strong> storm surges, whichare the two main comp<strong>on</strong>ents of <strong>sea</strong> <strong>level</strong>, as a part ofthe estimati<strong>on</strong> procedure.More recent work <strong>on</strong> the Annual Exceedance Method isdiscussed, followed by a revisi<strong>on</strong> of the Joint ProbabilityMethod to correct its deficiencies in areas where the <strong>sea</strong><strong>level</strong> is dominated by the meteorological surge comp<strong>on</strong>ent.Finally, very recent work <strong>on</strong> the spatial estimati<strong>on</strong>of extremes is menti<strong>on</strong>ed. References are given at eachstage so that the reader can examine any of the methodsin greater depth. Although extreme high <strong>sea</strong> <strong>level</strong>sare c<strong>on</strong>sidered, results for extreme low <strong>sea</strong> <strong>level</strong>s can beobtained in an analogous way.2.8.2 The Annual Maximum Method (AMM)This is the classical general method of analysis ofextremes having been applied to <strong>sea</strong> <strong>level</strong> estimati<strong>on</strong>since 1963 (Lenn<strong>on</strong>, 1963; Suth<strong>on</strong>s, 1963). It is based<strong>on</strong> a result from probabilistic extreme value theorywhich states: if X 1 ,... X n is a sequence of independent<strong>and</strong> identically distributed r<strong>and</strong>om variables, thenmax(X 1 ,... X n ), suitably linearly normalized, c<strong>on</strong>vergesas n ∞ , to a r<strong>and</strong>om variable with a distributi<strong>on</strong>functi<strong>on</strong> which is <strong>on</strong>e of the so called extremevaluedistributi<strong>on</strong>s. The general case is known as theGeneralized Extreme Value (GEV) distributi<strong>on</strong>. Animportant special case is the Gumbel distributi<strong>on</strong>.The Annual Maximum Method takes the GEV to bethe distributi<strong>on</strong> functi<strong>on</strong> of the maximum <strong>sea</strong> <strong>level</strong> ina year. Therefore, for a place of interest, the annualmaximum for each year is extracted from hourly observati<strong>on</strong>s<strong>and</strong> is used as data to estimate the parametersof the distributi<strong>on</strong> that they follow. From the estimateddistributi<strong>on</strong> <strong>on</strong>e can obtain the <strong>sea</strong> <strong>level</strong> corresp<strong>on</strong>dingto a chosen ‘Return Period’. In practice, return periodsof 50, 100 <strong>and</strong> 1,000 years are comm<strong>on</strong>. The basicmethod assumes that there is no trend in the data, butit can be extended to deal with those cases where atrend is present.A recent extensi<strong>on</strong> of the annual maximum methodinvolves using probabilistic extreme value theory toobtain the asymptotic joint distributi<strong>on</strong> of a fixed number(r) of the largest independent extreme values, forexample the five largest in each year. Essentially theapproach is the same as above except that more relevantdata are included in the analysis thereby improvingthe estimati<strong>on</strong>. Care must be taken to ensure that thenumber of annual maxima ‘r’ is not excessive, such thatthe lower extremes fall outside the tail of the extremevalue distributi<strong>on</strong>.This method of estimating <strong>sea</strong> <strong>level</strong> extremes is highlyinefficient in its use of data, since it extracts very fewvalues from each yearly record. This is particularly importantwhen the <strong>sea</strong> <strong>level</strong> record is short, since it yieldsreturn <strong>level</strong> estimates with unacceptably large st<strong>and</strong>arderrors. In additi<strong>on</strong>, it makes no use of our knowledge ofthe <strong>sea</strong> <strong>level</strong> <strong>and</strong> storm surge processes. However, theadvantage of annual maxima methods is that they d<strong>on</strong>ot require knowledge of tide–surge interacti<strong>on</strong> whichcan sometimes be a significant feature of the data.C<strong>on</strong>sequently the methods are relatively straightforwardto apply.2.8.3 The Joint Probabilities Method (JPM)This method of analysis was introduced to exploit ourknowledge of the tide in short data sets to which theannual maxima method could not be applied (Pugh<strong>and</strong> Vassie, 1979). At any time, the observed <strong>sea</strong> <strong>level</strong>,after averaging out surface waves, has three comp<strong>on</strong>ents:mean <strong>sea</strong> <strong>level</strong>, tidal <strong>level</strong> <strong>and</strong> meteorologicallyinduced <strong>sea</strong> <strong>level</strong>. The latter is usually referred to as astorm surge. Using st<strong>and</strong>ard methods, the first two ofthese comp<strong>on</strong>ents can be removed from the <strong>sea</strong> <strong>level</strong>sequence leaving the surge sequence, which is just thetime-series of n<strong>on</strong>-tidal residuals. For simplicity these areassumed to be stati<strong>on</strong>ary. Because the tidal sequenceis deterministic, the probability distributi<strong>on</strong> for all tidal<strong>level</strong>s can be generated from tidal predicti<strong>on</strong>s. Thisdistributi<strong>on</strong> can be accurately approximated using 18.6years of predicti<strong>on</strong>s.The probability distributi<strong>on</strong> of hourly <strong>sea</strong> <strong>level</strong>s can beobtained either directly using an empirical estimate orby combining the tidal <strong>and</strong> surge probability densityfuncti<strong>on</strong>s (pdf). The latter is preferable, as it smoothes<strong>and</strong> extrapolates the former. However the nature ofthe combinati<strong>on</strong> of the pdf’s depends <strong>on</strong> whetherthere is dependence between the tide <strong>and</strong> surgesequences. Initially, c<strong>on</strong>sider the case in which theyare independent.By combining the pdf’s of tide <strong>and</strong> surge, the distributi<strong>on</strong>functi<strong>on</strong> of hourly (instantaneous) <strong>sea</strong> <strong>level</strong>s is obtained.From this, the distributi<strong>on</strong> functi<strong>on</strong> of the annual maximais required. If hourly values were independent, whichis approximately the case where the tide dominates theregime, then this is straightforward.The method has been widely applied. It makes betteruse of the data <strong>and</strong> of our extensive knowledge of thetides, <strong>and</strong> accounts for surges that could have occurred<strong>on</strong> high tide but by chance did not. Most successfulapplicati<strong>on</strong>s have been to sites which have several yearsof hourly records (>10 years) <strong>and</strong> where the site is tidallydominant, i.e. where the tidal range is large in comparis<strong>on</strong>to the surge amplitude. Least successful applicati<strong>on</strong>shave been to sites with both short lengths of data <strong>and</strong>where the site is surge dominant.8IOC <str<strong>on</strong>g>Manual</str<strong>on</strong>g>s <strong>and</strong> Guides No 14 vol IV
Sea Level Measurement <strong>and</strong> Interpretati<strong>on</strong>2.8.4 The Revised Joint Probabilities Method(RJPM)Particular emphasis was given to two principalimprovements that make the revised method morewidely applicable than the original joint probabilitiesmethod (Tawn et al., 1989). It was principally directedat sites where the storm surge was resp<strong>on</strong>siblefor a respectable proporti<strong>on</strong> of the <strong>sea</strong> <strong>level</strong> <strong>and</strong> toimprove the estimati<strong>on</strong> procedure for sites whereless than 10 years of data were available.The first issue was that of c<strong>on</strong>verting the hourly distributi<strong>on</strong>into annual return periods. It is clear thateach hourly value of <strong>sea</strong> <strong>level</strong> is not independent ofits predecessor or successor. Of the 8,760 hourly valuesin a year, it is necessary to determine the effectivenumber of independent observati<strong>on</strong>s per year. Thiswas d<strong>on</strong>e through an Extremal Index which is derivedfrom the mean overtopping time of a <strong>level</strong> for eachindependent storm which exceeds that <strong>level</strong>. In factthe Extremal Index can be shown to be a c<strong>on</strong>stantin the regi<strong>on</strong> of the extremes. Because large valuestend to cluster as storms, it should be expected thatthe Extremal Index >1; for example, in the NorthSea, it is 1.4. This effectively reduces the number ofindependent observati<strong>on</strong>s from 8,760 to 8,760/1.4.If the site is tidally dominant then the Extremal Indexis c<strong>on</strong>siderably smaller than if the site is surge dominant.The immediate advantages of this modificati<strong>on</strong>are: firstly, that no assumpti<strong>on</strong> about the localdependence of the process is required; sec<strong>on</strong>dly, thatthe c<strong>on</strong>versi<strong>on</strong> from the hourly distributi<strong>on</strong> to annualmaxima is invariant to sampling frequency.The sec<strong>on</strong>d modificati<strong>on</strong> enabled probabilities for<strong>level</strong>s bey<strong>on</strong>d the existing range of the surge datato be obtained, in additi<strong>on</strong> to providing smoothingfor the tail of the empirical distributi<strong>on</strong>. The methodis based <strong>on</strong> the idea of using a fixed number ofindependent extreme surge values from each year toestimate probabilities of extreme surges. The procedureinvolves two important steps. Firstly, the identificati<strong>on</strong>of independent extreme surges. Sec<strong>on</strong>dly,the selecti<strong>on</strong> of a suitable number of independentextreme surges from each year of data, perhaps fiveper year. Using these surge data, estimates can bemade of the parameters of the distributi<strong>on</strong> of theannual maximum surge (Smith, 1986).When interacti<strong>on</strong> is present, the <strong>level</strong> of the tideaffects the distributi<strong>on</strong> of the surge. In particular, thetail of the surge pdf depends <strong>on</strong> the corresp<strong>on</strong>dingtidal <strong>level</strong>. Thus the c<strong>on</strong>voluti<strong>on</strong> of tide <strong>and</strong> surgecan be adapted so that the surge parameters arefuncti<strong>on</strong>s of tidal <strong>level</strong>. This formulati<strong>on</strong> also enablesstatistical tests of independence to be performed.2.8.5 The Exceedance Probability Method(EPM)An alternative method of obtaining extreme <strong>sea</strong><strong>level</strong> estimates from short data sets is called theexceedance probability method (EPM) (Middlet<strong>on</strong>et al., 1986; Ham<strong>on</strong> et al., 1989). The EPM, like theRJPM, involves combining the tide <strong>and</strong> surge distributi<strong>on</strong>s<strong>and</strong> accounting for dependence in the <strong>sea</strong><strong>level</strong> sequence. The approach differs in the way thatit h<strong>and</strong>les extreme surges. The EPM uses results forc<strong>on</strong>tinuous time processes <strong>and</strong> makes assumpti<strong>on</strong>sabout the joint distributi<strong>on</strong> of the surge <strong>and</strong> its derivative.Improvement is achieved by allowing flexibilityin the surge tail through the use of a c<strong>on</strong>taminatednormal distributi<strong>on</strong>.2.8.6 Spatial Estimati<strong>on</strong> of ExtremesExtreme <strong>sea</strong> <strong>level</strong>s al<strong>on</strong>g a coastline are typically generatedby the same physical mechanisms, so the parametersthat describe the distributi<strong>on</strong> are likely to bespatially coherent. Models that describe the separatec<strong>on</strong>stituents of the <strong>sea</strong> <strong>level</strong> are best suited to exploitingthis spatial coherence, as the individual parametersshould change smoothly al<strong>on</strong>g a coastline.The joint distributi<strong>on</strong> of annual maxima over severaldata sites can be modelled using a multivariateextreme-value distributi<strong>on</strong> (Tawn, 1992). Changes ineach of the parameters of the distributi<strong>on</strong>, over sites,can be modelled to be c<strong>on</strong>sistent with the propertiesof the underlying generating process identified fromthe RJPM. The main advantage of the spatial methodis that it can utilize data sites with extensive <strong>sea</strong> <strong>level</strong>records <strong>and</strong> augment these with data from sites withshorter records of a few years.Using the ideas for extremes of dependent sequences,this can be related to the distributi<strong>on</strong> functi<strong>on</strong>of hourly surge <strong>level</strong>s, <strong>and</strong> then the empirical surgedensity functi<strong>on</strong> can be replaced by the adjusteddensity. Using the adjusted density functi<strong>on</strong>, thec<strong>on</strong>voluti<strong>on</strong> can be performed to combine the tidal<strong>and</strong> surge distributi<strong>on</strong>s to obtain the hourly <strong>sea</strong> <strong>level</strong>distributi<strong>on</strong> <strong>and</strong> hence the return periods can becalculated for different <strong>level</strong>s.IOC <str<strong>on</strong>g>Manual</str<strong>on</strong>g>s <strong>and</strong> Guides No 14 vol IV9
Sea Level Measurement <strong>and</strong> Interpretati<strong>on</strong>3. Instruments for theMeasurement of Sea Level3.1 Introducti<strong>on</strong>This secti<strong>on</strong> c<strong>on</strong>tains informati<strong>on</strong> <strong>on</strong> the types of instrumentthat are presently available for the <strong>measurement</strong> of<strong>sea</strong> <strong>level</strong>. The reas<strong>on</strong> that so many different technologieshave evolved is c<strong>on</strong>nected with the difficulty of measuringa fluid that is in c<strong>on</strong>stant moti<strong>on</strong> due to the processesdiscussed in secti<strong>on</strong> 2. In general, <strong>sea</strong> <strong>level</strong> <strong>measurement</strong>sare not c<strong>on</strong>cerned with the <strong>measurement</strong> ofsurface gravity waves which must be filtered out of thesystem. Waves can be appreciable in amplitude <strong>and</strong> cancause problems for most forms of tide gauge technology.Therefore, their potential effects <strong>on</strong> a ‘<strong>sea</strong> <strong>level</strong>’<strong>measurement</strong> must always be kept in mind. Anotherfactor that needs to be c<strong>on</strong>sidered is that the propertiesof <strong>sea</strong> water (salinity, temperature <strong>and</strong> hence density)may change <strong>on</strong> a regular or irregular basis. How thisaffects an instrument depends much <strong>on</strong> the technologyused to acquire the observati<strong>on</strong>s. These are discussedal<strong>on</strong>g with the merits of each tide gauge.There are fundamentally four types of measuring technologyin comm<strong>on</strong> use:• A stilling well <strong>and</strong> float: in which the filtering of thewaves is d<strong>on</strong>e through the mechanical design ofthe well.• Pressure systems: in which sub-surface pressureis m<strong>on</strong>itored <strong>and</strong> c<strong>on</strong>verted to height based <strong>on</strong>knowledge of the water density <strong>and</strong> local accelerati<strong>on</strong>due to gravity. Such systems have additi<strong>on</strong>alspecific applicati<strong>on</strong> to ocean circulati<strong>on</strong> studies inwhich pressure differences are more relevant thanheight differences.• Acoustic systems: in which the transit time of as<strong>on</strong>ic pulse is used to compute distance to the <strong>sea</strong>surface.• Radar systems: similar to acoustic transmissi<strong>on</strong>, butusing radar frequencies.Within each of these four types, different technologieshave been employed, leading to different designs.In additi<strong>on</strong>, there are direct measuring devices based<strong>on</strong> resistance or capacitance rods, but these have foundless widespread use because of their lack of robustnessin hostile regi<strong>on</strong>s. Recent advances in technologies,such as Global Positi<strong>on</strong>ing System (GPS) reflecti<strong>on</strong>methods, have lead to other elaborate ways of measuring<strong>sea</strong> <strong>level</strong> which might be important in the future.At the present time, many of the above systems areundergoing tests <strong>and</strong> inter-comparis<strong>on</strong>s by agenciesworldwide (IOC, 2004). It would appear that mostsystems for measuring <strong>sea</strong> <strong>level</strong> have a precisi<strong>on</strong>approaching 1 cm, given sufficient care <strong>and</strong> attenti<strong>on</strong>.This value is adequate for the <strong>measurement</strong> of mostof the hydrodynamic processes discussed in secti<strong>on</strong> 2.However, this precisi<strong>on</strong> does not necessarily imply anaccuracy for adequate <strong>measurement</strong> of the mean <strong>level</strong>.The determinati<strong>on</strong> of the mean <strong>level</strong> depends as much<strong>on</strong> the l<strong>on</strong>g-term stability of the measuring system.There are practical c<strong>on</strong>straints that govern the choiceof an instrument for a particular applicati<strong>on</strong>. Theseinclude cost, degree of difficulty of installati<strong>on</strong>, easeof maintenance <strong>and</strong> repair, support facilities etc. Forexample, the installati<strong>on</strong> of a highly complex electr<strong>on</strong>icinstrument with sophisticated software c<strong>on</strong>trol wouldbe unwise without technical support staff who possess10IOC <str<strong>on</strong>g>Manual</str<strong>on</strong>g>s <strong>and</strong> Guides No 14 vol IV
Sea Level Measurement <strong>and</strong> Interpretati<strong>on</strong>the ability to maintain its operati<strong>on</strong>. Another importantc<strong>on</strong>siderati<strong>on</strong> in the choice of an instrument is the siteat which it is to be located. This is discussed in the nextsecti<strong>on</strong>.Traditi<strong>on</strong>ally, permanent <strong>sea</strong> <strong>level</strong> stati<strong>on</strong>s around theworld have been mainly devoted to tide <strong>and</strong> mean <strong>sea</strong><strong>level</strong> applicati<strong>on</strong>s, <strong>and</strong> this has been the main objectiveof GLOSS. This implies that not <strong>on</strong>ly wind wavesare filtered out from the records by mechanical ormathematical procedures, but any oscillati<strong>on</strong> betweenwind waves <strong>and</strong> tides (e.g. seiches, tsunamis etc.) hasnot been c<strong>on</strong>sidered a priority, <strong>and</strong> in fact not properlym<strong>on</strong>itored, owing to the st<strong>and</strong>ard sampling time ofmore than 5–6 minutes. If this range of the spectrumshould be covered from now <strong>on</strong>, it would be necessaryto c<strong>on</strong>sider this when choosing a new instrument <strong>and</strong>designing the <strong>sea</strong> <strong>level</strong> stati<strong>on</strong>s.3.1.1 The Choice of a Tide Gauge SiteIn many cases, the site for a tide gauge may be specified(e.g. it has to be located in a port area). However,in many instances, the choice of site will not be clear<strong>and</strong> can <strong>on</strong>ly be made by judging which of the c<strong>on</strong>straintslisted below are more significant <strong>and</strong> whichshould be given greater emphasis. This emphasis maydepend <strong>on</strong>, for example, whether the gauge is intendedfor oceanographic re<strong>sea</strong>rch, in which case <strong>on</strong>e clearlyrequires it to be located with maximum exposure to theopen ocean, <strong>and</strong> not situated in a river. Most GLOSSCore Network sites have been selected with this aspectin mind. For local programmes, where the processto be studied may be coastal erosi<strong>on</strong> or storm surgeactivity, then clearly the gauge will have to be situatedoptimally for that purpose. In most cases, some of thefollowing c<strong>on</strong>straints are still valid:• The installati<strong>on</strong> must be capable of withst<strong>and</strong>ingthe worst envir<strong>on</strong>mental c<strong>on</strong>diti<strong>on</strong>s (winter ice,storms etc.) likely to be encountered. This is clearlyan issue relevant to the type of instrument <strong>and</strong> toits intended positi<strong>on</strong>. Positi<strong>on</strong>s exposed to envir<strong>on</strong>mentalextremes should clearly be avoided toenable the eventual accumulati<strong>on</strong> of a l<strong>on</strong>g timeseriesof data.• The ground <strong>on</strong> which the installati<strong>on</strong> is to be erectedshould be ‘stable’ as far as possible, not beingliable to subsidence because of underground workingsor l<strong>and</strong> subsidence (e.g. due to the area beingreclaimed l<strong>and</strong>). It must also not be liable to slippagein the event of heavy prol<strong>on</strong>ged rain (i.e. thearea must be adequately drained) or being erodedby river or <strong>sea</strong> acti<strong>on</strong>. An installati<strong>on</strong> <strong>on</strong> solid rockis the ideal.• River estuaries should, if possible, be avoided.Estuarine river water can mix with <strong>sea</strong> water tovarying extents during a tidal cycle <strong>and</strong> at differenttimes of the year, resulting in fluctuati<strong>on</strong>s inwater density. This may have important impacts<strong>on</strong> float gauge <strong>measurement</strong>s in stilling wellsbecause of ‘layering’ of water drawn into the wellat different times causing a difference in densityinside <strong>and</strong> outside the well. It will also impact <strong>on</strong>pressure <strong>measurement</strong>s, as the density assumedfor the c<strong>on</strong>versi<strong>on</strong> of pressure to <strong>sea</strong> <strong>level</strong> will notbe c<strong>on</strong>stant. Currents associated with river flowcan also cause drawdown in stilling wells <strong>and</strong> inthe stilling tubes of acoustic gauges. Followingheavy rain-storms, debris floating down-rivercould damage a gauge.• Areas where impounding (isolati<strong>on</strong> from the open<strong>sea</strong>) can occur at extreme low-tide <strong>level</strong>s should beavoided. Similarly, s<strong>and</strong>bars slightly below the surfacebetween the site <strong>and</strong> the open <strong>sea</strong> can result inuncharacteristic <strong>level</strong>s being measured. M<strong>on</strong>itoringacross l<strong>on</strong>g shallow sloping beaches should also beavoided for the same reas<strong>on</strong>s.• Sharp headl<strong>and</strong>s <strong>and</strong> sounds should be avoided,since these are places where high tidal currentsoccur which tend to result in unrepresentative tidalc<strong>on</strong>stants <strong>and</strong> in a drop of MSL (Pugh, 1987).• Proximity to outfalls can result in turbulence, currents,diluti<strong>on</strong> <strong>and</strong> deposits, <strong>and</strong> should be avoided.• Places where shipping passes or moors close to theproposed site, since there will be a risk of collisi<strong>on</strong><strong>and</strong> propeller turbulence causing silt movement; astudy should be made of this possible factor.• Places where c<strong>on</strong>structi<strong>on</strong> work in the area at somefuture time may affect the tidal regime at the site(e.g. by c<strong>on</strong>structi<strong>on</strong> of new quays or breakwaters);investigati<strong>on</strong>s should be made to determinewhether there is a possibility of this occurring. Thismight necessitate the relocati<strong>on</strong> of the tide gauge,thus interrupting the <strong>sea</strong> <strong>level</strong> time-series. This issomething very difficult to avoid in some harbours.• A site should have c<strong>on</strong>tinuous mains electricalpower (or adequate storage batteries/solar panelsor generator supply) <strong>and</strong> teleph<strong>on</strong>e or satelliteaccess for transmissi<strong>on</strong> of data to an analysiscentre.• There must be adequate access to the site for installati<strong>on</strong><strong>and</strong> maintenance <strong>and</strong> the site must be securefrom v<strong>and</strong>alism or theft.• The area of the site must be capable of c<strong>on</strong>tainingthe benchmarks required for geodetic c<strong>on</strong>trol ofthe <strong>sea</strong> <strong>level</strong> data. In particular, it must have goodTGBM <strong>and</strong> GPSBM marks, which must also besecure from accidental damage.• If stilling well or acoustic gauges are to beinstalled, then the stilling well or acoustic tubemust be tall enough to record the highest <strong>sea</strong><strong>level</strong>s. This may require permissi<strong>on</strong> from portauthorities if, for example, the installati<strong>on</strong> is <strong>on</strong> abusy quayside.• The water depth must extend at least two metresbeneath Lowest Astr<strong>on</strong>omical Tide (LAT) for thesuccessful operati<strong>on</strong> of a stilling well. The outlet ofthe stilling well should be clear of the <strong>sea</strong> bed <strong>and</strong>IOC <str<strong>on</strong>g>Manual</str<strong>on</strong>g>s <strong>and</strong> Guides No 14 vol IV11
Sea Level Measurement <strong>and</strong> Interpretati<strong>on</strong>be set deep enough to allow the float to operateabout <strong>on</strong>e metre below LAT.Finally, it is clear that tide gauge datum c<strong>on</strong>trol is anessential issue for any installati<strong>on</strong>. C<strong>on</strong>sequently, evenif the stati<strong>on</strong> is equipped with the most modern equipment,it is comm<strong>on</strong> sense to provide c<strong>on</strong>firmati<strong>on</strong> ofthe datum from time to time by means of an inexpensivetide ‘pole’ or ‘staff’ to guard against gross errorsin the datum.3.2 The Stilling WellA stilling well gauge is probably the most comm<strong>on</strong> ofall <strong>sea</strong> <strong>level</strong> recording systems <strong>on</strong> a worldwide basis.These gauges were at <strong>on</strong>e time employed at every portinstallati<strong>on</strong> <strong>and</strong> were the primary technology by which<strong>sea</strong> <strong>level</strong> records were compiled. Recent stilling wellinstallati<strong>on</strong>s are less comm<strong>on</strong>, since they require a c<strong>on</strong>siderableamount of costly engineering work, so thatthey have often been superseded by <strong>on</strong>e of the othertechnologies discussed below. In some circumstances itmay not be possible to install a well, e.g. <strong>on</strong> a shelvingbeach, <strong>and</strong> other methods have to be adopted.The functi<strong>on</strong> of a well is to filter out, ‘to still’, the waveactivity, so that the tides <strong>and</strong> l<strong>on</strong>ger-period processescan be recorded accurately. It is most comm<strong>on</strong>ly associatedwith having a float gauge in the well driving apen <strong>and</strong> chart recorder or, in more recent years, a shaftencoder such that the readings of <strong>sea</strong> <strong>level</strong> height canbe digitized automatically. It is not uncomm<strong>on</strong> for othertypes of instrument, e.g. a pressure sensor, to also beplaced in the well.The well itself is a vertical tube about 1 m in diameterc<strong>on</strong>structed of c<strong>on</strong>crete, coated steel or plastic, with ahole or, less frequently, a pipe c<strong>on</strong>necti<strong>on</strong> to the <strong>sea</strong>.The ratio of the hole diameter or pipe length <strong>and</strong> diameterto that of the well gives it the characteristics of alow pass filter (Noye,1974a, b, c). In other words, it actsas a mechanical filter. Care has to be exercised in tryingto measure processes such as tsunami waves, as thefrequency resp<strong>on</strong>se is not 100% for periods ≤4 hours.The stilling well suffers from amplitude attenuati<strong>on</strong><strong>and</strong> a phase lag at shorter periods which are criticallydependent <strong>on</strong> the design of the well <strong>and</strong> sometimesdifficult to change.The characteristics, installati<strong>on</strong> <strong>and</strong> use of a stilling wellwere covered in substantial detail in Volume 1 of the<str<strong>on</strong>g>Manual</str<strong>on</strong>g> of Sea-Level Measurement <strong>and</strong> Interpretati<strong>on</strong>(IOC, 1985). The reader is advised to refer to that publicati<strong>on</strong>,<strong>and</strong> for additi<strong>on</strong>al informati<strong>on</strong> <strong>on</strong> the characteristicsof the stilling well, to Noye (1974). Lenn<strong>on</strong> (1971)dealt in detail with errors that arise in the operati<strong>on</strong> ofsuch a system.A schematic diagram of a float gauge in a stilling wellis shown in Figure 3.1. The float wheel is shown drivinga pen recorder, but the same pulley could equally drivea digital shaft encoder or a potentiometer, which canthen be recorded by a local data logger or interfacedto a telemetry system. The well is shown with a c<strong>on</strong>icalinlet at its base, since this is the most comm<strong>on</strong> c<strong>on</strong>figurati<strong>on</strong><strong>and</strong> is to some extent self-cleaning. Manyother c<strong>on</strong>figurati<strong>on</strong>s of the inlet are acceptable, <strong>and</strong>although the c<strong>on</strong>ical orifice does restrict the inflowrelative to the outflow, this does not appear to have asignificant effect <strong>on</strong> the records even in the presenceof waves.Figure 3.1 Stilling well tide gauge.3.2.1 Datum SwitchesIn comm<strong>on</strong> with all other types of <strong>sea</strong> <strong>level</strong> recordingsystems, the setting <strong>and</strong> c<strong>on</strong>trol of datums is of crucialimportance. This topic is dealt with in secti<strong>on</strong> 4.Stilling well tide gauge installati<strong>on</strong>s were, at <strong>on</strong>e time,attended <strong>on</strong> a c<strong>on</strong>tinuous basis. Under these circumstancesvisual comparis<strong>on</strong>s were made with a fixed tidegauge staff <strong>on</strong> a regular basis <strong>and</strong> appropriate time <strong>and</strong>datum correcti<strong>on</strong>s were applied to the data. Withoutthis, alternative means of fixing the datum have to befound. One alternative is to site a <strong>level</strong> switching deviceas part of the installati<strong>on</strong> at approximately mean <strong>sea</strong><strong>level</strong>. The switch indicates the instant at which the <strong>sea</strong>crosses the <strong>level</strong> of the switch, a <strong>level</strong> that is known rel-12IOC <str<strong>on</strong>g>Manual</str<strong>on</strong>g>s <strong>and</strong> Guides No 14 vol IV
Sea Level Measurement <strong>and</strong> Interpretati<strong>on</strong>ative to all other datums of the tide gauge. Ideally theswitch, which can be mechanical, optical or acoustic,should be sited outside the well in its own mini-stillingwell. The switch provides a correcti<strong>on</strong> for any datumshift that previously would have been manually recordedby an operator. Although the switch will not workcorrectly under all c<strong>on</strong>diti<strong>on</strong>s, e.g. when high waves ora seiche is present, there will usually be sufficient daysof calm to obtain an accurate datum check.3.3 Pressure GaugesInstruments that measure subsurface pressure insteadof <strong>sea</strong> <strong>level</strong> directly have found widespread use. Aknowledge of <strong>sea</strong>water density <strong>and</strong> gravitati<strong>on</strong>al accelerati<strong>on</strong>is required to make the c<strong>on</strong>versi<strong>on</strong> from pressureto <strong>sea</strong> <strong>level</strong>, but in spite of this, the instrumentshave many practical advantages as <strong>sea</strong> <strong>level</strong> recorders.The most comm<strong>on</strong>ly used types are the pneumaticbubbler gauges <strong>and</strong> pressure sensor gauges in whichsensors are mounted directly in the <strong>sea</strong>. The two typeshave much in comm<strong>on</strong> <strong>and</strong> a choice of which type issuitable is usually based <strong>on</strong> practical c<strong>on</strong>siderati<strong>on</strong>s ata proposed site.3.3.1 Pneumatic Bubbler GaugesThe pneumatic bubbler tide gauge has been successfullyused worldwide for several decades. Itreplaced many of the float-operated harbour gaugesas the primary st<strong>and</strong>ard for <strong>sea</strong> <strong>level</strong> <strong>measurement</strong> incountries such as the United States <strong>and</strong> the UnitedKingdom, although in the USA they have since beensuperseded by acoustic gauges (secti<strong>on</strong> 3.4). TheUK still operates its Nati<strong>on</strong>al Tide Gauge Network(44 stati<strong>on</strong>s) based <strong>on</strong> this technology. It has beenshown to be robust, both in terms of accuracy <strong>and</strong>datum stability. It has dem<strong>on</strong>strated its value insituati<strong>on</strong>s where there are no vertical structures <strong>on</strong>which to attach the equipment, e.g. <strong>on</strong> coral atolls(Pugh, 1978), as the part of the equipment installedin the <strong>sea</strong> <strong>and</strong> <strong>on</strong> l<strong>and</strong> can be several hundred metresapart, which is not the case with many other typesof instrument.Figure 3.2 shows the basic essentials of a bubbler system.Air is passed at a metered rate al<strong>on</strong>g a small-boretube to a pressure point fixed underwater well belowthe lowest expected <strong>sea</strong> <strong>level</strong>. The pressure pointnormally takes the form of a short vertical cylinderwith a closed top face <strong>and</strong> open at the bottom. Asmall ‘bleed hole’ is drilled about half way down itslength <strong>and</strong> metered air is entered through a c<strong>on</strong>necti<strong>on</strong><strong>on</strong> the top surface. As air from the tube entersthe pressure point it becomes compressed <strong>and</strong> pushesthe water down inside the chamber until the <strong>level</strong>of the bleed hole is reached at which time the airbubbles out through the hole <strong>and</strong> back to the surface.Provided that the rate of air flow is low <strong>and</strong> the airsupply tube is not unduly l<strong>on</strong>g, the pressure of air inthe system will equal that of the pressure due to thedepth of the <strong>sea</strong> water above the bleed hole coupledwith atmospheric pressure. A pressure-recordingFigure 3.2 Bubbler pressure gauge.IOC <str<strong>on</strong>g>Manual</str<strong>on</strong>g>s <strong>and</strong> Guides No 14 vol IV13
Sea Level Measurement <strong>and</strong> Interpretati<strong>on</strong>instrument c<strong>on</strong>nected into this supply tube at thel<strong>and</strong>ward end records the changes in water <strong>level</strong> aschanging pressures, according to the law:h=(p-p a )/(ρg)where hpp aρg= height of <strong>sea</strong> <strong>level</strong> above the bleed hole= measured pressure= atmospheric pressure= <strong>sea</strong>water density= gravitati<strong>on</strong>al accelerati<strong>on</strong>Most pneumatic instruments use a pressure sensoras part of the recording equipment to m<strong>on</strong>itor thechanges in pressure <strong>and</strong> hence <strong>sea</strong> <strong>level</strong>. It is comm<strong>on</strong>to use a sensor operating in the differential mode, sensorsbeing so c<strong>on</strong>structed that the system pressure isopposed by atmospheric pressure. Hence, the resultantpressure experienced by the sensor becomes (p–p a ),making the measured pressure directly proporti<strong>on</strong>al tothe required <strong>sea</strong> <strong>level</strong>.A knowledge of the <strong>sea</strong>water density (ρ) is important.This is normally obtained from separate watersampling, <strong>and</strong>, where the water is well mixed, can bec<strong>on</strong>sidered c<strong>on</strong>stant. In estuarine locati<strong>on</strong>s, the densitymay change during a tidal cycle or <strong>sea</strong>s<strong>on</strong>ally, <strong>and</strong>density correcti<strong>on</strong>s will have to be included in the dataprocessing.Several other effects <strong>on</strong> the measured pressure haveto be c<strong>on</strong>sidered. These include a ‘static’ effect, whichis a functi<strong>on</strong> of the height of the gauge above <strong>sea</strong><strong>level</strong>, <strong>and</strong> a ‘dynamic’ effect, which results from thedynamics of gas flow. The latter can be calculated interms of tube length <strong>and</strong> radius <strong>and</strong> the minimumair-flow c<strong>on</strong>sistent with preventing water from enteringthe system (Pugh, 1972). The effect of waves <strong>on</strong>the system is to introduce a positive bias during stormc<strong>on</strong>diti<strong>on</strong>s (i.e. <strong>sea</strong> <strong>level</strong> is measured too high). Theseeffects can perturb the <strong>sea</strong> <strong>level</strong> <strong>measurement</strong>s at thesub-centimetre <strong>level</strong> during average c<strong>on</strong>diti<strong>on</strong>s, but<strong>measurement</strong>s may be incorrect by several centimetresunder extreme waves.In comm<strong>on</strong> with all pressure measuring systems, thereis a need to establish a datum for the observed timeseries. This can be achieved in several ways: (a) froma knowledge of the exact depth of the pressure pointbleed hole during installati<strong>on</strong>, combined with accuratecalibrati<strong>on</strong> of the pressure transducer; (b) using datum<strong>level</strong> switches similar to those described above forstilling wells which trigger at a known <strong>sea</strong> <strong>level</strong>; (c) byhaving a parallel system (called a ‘B’ gauge; secti<strong>on</strong>3.3.4) with a sec<strong>on</strong>d <strong>and</strong> more accessible pressurepoint fixed near mean <strong>sea</strong> <strong>level</strong>. Comparis<strong>on</strong> of the differencesbetween the two bubbling systems when bothare submerged gives an accurate measure of the datum;method ‘c’ is the most accurate.Air is normally supplied to a bubbler from a compressorto afford c<strong>on</strong>tinuous operati<strong>on</strong> of the installati<strong>on</strong>. In theevent of electrical supply failure, a reserve air capacitycapable of sustaining the system for at least several daysis necessary. For sustained operati<strong>on</strong> under fault c<strong>on</strong>diti<strong>on</strong>s,an alternative low power backup system in theform of a pressure transducer mounted directly in the<strong>sea</strong> is necessary. Transducers, compressors, data loggersetc. can be purchased from the major gauge manufacturerswith ready-to-go packages. An all-bubbler systemhas an advantage that most comp<strong>on</strong>ents are underwater,<strong>and</strong> that all comp<strong>on</strong>ents are both robust <strong>and</strong>, ifdamaged, relatively inexpensive to replace.3.3.2 Pressure Sensor GaugesPressure sensors can be fixed directly in the <strong>sea</strong> tom<strong>on</strong>itor sub-surface pressure in a similar fashi<strong>on</strong> to thebubbler gauge. The sensor is c<strong>on</strong>nected by a cable thatcarries power <strong>and</strong> signal lines to an <strong>on</strong>shore c<strong>on</strong>trol<strong>and</strong> logging unit. In the <strong>sea</strong>, the active sensor is usuallyc<strong>on</strong>tained within a copper or titanium housing withthe cable entering through a watertight gl<strong>and</strong>. Materialused for the housing is chosen to limit marine growth.The assembly is c<strong>on</strong>tained in an outer protective tubeto provide a stable fixati<strong>on</strong> to a <strong>sea</strong> wall or rock outcrop.Where this is not possible, the pressure sensormay be placed securely <strong>on</strong> the <strong>sea</strong> bed, but this methodhas disadvantages, as deployment <strong>and</strong> maintenanceusually require a diving team.Pressure-based instruments can be operated from batteriesfor periods of a year or more, as they c<strong>on</strong>sumea very small amount of power. This can be advantageouseven where electrical supplies are available butsubject to l<strong>on</strong>g periods of failure. Therefore, they havebeen used extensively in remote areas, such as oceanicisl<strong>and</strong>s, where access is limited. In polar regi<strong>on</strong>s, theyoffer the best alternative if the area is ice covered or ifthe gauge is to be left unattended for l<strong>on</strong>g periods. Themain disadvantage is the lack of a fixed datum <strong>level</strong>,which has to be found by alternative means.Pressure sensors are available in two varieties thatprovide either an absolute or differential signal. If anabsolute transducer is employed, the sensor provides a<strong>measurement</strong> of the total pressure including <strong>sea</strong> <strong>level</strong><strong>and</strong> atmosphere. Therefore, a separate barometer isrequired usually in the form of an identical transduceropen to the atmosphere. Both sensors are synchr<strong>on</strong>izedto the same clock so they can readily be subtracted toyield <strong>sea</strong> <strong>level</strong> (with subsequent correcti<strong>on</strong> for density<strong>and</strong> accelerati<strong>on</strong> due to gravity). Differential pressuretransducers have a vented cable in which the referenceside of the transducer is open to the atmosphere.Vented systems are known to suffer from occasi<strong>on</strong>alblockage <strong>and</strong> are used less frequently in hazardousenvir<strong>on</strong>ments. In additi<strong>on</strong>, a record of barometric pressureis valuable for oceanographic studies, so the twotransduceropti<strong>on</strong> is most frequently employed.14IOC <str<strong>on</strong>g>Manual</str<strong>on</strong>g>s <strong>and</strong> Guides No 14 vol IV
Sea Level Measurement <strong>and</strong> Interpretati<strong>on</strong>Relatively inexpensive pressure sensors use strain gaugeor ceramic technology in which changes in water pressurecause changes in resistance or capacitance in thepressure element. The most accurate, but expensive,sensors use a quartz element, the res<strong>on</strong>ant frequencyof which varies with the strain applied to it. The resultingsignal, which is normally a frequency proporti<strong>on</strong>alto the applied pressure, is carried down the signalcable to the c<strong>on</strong>trol electr<strong>on</strong>ics where it is c<strong>on</strong>vertedinto physical units <strong>and</strong> can be displayed <strong>and</strong> stored bya data logger.All pressure transducers are sensitive to temperature. Somehave an in-built temperature sensor to allow compensati<strong>on</strong>of the pressure signal. If this is not the case, then itis important that temperature is m<strong>on</strong>itored independently<strong>and</strong> used as a correcti<strong>on</strong>. In general, <strong>sea</strong> temperaturevaries much less than atmospheric temperature <strong>and</strong> compensati<strong>on</strong>by either of the above methods is effective.Users with access to a test facility can also subject theinstruments to a range of temperatures <strong>and</strong> pressures toensure that calibrati<strong>on</strong> values are correct. Experience hasshown that the calibrati<strong>on</strong> coefficients supplied by leadingmanufacturers are accurate <strong>and</strong> c<strong>on</strong>stant over periods ofseveral years. Drift in the various properties of pressuresensors is c<strong>on</strong>fined to changes in its datum value (i.e.there is usually no change in scale). However, even for ahigh-quality low-pressure sensor suitable for coastal work,instrumental drift can be an important issue (of the orderof 1 mm per year) which has to be addressed throughregular checks of some kind.Single transducer systems can be deployed in envir<strong>on</strong>mentallyhostile areas where other forms of gauge willnot work. For example, they can be safely positi<strong>on</strong>ed<strong>on</strong> the <strong>sea</strong> bed under the winter ice at polar sites withthe signal cable to the tide gauge hut <strong>on</strong> the shoreprotected by a steel pipe. They can be operated atsites with harsh weather c<strong>on</strong>diti<strong>on</strong>s where the exposedstructures of a stilling well or acoustic gauge maybe subject to extreme forces of winds <strong>and</strong> waves. Intropical locati<strong>on</strong>s, where equipment may be pr<strong>on</strong>e tomechanical damage by falling trees etc., single transducersystems can be deployed safely below the <strong>sea</strong>surface. Even in locati<strong>on</strong>s with excessive marine growthor silt deposits, pressure systems appear to work correctlyfor l<strong>on</strong>g periods of time.Pressure sensors have a fast resp<strong>on</strong>se time <strong>and</strong> havebeen used to measure wave heights at periods of a fewsec<strong>on</strong>ds. In tide gauge applicati<strong>on</strong>s, the signal is usuallyaveraged by the c<strong>on</strong>trol electr<strong>on</strong>ics to a more relevantperiod, such as 1, 6 or 15 minutes. This method ofaveraging allows a great deal of flexibility, since thesampling period can be easily altered to suit the applicati<strong>on</strong>.Changes can be made remotely if an installati<strong>on</strong>is c<strong>on</strong>nected by a teleph<strong>on</strong>e link or to a two-way communicati<strong>on</strong>network.abFigure 3.3 Pressure gauge.(a) The pressure sensor is mounted directly in the <strong>sea</strong>.(b) In this case, it is fastened to a pier in Port Stanleyharbour.As with the bubbler gauge, <strong>sea</strong>water density is neededto c<strong>on</strong>vert measured pressures into heights. The commentsmade in secti<strong>on</strong> 3.3.1 are equally valid.3.3.3 The Datum of a Pressure SystemThe major problem with a single pressure transduceris establishing a datum for its <strong>measurement</strong>s. A goodapproximati<strong>on</strong> can be obtained with differential transducersby careful calibrati<strong>on</strong> within a test facility. Itis less accurate with absolute sensors because atmosphericpressure introduces an offset that may preventa sufficiently low pressure being reached during thecalibrati<strong>on</strong>. In general, other means of fixing the datumare preferred.A method frequently adopted is to make visual <strong>measurement</strong>sagainst a tide staff over a period of <strong>on</strong>e day<strong>and</strong> repeat this at regular intervals. Individual <strong>measurement</strong>sshould be accurate to 2–3 cm <strong>and</strong> <strong>on</strong> averageIOC <str<strong>on</strong>g>Manual</str<strong>on</strong>g>s <strong>and</strong> Guides No 14 vol IV15
Sea Level Measurement <strong>and</strong> Interpretati<strong>on</strong>should fix the datum to approximately centimetre accuracy.However it is tedious <strong>and</strong> can <strong>on</strong>ly be carried outinfrequently in remote areas.3.3.4 Multiple Pressure Transducer Systems(‘B’ gauges)A method was developed at POL in the early 1990sfor precise datum c<strong>on</strong>trol of <strong>sea</strong> <strong>level</strong> records frompressure tide gauges. An additi<strong>on</strong>al pressure pointwas located at approximately mean <strong>sea</strong> <strong>level</strong> <strong>and</strong>fixed relative to the c<strong>on</strong>tact point of the gauge. Thejuncture at which the tide fell below this sec<strong>on</strong>dsensor could be used to fix the datum of the recordfrom the principal sensor. The technique was foundto be extremely reliable <strong>and</strong> accurate <strong>and</strong> now formsthe basis of gauges, called ‘B’ gauges, in POL’s SouthAtlantic <strong>and</strong> Antarctic networks (Spencer et al.,1993). The principle of the technique was describedin detail in Volume 2 of the <str<strong>on</strong>g>Manual</str<strong>on</strong>g> (IOC, 1994) <strong>and</strong>in the scientific literature (Woodworth et al., 1996).At the time of writing, it is not possible to purcha<strong>sea</strong> ‘B’ gauge although expressi<strong>on</strong>s of interest in theirmanufacture have been obtained from major suppliers.A schematic ‘B’ gauge setup is shown in Figure 3.4,with an absolute pressure sensor in the water (‘C’)<strong>and</strong> another in the atmosphere (‘A’). Paroscientificdigiquartz sensors are employed throughout, althoughless expensive sensors should work reas<strong>on</strong>ably well<strong>and</strong> are being investigated. The difference C–A gives<strong>sea</strong> <strong>level</strong>, after correcti<strong>on</strong>s for <strong>sea</strong>water density <strong>and</strong>accelerati<strong>on</strong> due to gravity are applied. A third sensoris placed at ‘Datum B’ which is near mean <strong>sea</strong> <strong>level</strong>.The height of ‘Datum B’ has to be known accuratelyrelative to the c<strong>on</strong>tact point of the installati<strong>on</strong> <strong>and</strong> tothe local l<strong>and</strong> <strong>level</strong>ling network. The difference B–A isagain a <strong>sea</strong> <strong>level</strong> height, but <strong>on</strong>ly when the <strong>sea</strong> <strong>level</strong>is above ‘Datum B’. The top part of this record can befitted to the equivalent part of the record from theprincipal sensor to transpose the known datum to thefull <strong>sea</strong> <strong>level</strong> record. It is important that all sensors aredriven from the same c<strong>on</strong>trol <strong>and</strong> logging system tomaintain synchr<strong>on</strong>y. Sampling the data at 15-minuteintervals or less is preferred for the identificati<strong>on</strong> ofthe inflexi<strong>on</strong> points, i.e. the time at which the <strong>sea</strong> <strong>level</strong>falls (or rises) below (or above) ‘Datum-B’.The essential feature is that, while any pressure measuredby a sensor at B will c<strong>on</strong>tain an offset, <strong>and</strong> perhapsa drift, the vertical height of its effective pressurepoint can be positi<strong>on</strong>ed at ‘Datum B’ very accurately.So, although it is not known what it is measuring towithin perhaps a few hectopascals (centimetres), it isknown where it is measuring with millimetric precisi<strong>on</strong>.The flat part of B–A <strong>and</strong> its inflexi<strong>on</strong> points provide anextremely precisely defined shape which is immune toany problems with datum offsets <strong>and</strong> low-frequencyinstrumental drifts. Experience with several instrumentsat different sites suggests that datums can be fixed towithin a few millimetres by this technique.To work properly, the method needs a sizable tidal range,so that B will spend half its time in water <strong>and</strong> half in air.It will not work in lakes or microtidal areas, but mostcoastal <strong>and</strong> many isl<strong>and</strong> sites have usable tidal ranges,even if <strong>on</strong>ly at spring tides. In the presence of waves,the flat porti<strong>on</strong> of the ‘B’ gauge is reduced in length<strong>and</strong> may be unu<strong>sea</strong>ble under large wave c<strong>on</strong>diti<strong>on</strong>s.However, there are is always a sufficient number of calmdays during which the technique can be applied.In practice, the two pressure sensors in the <strong>sea</strong> are colocatednear the base of the installati<strong>on</strong> with a rigidtube c<strong>on</strong>necting the ‘B’ gauge to its appropriate datumpoint. This avoids the ‘B’ sensor being subject to atmospherictemperature variati<strong>on</strong>s that are more severethan those of the <strong>sea</strong>. The barometric sensor may alsobe installed at the same positi<strong>on</strong> with a tube open toatmosphere. Alternatively it may be installed as partof the data logger in the tide gauge hut. The methoddoes not require the actual installed height of C or A tobe known. Where it is difficult to install a fixed gaugeC below the water, because of shallow gradients perhaps,then a pop-up or bottom-mounted gauge couldequally well be used.3.3.5 Pressure Transducers in Stilling WellsA variant of the ‘B’ gauge method described aboveis to install an absolute pressure sensor below lowwater in a stilling well that has been used hithertoin a float system. This transducer will be functi<strong>on</strong>allythe same as sensor ‘C’ <strong>and</strong> will be complementedby a transducer ‘A’ that records atmospheric pressure,as described above. Alternatively, a ‘differential’sensor could be used. Instead of a third sensoremployed in the ‘B’ gauge, datum c<strong>on</strong>trol for theC–A pressure-difference time-series is provided bymeans of regular, preferably daily, electr<strong>on</strong>ic datumprobe checks of the <strong>level</strong> in the well relative to thetide gauge CP <strong>and</strong> TGBM. Comparis<strong>on</strong> of the valuesof C–A, corrected for density <strong>and</strong> accelerati<strong>on</strong>due to gravity, with the well soundings, providesan <strong>on</strong>going datum for the time-series which canaccommodate transducer drift <strong>and</strong> variati<strong>on</strong>s in theproperties of the <strong>sea</strong> water.This method has many of the advantages of pressuresystems <strong>and</strong> of electr<strong>on</strong>ic datum probes, combinedwith the recognized disadvantages inherent in theuse of stilling wells (Lenn<strong>on</strong>, 1971). It may be apreferred opti<strong>on</strong> if <strong>measurement</strong>s are required froma well that has produced l<strong>on</strong>g-term <strong>measurement</strong>sfrom a float gauge.3.3.6 Bottom-mounted Pressure GaugesBottom pressure gauges rest <strong>on</strong> the <strong>sea</strong> bed <strong>and</strong>record pressure at intervals over periods of a year or16IOC <str<strong>on</strong>g>Manual</str<strong>on</strong>g>s <strong>and</strong> Guides No 14 vol IV
Sea Level Measurement <strong>and</strong> Interpretati<strong>on</strong>amore. They are self-c<strong>on</strong>tained instruments poweredby batteries. They have little applicati<strong>on</strong> to the l<strong>on</strong>gterm<strong>measurement</strong> of coastal <strong>sea</strong> <strong>level</strong> but have beenused extensively to obtain initial tidal knowledge ofan area where a coastal gauge is planned. Their mainproblem in the GLOSS c<strong>on</strong>text is the lack of a datum.They have principally proved their value offshore <strong>and</strong>in the deep ocean (Spencer <strong>and</strong> Vassie, 1997).3.4 Acoustic Tide GaugesA number of acoustic tide gauges have been developedwhich depend <strong>on</strong> measuring the travel timeof acoustic pulses reflected vertically from the <strong>sea</strong>surface. This type of <strong>measurement</strong> can theoreticallybe made in the open with the acoustic transducermounted vertically above the <strong>sea</strong> surface, but in certainc<strong>on</strong>diti<strong>on</strong>s the reflected signals may be lost. Toensure c<strong>on</strong>tinuous <strong>and</strong> reliable operati<strong>on</strong> the sensoris located inside a tube that provides some degreeof surface stilling <strong>and</strong> protects the equipment; somesensors even c<strong>on</strong>strain the acoustic pulses within anarrow vertical tube, which is c<strong>on</strong>tained inside theprevious <strong>on</strong>e. This outer tube does not completelyfilter out wave acti<strong>on</strong> but, by averaging a number of<strong>measurement</strong>s, the desired filtering is achieved.bThe velocity of sound in air varies significantly withtemperature <strong>and</strong> humidity (about 0.17%/°C) <strong>and</strong>some form of compensati<strong>on</strong> is necessary to obtainsufficient accuracy. The simplest method is to measurethe air temperature c<strong>on</strong>tinuously at a point inthe air column <strong>and</strong> use this to calculate the soundvelocity. To account for temperature gradients in theair column, temperature sensors may be required ata number of different <strong>level</strong>s.A more accurate method of compensati<strong>on</strong> is by useof an acoustic reflector at a fixed <strong>level</strong> in the air column.By relating the reflecti<strong>on</strong> from the <strong>sea</strong> surfaceto that from the fixed reflector, direct compensati<strong>on</strong>for variati<strong>on</strong> in sound velocity between the acoustictransducer <strong>and</strong> the fixed reflector can be achieved.However this still does not account for any variati<strong>on</strong>in sound velocity between the fixed reflector <strong>and</strong>the <strong>sea</strong> surface. To achieve full compensati<strong>on</strong> wouldrequire, in principle, a number of fixed reflectorscovering the full tidal range, but n<strong>on</strong>e of the knownacoustic sensors has this possibility.Figure 3.4 (a,b) Schematics of operati<strong>on</strong> of a ‘B’ gauge.3.4.1 Acoustic Gauges with Sounding TubesThe Nati<strong>on</strong>al Oceanic <strong>and</strong> Atmospheric Administrati<strong>on</strong>(NOAA), Nati<strong>on</strong>al Ocean Service (NOS) in the USA,initiated over a decade ago a multi-year implementati<strong>on</strong>of a Next-Generati<strong>on</strong> Water Level MeasurementSystem (NGWLMS), both within the US nati<strong>on</strong>altide gauge network <strong>and</strong> at selected sites aroundIOC <str<strong>on</strong>g>Manual</str<strong>on</strong>g>s <strong>and</strong> Guides No 14 vol IV17
Sea Level Measurement <strong>and</strong> Interpretati<strong>on</strong>the world (Gill et al., 1993). These systems wereoperated al<strong>on</strong>gside existing (float or bubbler) tidegauges at many stati<strong>on</strong>s for a minimum period of<strong>on</strong>e year to provide datum ties <strong>and</strong> data c<strong>on</strong>tinuity.Dual systems were maintained at a few stati<strong>on</strong>s forseveral years to provide a l<strong>on</strong>g-term comparis<strong>on</strong>.Tide gauges using the same technology have beendeployed in a number of other countries, such asAustralia, where they are known as SEAFRAME systems(Lenn<strong>on</strong> et al., 1993).The NGWLMS tide gauge uses an Aquatrak water<strong>level</strong> sensor developed by Bartex Inc. <strong>and</strong> acquired byAquatrak Corporati<strong>on</strong>, together with a Sutr<strong>on</strong> dataprocessing<strong>and</strong> transmissi<strong>on</strong> system. The Aquatraksensor sends a shock wave of acoustic energy downa 1/2-inch-diameter PVC sounding tube <strong>and</strong> measuresthe travel time for the reflected signals froma calibrati<strong>on</strong> reference point <strong>and</strong> from the watersurface. Two temperature sensors give an indicati<strong>on</strong>of temperature gradients down the tube. Thecalibrati<strong>on</strong> reference allows the c<strong>on</strong>troller to adjustthe <strong>measurement</strong>s for variati<strong>on</strong>s in sound velocitydue to changes in temperature <strong>and</strong> humidity. Thesensor c<strong>on</strong>troller performs the necessary calculati<strong>on</strong>sto determine the distance to the water surface. Thesounding tube is mounted inside a 6-inch-diameterPVC protective well which has a symmetrical2-inch-diameter double c<strong>on</strong>e orifice to provide somedegree of stilling. The protective well is more opento the local dynamics than the traditi<strong>on</strong>al stillingwell <strong>and</strong> does not filter waves entirely. In areas ofhigh-velocity tidal currents <strong>and</strong> high-energy <strong>sea</strong> swell<strong>and</strong> waves, parallel plates are mounted below theorifice to reduce the pull-down effects (Shih <strong>and</strong> Baer,1991). Figure 3.5 is a schematic of a typical NGWLMSinstallati<strong>on</strong>. To obtain the best accuracy, the acousticsensor is calibrated by reference to a stainless steeltube of certified length, from which the zero offset isdetermined.The NGWLMS gauges have the capability of h<strong>and</strong>lingup to 11 different ancillary oceanographic <strong>and</strong> meteorologicalsensors. The field units are programmed totake <strong>measurement</strong>s at 6-minute intervals with each<strong>measurement</strong> c<strong>on</strong>sisting of 181 <strong>on</strong>e-sec<strong>on</strong>d-intervalwater <strong>level</strong> samples centred <strong>on</strong> each tenth of anhour. Software in the instrument rejects outliers etc.which can occur as a result of spurious reflecti<strong>on</strong>s.Measurements have a typical resoluti<strong>on</strong> of 3 mm.The instrument c<strong>on</strong>tains the necessary hardware forteleph<strong>on</strong>e <strong>and</strong> satellite communicati<strong>on</strong>s.Papers by Gill et al. (1993) describe the operati<strong>on</strong>alperformance of the NGWLMS instrumentati<strong>on</strong>.Lenn<strong>on</strong> et al. (1993) <strong>and</strong> Vassie et al. (1993) presentcomparis<strong>on</strong>s between NGWLMS <strong>and</strong> c<strong>on</strong>venti<strong>on</strong>alstilling well or bubbler systems in Australia <strong>and</strong> theUK. Most comparis<strong>on</strong>s show small differences, of theorder of a few millimetres, for the various tidal <strong>and</strong>datum parameters, which are generally within theuncertainty of the instrumentati<strong>on</strong>. Such differencesare very small when compared to typical tidal ranges<strong>and</strong> even <strong>sea</strong>s<strong>on</strong>al <strong>and</strong> interannual <strong>sea</strong> <strong>level</strong> variati<strong>on</strong>s.NGWLMS systems are c<strong>on</strong>sidered sufficientlyaccurate for mean <strong>sea</strong> <strong>level</strong> studies.Figure 3.5 NGWLMS tide gauge.18IOC <str<strong>on</strong>g>Manual</str<strong>on</strong>g>s <strong>and</strong> Guides No 14 vol IV
Sea Level Measurement <strong>and</strong> Interpretati<strong>on</strong>A modern versi<strong>on</strong> of the NGWLMS is called a SeaRanger which is claimed to have a number of advantagesover the earlier technology including self calibrati<strong>on</strong>(IOC, 2004)3.4.2 Acoustic Gauges without Sounding TubesSeveral acoustic instruments have been producedthat are operated without a sounding tube, normallylocated inside an existing stilling well or inside aplastic tube some 25 cm in diameter. Some of themmay operate in the open air, but are not normallyemployed for high-quality <strong>sea</strong> <strong>level</strong> <strong>measurement</strong>s(see Table 3.1 in secti<strong>on</strong> 3.6). These acoustic instrumentsoperate at a frequency of 40–50 kHz <strong>and</strong> havea relatively narrow beam width of 5°. Their <strong>measurement</strong>range is approximately 15 m <strong>and</strong> an overallaccuracy of 0.05% is claimed by the manufacturers(see websites below).C<strong>on</strong>tradictory experiences can be found with this typeof acoustic sensor, from some problems in achievingthe stated accuracy under all envir<strong>on</strong>mental c<strong>on</strong>diti<strong>on</strong>s(e.g. see presentati<strong>on</strong> by Ruth Farre, in IOC, 2003), tothe high-quality <strong>and</strong> c<strong>on</strong>tinuous operati<strong>on</strong> of 15 tidegauges in the REDMAR network (Spain), most of theminstalled in 1992 <strong>and</strong> still in operati<strong>on</strong> (e.g. see presentati<strong>on</strong>by Begoña Pérez in IOC, 2003).A crucial aspect of this type of sensor is the dependenceof the velocity of sound <strong>on</strong> the envir<strong>on</strong>mentalc<strong>on</strong>diti<strong>on</strong>s, such as the air temperature. On the otherh<strong>and</strong>, tubes tend to increase the temperature-gradientbetween the instrument <strong>and</strong> the <strong>sea</strong> surfaceunless special precauti<strong>on</strong>s are taken to ensure thatthe air is well mixed in the tube. A complementary<strong>and</strong> necessary method is to compensate for soundvelocity variati<strong>on</strong>s using a reflector mounted at asuitable distance below the transmitter, as is the casefor the SRD gauges employed in the REDMAR network.A careful design of the installati<strong>on</strong>, avoidingdifferent ambient c<strong>on</strong>diti<strong>on</strong>s al<strong>on</strong>g the tube <strong>and</strong> followingthe maker’s requirements about the minimumdistance to the water surface, become crucial for thefinal accuracy of the data.The performance of <strong>on</strong>e of these sensors (SRD) overan existing stilling well inside a hut or small buildingin Sant<strong>and</strong>er (Spain), has been incredibly good (nearlyperfect <strong>and</strong> c<strong>on</strong>tinuous during 15 years). The c<strong>on</strong>diti<strong>on</strong>sof this installati<strong>on</strong> are probably perfect, perhapsbecause the temperature inside the building is ratherhomogeneous. Data from this acoustic sensor have infact helped to correct malfuncti<strong>on</strong>s of the float gaugethat operates inside the same stilling well.Studies of mean <strong>sea</strong> <strong>level</strong>s from 12 years of data inSpain, comparing this type of acoustic sensor (SRD)with the traditi<strong>on</strong>al float gauges, has shown theirhigh quality <strong>and</strong> has even helped to identify referencejumps in the older float gauges. This is, again,a c<strong>on</strong>tradictory experience to the <strong>on</strong>e in South Africa(see article by Farre in Appendix V of this volume).Nevertheless, it seems that radar gauges will replacethis type of acoustic sensor everywhere, in the nearfuture.3.5 Radar GaugesRadar tide gauges have become available during thelast few years from several manufacturers. Although thistechnology is relatively new, radar gauges are being purchased<strong>and</strong> installed by a number of agencies as replacementsfor older instruments or for completely newnetworks. The reas<strong>on</strong> is that they are as easy to operate<strong>and</strong> maintain as acoustic sensors, without their maindisadvantage: their high dependence <strong>on</strong> the air temperature.Radar gauges have a relatively low cost <strong>and</strong> theengineering work necessary to install them is relativelysimple compared to other systems. The instruments aresupplied with the necessary hardware <strong>and</strong> software toc<strong>on</strong>vert the radar <strong>measurement</strong>s into a <strong>sea</strong>-<strong>level</strong> height.In additi<strong>on</strong>, the output signals are often compatible withexisting data loggers or can be interfaced to a communicati<strong>on</strong>network. Like many modern systems they can beset up using a portable computer.The active part of the gauge is located above thewater surface <strong>and</strong> measures the distance from thispoint to the air–<strong>sea</strong> interface. A diagram is given inFigure 3.6. The gauge has to be mounted in such away that there are no restricti<strong>on</strong>s or reflectors in thepath of the radar beam, between the gauge mounting<strong>and</strong> the <strong>sea</strong> surface. It has to be positi<strong>on</strong>ed abovethe highest expected <strong>sea</strong> <strong>level</strong> <strong>and</strong> preferably abovethe highest expected wave height, so as to preventphysical damage.It has many advantages over traditi<strong>on</strong>al systems inthat it makes a direct <strong>measurement</strong> of <strong>sea</strong> <strong>level</strong>.The effects of density <strong>and</strong> temperature variati<strong>on</strong>s,even in the atmosphere, are unimportant. The mainc<strong>on</strong>straint is that the power c<strong>on</strong>sumpti<strong>on</strong> may berelatively large in radar systems if used <strong>on</strong> a c<strong>on</strong>tinuousbasis in a rapid sampling mode. Averages aretypically taken over periods of minutes. This maylimit its use in some applicati<strong>on</strong>s (e.g. tsunami warning)where observati<strong>on</strong>s are required <strong>on</strong> a c<strong>on</strong>tinuoushigh-frequency (e.g. 15-sec<strong>on</strong>d) basis. In such areas,pressure gauges may be more appropriate, althoughwork <strong>and</strong> re<strong>sea</strong>rch is still being d<strong>on</strong>e c<strong>on</strong>cerning thisparticular applicati<strong>on</strong>.Radar gauges fall into two categories. Those thattransmit a c<strong>on</strong>tinuous frequency <strong>and</strong> use the phaseshift between transmitted <strong>and</strong> received signal to determine<strong>sea</strong> <strong>level</strong> height (frequency-modulated c<strong>on</strong>tinuousIOC <str<strong>on</strong>g>Manual</str<strong>on</strong>g>s <strong>and</strong> Guides No 14 vol IV19
Sea Level Measurement <strong>and</strong> Interpretati<strong>on</strong>abFigure 3.6 Radar tide gauges.(a) diagram comparing a radar <strong>and</strong> a bubbler gauge (Woodworth <strong>and</strong> Smith, 2003);(b) an OTT Kalesto test installati<strong>on</strong> at Liverpool.20IOC <str<strong>on</strong>g>Manual</str<strong>on</strong>g>s <strong>and</strong> Guides No 14 vol IV
Sea Level Measurement <strong>and</strong> Interpretati<strong>on</strong>waves: FMCW). The OTT Kalesto, Miros <strong>and</strong> Radac instrumentsuse this method. The VEGA <strong>and</strong> SEBA systems usepulsed transmissi<strong>on</strong>s <strong>and</strong> time-of-flight <strong>measurement</strong>.All these gauges have underg<strong>on</strong>e initial tests <strong>and</strong> intercomparis<strong>on</strong>sby various agencies in different countries.Details of these tests can be found in IOC WorkshopReport No 193. Details of the individual instruments canbe found <strong>on</strong> the websites shown below.In principle, the instruments are self calibrating,as far as a datum value is c<strong>on</strong>cerned. However, toprovide c<strong>on</strong>fidence that the datum remains c<strong>on</strong>stantover l<strong>on</strong>g time periods, alternative means are beinginvestigated. These take the form of a reflector thatcan be placed in the radar beam at appropriateintervals. The reflector is placed at a known distancebelow the c<strong>on</strong>tact point of the installati<strong>on</strong> for a shortperiod. Over a period of a year or more the datumvalue can be verified <strong>and</strong> used to adjust the <strong>measurement</strong>s,if necessary.Initial indicati<strong>on</strong>s that these instruments can provideacceptable <strong>measurement</strong>s for the purposes ofGLOSS are promising. As with all tide gauges, practicalc<strong>on</strong>siderati<strong>on</strong>s related to a particular applicati<strong>on</strong>often dominate other c<strong>on</strong>siderati<strong>on</strong>s. For example,they have very limited applicati<strong>on</strong> in polar regi<strong>on</strong>s.They have not yet been used in extremely hostileenvir<strong>on</strong>ments, for example <strong>on</strong> remote isl<strong>and</strong>s, whereextreme waves may overtop the gauge by severalmetres. However, for a normal applicati<strong>on</strong> in which astilling well or bubbler gauge is presently in use, theyappear to operate satisfactorily.3.6 Summary of the Merits of DifferentTechnologiesIn this secti<strong>on</strong>, we summarize the relative meritsof different tide gauge technologies for scientificre<strong>sea</strong>rch, operati<strong>on</strong>al oceanography <strong>and</strong> for localizedpractical purposes, such as harbour operati<strong>on</strong>s.The GLOSS programme has scientific re<strong>sea</strong>rch asits rais<strong>on</strong> d’être, although it is intended that thedevelopment of the GLOSS networks should serve toimprove st<strong>and</strong>ards overall (see IOC, 1997). We canuse the designati<strong>on</strong> ‘GLOSS’ to indicate the mostdem<strong>and</strong>ing requirement of scientific-quality performanceof a gauge (Appendix I).There are also <strong>sea</strong> <strong>level</strong> requirements from operati<strong>on</strong>alusers of oceanographic data in such topicsas marine infrastructure (e.g. offshore industry,transport, coastal recreati<strong>on</strong>) <strong>and</strong> coastal defences(e.g. flood protecti<strong>on</strong> from surges, <strong>and</strong> studies ofcoastal erosi<strong>on</strong> or <strong>sea</strong> <strong>level</strong> rise impacts). Many ofthese applicati<strong>on</strong>s overlap GLOSS interests, thestudy of secular changes in <strong>sea</strong> <strong>level</strong> being an obviousexample. However, the particular applicati<strong>on</strong>swill vary from country to country. Therefore, suchgauges will be capable of deployment for extendedperiods, but perhaps not to the same high st<strong>and</strong>ardsas those intended for GLOSS, <strong>and</strong> will be affordablefor use in larger numbers than for GLOSS, especiallyby developing countries.Finally, there will be applicati<strong>on</strong>s which require acheap instrument capable of showing the state ofthe tide at any moment but certainly not accurateenough for GLOSS.Table 3.1 presents a summary of the main c<strong>on</strong>clusi<strong>on</strong>s<strong>on</strong> the relative merits of each gauge technologybased <strong>on</strong> the previous secti<strong>on</strong>s of this <str<strong>on</strong>g>Manual</str<strong>on</strong>g>.The Table also includes an estimate of the likely costof a basic system with gauge, data transmissi<strong>on</strong> (e.g.modem) <strong>and</strong> meteorological package, although thisis an extremely difficult item to quote given the largenumber of manufacturers, m<strong>on</strong>etary exchange ratesetc. For example, the cost of a pressure transducerwill vary by a factor of 3 depending <strong>on</strong> the quality.With these reservati<strong>on</strong>s in mind, Cost B<strong>and</strong> 3has been set as the highest cost, which might be12,000–20,000 US$ (at the time of writing <strong>and</strong>within a large b<strong>and</strong>, say 30%); B<strong>and</strong> 2 might be8,000–12,000 US$; <strong>and</strong> B<strong>and</strong> 1, 5,000–8,000 US$.However, in our experience, the real costs of any tidegauge stati<strong>on</strong> are those of installati<strong>on</strong> (e.g. some kindof engineering support will be needed for installati<strong>on</strong>of a stilling well, acoustic sounding tube gauge, or‘B’ gauge; diver support will be needed for pressuregauge installati<strong>on</strong>s etc.), <strong>on</strong>going maintenance <strong>and</strong>data analysis (with implicati<strong>on</strong>s for staff resources).Any<strong>on</strong>e planning a gauge installati<strong>on</strong> has, therefore,to take into account all the local costs as well as theup-fr<strong>on</strong>t costs of gauge hardware. Agencies participatingin GLOSS which require the input of expertisemay wish to explore the possibilities of collaborati<strong>on</strong>with other GLOSS participants.Our recommendati<strong>on</strong>s are:• If <strong>on</strong>e is planning a new GLOSS tide gauge stati<strong>on</strong>in a mid- or low-latitude locati<strong>on</strong>, <strong>on</strong>e should probablyopt for:- an acoustic gauge with sounding tube or- a radar tide gauge or- a ‘B’ pressure gaugeIf low tidal range or other factors preclude the use ofa ‘B’ gauge, then a single transducer pressure gauge,a bubbler pressure gauge or a pressure transducer ina stilling well would be opti<strong>on</strong>s. In additi<strong>on</strong>, in mostcases, the main tide gauge should be accompaniedby a pressure sensor installed in the <strong>sea</strong> <strong>and</strong> capableIOC <str<strong>on</strong>g>Manual</str<strong>on</strong>g>s <strong>and</strong> Guides No 14 vol IV21
Sea Level Measurement <strong>and</strong> Interpretati<strong>on</strong>Acoustic Gauges without Sounding Tube inside Protective Tube or WellEquipment A ready-to-go package can be purchased from SRD that includes the sensor, the data logger <strong>and</strong> c<strong>on</strong>figurati<strong>on</strong> unit, <strong>and</strong>the communicati<strong>on</strong>s system.Operati<strong>on</strong> The device measures the time of flight of an acoustic pulse from a transducer to the <strong>sea</strong> surface. A bar is fixed at a knowndistance from the transducer, which is used for self-calibrati<strong>on</strong> <strong>and</strong> computati<strong>on</strong> of the velocity of sound before each <strong>measurement</strong>.The time is c<strong>on</strong>verted to a <strong>sea</strong> <strong>level</strong> height using the value of the velocity of sound in air previously computedby means of the fixed bar.Installati<strong>on</strong> This type of acoustic sensor has proved to be accurate enough if placed over an existing well, or inside a protective PVCRequirements tube of 300 mm diameter. The transducer must be located at a minimum distance of around 2–3 metres from the watersurface at any moment. As with many tide gauges, all ancillary equipment (data logger, modem, battery backup), needsto be housed in an adjacent building.Locati<strong>on</strong> Requires a <strong>sea</strong> wall or vertical structure for installati<strong>on</strong>.Calibrati<strong>on</strong> Calibrati<strong>on</strong> of the reference is performed during manufacture, prior to delivery.The calibrati<strong>on</strong> of the velocity of sound is made by means of the reflective bar at a known positi<strong>on</strong> in the acoustic beam.Accuracy 1 cm of <strong>sea</strong> <strong>level</strong>.Cost B<strong>and</strong> 2.Record of Use They have been used successfully in the REDMAR network, the Spanish Harbour Authority’s <strong>sea</strong> <strong>level</strong> network, for nearly16 years. The l<strong>on</strong>g-term means seem to be as accurate or better than the st<strong>and</strong>ard float gauges operating in Spain.CommentsIn areas of large tidal range a l<strong>on</strong>g protective tube is needed which may result in magnified temperature <strong>and</strong>/or temperature-gradienteffects. Very sensitive to the careful design of the installati<strong>on</strong>.Single Transducer Pressure GaugesEquipment Complete ready-to-go package (sub-<strong>sea</strong> pressure sensor, cabling <strong>and</strong> data logger) can be purchased from several manufacturers.Operati<strong>on</strong> Two different opti<strong>on</strong>s are available: (a) an absolute pressure sensor measuring the total pressure due to <strong>sea</strong> <strong>level</strong> <strong>and</strong> atmosphere;(b) a differential sensor which has a vented cable measuring pressure changes due to <strong>sea</strong> <strong>level</strong> al<strong>on</strong>e. C<strong>on</strong>versi<strong>on</strong>of pressure to <strong>sea</strong> <strong>level</strong> height requires knowing <strong>sea</strong>water density. Generally, an average value can be used unless thereare significant <strong>sea</strong>s<strong>on</strong>al or tidal variati<strong>on</strong>s. Pressure sensors are also temperature sensitive, but, since <strong>sea</strong> temperature variesmuch less than atmospheric temperature, this normally has a small effect.Sensors vary in cost by up to a factor of 20. Relatively inexpensive sensors use strain gauge technology. Top-of-the-rangesensors are c<strong>on</strong>structed using quartz crystals. For the latter, the temperature sensitivity of low-pressure sensors is around1 mm/°C. Instrumental drift of the same sensor is about 1 mm per year.Many pressure sensors produce a frequency-modulated output. This can be counted (integrated) by relatively simple electr<strong>on</strong>icsto produce the required <strong>measurement</strong>s. Resoluti<strong>on</strong> therefore depends <strong>on</strong> the integrati<strong>on</strong> period, which is typically15 or 6 minutes, but can be as short as 1 minute <strong>and</strong> still provide sufficient accuracy. Some manufacturers provide equipmentthat does not integrate over the full sampling interval, in order to c<strong>on</strong>serve battery power.Installati<strong>on</strong> These devices can be used virtually anywhere, even <strong>on</strong> shelving beaches. They are normally mounted in an outer protectivetube fastened to a <strong>sea</strong> wall but can be fixed directly <strong>on</strong> the <strong>sea</strong> bed <strong>and</strong> c<strong>on</strong>nected to the shore by armoured cable.RequirementsPressure sensors require very little power <strong>and</strong> can be run for periods of 1–2 years <strong>on</strong> n<strong>on</strong>-rechargeable batteries.Locati<strong>on</strong> Pressure sensors can be used at virtually any site, even in hostile envir<strong>on</strong>ments, such as the polar regi<strong>on</strong>s. Regi<strong>on</strong>s with largevariati<strong>on</strong>s in <strong>sea</strong>water density may cause significant errors.Calibrati<strong>on</strong> Calibrati<strong>on</strong>s traceable to Nati<strong>on</strong>al Physical Laboratory (UK) st<strong>and</strong>ards can be obtained from pressure sensor manufacturers<strong>and</strong> have been shown to remain stable over many years. However, drift in the datum value of a sensor may cause changesto its ‘zero’ value. Re-calibrati<strong>on</strong> at intervals may be necessary. Alternatively, the difficulty of establishing a datum can berectified by using alternative means (e.g. from annual tide pole <strong>measurement</strong>s). These have proved adequate, since thedrift is normally linear with time.(C<strong>on</strong>tinued <strong>on</strong> next page)24IOC <str<strong>on</strong>g>Manual</str<strong>on</strong>g>s <strong>and</strong> Guides No 14 vol IV
Sea Level Measurement <strong>and</strong> Interpretati<strong>on</strong>Accuracy Resoluti<strong>on</strong> of a low pressure sensor is typically better than 1 mm of <strong>sea</strong> <strong>level</strong>. However, instrumental drift may degradethis, so that the accuracy is approximately 1 cm of <strong>sea</strong> <strong>level</strong>.Cost Varies by a large factor depending <strong>on</strong> type. B<strong>and</strong> 1–2.Record of Use Used frequently as a temporary exploratory tide gauge. Extensively used at remote isl<strong>and</strong> sites <strong>and</strong> in hostile envir<strong>on</strong>ments,such as the Antarctic.CommentsDatum fixing is the major problem <strong>and</strong> other types of tide gauge are preferred for permanent installati<strong>on</strong>s.Multiple Pressure Transducer Systems (B Gauges)Equipment These instruments are used <strong>on</strong>ly by POL <strong>and</strong> were developed to produce a high precisi<strong>on</strong> tide gauge. They are c<strong>on</strong>structedin-house from commercially available comp<strong>on</strong>ents but cannot be obtained as a complete ready-to-go package. Theinstrument requires three high quality pressure transducers which results in a relatively expensive system. A less expensivec<strong>on</strong>structi<strong>on</strong> is presently being c<strong>on</strong>sidered.Operati<strong>on</strong> The instrument c<strong>on</strong>tains three pressure sensors which measure respectively a) atmospheric pressure b) Half-Tide pressure<strong>and</strong> c) Full-Tide pressure. All three sensors are positi<strong>on</strong>ed in the <strong>sea</strong> with a rigid tube to the appropriate measuring pointabove. Since the positi<strong>on</strong> of the top of the Half-Tide tube is known accurately this can be used to calibrate the datumof the Full-Tide pressure. Data is fed by an armored cable to a data logger <strong>and</strong> c<strong>on</strong>trol unity sited nearby. Most of thecomments relating to a single pressure sensor are applicable but drift in the pressure sensors is inc<strong>on</strong>sequential to itsoperati<strong>on</strong>al capability. Temperature compensati<strong>on</strong> of the pressure sensors is obtained from comp<strong>on</strong>ents integrated intothe pressure sensors.Installati<strong>on</strong> The instrument is pre-assembled <strong>and</strong> requires fixing to a vertical <strong>sea</strong> wall or marine structure.Requirements Mains power or batteries <strong>and</strong> solar panels.Locati<strong>on</strong> Requires a <strong>sea</strong> wall or vertical structure for installati<strong>on</strong>.Calibrati<strong>on</strong> Manufacturers calibrati<strong>on</strong>s of the pressure sensors are sufficiently accurate. The Half-Tide point should be <strong>level</strong>led to localbenchmarks.Accuracy Precisi<strong>on</strong> <strong>and</strong> accuracy of a few millimetres has been achieved.Cost B<strong>and</strong> 3.Record of Use Used in the United Kingdom <strong>and</strong> extensively at remote isl<strong>and</strong> sites in the Atlantic as well as in the Antarctic.Comments Extremely accurate system with automatic datum c<strong>on</strong>trol <strong>and</strong> as a by-product air pressure, air temperature <strong>and</strong> <strong>sea</strong>temperature are recorded.For operati<strong>on</strong>al reas<strong>on</strong>s the instrument will <strong>on</strong>ly work in a regi<strong>on</strong> where the tidal range is 1 metre or greater.IOC <str<strong>on</strong>g>Manual</str<strong>on</strong>g>s <strong>and</strong> Guides No 14 vol IV25
Sea Level Measurement <strong>and</strong> Interpretati<strong>on</strong>Pressure Transducers in Stilling WellsEquipment Pressure transducers are often placed in stilling wells, where these are available. This provides a protected <strong>and</strong> secureenvir<strong>on</strong>ment for the sensors <strong>and</strong> can augment <strong>measurement</strong>s made by a float gauge. The comments above <strong>on</strong> pressuresensors are equally valid for this type of installati<strong>on</strong>.Accuracy Approximately 1 cm of <strong>sea</strong> <strong>level</strong>. The absolute accuracy may be limited by the characteristics of the stilling well.Cost B<strong>and</strong> 2.Comments Problems associated with the use of stilling wells are well documented. (see Float Gauges).Bubbler Pressure GaugesEquipment Complete systems are available commercially, but c<strong>on</strong>siderable assembly work is required to c<strong>on</strong>struct an operati<strong>on</strong>al tidegauge. The equipment comprises an air supply (normally from a compressor), a gas c<strong>on</strong>trol system, a c<strong>on</strong>necting pipe, asub-<strong>sea</strong> pressure outlet, a pressure transducer at the l<strong>and</strong>ward end <strong>and</strong> the various data logging <strong>and</strong> support electr<strong>on</strong>ics.Operati<strong>on</strong> The instrument supplies air from the high pressure supply at a reduced pressure <strong>and</strong> at a c<strong>on</strong>stant rate through the system.The pressure required to bubble the air through the sub-<strong>sea</strong> outlet at this rate is a measure of the <strong>sea</strong> <strong>level</strong> above theoutlet. A differential pressure transducer vented to the atmosphere alleviates the need to measure atmospheric pressureseparately, thereby producing a pressure reading proporti<strong>on</strong>al to <strong>sea</strong> <strong>level</strong> height. The sub-<strong>sea</strong> outlet is open at the base,has a large surface area relative to its volume <strong>and</strong> has a small exit port approximately half way from the base. This designreduces the effect of wave acti<strong>on</strong> <strong>and</strong> provides a very stable datum.Installati<strong>on</strong> The outlet <strong>and</strong> part of the c<strong>on</strong>necting tube are the <strong>on</strong>ly comp<strong>on</strong>ents in the <strong>sea</strong>. Such a c<strong>on</strong>figurati<strong>on</strong> increases the reliabilityof the system <strong>and</strong> makes replacement relatively simple. All other comp<strong>on</strong>ents of the system are housed nearby.RequirementsThe system requires external power for c<strong>on</strong>tinuous operati<strong>on</strong>, <strong>and</strong> backup operati<strong>on</strong> is relatively limited, owing to thelimited air supply.Locati<strong>on</strong> Bubbler systems can be used at virtually any locati<strong>on</strong>, even <strong>on</strong> shelving beaches. C<strong>on</strong>necting tubes can be several hundredmetres in length. As with most pressure measuring systems, regi<strong>on</strong>s with large variati<strong>on</strong>s in <strong>sea</strong>water density may cause significanterrors.Calibrati<strong>on</strong> Calibrati<strong>on</strong> is c<strong>on</strong>cerned with the pressure sensor accuracy <strong>and</strong> may need to be repeated at intervals. Calibrati<strong>on</strong>s suppliedby leading pressure transducer manufacturers are acceptable provided occasi<strong>on</strong>al means of fixing the datum valueare used.Accuracy In general, an average accuracy of 1 cm of <strong>sea</strong> <strong>level</strong> is achievable, but this may degrade under large-wave c<strong>on</strong>diti<strong>on</strong>s.Cost B<strong>and</strong> 2.Record of Use Used extensively in the United States <strong>and</strong> the United Kingdom for their nati<strong>on</strong>al tide gauge networks.CommentsAt a few locati<strong>on</strong>s, a sec<strong>on</strong>dary bubbler system has been installed at the mid-tide <strong>level</strong> as part of the United Kingdomnetwork. This can be used to fix the datum of <strong>measurement</strong>s in the same fashi<strong>on</strong> as the ‘B’ gauges discussed above.26IOC <str<strong>on</strong>g>Manual</str<strong>on</strong>g>s <strong>and</strong> Guides No 14 vol IV
Sea Level Measurement <strong>and</strong> Interpretati<strong>on</strong>Float GaugesEquipment A float in a stilling well is the tried <strong>and</strong> tested method of measuring <strong>sea</strong> <strong>level</strong> directly, rather than through an indirectparameter such as pressure or sound.Operati<strong>on</strong> A stilling well filters out wave activity at periods shorter than the maximum tidal period, which might be 2 hours in shallowwater regi<strong>on</strong>s. In modern installati<strong>on</strong>s the float drives a shaft encoder or potentiometer the output of which is fed toan electr<strong>on</strong>ic data logger. In the past, chart recorders were extensively used, but are no l<strong>on</strong>ger acceptable as the principaldata-recording method, as they c<strong>on</strong>tain many sources of inaccuracy <strong>and</strong> require labour-intensive digitizati<strong>on</strong>.Installati<strong>on</strong> Stilling well installati<strong>on</strong>s require heavy civil engineering work in areas of large tidal range. Many stilling wells exist throughoutthe world, as they are of robust c<strong>on</strong>structi<strong>on</strong>, but new installati<strong>on</strong>s are less comm<strong>on</strong>, owing to the engineering cost.RequirementsA suitable building is required above the well to protect the well <strong>and</strong> its associated measuring equipment.Locati<strong>on</strong> Requires a <strong>sea</strong> wall or vertical structure for installati<strong>on</strong>.Calibrati<strong>on</strong> Stilling wells can suffer from several defects which have been well documented. For example, density variati<strong>on</strong>s betweenthe inside <strong>and</strong> outside of the well in regi<strong>on</strong>s of stratificati<strong>on</strong> cause errors. Siltati<strong>on</strong> <strong>and</strong> marine growth can cause changesto the dynamic resp<strong>on</strong>se of the well. Absolute calibrati<strong>on</strong> usually involves dipping the well with a calibrated tape at periodicintervals.Accuracy Approximately 1 cm of <strong>sea</strong> <strong>level</strong>.Cost B<strong>and</strong> 1–2.Record of Use Used extensively in the United States <strong>and</strong> the United Kingdom for their nati<strong>on</strong>al tide gauge networks.CommentsStilling wells have been used worldwide for a c<strong>on</strong>siderable period <strong>and</strong> are still used, both as the primary system <strong>and</strong> asbackup system for a modern tide gauge.Radar GaugesEquipmentOperati<strong>on</strong>Installati<strong>on</strong>RequirementsLocati<strong>on</strong>Radar tide gauges have so far been little used for GLOSS purposes, because it is a very recent technology. However, theyoffer a complete ready-to-go package which is relatively easy to install above the <strong>sea</strong> surface <strong>and</strong> seem to have advantageswith respect the acoustic sensors.Radar gauges measure the time of flight either from a pulsed radar or the phase change between a transmitted <strong>and</strong>received carrier wave, to determine the distance to the <strong>sea</strong> surface. They are much less affected by air temperature thanacoustic gauges.The installati<strong>on</strong> requirements are relatively simple. The device requires a rigid structure to positi<strong>on</strong> it above the <strong>sea</strong> withsufficient clearance to avoid spurious reflecti<strong>on</strong>s from any adjacent structures. As with many tide gauges, all ancillaryequipment (data logger, modem, satellite communicati<strong>on</strong>s, battery backup), needs to be housed in an adjacent building.No need of a protective tube.Requires a site with vertical clearance sufficient to mount the device clear of the maximum <strong>sea</strong> surface, including wave acti<strong>on</strong>.Calibrati<strong>on</strong>In essence the device is self calibrating. However, for GLOSS purposes, a reflective target is mounted at a known distancebelow the radar transmitter.Accuracy Accuracy is expected to be approximately 1 cm of <strong>sea</strong> <strong>level</strong>.Cost B<strong>and</strong> 2–3.Record of Use So far these gauges have been used for relatively short periods experimentally by Spain <strong>and</strong> the United Kingdom.CommentsRadar tide gauges may c<strong>on</strong>sume excessive power if used in a c<strong>on</strong>tinuous mode. In burst mode, they provide sufficientaccuracy for measuring most tidal parameters, but their use in a rapid sampling mode may be limited by this, althoughtests are being made in Spain for higher-frequency sampling.IOC <str<strong>on</strong>g>Manual</str<strong>on</strong>g>s <strong>and</strong> Guides No 14 vol IV27
Sea Level Measurement <strong>and</strong> Interpretati<strong>on</strong>4. Datum C<strong>on</strong>trol <strong>and</strong> LevellingIt should be clear that the <strong>measurement</strong>s made by atide gauge provide the relative movement of the <strong>sea</strong><strong>level</strong> with respect to the l<strong>and</strong>. Of course, neither l<strong>and</strong>nor <strong>sea</strong> <strong>level</strong>s are c<strong>on</strong>stant over l<strong>on</strong>g periods of time.There are vertical movements of the l<strong>and</strong> associatedwith a range of natural processes, such as co-seismicactivity (earthquakes), in additi<strong>on</strong> to glacial isostaticadjustment (post-glacial rebound) <strong>and</strong> plate tect<strong>on</strong>ics<strong>and</strong> with a range of human activities (e.g. groundwater pumping). For a review of the geological signalsin tide gauge records, see Emery <strong>and</strong> Aubrey (1991).L<strong>on</strong>g-term changes in <strong>sea</strong> <strong>level</strong> relate to variati<strong>on</strong>s inocean currents, to changes in the volume of water inthe oceans <strong>and</strong> therefore to climate change. It is clearthat, to underst<strong>and</strong> <strong>sea</strong> <strong>level</strong> changes properly, the different<strong>sea</strong> <strong>level</strong> <strong>and</strong> l<strong>and</strong> signals have to be decoupled.This is achieved by careful definiti<strong>on</strong> of the tide gaugedatums, by local <strong>level</strong>ling procedures, <strong>and</strong> by makingindependent <strong>measurement</strong>s of changes in the l<strong>and</strong><strong>level</strong>s, using modern geodetic techniques. Such techniquesderive from the use of very high resoluti<strong>on</strong> GPSreceivers <strong>and</strong> absolute gravimeters.4.1 Datums <strong>and</strong> BenchmarksFor <strong>sea</strong> <strong>level</strong> observati<strong>on</strong>s, a l<strong>and</strong> benchmark is usedas the primary reference point. The benchmark is aclearly marked point located <strong>on</strong> a stable surface, suchas exposed rock, a quay wall or a substantial building.When a benchmark is <strong>on</strong> a horiz<strong>on</strong>tal surface, it normallytakes the form of a round-headed brass bolt, thehighest point of the domed head being the reference<strong>level</strong> (Figure 4.1). When <strong>on</strong> a vertical surface, it canbe in the form of a horiz<strong>on</strong>tal groove in the surfaceor <strong>on</strong> a metal frame attached to the surface, having ahoriz<strong>on</strong>tal reference edge to which a measuring staffsupport can be fixed.Figure 4.1 A brass boltbenchmark at Newlyn, UK,which functi<strong>on</strong>s as a referencepoint for height <strong>measurement</strong>sin the UK <strong>and</strong> as theTGBM of the Newlyn gauge.It is poor practice to depend up<strong>on</strong> the stability of asingle benchmark. It is recommended that there be aminimum of five within a few hundred metres, or atmost <strong>on</strong>e kilometres, of the tide gauge. These shouldbe c<strong>on</strong>nected individually by high-precisi<strong>on</strong> <strong>level</strong>ling<strong>and</strong> shown to maintain the same relative elevati<strong>on</strong>as time progresses. If no changes are observed overl<strong>on</strong>g periods, it is safe to assume that the area of l<strong>and</strong>around the gauge is ‘stable’. The area could, of course,exhibit vertical movement with respect to a much widerarea. This can be dem<strong>on</strong>strated by wide-area <strong>level</strong>lingor from surveys using space geodetic techniques.It is desirable, although not essential, that all benchmarksbe tied into a country’s nati<strong>on</strong>al <strong>level</strong>ling network, <strong>and</strong>periodically checked with respect to that network. Thebenchmarks will then be given elevati<strong>on</strong>s referred tothe datum of the nati<strong>on</strong>al network. However, nati<strong>on</strong>al<strong>level</strong>ling networks tend to be redefined at intervals. Forthat reas<strong>on</strong>, in <strong>sea</strong> <strong>level</strong> studies, it is best not to rely <strong>on</strong>nati<strong>on</strong>al <strong>level</strong>ling for any scientific purpose, although,28IOC <str<strong>on</strong>g>Manual</str<strong>on</strong>g>s <strong>and</strong> Guides No 14 vol IV
Sea Level Measurement <strong>and</strong> Interpretati<strong>on</strong>of course, it may provide useful ancillary informati<strong>on</strong>. Itis important that the benchmarks be clearly identified,by the inscripti<strong>on</strong> of a name or number. In additi<strong>on</strong>,they should be unambiguously documented in the tidegauge metadata, with a descripti<strong>on</strong> of the mark itself,photographs, nati<strong>on</strong>al grid reference <strong>and</strong> a local map.4.1.1 Tide Gauge Benchmark (TGBM)The tide gauge benchmark (TGBM) is chosen asthe main bench mark for the gauge from the set ofapproximately five marks described above. The TGBMis extremely important, since it serves as the datum towhich the values of <strong>sea</strong> <strong>level</strong> are referred. The choiceof TGBM is somewhat subjective; in principle, it shouldbe the ‘most stable’ or ‘most secure’ mark of the set,although, if the area is largely stable, then the choiceshould be fairly arbitrary. Often the nearest mark to thegauge is chosen. Over a period of time it may be necessaryto redefine the TGBM, if the original is destroyedas a result of local development. The benefit of havinga set of five local marks, regularly interc<strong>on</strong>nected byhigh-precisi<strong>on</strong> <strong>level</strong>ling, is that it allows a new TGBMto be defined in terms of the old <strong>on</strong>e, if circumstancesrequire it.In some countries the historical practice has beennot to define <strong>on</strong>e mark as the TGBM, but to use aweighted average of several marks. For GLOSS, it isrecommended that the single, unique TGBM approachbe adopted as the st<strong>and</strong>ard.4.1.2 GPS Benchmark (GPSBM)The GPS benchmark (GPSBM) is another special markof the available set that is the reference mark for GPS<strong>measurement</strong>s near the gauge. In some busy ports, theGPSBM may be several hundred metres from the TGBM<strong>and</strong> the gauge. As with the other marks, it must bec<strong>on</strong>nected by high-precisi<strong>on</strong> <strong>level</strong>ling to the TGBM atregular intervals. (See secti<strong>on</strong> 4.4.1 for details <strong>on</strong> GPS<strong>measurement</strong>s at tide gauges).4.1.3 Gauge C<strong>on</strong>tact Point (CP)The c<strong>on</strong>tact point (CP) of a tide gauge is a type of‘benchmark’, or vertical reference mark, associatedwith the gauge itself. After a geodetic c<strong>on</strong>necti<strong>on</strong> hasbeen made between the TGBM <strong>and</strong> the CP, the gauge’s<strong>sea</strong> <strong>level</strong> data can be expressed in terms of the TGBMdatum. The essential point to note is that the CP comeswith the gauge; if a different type of gauge is installedat the site, it will have a different CP which will requirere-<strong>level</strong>ling to the TGBM.For c<strong>on</strong>venti<strong>on</strong>al float <strong>and</strong> stilling well gauges, theCP is often located at the top of the well inside thetide gauge hut. Sometimes, in older stati<strong>on</strong>s, the CPis located in a most difficult <strong>and</strong> inaccessible locati<strong>on</strong>for <strong>level</strong>ling purposes <strong>and</strong> new stati<strong>on</strong>s should takecare to provide ready access. For acoustic gauges withsounding tubes, the CP is located at a point at the topof the gauge <strong>on</strong> the c<strong>on</strong>tainer holding the acoustictransducer. Similarly, for radar gauges, the CP will bea mark <strong>on</strong> the transducer. For ‘B’ gauges, the CP willbe at the top of the vertical supporting tube which isknown relative to the ‘B’ datum <strong>level</strong>.In the case of float gauges located in a tide gauge hut,the CP should not be used as the TGBM itself, as it isalways possible for the building <strong>and</strong> the well to graduallysettle over a l<strong>on</strong>g period. With a good set of localbenchmarks, this settling will be evident by check <strong>level</strong>lingbetween TGBM <strong>and</strong> CP.4.1.4 Tide Gauge Zero (TGZ)The tide gauge zero (TGZ) is the <strong>level</strong> for which thegauge would record zero <strong>sea</strong> <strong>level</strong>. In practice, the <strong>sea</strong><strong>level</strong> may not fall to this <strong>level</strong>. In a c<strong>on</strong>venti<strong>on</strong>al floatgauge arrangement, the TGZ can be related to the CPafter dipping checks in the well have been performed.This is d<strong>on</strong>e using a calibrated tape set to zero at theCP. Measurements are made by lowering the tape untilit reaches the water <strong>and</strong> an electrical circuit is completed.The <strong>level</strong> of <strong>sea</strong> water in the well can then berelated to the CP <strong>and</strong> to all other local datums.4.1.5 Revised Local Reference (RLR) DatumThe revised local reference (RLR) datum at a gauge siteis a datum defined as a simple offset from the TGBM,such that values of <strong>sea</strong> <strong>level</strong> expressed relative to the RLRdatum have numerical values around 7,000 mm. Thec<strong>on</strong>cept of the RLR datum was invented by the PSMSLso that l<strong>on</strong>g time-series of <strong>sea</strong> <strong>level</strong> change at a sitecould be c<strong>on</strong>structed, even if parts of the time-series hadbeen collected using different gauges <strong>and</strong> different, butgeodetically c<strong>on</strong>nected, TGBMs. The approximate valueof 7,000 mm was chosen so that the computers of thetime (the late 1960s) would not have to store negativenumbers. The RLR datum is defined for each gauge siteseparately <strong>and</strong> the RLR at <strong>on</strong>e site cannot be related tothe RLR at any other site, without additi<strong>on</strong>al knowledgeof c<strong>on</strong>necti<strong>on</strong>s between TGBMs at the different sites.When <strong>sea</strong> <strong>level</strong> data are c<strong>on</strong>tributed to the PSMSL, orto a <strong>sea</strong> <strong>level</strong> centre, it is essential that full informati<strong>on</strong><strong>on</strong> the geodetic relati<strong>on</strong>ships between TGBM <strong>and</strong> TGZetc. accompany the data. Without this informati<strong>on</strong>, itis impossible for the PSMSL to include such data in theRLR data set.4.1.6 Nati<strong>on</strong>al Levelling NetworkMost countries have, during the last <strong>on</strong>e hundredyears, implemented nati<strong>on</strong>al <strong>level</strong>ling networks that aredefined usually in terms of mean <strong>sea</strong> <strong>level</strong> (MSL) at <strong>on</strong>eIOC <str<strong>on</strong>g>Manual</str<strong>on</strong>g>s <strong>and</strong> Guides No 14 vol IV29
Sea Level Measurement <strong>and</strong> Interpretati<strong>on</strong>or more stati<strong>on</strong>s. Levelling c<strong>on</strong>necti<strong>on</strong>s within thesenetworks then allow the heights of objects (e.g. mountains)to be related to MSL at the coast. For example,the UK nati<strong>on</strong>al <strong>level</strong>ling network expresses heights interms of ‘Ordnance Datum Newlyn’ (ODN), which wasthe average <strong>level</strong> of the <strong>sea</strong> at Newlyn in southwestEngl<strong>and</strong> during 1915–21. ODN can be thought of as animaginary datum plane extending over a large area (i.e.over the whole of Great Britain). The heights of benchmarks, for example, can be expressed in terms of ODNas can, therefore, the Chart Datum at the port.The c<strong>on</strong>cept of a nati<strong>on</strong>al <strong>level</strong>ling network has underg<strong>on</strong>erevoluti<strong>on</strong>ary change during the last decade, primarilydue to the advent of GPS. However, it was alreadya defective c<strong>on</strong>cept from the point of view of <strong>sea</strong> <strong>level</strong>studies, for several reas<strong>on</strong>s. First, <strong>sea</strong> <strong>level</strong> has risen atNewlyn since 1915, as it has d<strong>on</strong>e at many other placesaround the world, so ODN no l<strong>on</strong>ger represents thepresent average Newlyn <strong>level</strong>s. Sec<strong>on</strong>d, the mean <strong>sea</strong>surface around a coast is not ‘flat’, i.e. it does not followthe geoid, but varies due to ocean currents, density differences,meteorological effects etc. C<strong>on</strong>sequently, MSLwas never a perfect choice for a nati<strong>on</strong>al datum plane.Third, rates of change of MSL are different at differentlocati<strong>on</strong>s, thereby complicating the time-dependenceof the network. Fourth, all nati<strong>on</strong>al <strong>level</strong>ling networks(with the possible excepti<strong>on</strong> of that of The Netherl<strong>and</strong>s,Finl<strong>and</strong> <strong>and</strong> Sweden) c<strong>on</strong>tain multi-decimetric errors dueto systematic, instrumental errors in the <strong>level</strong>ling. Fifth,as <strong>level</strong>ling networks tended to be redefined at intervals,their redefiniti<strong>on</strong> in itself was a potential source of error,as ‘heights’ were redefined.C<strong>on</strong>sequently, while interacti<strong>on</strong> between <strong>sea</strong> <strong>level</strong> specialists<strong>and</strong> nati<strong>on</strong>al surveyors is inevitable, we advisemost <strong>sea</strong> <strong>level</strong> specialists to take great care with thec<strong>on</strong>cept of a nati<strong>on</strong>al <strong>level</strong>ling system.4.1.7 Chart DatumThe chart datum (or Admiralty Chart Datum in the UK)is the low-water plane below which the depths <strong>on</strong> anautical chart are measured <strong>and</strong> above which, tidal <strong>level</strong>sare often presented for practical purposes, such astide tables for harbour operati<strong>on</strong>s. The chart datum isa horiz<strong>on</strong>tal plane over a limited area <strong>and</strong> the elevati<strong>on</strong>of this plane will vary around the coastline, depending<strong>on</strong> the tidal ranges at the places c<strong>on</strong>sidered. In theUK, the chart datum at a port is the same as ‘LowestAstr<strong>on</strong>omical Tide’ (Pugh, 1987).4.1.8 Working DatumsPractical working datums are often used in portswhere they describe <strong>sea</strong> <strong>level</strong> (or water depth) moreclearly than perhaps a scientifically rigorous referenceto a benchmark. Examples of such datums includethe <strong>level</strong>s of the sill of a lock or a shallow point in theentrance to a harbour. The <strong>sea</strong> <strong>level</strong> from a tide gaugethen indicates the depth of water above these hazards.Working datums often functi<strong>on</strong>ed as the first TGBMsfor Europe’s <strong>sea</strong> <strong>level</strong> records (e.g. the ‘Old Dock Sill’datum at Liverpool).4.2 Levelling Between LocalBenchmarksHigh-precisi<strong>on</strong> <strong>level</strong>ling will need to be made betweenall the marks of the local network at regular intervals.For GLOSS purposes, the recommendati<strong>on</strong> is that theexercise be repeated at least annually, with results fullydocumented by the resp<strong>on</strong>sible agency. The exact frequencyof required <strong>level</strong>ling will depend <strong>on</strong> the geologyof the area. On unstable ground, more frequent <strong>level</strong>lingmay be necessary.Pers<strong>on</strong>nel familiar with the best practices of the techniqueshould perform <strong>level</strong>ling with a good-quality <strong>level</strong><strong>and</strong> staff. For example, if marks are far apart, it will benecessary to establish ‘staging points’ clearly identified<strong>and</strong> about 50 m apart <strong>on</strong> a hard surface. This can bed<strong>on</strong>e by painting a small ring around the point <strong>and</strong>,<strong>on</strong> softer surfaces, by driving in a round-headed pin.The <strong>level</strong>ling instrument can then be set up between abenchmark <strong>and</strong> the first staging point <strong>and</strong> readings ofthe staff taken at the two positi<strong>on</strong>s. This is then repeatedthroughout the whole network. It is important thatthe pairs of readings be taken in the correct sequence,otherwise an err<strong>on</strong>eous height difference will result.Modern <strong>level</strong>ling instruments with built-in data loggerscan remove most of the tedious arithmetic associatedwith the use of a simple <strong>level</strong>.As with many other aspects of tide gauge operati<strong>on</strong>s,the main principle of <strong>level</strong>ling is that ‘practice makesperfect’. For advice <strong>on</strong> good <strong>level</strong>ling methods, thePSMSL website (www.pol.ac.uk/psmsl) c<strong>on</strong>tains a set ofnotes used by Prof. Charles Merry at the University ofCape Town GLOSS Training Course in 1998.4.3 Levelling Between Wider AreaMarksThe height of the TGBM should also be related to awider area network extending typically 10 km. Thisprovides a verificati<strong>on</strong> of whether the <strong>sea</strong> <strong>level</strong> measuredrelative to the TGBM is c<strong>on</strong>sistent with that ofthe surrounding area.First-order geodetic <strong>level</strong>ling is accurate to 1 or 2 mmover distances of a few kilometres <strong>and</strong>, therefore,annual campaigns can detect any vertical movementsof the TGBM with respect to the local benchmarks.30IOC <str<strong>on</strong>g>Manual</str<strong>on</strong>g>s <strong>and</strong> Guides No 14 vol IV
Sea Level Measurement <strong>and</strong> Interpretati<strong>on</strong>Levelling over l<strong>on</strong>ger distances has been found to c<strong>on</strong>tainsignificant systematic errors that can cause apparentspurious changes in the height of the TGBM. Forthis reas<strong>on</strong> the PSMSL requires MSL data to be definedwith respect to the TGBM rather than with respect t<strong>on</strong>ati<strong>on</strong>al datum <strong>level</strong>s.C<strong>on</strong>sequently, while it is desirable in principle to performregular wide area <strong>level</strong>ling, their accuracy hasalways to be c<strong>on</strong>sidered, especially as the areas c<strong>on</strong>sideredbecome wider. At a distance of some 10 km, theerrors involved in <strong>level</strong>ling become comparable to tho<strong>sea</strong>chievable by means of space geodetic techniques.Therefore, while the choice of technology for the widerarea surveys is clearly evolving, the principle that therelative <strong>sea</strong> <strong>level</strong> <strong>measurement</strong>s provided by the gaugedata are applicable to studies for the surroundingarea is still valid. Table 4.1 summarizes the accuracyobtained by the different techniques.Table 4.1 Accuracy of geodetic fixing of TGBMs.TechniqueAccuracy4.4 Geodetic Fixing of Tide GaugeBenchmarks4.4.1 Introducti<strong>on</strong>Over the past decade, advances in modern geodetictechniques have provided new methods for fixing tidegauge bench marks. These are the techniques of spacegeodesy, using the satellites of the Global Positi<strong>on</strong>ingSystem (GPS) <strong>and</strong> those of the Doppler Orbitography <strong>and</strong>Radiopositi<strong>on</strong>ing Integrated by Satellite (DORIS) system.Absolute gravity <strong>measurement</strong>s provide collateral evidenceof vertical crustal movements. The space geodesy<strong>measurement</strong>s can be used to fix into a geocentric referenceframe the GPSBM, which should be c<strong>on</strong>nected tothe TGBM by <strong>level</strong>ling. Therefore, the MSL at the tidegauge can be defined in a global geocentric referenceframe. This furnishes an absolute measure of mean <strong>sea</strong><strong>level</strong>, rather than MSL relative to each local TGBM, oreven to the wider surrounding area. Measurements of <strong>sea</strong><strong>level</strong> are then defined in the same geocentric referenceframe as that used for satellite altimetry <strong>and</strong> can thereforebe directly compared with altimetric <strong>sea</strong> <strong>level</strong>s.Primary Levelling of LocalBenchmarksGPS from TGBM to SLR/VLBIReference FrameAbsolute Gravity near TideGauges <strong>and</strong> at SLR/VLBIStati<strong>on</strong>0–1 km:
Sea Level Measurement <strong>and</strong> Interpretati<strong>on</strong>An internati<strong>on</strong>al working group was set up in the late1980s by the Internati<strong>on</strong>al Associati<strong>on</strong> for the PhysicalSciences of the Ocean, under its Commissi<strong>on</strong> <strong>on</strong> MeanSea Level <strong>and</strong> Tides, to recommend a strategy for thegeodetic fixing of tide gauge bench marks. Theseresulted in the ‘Carter reports’ (Carter et al., 1989;Carter, 1994). The following secti<strong>on</strong>s provide a summary<strong>and</strong> describe recent developments. The reader isreferred to Neilan et al. (1998) <strong>and</strong> Bevis et al. (2002)for further details.a4.4.2 GPS MeasurementsOver the past decade, the GPS technique has developedrapidly to the extent that it is of fundamentalimportance to many areas of geophysical re<strong>sea</strong>rch (seelinks documented <strong>on</strong> the PSMSL training web page).The Internati<strong>on</strong>al GNSS Service (IGS) receives datafrom a global network of GPS stati<strong>on</strong>s <strong>and</strong> producesinformati<strong>on</strong> <strong>on</strong> the orbits of the GPS satellites whichis significantly more precise than the ephemeridesroutinely transmitted by the satellites themselves. Thisinformati<strong>on</strong> is employed by re<strong>sea</strong>rchers to produce precisepositi<strong>on</strong>ing computati<strong>on</strong>s. GPS data from the IGSnetwork are archived at the IGS Central Bureau.bIdeally, all tide gauge sites should be equipped witha permanent c<strong>on</strong>tinuous receiver (CGPS). However,in practice, the financial resources required are oftenlarge. Many countries adopt the procedure of installingpermanent GPS receivers at strategic tide gauges<strong>and</strong> then densifying the network with regular GPScampaign <strong>measurement</strong>s (Neilan et al., 1998). Thereis clearly an advantage in c<strong>on</strong>centrating CGPS workat sites with l<strong>on</strong>g durati<strong>on</strong> PSMSL RLR mean <strong>sea</strong> <strong>level</strong>records. The GLOSS Implementati<strong>on</strong> Plan refers to thisset as the GLOSS L<strong>on</strong>g-Term Trends (GLOSS-LTT) network.The campaigns can then c<strong>on</strong>centrate <strong>on</strong> othertide gauges in the network for which the records areshorter. The exact mix between permanent <strong>and</strong> campaignGPS tide gauges will change as the cost of GPSreceivers c<strong>on</strong>tinues to decrease.For studies involving <strong>sea</strong> <strong>level</strong>, it is recommended thata dual-frequency CGPS receiver should be installeddirectly at the tide gauge so that it m<strong>on</strong>itors anymovement of the TGBM. If the receiver is placedexactly at the TGBM, then the GPSBM <strong>and</strong> theTGBM will coincide, eliminating the need for <strong>level</strong>lingbetween the two benchmarks. The TGBM is then thefundamental point that is geocentrically located bythe GPS <strong>measurement</strong>s <strong>and</strong> to which all the <strong>sea</strong> <strong>level</strong><strong>measurement</strong>s are related. In practice, tide gauge sitesare not always ideal for making GPS <strong>measurement</strong>s.This may be due to obscured sky visibility, excessivemultipath transmissi<strong>on</strong>s or because of radio interference,in which case a site should be chosen that is asclose as possible to the tide gauge. Ideally, this shouldbe within a few hundred metres.Figure 4.3 Alternative forms of GPS mounting(a) a Norwegian tide gauge with GPS antenna mounted<strong>on</strong> an adjacent platform;(b) GPS antenna <strong>on</strong> a pillar, as recommended by theCGPS@TG group (http://soest.hawaii.edu/cgps_tg).32IOC <str<strong>on</strong>g>Manual</str<strong>on</strong>g>s <strong>and</strong> Guides No 14 vol IV
Sea Level Measurement <strong>and</strong> Interpretati<strong>on</strong>The GPSBM <strong>and</strong> GPS antenna need to be <strong>level</strong>led to theTGBM at least annually. Experience has shown that theseregular <strong>level</strong>ling c<strong>on</strong>necti<strong>on</strong>s are often neglected overthe years. This is particularly true if the distance involvedis more than a few hundred metres <strong>and</strong> it can never beassumed that even relatively close sites are not moving differentiallyat a rate of around 1 mm per year.Whilst the detailed procedures for making GPS <strong>measurement</strong>sat tide gauges are still the subject of re<strong>sea</strong>rch,<strong>and</strong> are still being discussed by the IGS/PSMSL TechnicalCommittee, there is already a general agreement <strong>on</strong>the main principles. Using GPS for measuring horiz<strong>on</strong>talcrustal movements is now well established. However,for the vertical comp<strong>on</strong>ent, measuring l<strong>and</strong> movementsto better than l mm per year is still a major challenge.Re<strong>sea</strong>rch is c<strong>on</strong>tinuing <strong>on</strong> modelling the wet comp<strong>on</strong>entof the troposphere, modelling the deformati<strong>on</strong> of theEarth due to surface loading by ocean tides, coastal <strong>and</strong>global <strong>sea</strong> <strong>level</strong>s, atmospheric variati<strong>on</strong>s <strong>and</strong> hydrologicalloading. A major re<strong>sea</strong>rch challenge lies in realizing <strong>and</strong>maintaining a global reference frame that is sufficientlystable for measuring vertical movements to an accuracy ofa few tenths of a millimetre per year (Teferle et al., 2006;Ge et al., 2005).In some countries, a sec<strong>on</strong>d CGPS receiver is beinginstalled a few kilometres inl<strong>and</strong> at a site which hasa good multipath envir<strong>on</strong>ment <strong>and</strong> a better c<strong>on</strong>necti<strong>on</strong>to bedrock. While such a site might be better fortesting geophysical models of vertical crustal movements,it cannot be c<strong>on</strong>sidered to be a substitute forthe CGPS receiver at the tide gauge. The difficulty <strong>and</strong>cost of <strong>level</strong>ling over distances of a few kilometres aresignificant.Many of the practical issues involved with installing CGPSat tide gauges are reviewed in the case studies <strong>on</strong> the website http://soest.hawaii.edu/cgps_tg <strong>and</strong> also in the associatedpaper by Bevis et al. (2002).4.4.3 DORIS MeasurementsDORIS is a French tracking system based <strong>on</strong> a spacesegment placed <strong>on</strong> an orbiting satellite <strong>and</strong> a networkof ground stati<strong>on</strong>s distributed worldwide. Initially it wasc<strong>on</strong>ceived to improve our knowledge of satellite orbits, but<strong>on</strong>ce these were determined to a sufficient accuracy, thesystem could be used to locate the geocentric positi<strong>on</strong> ofthe receiving antenna at each ground stati<strong>on</strong>.DORIS is a <strong>on</strong>e-way Doppler uplink system in which theground stati<strong>on</strong>s broadcast c<strong>on</strong>tinuously <strong>on</strong> two frequencies,2 GHz <strong>and</strong> 400 MHz, in order to correct Doppler<strong>measurement</strong>s for i<strong>on</strong>ospheric delay. Each beac<strong>on</strong> includesan ultra-stable oscillator <strong>and</strong> meteorological sensors tocorrect the data for tropospheric delay. The space segmentis made up of the set of satellites carrying the DORIS<strong>on</strong>board receiver. Six DORIS receivers are currently working<strong>on</strong>board the TOPEX–Poseid<strong>on</strong>, Jas<strong>on</strong>, Envisat <strong>and</strong> theEarth observati<strong>on</strong> satellites Spot-2, Spot-4 <strong>and</strong> Spot-5.The DORIS technique has proved to be capable of m<strong>on</strong>itoringvertical l<strong>and</strong> movements with the following precisi<strong>on</strong>.In the early 1990s, when <strong>on</strong>ly <strong>on</strong>e satellite was inorbit, the precisi<strong>on</strong> of absolute positi<strong>on</strong>ing was about 4cm. This precisi<strong>on</strong> was regularly improved as new satelliteswere launched, <strong>and</strong> reached around 1.5 cm accuracy. Thesix satellites now in orbit provide sub-centimetre precisi<strong>on</strong>in absolute positi<strong>on</strong>ing, <strong>and</strong> vertical l<strong>and</strong> velocities with aprecisi<strong>on</strong> of 1 mm per year.The current network of DORIS ground stati<strong>on</strong>s offersa homogeneous distributi<strong>on</strong> over the c<strong>on</strong>tinents <strong>and</strong>oceans, with about 60 beac<strong>on</strong>s deployed in some 30countries. It is planned to increase this distributi<strong>on</strong> throughthe framework of the Internati<strong>on</strong>al DORIS Service. SomeDORIS ground stati<strong>on</strong>s have been co-located at stati<strong>on</strong>spossessing other geodetic instrumentati<strong>on</strong>. For example:7 at Satellite Laser Ranging sites; 28 at GPS sites; 9 at VLBIsites; <strong>and</strong> 14 at tide gauges.4.4.4 Absolute Gravity MeasurementsThe principle of the absolute gravimeter is the <strong>measurement</strong>of the accelerati<strong>on</strong> of a mass in free fall (or ri<strong>sea</strong>nd fall) in a vacuum using a laser length st<strong>and</strong>ard <strong>and</strong>a rubidium-frequency time st<strong>and</strong>ard. The mass used inthe gravimeter is a retro-reflector that forms <strong>on</strong>e end ofa laser interferometer. By counting interference fringes asthe mass falls, the positi<strong>on</strong> of the mass is measured <strong>and</strong>determined as a functi<strong>on</strong> of time. C<strong>on</strong>siderable effort hasbeen put into reducing or eliminating various sources ofsystematic error in the instrument. The latest transportableabsolute gravimeter is the FG5 instrument (Niebauer et al.1995). The specificati<strong>on</strong>s for this instrument are a precisi<strong>on</strong>of better than 1 mgal <strong>and</strong> an accuracy of 2 µgal (N.B.1 gal = 1 cm/sec 2 , so 1 µgal = 10 nm/sec 2 . A microgal(mgal) corresp<strong>on</strong>ds roughly to 5 mm of crustal movement).For further details of the absolute gravimeter <strong>and</strong> abibliography of published papers see the Micro-g website(http://www.microgsoluti<strong>on</strong>s.com/).The gravity value at a site is found by making repeateddrops of the test mass for typically <strong>on</strong>e or two days<strong>and</strong> making correcti<strong>on</strong>s for the gravitati<strong>on</strong>al variati<strong>on</strong>scaused by tides, earth tides <strong>and</strong> atmospheric pressure.Various intercomparis<strong>on</strong> experiments have been madebetween different FG5 absolute gravimeters; typicallythey agree at the 1–2 µgal <strong>level</strong> (Sasagawa et al., 1995).At good sites, <strong>measurement</strong>s made over a number ofyears show repeatability of about 2 µgal.In free air the gravity gradient at the Earth’s surface, is3 mgal/cm. In practice, for crustal deformati<strong>on</strong> work,since a large area of the Earth’s surface is usually displacedsimultaneously, the measured gravity change isabout 2 µgal/cm. Thus, it can be seen that absoluteIOC <str<strong>on</strong>g>Manual</str<strong>on</strong>g>s <strong>and</strong> Guides No 14 vol IV33
Sea Level Measurement <strong>and</strong> Interpretati<strong>on</strong>gravity <strong>and</strong> GPS are both approaching the equivalentaccuracy of 1 cm that is required for measuring verticalcrustal movements.Absolute gravity <strong>measurement</strong>s are normally made in ac<strong>on</strong>venient building that provides reas<strong>on</strong>able temperaturec<strong>on</strong>trol. This site then needs to be c<strong>on</strong>nected to theTGBM <strong>and</strong> the local benchmarks using high precisi<strong>on</strong><strong>level</strong>ling. Correcti<strong>on</strong>s for ocean tide loading <strong>and</strong> attracti<strong>on</strong>are particularly important at or near coastal sites, asis the additi<strong>on</strong>al ocean tide attracti<strong>on</strong> due to the elevati<strong>on</strong>of the site.Owing to the higher cost of absolute gravimeters comparedto GPS receivers, the number of tide gauges beingm<strong>on</strong>itored is likely to be a small sub-set of the tide gaugeswith GPS. It has been recommended that the <strong>measurement</strong>sof absolute gravity should be c<strong>on</strong>centrated at keytide gauges in the GLOSS-LTT network, where they willbe most useful in c<strong>on</strong>tributing to meeting the challengeof determining vertical crustal movements to an accuracyof better than 1 mm per year. Absolute gravity <strong>measurement</strong>sat the GLOSS tide gauges at Newlyn <strong>and</strong> Lerwickhave recently shown that there are systematic errors inCGPS, which lead to errors in the vertical rates determinedfrom GPS (Teferle et al., 2006). This shows the importanceof independent techniques for identifying systematicerrors <strong>and</strong> the reducti<strong>on</strong> of these errors is currently animportant topic of re<strong>sea</strong>rch in the GPS community.4.4.5 Geocentric Co-ordinates <strong>and</strong> Vertical L<strong>and</strong>Movements of Tide Gauge BenchmarksFrom 2001 to the end of 2005, the Internati<strong>on</strong>al GNSSService (IGS) set up a pilot project called TIGA, whichis processing <strong>and</strong> analysing CGPS data from over 100tide gauges around the world in a c<strong>on</strong>sistent globalreference frame. The web site (http://adsc.gfz-potsdam.de/tiga/index_TIGA.html) should be c<strong>on</strong>sulted for informati<strong>on</strong>about the stati<strong>on</strong>s <strong>and</strong> the results that are beingobtained. The GPS global <strong>sea</strong> <strong>level</strong> m<strong>on</strong>itoring networkwill be a fully integrated comp<strong>on</strong>ent of the Internati<strong>on</strong>alGNSS Service – Internati<strong>on</strong>al Earth Rotati<strong>on</strong> Service (IGS/IERS) Internati<strong>on</strong>al Terrestrial Reference Frame (ITRF). Theproducts from this network are the co-ordinates <strong>and</strong>velocities of the benchmarks at tide gauge stati<strong>on</strong>s. ThePermanent Service for Mean Sea Level (PSMSL) archivingsystem has been designed to bank the vertical crustalvelocities derived from selected IGS soluti<strong>on</strong>s, al<strong>on</strong>g withexplanatory informati<strong>on</strong>, including the names of expertswho can be c<strong>on</strong>tacted by users of the system.34IOC <str<strong>on</strong>g>Manual</str<strong>on</strong>g>s <strong>and</strong> Guides No 14 vol IVFigure 4.4 Schematic of an absolute gravimeter.
Sea Level Measurement <strong>and</strong> Interpretati<strong>on</strong>5. Real Time Data Transmissi<strong>on</strong>5.1 Introducti<strong>on</strong>Sea <strong>level</strong> data acquired by a tide gauge may berequired in ‘real time’, ‘near real time’ or in ‘delayedmode’ depending <strong>on</strong> the applicati<strong>on</strong>. For example, astorm surge or tsunami warning system may requirethe data to be transmitted to the competent authoritiesin a very short time. On the other h<strong>and</strong>, for some scientificre<strong>sea</strong>rch, it is often <strong>on</strong>ly necessary to recover thedata annually, in which case it can be stored locally <strong>and</strong>recovered during a site visit, either by downloading thedata to a PC or by extracting <strong>and</strong> replacing a memorycard. In any case, it is expedient to adopt such a localprocedure, even if a communicati<strong>on</strong> link is in operati<strong>on</strong>,to prevent loss of valuable data.The method of communicati<strong>on</strong> depends largely <strong>on</strong> thedistance the data have to be transmitted. For short links(e.g. harbour operati<strong>on</strong>s), a radio link is often c<strong>on</strong>venient.For countrywide links, Subscriber Trunk Dialingor dedicated teleph<strong>on</strong>e lines of the Public SwitchedTeleph<strong>on</strong>e Network (PSTN) are an effective medium.Where fixed lines are not practical, the growth in theuse of Mobile Ph<strong>on</strong>e Links using General SwitchedMessaging (GSM) technology <strong>and</strong> General Packet RadioSystem (GPRS) protocols has extended the potential forl<strong>on</strong>g-distance communicati<strong>on</strong>. Both the fixed <strong>and</strong> mobileteleph<strong>on</strong>e systems give access to the Internet through anInternet Service Provider (ISP) which can greatly enhancethe transmissi<strong>on</strong> of data. For example, many of the GPSstati<strong>on</strong>s of the global network of the Internati<strong>on</strong>al GNSSService, which has some similarities to the global tidegauge network in terms of number of sites <strong>and</strong> amountof data to be transmitted, report through the Internet.All the forms of teleph<strong>on</strong>y are merging into <strong>on</strong>e, withteleph<strong>on</strong>e links provided by a supplier for which thec<strong>on</strong>necti<strong>on</strong> method is transparent to the user. After thetsunami of 26 December 2004, India has implementeda real-time coastal <strong>sea</strong> <strong>level</strong> data transmissi<strong>on</strong> by meansof GPRS with c<strong>on</strong>tinuous c<strong>on</strong>necti<strong>on</strong> to Internet, withmuch lower costs than previous experiments based <strong>on</strong>SMS <strong>and</strong> Data Call Services (Ant<strong>on</strong>y Joseph, pers<strong>on</strong>alcommunicati<strong>on</strong>).For more remote areas, the use of mobile satellite linksis an alternative. There are now upward of 30 orbitingsatellite systems in operati<strong>on</strong> dedicated to datatransmissi<strong>on</strong>, some <strong>on</strong> a global basis. Mobile satellitesystems (MSS) may be classified according to orbit altitudeas follows:GEO – geostati<strong>on</strong>ary earth orbit, approximate altitude:35,000 kmMEO – mid-altitude earth orbit, approximate altitude:10,000 kmLEO – low earth orbit, approximate altitude:
Sea Level Measurement <strong>and</strong> Interpretati<strong>on</strong>LEOs can be further sub-divided into Big LEO <strong>and</strong> LittleLEO categories. Big LEOs will offer voice, fax, telex,paging <strong>and</strong> data capability, whereas little LEOs willoffer data capability <strong>on</strong>ly, either <strong>on</strong> a real-time directreadout (‘bent pipe’) basis, or as a store-<strong>and</strong>-forwardservice. Since the satellite footprint decreases in sizeas the orbit gets lower, LEO <strong>and</strong> MEO systems requirelarger c<strong>on</strong>stellati<strong>on</strong>s than GEO satellites in order toachieve global coverage <strong>and</strong> avoid data delays. Lowerpower is, however, generally required for LEO <strong>and</strong> MEOsatellite communicati<strong>on</strong> because of the shorter averagedistance between transmitter <strong>and</strong> satellite. Some systemsimplement several high-gain antennas to generate‘spot beams’ <strong>and</strong> so reduce the requirement of themobile to have a complex antenna <strong>and</strong>/or high outputpower. A key feature of several MSS currently underdevelopment will be their inter-operability with existingpublic switched teleph<strong>on</strong>e <strong>and</strong> cellular networks, usinga dual-mode h<strong>and</strong>set.From a technical point of view, some systems do offersignificantly enhanced capabilities compared to existingmethods. Potential advantages include two-waycommunicati<strong>on</strong>, more timely observati<strong>on</strong>s, <strong>and</strong> greaterdata rates <strong>and</strong> volumes. Some systems may also proveto be c<strong>on</strong>siderably less expensive than existing channels,although this is as yet unclear. Table 5.1 c<strong>on</strong>tainsa list of the known satellite systems <strong>and</strong> their currentstatus.The Global Telecommunicati<strong>on</strong> System (GTS), hithertoused for the transmissi<strong>on</strong> of meteorological data <strong>and</strong>informati<strong>on</strong> also has its place in GLOSS <strong>and</strong> is thereforec<strong>on</strong>sidered in a separate secti<strong>on</strong> (5.3.3).Table 5.1 A list of the known satellite systems <strong>and</strong> their current status.System Status* Orbit type Message type Terminal size CommentsAPRIZESAT Operati<strong>on</strong>al Little LEO Data: TBD H<strong>and</strong>held 7 4 nanosatellites in orbit, 2-waycommunicati<strong>on</strong>s, directed at assettrackingARGOS Operati<strong>on</strong>al Little LEO Data: 32 bytes H<strong>and</strong>held 1 Various enhancements, including2-way messaging, are scheduledECCO(CCIGlobal)On hold LEO Voice/data H<strong>and</strong>held TBD 12 equatorial satellites planned by2003. Status questi<strong>on</strong>able – mergedwith ICO-Teledesic GlobalELLIPSO LicensedOn holdBig LEO Voice/data H<strong>and</strong>held TBD 17 satellites in highly elliptical orbits,serving major l<strong>and</strong> masses. Statusquesti<strong>on</strong>able – merged with ICO-Teledesic GlobalEYESAT Experimental Little LEO Data: 60 bytes H<strong>and</strong>held1 satellite 1995, principally for radio5 amateursLicensed Little LEO Data: TBD TBD 6 satellites for utility metering (aimedE-SAT On holdat c<strong>on</strong>tinental USA <strong>on</strong>ly initially)FAISAT LicensedOn holdLittle LEO Data:128 bytesH<strong>and</strong>held 10 38 satellites 2000+ Test satellitelaunched 1997GEMNETCancelled(pre-op)Little LEO Data: nomaximumLaptop 10 1st satellite 1995: launch failure36 satellites by ???GLOBALSTAROperati<strong>on</strong>al Big LEO Voice/data:no maximumH<strong>and</strong>held 1 48 satellites + spares (c<strong>on</strong>stellati<strong>on</strong>complete); two-way (voice) <strong>and</strong>real-time transmissi<strong>on</strong>. Limited coveragedue to lack of ground stati<strong>on</strong>s.Financial difficulties.GOES,METEOSAT,MTSATOperati<strong>on</strong>al GEO Data: variousopti<strong>on</strong>sLaptop 10 4 satellites; directi<strong>on</strong>al antenna desirableNOAA–ESA–MTSAT (Japanesemeteorological) satellites.GONETS-D Pre-operati<strong>on</strong>alLittle LEO Data H<strong>and</strong>held TBD 8 satellites in orbit, 36 more planned36IOC <str<strong>on</strong>g>Manual</str<strong>on</strong>g>s <strong>and</strong> Guides No 14 vol IV
Sea Level Measurement <strong>and</strong> Interpretati<strong>on</strong>GONETS-RINMARSAT-CINMARSAT-D+INMARSAT-BGANPlannedOn hold?Little LEO Data H<strong>and</strong>held TBD 48 satellites plannedOperati<strong>on</strong>al GEO Data: no 5.5 kg 15 Steered antenna not requiredmaximumOperati<strong>on</strong>al GEO Data: 128bytes uplink,8 bytes downlinkH<strong>and</strong>held 1 Global pager using existingINMARSAT-3 satellites. Note: veryoriented to downlinkOperati<strong>on</strong>al GEO Broadb<strong>and</strong> Laptop TBD Two of three satellites currently indata: no maximumoperati<strong>on</strong> covering the Indian Ocean<strong>and</strong> the Atlantic; third satellite cover-ing the Pacific due to be launchedin 2007SAFIRSIGNALICO (NewICO)LicensedOn hold?MEOVoice/data:no maximumH<strong>and</strong>held 1 Global voice <strong>and</strong> packet data services.Recently merged with Teledesicto form ICO Teledesic Global. 12satellites planned, <strong>on</strong>ly <strong>on</strong>e launchedso farIRIDIUM Revived Big LEO Voice/data:no maximumH<strong>and</strong>held 1 72 satellites in orbit; offers trueglobal coverage; two-way (voice)<strong>and</strong> real-time transmissi<strong>on</strong>IRIS/LLMS ExperimentalOn holdLittle LEO Data: up tofewkbytesH<strong>and</strong>held11 satellite in orbit. Belgian messagingsystem part of an ESA re<strong>sea</strong>rchprogrammeLEO One LicensedOn holdLittle LEO Data: uplink9,600 bps,downlinkH<strong>and</strong>held Max748-satellite c<strong>on</strong>stellati<strong>on</strong>, store <strong>and</strong>forward + 8 spares. No polar satellites2,400 bpsLEO SAT Planned Big LEO Data/voice H<strong>and</strong>held 1-5 72 satellitesCourier On hold?OCEAN- Experimental GEO No maximum Large Uses moored buoys + IntelsatNETODL Experimental GEO No maximum H<strong>and</strong>held TBD Uses Intelsat(OceanData Link)On hold?ODYSSEYORBCOMMCancelled(pre-op)MEOVoice/data:no maximumH<strong>and</strong>held 1 12 satellites were plannedOperati<strong>on</strong>al Little LEO Data: nomaximumH<strong>and</strong>held 5 35 satellites in orbit; 30 operati<strong>on</strong>al;expansi<strong>on</strong> to 48 licensed; e-mails(Globalgrams) to subscriber networkPre-operati<strong>on</strong>alLittle LEO Data: no Laptop 5 2 satellites in orbitmaximumOn holdPlanned Big LEO Voice/data 48 satellites plannedOn hold?SKYBRIDGELicensedOn holdBig LEO Broadb<strong>and</strong> Larger thanh<strong>and</strong>held80 satellites planned, recycling GEOspectrum allocati<strong>on</strong>sIOC <str<strong>on</strong>g>Manual</str<strong>on</strong>g>s <strong>and</strong> Guides No 14 vol IV37
Sea Level Measurement <strong>and</strong> Interpretati<strong>on</strong>STARSYS Cancelled Little LEO Data: 27 bytes H<strong>and</strong>held 2 12 satellites 1998+(pre-op)multiple messages24 satellites 2000+TELEDESIC LicensedOn holdBig LEO Broadb<strong>and</strong> 288 LEOs planned, now reduced to30 MEOsFCC licence granted, merged withnew ICOTEMISAT Experimental Little LEO Data 7 satellites planned for envir<strong>on</strong>mentaldata relay. 1 satellite launched1993.THURAYA Operati<strong>on</strong>al GEO Voice/data H<strong>and</strong>held 1 multiple-spot beam satellite inorbit (over Middle East); 1 plannedVITASAT Pre-operati<strong>on</strong>alLittle LEO Data 2 satellites in orbit,2 more plannedVSAT Pre-operati<strong>on</strong>alLittle LEO Data 2 satellites in orbit,2 more plannedWEST PlannedOn holdMEO Broadb<strong>and</strong> 9 satellites plannedThe status of each system in Table 5.1 is categorized accordingto seven groups:• Planned: Little is known about the system, except aname, noti<strong>on</strong>al type, <strong>and</strong> services to be offered. Mostlynot licensed, although some may be.• Licensed: System has been licensed by a nati<strong>on</strong>al orinternati<strong>on</strong>al regulatory agency (in most cases the FCC),but no satellites have been launched.• Experimental: System has <strong>on</strong>e or more satellites in orbitfor experimental purposes (not usually part of the finalc<strong>on</strong>stellati<strong>on</strong>). Includes new systems planning to useexisting satellites.• Pre-operati<strong>on</strong>al: System is in process of launching, orhas launched, its c<strong>on</strong>stellati<strong>on</strong>, but is not yet offeringfull services. Some limited evaluati<strong>on</strong> service may beavailable.• Operati<strong>on</strong>al: System has full or nearly full c<strong>on</strong>stellati<strong>on</strong>in place <strong>and</strong> is offering readily available service to externalusers (not necessarily commercial).• Cancelled: System has been cancelled, either beforesatellites launched (pre-op.) or after (post-op.).• On hold: No progress reported or scheduled.5.2 Choice of a SystemSelecti<strong>on</strong> of a communicati<strong>on</strong> system for sensor realtime(RT) or near-real-time (NRT) data transmissi<strong>on</strong>is always a compromise am<strong>on</strong>g a number of c<strong>on</strong>straints.The principal factors guiding decisi<strong>on</strong> in theadopti<strong>on</strong> of a system are:• data rate, data-rate profile in different operati<strong>on</strong>almodes (if more than <strong>on</strong>e)• power availability (power from mains or aut<strong>on</strong>omous/self-powered)• guarantee of data transmissi<strong>on</strong> (private networkor shared data line)• locati<strong>on</strong>, availability of telecommunicati<strong>on</strong> infrastructure(satellites in field of view)• l<strong>and</strong> or marine applicati<strong>on</strong> (fixed or moving)• availability of funding.Satellite communicati<strong>on</strong> systems at data-transmissi<strong>on</strong>rates of kbits/s <strong>and</strong> Mbits/s are operating in theL-b<strong>and</strong> (1–2 GHz), the C-b<strong>and</strong> (4–8 GHz)or the Ku(10–18 GHz)/Ka(18–40 GHz) b<strong>and</strong>.For marine applicati<strong>on</strong>s, L-b<strong>and</strong> systems are currentlythe best choice. Satellite cell ph<strong>on</strong>es are operatingtypically in the L-b<strong>and</strong> <strong>and</strong> may be used for data transferneeds of a few kbits/s. The data-transmissi<strong>on</strong> rate<strong>on</strong> the L-b<strong>and</strong> is much more b<strong>and</strong>width-limited, butsome systems allow for more than 100kbits/s. Antennadirecti<strong>on</strong>ality is less critical <strong>and</strong> even n<strong>on</strong>-directi<strong>on</strong>alantennas with sufficient beam width (eg +/–60°) areworkable, though at lower data-transmissi<strong>on</strong> rates (i.e.from a few kbits/s to some 10 kbits/s).The higher the frequency the easier it is to transmitlarge data sets at reas<strong>on</strong>able antenna sizes. However,attenuati<strong>on</strong> by rain is str<strong>on</strong>ger at higher frequencies,therefore Ka transmissi<strong>on</strong> from space has so farnot been very comm<strong>on</strong>. Ku has also hitherto beenless favoured in countries with heavy rainfall, but isbecoming more used nowadays.One of the key issues with any communicati<strong>on</strong> systeminvolving data is the data capacity. Many satellite sys-38IOC <str<strong>on</strong>g>Manual</str<strong>on</strong>g>s <strong>and</strong> Guides No 14 vol IV
Sea Level Measurement <strong>and</strong> Interpretati<strong>on</strong>tems have a limited capacity during any <strong>on</strong>e transmissi<strong>on</strong>.Teleph<strong>on</strong>e links, by <strong>and</strong> large, have an adequateb<strong>and</strong>width for most foreseeable applicati<strong>on</strong>s, especiallywith the new ADSL–Broadb<strong>and</strong> facilities thatare being introduced. The latter may be somewhatlimited in its spatial coverage at present, but it is fairto say that the communicati<strong>on</strong>s industry is <strong>on</strong>e of thefastest growing areas of commercial activity <strong>and</strong> c<strong>on</strong>sequentlycoverage may be greatly increased in theforeseeable future.Two-way communicati<strong>on</strong>s with a tide gauge can beadvantageous. It can be used to update software orcalibrati<strong>on</strong> values at the stati<strong>on</strong>, to interrogate thesystem for faults, to change the sampling rate <strong>and</strong> tocarry out many house-keeping functi<strong>on</strong>s that wouldotherwise wait for a site visit. This allows the systemto be flexible <strong>and</strong> improves overall reliability.In adopting a communicati<strong>on</strong> system for a tide gaugeinstallati<strong>on</strong>, <strong>on</strong>e c<strong>on</strong>siderati<strong>on</strong> has to be its reliabilityunder severe envir<strong>on</strong>mental c<strong>on</strong>diti<strong>on</strong>s. For example, fortsunami warning, some of the tide gauges may have tobe positi<strong>on</strong>ed in a tect<strong>on</strong>ically active regi<strong>on</strong> to provide anacceptable early warning. In the event of an earthquake,the first losses are often the PSTN network, mobileteleph<strong>on</strong>e links as well as electrical power. Under suchcircumstances, satellite links may be the <strong>on</strong>ly opti<strong>on</strong>.Additi<strong>on</strong>ally, some form of uninterruptible power supply(UPS) is necessary. This often takes the form of a batteryback-up system with an adequate reserve capacity ofseveral hours.A number of manufacturers, including tide gauge <strong>and</strong>data logger manufacturers, produce relatively inexpensiveready-to-use communicati<strong>on</strong>s systems suitable fortide gauges. For a list, see the websites given <strong>on</strong> thePSMSL website: http://www.pol.ac.uk/psmsl.5.3 Data Transmissi<strong>on</strong> SystemsFor the last decade or more, tide gauge installati<strong>on</strong>shave used the satellite systems of ARGOS, GOES,Meteosat, MTSAT <strong>and</strong> INMARSAT for data transmissi<strong>on</strong>.More recently, other, newer possibilities are beingexploited or c<strong>on</strong>sidered for exploitati<strong>on</strong>: GLOBALSTAR,INMARSAT/BGAN, IRIDIUM, ORBCOMM <strong>and</strong> VSAT.Characteristics of each system in terms of the costof hardware, b<strong>and</strong>width <strong>and</strong> latitude coverage differsignificantly.5.3.1 Systems already well establishedARGOS (www.argos-system.org) operates worldwideusing polar orbiting satellites with an orbital periodof about 100 minutes. A platform transmitter terminal(PTT), with a data b<strong>and</strong>width capacity of 256bits per satellite pass, is located at the gauge <strong>and</strong>,depending <strong>on</strong> locati<strong>on</strong>, the delay in data recepti<strong>on</strong> bythe user may be several hours. Data are available tousers through the Argos Global Processing Centres atToulouse, France, <strong>and</strong> Largo, Fla., USA. The numberof accessible satellite passes per day is latitude-dependent,varying from about 7 at the equator to 28 at thepoles. Users of ARGOS for tide gauge data acquisiti<strong>on</strong>include GRGS in France which will be able to provideadvice to potential users.GOES-E (USA), GOES-W (USA) (www.goes.noaa.gov.),METEOSAT (Europe) (www.esa.int/SPECIALS/MSG/; www.cnes.fr), <strong>and</strong> MTSAT (Japan) (www.fas.org/spp/guide/japan/earth/gms/) form a network of geostati<strong>on</strong>ary satellitesoffering overlapping l<strong>on</strong>gitudinal coverage. Latitudecover is limited to about 75° because of their equatorialorbit positi<strong>on</strong>. Each data collecti<strong>on</strong> platform (DCP) locatedat the gauge is allocated fixed time slots during which649 bytes of data can be transmitted to a satellite. Up to<strong>on</strong>e time slot every six minutes can be allocated to eachDCP, so that, if necessary, data could be available to userswithin this time frame. Previous problems with clock drifthave been eliminated by including GPS receivers in eachDCP. Users of these systems include POL in the UK <strong>and</strong>NOAA <strong>and</strong> the University of Hawaii Sea Level Center inthe USA. Data sent via the geostati<strong>on</strong>ary meteorologicalsatellites (GOES, Meteosat, MTSAT) is usually passed <strong>on</strong> tothe Global Telecommunicati<strong>on</strong> System (GTS) of the WMO(see secti<strong>on</strong> 5.3.3 & 5.3.4). Informati<strong>on</strong> about how toapply for DCP transmissi<strong>on</strong> slots can be found at:GOES: http://noaasis.noaa.gov/DCS/METEOSAT: http://www.eumetsat.int/MTSAT: http://www.jma.go.jp/jma/jma-eng/satellite/dcs.html.INMARSAT St<strong>and</strong>ard-C (www.inmarsat.com) also usesa network of geostati<strong>on</strong>ary satellites giving worldwidecoverage except for latitudes above 75°. This systemallows two-way data communicati<strong>on</strong> in near real timeat a rate of 600 bits/s, with a data message up to about8 kbytes. Tide gauge users of INMARSAT in the pastinclude the Australian Hydrographic Service.5.3.2 Systems now being applied or c<strong>on</strong>sideredfor applicati<strong>on</strong> in the transmissi<strong>on</strong> of <strong>sea</strong> <strong>level</strong>dataThere has been a major increase in the uptakeof broadb<strong>and</strong> services globally <strong>and</strong> more specificallyat even remote isl<strong>and</strong>s that form the basis ofPOL’s <strong>sea</strong> <strong>level</strong> <strong>measurement</strong> network in the SouthAtlantic. POL has sites at Ascensi<strong>on</strong> Isl<strong>and</strong>, St. HelenaIsl<strong>and</strong>, the Falkl<strong>and</strong> Isl<strong>and</strong>s <strong>and</strong> Tristan da Cunha.Leased lines, offering c<strong>on</strong>tinuous, high-speed internetaccess are available <strong>on</strong> all these isl<strong>and</strong>s exceptTristan da Cunha.POL has developed instrumentati<strong>on</strong> that can take theIOC <str<strong>on</strong>g>Manual</str<strong>on</strong>g>s <strong>and</strong> Guides No 14 vol IV39
Sea Level Measurement <strong>and</strong> Interpretati<strong>on</strong>output from a range of sensors, including radar <strong>and</strong>pressure types. The data are collected by a small Linuxembeddedprocessor <strong>and</strong> sent back to base by e-mailor by secure copy protocol (SCP). Broadb<strong>and</strong>-enabledtest sites using a radar sensor c<strong>on</strong>nected to an embeddedLinux system have been installed at Liverpool <strong>and</strong>Holyhead in the UK. One-minute data values are availableevery five minutes in the form of an e-mail message.The resulting data are displayed <strong>on</strong> the NTSLFweb pages: http://www.pol.ac.uk/ntslf/networks.html.Over the last 6 years the Spanish Ports Authority(Puertos del Estado) has also been using e-mail/ftp datatransmissi<strong>on</strong> from harbour gauges to a PC. Future <strong>sea</strong><strong>level</strong> stati<strong>on</strong>s will communicate via embedded Linuxbasedsystems instead of Windows based PCs.The advantages of broadb<strong>and</strong> technology are:• C<strong>on</strong>tinuous two-way c<strong>on</strong>necti<strong>on</strong> allowing highspeeddata sampling <strong>and</strong> near-real-time data retrieval.Remote gauge diagnostics are available <strong>and</strong> theability to re-programme the system remotely.• Timing drift <strong>and</strong> operator setup error eliminated byhaving accurate time available from network timeprotocol (NTP) servers <strong>on</strong> the internet.• Data delivery costs are known up-fr<strong>on</strong>t, because thesubscripti<strong>on</strong> costs are paid m<strong>on</strong>thly or yearly.• Real-time data collecti<strong>on</strong> allows malfuncti<strong>on</strong>s to befound <strong>and</strong> fixed, more rapidly.• Fixed-line broadb<strong>and</strong> systems can also allow backupaccess through a dial-up modem.The disadvantages of broadb<strong>and</strong> technology are:• A LAN interface is required; this is often difficult toadd to existing tide gauge systems. A l<strong>and</strong> line isnecessary for n<strong>on</strong>-satellite broadb<strong>and</strong> systems.• Serial port is generally not available, so interfacingis more difficult.• Power requirement for broadb<strong>and</strong> modems is quitehigh (~1 amp), this can create problems wheremains power is not available.The following list provides a summary of satellitesystems/services that are being applied or c<strong>on</strong>sideredfor applicati<strong>on</strong> by some members of the <strong>sea</strong> <strong>level</strong> <strong>and</strong>geodetic community for the transmissi<strong>on</strong> of <strong>sea</strong> <strong>level</strong><strong>and</strong> GPS data:The INMARSAT/BGAN (Broadb<strong>and</strong> Global Area Network)service (www.inmarsat.com) began with the launch of F1<strong>and</strong> F2 INMARSAT-4 (at 64°E <strong>and</strong> 53°W respectively) in2005. These satellite cover Europe, Africa, Asia (partly) <strong>and</strong>Americas <strong>and</strong> will eventually be joined by a third satellite,F3 I-4 (178°E) to give virtually full world coverage. Presently,broadb<strong>and</strong> speed of 492 kbits/s is available with a static IPaddress. C<strong>on</strong>necti<strong>on</strong> is by LAN, USB or Bluetooth; there isno serial port c<strong>on</strong>necti<strong>on</strong>. Instruments interfaced to thisterminal unit will need a network c<strong>on</strong>necti<strong>on</strong>.BGAN is a drop-in replacement for l<strong>and</strong>-line broadb<strong>and</strong>modems. It shares most of the advantages <strong>and</strong> disadvantagesof c<strong>on</strong>venti<strong>on</strong>al broadb<strong>and</strong>, but is capableof operating in remote areas <strong>and</strong> is optimized for lowpoweroperati<strong>on</strong>. BGAN’s biggest advantage over fixedlinebroadb<strong>and</strong> is its independence of local teleph<strong>on</strong>einfrastructure, <strong>and</strong> during extreme c<strong>on</strong>diti<strong>on</strong>s it will mostlikely c<strong>on</strong>tinue operating.GLOBALSTAR (www.globalstar.com/en/works/ <strong>and</strong> www.globalstar.com/en/c<strong>on</strong>tact.php) is a commercial globalsatellite teleph<strong>on</strong>e service based <strong>on</strong> 40 LEO satellites.The network is capable of picking up signals from over80% of Earth’s surface outside extreme polar regi<strong>on</strong>s<strong>and</strong> some mid-ocean regi<strong>on</strong>s. The system offers voice<strong>and</strong> data transmissi<strong>on</strong> via a secure code divisi<strong>on</strong> multiple-access(CDMA) satellite signal; there is no perceptiblevoice delay. There is sufficient back-up in the system toprevent call interrupti<strong>on</strong>. Signals are distributed to existingfixed or local cellular-ph<strong>on</strong>e networks in over 120countries.IRIDIUM (www.iridium.com; <strong>and</strong> www.deltawavecomm.com which is a service provider for Iridium <strong>and</strong> othersystems) is a similar type of system to that of Globalstar,but claims ‘complete coverage (including oceans, airways<strong>and</strong> polar regi<strong>on</strong>s)’. It comprises a ‘fleet’ of 66 LEOsatellites operating in a fully-meshed network. It serves awide range of commercial, governmental <strong>and</strong> social sectors<strong>and</strong> designs <strong>and</strong> sells its own equipment through aworld-wide network of more than 100 partners. Iridiumspecifically offers data-transmissi<strong>on</strong> services via laptop<strong>and</strong> cellph<strong>on</strong>e world-wide, including very remote areas.ORBCOMM (www.orbcomm.com) c<strong>on</strong>sists of a spacesegment of 36 LEO satellites with ground segmentscalled Gateway Earth Stati<strong>on</strong>s (GES) <strong>and</strong> GatewayC<strong>on</strong>trol Centres (GCC). From some areas communicati<strong>on</strong>scan be in near-real time. However, where areceiving satellite cannot communicate with a GES <strong>and</strong>a subscriber simultaneously, ORBCOMM operates inGlobalgram mode. In this mode the subscriber data arerelayed through a GES <strong>and</strong> GCC to an Internet ServiceProvider <strong>and</strong> there may be a delay of several hours inreceiving data. For much of Africa <strong>and</strong> the Indian Ocean,the Globalgram mode is the <strong>on</strong>ly opti<strong>on</strong>.VSAT (Very Small Aperture Terminal) (www.vsat-systems.com) satellite terminals are comm<strong>on</strong>ly used by the geodeticcommunity for communicati<strong>on</strong> at remote locati<strong>on</strong>s<strong>and</strong> via GPS stati<strong>on</strong>s co-located with tide gauges; theyare available for use in the C, Ka <strong>and</strong> Ku b<strong>and</strong>s. Datatransmissi<strong>on</strong>rates are up to several Mbits/s per terminal.For smaller data-transmissi<strong>on</strong> rates, VSATs are clustered ina network with a central hub for network c<strong>on</strong>trol. In thatway, the system capacity can be shared am<strong>on</strong>g varioususers (terminals). For VSAT systems, TDMA (time-divisi<strong>on</strong>multiple access) is probably the most comm<strong>on</strong> technique40IOC <str<strong>on</strong>g>Manual</str<strong>on</strong>g>s <strong>and</strong> Guides No 14 vol IV
Sea Level Measurement <strong>and</strong> Interpretati<strong>on</strong>to share a comm<strong>on</strong> transmissi<strong>on</strong> source am<strong>on</strong>g a numberof individual users. TDMA technology is relativelysimple: small complexity in receivers <strong>and</strong> allocati<strong>on</strong> ofthe whole frequency (b<strong>and</strong>width) to each user, but <strong>on</strong>ly<strong>on</strong> a part-time basis. The informati<strong>on</strong> for different usersis transferred sequentially in “bursts”. Disadvantages arethe need for network-wide synchr<strong>on</strong>izati<strong>on</strong> <strong>and</strong> relatedoverheads/inefficiency in b<strong>and</strong>width use. VSAT terminal<strong>sea</strong>ch require a relatively precise antenna pointing to thesatellite <strong>and</strong> can <strong>on</strong>ly be used from solid ground. Powerc<strong>on</strong>sumpti<strong>on</strong> is typically above 50 W.5.3.3 The Global Telecommunicati<strong>on</strong>s System(GTS)The GTS (www.wmo.ch/web/www/TEM/gts.html;www.wmo.ch/web/www/ois/Operati<strong>on</strong>al_Informati<strong>on</strong>/WMO386/ManOnGTS.html, which is the GTS <str<strong>on</strong>g>Manual</str<strong>on</strong>g>)is widely used by all the meteorological organizati<strong>on</strong>sfor real-time transmissi<strong>on</strong> <strong>and</strong> interchange of envir<strong>on</strong>mentaldata; up to now, however, it has not beenused much by the <strong>sea</strong> <strong>level</strong> community. This situati<strong>on</strong>is changing, given the development by the IOC of anIndian Ocean Tsunami Warning <strong>and</strong> Mitigati<strong>on</strong> System,<strong>and</strong> that can be thought of as a possible future for theGLOSS network, <strong>and</strong> in particular for the GLOSS FastData Centre (GFDC). For the development of the IndianOcean tsunami warning system, it has been decidedthat data have to be transmitted within 15 minutes ofbeing recorded at a tide gauge. (A 1-minute average,5 minute cycle may be adapted for selected sites closeto tsunamigenic source areas). The data would be composedof 1-minute averages to achieve the requiredresoluti<strong>on</strong> <strong>and</strong> would need to be made available <strong>on</strong>the GTS. This is in fact the actual recommendati<strong>on</strong> for<strong>sea</strong> <strong>level</strong> data transmitted for tsunami warning systems:making use of the GTS, which works well if geostati<strong>on</strong>arymeteorological satellites are used for data transmissi<strong>on</strong>.If this is not the case, arrangements with thenati<strong>on</strong>al meteorological organizati<strong>on</strong>s may be neededfor including <strong>and</strong> downloading <strong>sea</strong> <strong>level</strong> data from theGTS; automatic transmissi<strong>on</strong> by e-mail or FTP will probablybe required from the nati<strong>on</strong>al <strong>sea</strong> <strong>level</strong> agency tothe meteorological institute, GFDC or Tsunami AlertSystem, for including the data in GTS.5.4 Data Transmissi<strong>on</strong> FormatsTo the extent that the GTS is retained as the preferredmeans of transmitting tide gauge data from theirsource (the gauges) to the c<strong>on</strong>cerned data centres(notably, PSMSL, UHSLC <strong>and</strong> nati<strong>on</strong>al <strong>sea</strong> <strong>level</strong> datacentres, the necessary data format is c<strong>on</strong>tained inthe WMO <str<strong>on</strong>g>Manual</str<strong>on</strong>g> <strong>on</strong> Codes (www.wmo.int/www/WMOCodes/<str<strong>on</strong>g>Manual</str<strong>on</strong>g>Codes/WMO306.html).IOC <str<strong>on</strong>g>Manual</str<strong>on</strong>g>s <strong>and</strong> Guides No 14 vol IV41
Sea Level Measurement <strong>and</strong> Interpretati<strong>on</strong>6. Quality C<strong>on</strong>trol of DataData recovered from a tide gauge always provide timeserieswith a particular sampling interval. Even analoguecharts are digitized to provide <strong>level</strong>s at regular points intime. Until recently, most data acquired this way havebeen archived <strong>and</strong> distributed by data assembly centres(DACs) in a quality c<strong>on</strong>trolled (QC) <strong>and</strong> fully documentedform. This results in ‘delayed mode’ data sets. Volume 3<strong>and</strong> earlier editi<strong>on</strong>s of this <str<strong>on</strong>g>Manual</str<strong>on</strong>g> dwelt at length <strong>on</strong>QC of data in delayed mode. Such QC methods are wellestablished <strong>and</strong> will not be repeated here.However, <strong>sea</strong> <strong>level</strong> data are required for many purposes,<strong>and</strong> in many applicati<strong>on</strong>s there is no time to perform afull QC. For example, during the World Ocean Circulati<strong>on</strong>Experiment (WOCE), the University of Hawaii Sea-LevelCentre (UHSLC) was established as the ‘fast delivery’DAC, with the British Oceanographic Data Centre(BODC) as the ‘delayed mode’ WOCE DAC. The UHSLCwas tasked with the assembly, quality c<strong>on</strong>trol <strong>and</strong> distributi<strong>on</strong>of <strong>sea</strong> <strong>level</strong> data from WOCE gauges withinseveral weeks, comparable to the delay, at the time, inthe delivery of satellite altimeter data. Meanwhile, BODChad the task to assemble <strong>and</strong> supply <strong>sea</strong> <strong>level</strong> data fromthe WOCE network to the full extent of quality c<strong>on</strong>trolwithin 18–24 m<strong>on</strong>ths from data collecti<strong>on</strong>.More recently, there has been an emphasis <strong>on</strong> makingas many GLOSS gauges as possible deliver datain nearreal time, i.e. typically within an hour. Thisrequirement has arisen for several reas<strong>on</strong>s. First, withreal-time data, it is immediately obvious when problemswith a gauge have occurred. Sec<strong>on</strong>d, the databecome available for many other applicati<strong>on</strong>s within‘operati<strong>on</strong>al oceanography’, e.g. for flood warningor for assimilati<strong>on</strong> of <strong>sea</strong> <strong>level</strong> data into oceancirculati<strong>on</strong> models. The data are also then useful fortsunami warning systems in certain areas. The GLOSSprogramme has defined the UHSLC as the ‘GLOSSReal-Time Centre’ in additi<strong>on</strong> to the existing ‘FastCentre’ resp<strong>on</strong>sible for producing hourly values form<strong>on</strong>itoring <strong>and</strong> models.If <strong>sea</strong> <strong>level</strong> data are used in near-real-time applicati<strong>on</strong>s,then the operati<strong>on</strong>al system has to be robustenough not to be perturbed when bad data arerecorded (e.g. data spikes). One way to guard againstbad data is to have c<strong>on</strong>tinuous human oversight ofthe data stream (e.g. as occurs in the UK StormTide Forecasting Service for flood warning). Realtimequality c<strong>on</strong>trol (RTQC) software is now beingdeveloped by several groups. For example, in Europethe Spanish Ports Authority (Puertos del Estado) hasdeveloped an automatic quality c<strong>on</strong>trol of <strong>sea</strong> <strong>level</strong>data for detecti<strong>on</strong> of spikes, gaps, etc. before datais displayed <strong>on</strong> the public web-page <strong>and</strong> assimilatedinto a storm surge forecasting system. Informati<strong>on</strong>about this software <strong>and</strong> the algorithms for spikedetecti<strong>on</strong> can be obtained from Begoña Pérez.42IOC <str<strong>on</strong>g>Manual</str<strong>on</strong>g>s <strong>and</strong> Guides No 14 vol IV
Sea Level Measurement <strong>and</strong> Interpretati<strong>on</strong>7. Training Materials<strong>and</strong> C<strong>on</strong>tactsThe PSMSL maintains web pages (www.pol.ac.uk/psmsl/training/) that provide access to training materials developedboth by itself <strong>and</strong> by other agencies, primarily aspart of GLOSS development. These materials include:• Reading list (1) Books <strong>on</strong> tides <strong>and</strong> <strong>sea</strong> <strong>level</strong>s, includingIPCC Reports• Reading list (2) Geodesy, GPS <strong>and</strong> other useful informati<strong>on</strong>• Reading list (3) Satellite altimetry informati<strong>on</strong>• Reading list (4) Further reading <strong>on</strong> the Web• <str<strong>on</strong>g>Manual</str<strong>on</strong>g>s, including the IOC tide gauge trainingmanuals, the present volume included• Powerpoint files• Brochures in various languages• Descriptive overviews of <strong>sea</strong> <strong>level</strong> recording in eachcountry or regi<strong>on</strong>• Publicati<strong>on</strong>s relevant to the PSMSL <strong>and</strong> GLOSS• GLOSS dem<strong>on</strong>strati<strong>on</strong> CD c<strong>on</strong>tents, January 2005• Training courses organized by IOC/GLOSS <strong>and</strong> otherorganizati<strong>on</strong>s• Tidal analysis <strong>and</strong> predicti<strong>on</strong> packages• Cross-wavelet <strong>and</strong> wavelet-coherence software• A list of tide gauge manufacturers <strong>and</strong> suppliers• Tide gauge experiencesIn additi<strong>on</strong>, the PSMSL provides a set of useful c<strong>on</strong>tactsin each country (http://www.pol.ac.uk/psmsl/<strong>sea</strong>_<strong>level</strong>_c<strong>on</strong>tacts.html). Such c<strong>on</strong>tact informati<strong>on</strong> becomesout-of-date rapidly <strong>and</strong> the PSMSL would be grateful toknow of errors <strong>and</strong> omissi<strong>on</strong>s (via psmsl@pol.ac.uk).Technical experts who may be asked to provide advice<strong>on</strong> tide gauges <strong>and</strong> related topics are shown <strong>on</strong> thefollowing page.IOC <str<strong>on</strong>g>Manual</str<strong>on</strong>g>s <strong>and</strong> Guides No 14 vol IV43
Sea Level Measurement <strong>and</strong> Interpretati<strong>on</strong>Acoustic Gauges with Sounding TubeAcoustic Gauges without Sounding Tube (SRD)Single-Transducer SystemsMultiple-Transducer Systems (‘B’ gauges)Pressure Transducers in Stilling WellsBubbler Pressure GaugesBottom-Mounted Pressure GaugesFloat Gauges in Stilling WellsOptical Shaft Encoders (especially for river <strong>and</strong> lakerecords)Radar Tide GaugesAdvice <strong>on</strong> Data-Transmissi<strong>on</strong> MethodsAllan Suskin, NTF Australia. allan@pacific.ntf.flinders.edu.auBernie Kil<strong>on</strong>sky, UHSLC, USA kil<strong>on</strong>sky@soest.hawaii.eduBegoña Pérez Gómez, Puertos del Estado, Spainbego@puertos.esRuth Farre hydrosan@iafrica.comDov Rosen, NIO Israel rosen@ocean.org.ilPeter Foden, POL UK prf@pol.ac.ukPeter Foden, POL UK prf@pol.ac.ukAs for other pressure systemsDavid Smith, POL UK des@pol.ac.ukPeter Foden, POL UK prf@pol.ac.ukMark Merrifield, UHSLC USA markm@soest.hawaii.eduDave Johnst<strong>on</strong>e, NIWA NZ d.johnst<strong>on</strong>e@niwa.cri.nzPeter Foden, POL prf@pol.ac.ukBegoña Pérez, Puertos del Estado, bego@puertos.esDavid Meldrum, SAMS UK d.meldrum@sams.ac.ukAdvice <strong>on</strong> Geodetic Methods:GPSDORISAbsolute GravityMike Bevis, Ohio State University, USAmbevis@osu.eduAnny Cazenave, GRGS, France anny.cazenave@cnes.frSim<strong>on</strong> Williams, POL UK sdwil@pol.ac.uk44IOC <str<strong>on</strong>g>Manual</str<strong>on</strong>g>s <strong>and</strong> Guides No 14 vol IV
Sea Level Measurement <strong>and</strong> Interpretati<strong>on</strong>8. New Techniques for Sea LevelMeasurements8.1 GPS <strong>on</strong> BuoysRadar altimetry is widely used for various <strong>sea</strong>-<strong>level</strong>relatedre<strong>sea</strong>rch. Owing to unknown post-launchbiases <strong>and</strong> the aging of satellite electr<strong>on</strong>ic systemcomp<strong>on</strong>ents, a c<strong>on</strong>sistent <strong>and</strong> l<strong>on</strong>g-term stable offshoreheight reference is needed. Some satellites arepassing offshore oil rigs equipped with tide gauges<strong>and</strong> GPS. However, these locati<strong>on</strong>s are rare. Withthe increasing accuracy of GPS for offshore applicati<strong>on</strong>s,various groups have developed GPS-equippedbuoys for the determinati<strong>on</strong> of the instantaneous<strong>sea</strong>-surface heights (iSSH). While in the past <strong>on</strong>lya few calibrati<strong>on</strong> experiments were carried out forradar altimetry, in 2001 GPS buoys were successfullyused during the calibrati<strong>on</strong>/validati<strong>on</strong> campaigns ofJas<strong>on</strong>-1 <strong>and</strong> ENVISAT. More recent applicati<strong>on</strong>s are fortsunami detecti<strong>on</strong> (e.g. Kato et al. 2005).One of the earlier calibrati<strong>on</strong> experiments was successfullycarried out by Hein (Hein et al. 1990).Between 1999 <strong>and</strong> 2003, GPS water <strong>level</strong> <strong>measurement</strong>was coordinated by a special study group of theInternati<strong>on</strong>al Associati<strong>on</strong> of Geodesy (see http://www.gfz-potsdam.de/pb1/op/altimetry/SSG_buoys/index.html <strong>and</strong> references herein).Depending <strong>on</strong> the type of applicati<strong>on</strong>, logistic requirements,<strong>and</strong> <strong>sea</strong> state, different types of buoys are used.The most simple <strong>and</strong> straightforward types are lifesavertypebuoys fitted directly with a GPS antenna (Wats<strong>on</strong>et al., 2004; Figure 8.1), <strong>and</strong> towed by, for example, avessel. Larger buoys, such as toroid buoys (Schöne etal., 2001; Figure 8.3) or barrel buoys, can be mooredfor l<strong>on</strong>g-term applicati<strong>on</strong>s, but are in need of additi<strong>on</strong>alsensors to account for the buoy movement. Examplesof height time-series from GPS buoys are shown inFigures 8.2 <strong>and</strong> 8.4.To estimate the iSSH, GPS <strong>measurement</strong>s are used ina differential mode. The computed value is furthercorrected for the dipping <strong>and</strong> the tilting of the buoy.The accuracy of GPS for the height comp<strong>on</strong>ent isbetter than a few centimetres, allowing very precise<strong>measurement</strong>s of the iSSH. Even with a decrease inaccuracy with increasing distance from the GPS referencestati<strong>on</strong> at the shore, the resulting iSSH values areprecise enough for calibrating radar altimeters.With the technological advances in hardware <strong>and</strong> newdevelopments in GPS processing, small lightweightsystems will be available to support the massive applicati<strong>on</strong>in different fields. Fields of future re<strong>sea</strong>rch arethe applicati<strong>on</strong> of precise point positi<strong>on</strong>ing techniquesto reduce the amount of data to be transferred, lowpowerc<strong>on</strong>sumpti<strong>on</strong> equipment, <strong>and</strong> new data transfertechniques for offshore applicati<strong>on</strong>s.IOC <str<strong>on</strong>g>Manual</str<strong>on</strong>g>s <strong>and</strong> Guides No 14 vol IV45
Sea Level Measurement <strong>and</strong> Interpretati<strong>on</strong>Sea Level Measurement <strong>and</strong> Interpretati<strong>on</strong>Figure 8.1 The University of Tasmania GPSbuoy (C. Wats<strong>on</strong>, pers<strong>on</strong>al communicati<strong>on</strong>).Figure 8.2 Height time-series (SSG 2.194, 2003).Figure 8.3 The GFZ Potsdam GPS buoy.Figure 8.4 Height time-series from a GPS buoy;the time-series is dominated by <strong>sea</strong> state. Thesmoothed curves are the running mean filteredtime-series; the dot is the actual RA <strong>measurement</strong>used for comparis<strong>on</strong>.8.2 GNSS ReflectometryOnce the European satellite c<strong>on</strong>stellati<strong>on</strong> GALILEO startstransmissi<strong>on</strong> of navigati<strong>on</strong> signals in 2008, an infrastructureof three global satellite navigati<strong>on</strong> systemswill be available for commercial <strong>and</strong> scientific applicati<strong>on</strong>s.GALILEO, together with the US Global Positi<strong>on</strong>ingSystem (GPS) <strong>and</strong> the Russian GLONASS (Global’nayaNavigatsi<strong>on</strong>annaya Sputnikovaya Sistema) c<strong>on</strong>stellati<strong>on</strong>,offers novel opportunities for remotely sensing the Earth’satmosphere <strong>and</strong> oceans with dense spatial <strong>and</strong> temporalcoverage.The high reflectivity of GPS signals in the L-b<strong>and</strong> frequencyrange (1.2276 <strong>and</strong> 1.57542 GHz) at water <strong>and</strong>ice- or snow-covered surfaces allows for the detecti<strong>on</strong><strong>and</strong> analysis of reflected GNSS (Global Navigati<strong>on</strong> SatelliteSystem) signals. The passive reflectometry <strong>and</strong> interferometrysystem (PARIS) was the first c<strong>on</strong>cept proposed forocean altimetry using GNSS (Martín-Neira, 1993). In theFigure 8.5 The PARIS c<strong>on</strong>cept.46IOC <str<strong>on</strong>g>Manual</str<strong>on</strong>g>s <strong>and</strong> Guides No 14 vol IV
PARIS scheme, direct <strong>and</strong> ocean-reflected signals aredetected by spaceborne receivers, <strong>and</strong> altimetric heightinformati<strong>on</strong> is extracted from the delay in arrival timesof the reflected signals relative to the direct signals(Figure 8.5).Using dedicated GNSS receiver instruments, <strong>sea</strong> <strong>level</strong>heights accurate up to ~5 cm were determined in anumber of airplane <strong>and</strong> ballo<strong>on</strong> experiments (Garris<strong>on</strong><strong>and</strong> Katzberg, 2000; Rius et al., 2002; Ruffini et al.,2004). In ground-based GNSS reflecti<strong>on</strong> experimentsabove an artificial p<strong>on</strong>d, Martín-Neira et al. (2002)achieved an accuracy of 1 cm, <strong>and</strong> at an altitude ofabout 500 m above Crater Lake (Oreg<strong>on</strong>, USA) altimetricheight values accurate to 2 cm were obtained (Treuhaftet al., 2001). Anders<strong>on</strong> (2000) reported <strong>on</strong> 12-cm accuracyin near-surface <strong>measurement</strong>s at heights between7 <strong>and</strong> 10 m. In additi<strong>on</strong>, the dependency of the codecorrelati<strong>on</strong> functi<strong>on</strong> <strong>on</strong> the slope characteristics ofthe reflecting surface can be used to infer <strong>sea</strong>-surfaceroughness as well as wind speed <strong>and</strong> directi<strong>on</strong> (GNSSscatterometry) (Katzberg et al., 2001; Cardellach et al.,2003; Germain et al., 2004).First spaceborne observati<strong>on</strong>s of signal reflecti<strong>on</strong>s aredescribed by Pavelyev et al. (1996) <strong>and</strong> Lowe et al.(2002); later, signatures of coherent GPS reflecti<strong>on</strong>s atgrazing incidence angles were found in radio occultati<strong>on</strong>data observed by the GPS/MET, CHAMP <strong>and</strong>SAC-C satellites (Beyerle et al., 2002; Hajj et al., 2004).CHAMP <strong>and</strong> SAC-C are both already supplied withnadir-looking antennas to detect reflected GPS signals;efforts are now being made to establish space-basedGNSS altimetry as a viable remote-sensing technique(e.g. Hajj <strong>and</strong> Zuffada, 2003).IOC <str<strong>on</strong>g>Manual</str<strong>on</strong>g>s <strong>and</strong> Guides No 14 vol IV 47
Sea Level Measurement <strong>and</strong> Interpretati<strong>on</strong>ReferencesThis list c<strong>on</strong>tains references of interest to particular secti<strong>on</strong>s of the <str<strong>on</strong>g>Manual</str<strong>on</strong>g>, which may be used as further sources of informati<strong>on</strong> for thatsecti<strong>on</strong>. Some references are referred to explicitly in the text, while others are not. Some references appear in more than <strong>on</strong>e secti<strong>on</strong>.Secti<strong>on</strong> 2.1IOC, 1990. Global Sea Level Observing System (GLOSS)Implementati<strong>on</strong> Plan. Intergovernmental OceanographicCommissi<strong>on</strong>, Technical Series No. 35, 90pp.Secti<strong>on</strong> 2.2Vassie, J.M., Woodworth, P.L. <strong>and</strong> Holt, M.W., 2004. Anexample of North Atlantic deep ocean swell impactingAscensi<strong>on</strong> <strong>and</strong> St. Helena isl<strong>and</strong>s in the centralSouth Atlantic. Journal of Atmospheric <strong>and</strong> OceanicTechnology, 21(7), 1095-1103.Secti<strong>on</strong> 2.3Pugh, D.T., 2004. Changing <strong>sea</strong> <strong>level</strong>s. Effects oftides, weather <strong>and</strong> climate. Cambridge: CambridgeUniversity Press, 280pp.Woodworth, P.L., Pugh, D.T., Meredith, M.P. <strong>and</strong> Blackman,D.L., 2005. Sea <strong>level</strong> changes at Port Stanley, Falkl<strong>and</strong>Isl<strong>and</strong>s. Journal of Geophysical Re<strong>sea</strong>rch, Vol. 110,C06013, doi:10.1029/2004JC002648.Secti<strong>on</strong> 2.4Cartwright, D.E., 1999. Tides - a scientific history.Cambridge: Cambridge University Press, 292pp.Cartwright, D.E., Edden, A.C., Spencer, R. <strong>and</strong> Vassie,J.M, 1980. The tides of the northeast Atlantic Ocean.Philosophical Transacti<strong>on</strong>s of the Royal Society ofL<strong>on</strong>d<strong>on</strong>. A 298, 87-139.Doods<strong>on</strong>, A.T. <strong>and</strong> Warburg, H.D., 1941. Admiralty manualof tides. Her Majesty’s Stati<strong>on</strong>ery Office, L<strong>on</strong>d<strong>on</strong>.Filloux, J.H., 1980. Pressure fluctuati<strong>on</strong>s <strong>on</strong> the openocean floor over a broad frequency range. Journal ofPhysical Oceanography. 10(12) 1959-1971.Forrester, W.D., 1983. Canadian Tidal <str<strong>on</strong>g>Manual</str<strong>on</strong>g>. Departmentof Fisheries <strong>and</strong> Oceans, Ottawa, 138pp.Open University, 1989. Waves, Tides <strong>and</strong> Shallow-WaterProcesses. Open University Oceanography Series Vol.4.Oxford: Pergam<strong>on</strong> Press in associati<strong>on</strong> with the OpenUniversity, 187pp.Pugh, D.T., 1987. Tides, Surges <strong>and</strong> Mean Sea <strong>level</strong>: ah<strong>and</strong>book for engineers <strong>and</strong> scientists. Chichester:Wiley, 472pp.Pugh, D.T., 2004. Changing <strong>sea</strong> <strong>level</strong>s. Effects of tides,weather <strong>and</strong> climate. Cambridge: Cambridge UniversityPress, 280pp.Shum, C.K., Woodworth, P.L., Andersen, O.B., Egbert, G.,Francis, O., King, C., Klosko, S., Le Provost, C., Li, X.,Molines, J-M., Parke, M., Ray, R., Schlax, M., Stammer,D., Tierney, C., Vincent, P. <strong>and</strong> Wunsch, C., 1997.Accuracy assessment of recent ocean tide models.Journal of Geophysical Re<strong>sea</strong>rch, 102(C11), 25173-25194.Spencer, R. <strong>and</strong> Vassie, J.M., 1997. The evoluti<strong>on</strong> of deepocean pressure <strong>measurement</strong>s in the U.K. Progress inOceanography, 40, 423-435.Secti<strong>on</strong> 2.4.1Caldwell, P.C., 1991. Sea Level Data Processing Software<strong>on</strong> IBM PC Compatible Microcomputers. TOGA SeaLevel Centre, University of Hawaii.Doods<strong>on</strong>, A.T., 1928. The analysis of tidal observati<strong>on</strong>s.Philosophical Transacti<strong>on</strong>s of the Royal Society, A, 227,223-279.FIAMS, 1990. Tidal Time-Series Software Designed for use<strong>on</strong> a Pers<strong>on</strong>al Computer. FIAMS Tidal Laboratory. TheFlinders University of South Australia.Foreman, M., 1997. <str<strong>on</strong>g>Manual</str<strong>on</strong>g> for tidal height analysis <strong>and</strong>predicti<strong>on</strong>. Institute of Ocean Sciences, Patricia Bay,Victoria, British Columbia. Pacific Marine Science Report77-10. (Unpublished Manuscript).Munk, W.H. <strong>and</strong> Cartwright, D.E., 1966. Tidal spectroscopy<strong>and</strong> predicti<strong>on</strong>s. Philosophical Transacti<strong>on</strong>s of theRoyal Society, A, 259, 533-581.Murray, M.T., 1963. Tidal analysis with an electr<strong>on</strong>ic digitalcomputer. Cahiers Oceanographique. 699-711.Secti<strong>on</strong> 2.5Alvarez Fanjul, E., Pérez, B., <strong>and</strong> Rodríguez, I., 2001.Nivmar: a storm surge forecasting system for SpanishWaters. Scientia Marina, 65, 145-154.Flather, R.A., 1984. A numerical model investigati<strong>on</strong> ofthe storm surge of 31 January <strong>and</strong> 1 February 1953in the North Sea. Quarterly Journal of the RoyalMeteorological Society, 110, 591-612.Flather, R.A., 2000. Existing operati<strong>on</strong>al oceanography.Coastal Engineering, 41(1-3), 13-40.Rossiter, J.R., 1954. The North Sea storm surge of 31January <strong>and</strong> 1 February, 1953. Philosophical Transacti<strong>on</strong>sof the Royal Society, A, 246, 371-400.Wolf, J. <strong>and</strong> Flather, R.A., 2005. Modelling waves <strong>and</strong> surgesduring the 1953 storm. Philosophical Transacti<strong>on</strong>s ofthe Royal Society, 363, 1359-1375.Secti<strong>on</strong> 2.6Bryant, E., 2001. Tsunami: the underrated hazard.Cambridge University Press.Le<strong>on</strong>ard, M. 2006. Analysis of tide gauge recordsfrom the December 2004 Indian Ocean Tsunami.Geophysical Re<strong>sea</strong>rch Letters, 33, L17602, doi:10.1029/2006GL026552.Merrifield, M.A., Firing, Y.L., Aarup, T., Agricole, W.,Brundrit, G., Chang-Seng, D., Farre, R., Kil<strong>on</strong>sky, B.,Knight, W., K<strong>on</strong>g, L., Magori, C., Manurung, P.,McCreery, C., Mitchell, W., Pillay, S., Schindele, F.,48IOC <str<strong>on</strong>g>Manual</str<strong>on</strong>g>s <strong>and</strong> Guides No 14 vol IV
Sea Level Measurement <strong>and</strong> Interpretati<strong>on</strong>Shillingt<strong>on</strong>, F., Testut, L., Wijeratne, E.M.S., Caldwell,P., Jardin, J., Nakahara, S., Porter, F.-Y. <strong>and</strong> Turetsky, N.,2005. Tide gauge observati<strong>on</strong>s of the Indian Oceantsunami, 26 December, 2004. Geophysical Re<strong>sea</strong>rchLetters, 32, L09603, doi: 10.1029/2005GL022610.Secti<strong>on</strong> 2.7Church, J.A., Gregory, J.M., Huybrechts, P., Kuhn, M.,Lambeck, K., Nhuan, M.T., Qin, D. <strong>and</strong> Woodworth, P.L.,2001. Changes in <strong>sea</strong> <strong>level</strong>. In Climate Change, 2001:The Scientific Basis. C<strong>on</strong>tributi<strong>on</strong> of Working Group I tothe Third Assessment Report of the IntergovernmentalPanel <strong>on</strong> Climate Change. (eds. Hought<strong>on</strong> J.T., DingY., Griggs D.J., Noguer M., van der Linden P.J., Dai X.,Maskell K. <strong>and</strong> Johns<strong>on</strong> C.A.). Cambridge: CambridgeUniversity Press, 881pp.Woodworth, P.L. <strong>and</strong> Player, R., 2003. The PermanentService for Mean Sea Level: an update to the 21st century.Journal of Coastal Re<strong>sea</strong>rch, 19, 287-295.Woodworth, P.L., Gregory, J.M. <strong>and</strong> Nicholls, R.J., 2004.L<strong>on</strong>g term <strong>sea</strong> <strong>level</strong> changes <strong>and</strong> their impacts. pp.717-752 (chapter 18) in The Sea, Volume 13, edited by A.R.Robins<strong>on</strong>, J. McCarthy <strong>and</strong> B.J. Rothschild. HarvardUniversity Press.Secti<strong>on</strong> 2.8Ham<strong>on</strong>, B.V. <strong>and</strong> Middlet<strong>on</strong> J.F., 1989. Return periods ofextreme <strong>sea</strong> <strong>level</strong>s: the exceedance probability method.Internati<strong>on</strong>al Hydrographic Review, LXVI(2), 165-177.Lenn<strong>on</strong>, G.W., 1963. A frequency investigati<strong>on</strong> of abnormallyhigh tidal <strong>level</strong>s at certain west coast ports.Proceedings of the Instituti<strong>on</strong> of Civil Engineers, 425,451-484.Middlet<strong>on</strong>, J.F. <strong>and</strong> Thomps<strong>on</strong>, K.R., 1986. Return periodsof extreme <strong>sea</strong> <strong>level</strong>s from short records. Journal ofGeophysical Re<strong>sea</strong>rch, 491, 11707-11716.Pugh, D.T. <strong>and</strong> Vassie, J.M., 1979. Extreme <strong>sea</strong> <strong>level</strong>s fromtide <strong>and</strong> surge probability. Proceedings 16th CoastalEngineering C<strong>on</strong>ference, 1978, Hamburg. AmericanSociety of Civil Engineers, New York, 41, 911-930.Smith, R.L., 1986. Extreme value theory based <strong>on</strong> ther largest annual events. Journal of Hydrology, 486,27-43.Suth<strong>on</strong>s, C.T., 1963. Frequency of occurrence of abnormallyhigh <strong>sea</strong> <strong>level</strong>s <strong>on</strong> the east <strong>and</strong> south coastsof Engl<strong>and</strong>. Proceedings of the Instituti<strong>on</strong> of CivilEngineers, 425, 443-449.Tawn, J.A. <strong>and</strong> Vassie, J.M., 1989. Extreme <strong>sea</strong> <strong>level</strong>s:the joint probabilities method revisited <strong>and</strong> revised.Proceedings of the Instituti<strong>on</strong> of Civil Engineers, Part 2,87, 429-442.Tawn, J.A., 1992. Estimating probabilities of extreme <strong>sea</strong><strong>level</strong>s. Applied Statistics, 41, 77-93.Secti<strong>on</strong> 3.1IOC, 2004. New technical developments in <strong>sea</strong> <strong>and</strong>l<strong>and</strong> <strong>level</strong> observing systems. Proceedings of meetingOctober 14-16 2003, Paris, France. IOC WorkshopReport No 193. 174pp & Annexes.Secti<strong>on</strong> 3.1.1Pugh, D.T., 1987. Tides, Surges <strong>and</strong> Mean Sea <strong>level</strong>: ah<strong>and</strong>book for engineers <strong>and</strong> scientists. Chichester:Wiley, 472pp.Secti<strong>on</strong> 3.2IOC, 1985. <str<strong>on</strong>g>Manual</str<strong>on</strong>g> <strong>on</strong> Sea <strong>level</strong> Measurement <strong>and</strong>Interpretati<strong>on</strong>. Volume 1 - Basic procedures.Intergovernmental Oceanographic Commissi<strong>on</strong><str<strong>on</strong>g>Manual</str<strong>on</strong>g>s <strong>and</strong> Guides No. 14. IOC, Paris, 83pp.Lenn<strong>on</strong>, G.W., 1971. Sea <strong>level</strong> instrumentati<strong>on</strong>, its limitati<strong>on</strong>s<strong>and</strong> the optimisati<strong>on</strong> of the performance ofc<strong>on</strong>venti<strong>on</strong>al gauges in Great Britain. Internati<strong>on</strong>alHydrographic Review, 48(2), 129-147.Noye, B.J., 1974a. Tide-well systems I: some n<strong>on</strong>-lineareffects of the c<strong>on</strong>venti<strong>on</strong>al tide well. Journal of MarineRe<strong>sea</strong>rch, 32(2), 129-135.Noye, B.J., 1974b. Tide-well systems II: the frequencyresp<strong>on</strong>se of a linear tide-well system. Journal of MarineRe<strong>sea</strong>rch, 32(2), 155-181.Noye, B.J., 1974c. Tide-well systems III: improved interpretati<strong>on</strong>of tide-well records. Journal of Marine Re<strong>sea</strong>rch,32(2), 193-194.Secti<strong>on</strong> 3.3.1Pugh, D.T., 1972. The physics of pneumatic tide gauges.Internati<strong>on</strong>al Hydrographic Review, 49(2), 71–97.Pugh, D.T., 1978. Techniques for the <strong>measurement</strong>of <strong>sea</strong> <strong>level</strong> around atolls. In: D.R. Stoddart <strong>and</strong>R.E. Johannes (eds.) Coral reefs: re<strong>sea</strong>rch methods,M<strong>on</strong>ograph <strong>on</strong> Oceanographic Methodology.UNESCO, Paris, pp.93–108.Secti<strong>on</strong> 3.3.4IOC, 1994. <str<strong>on</strong>g>Manual</str<strong>on</strong>g> <strong>on</strong> Sea <strong>level</strong> Measurement <strong>and</strong>Interpretati<strong>on</strong>. Volume 2 - Emerging Technologies.Intergovernmental Oceanographic Commissi<strong>on</strong><str<strong>on</strong>g>Manual</str<strong>on</strong>g>s <strong>and</strong> Guides No. 14. IOC, Paris, 72pp.Spencer, R., Foden, P.R., McGarry, C., Harris<strong>on</strong>, A.J., Vassie,J.M., Baker, T.F., Smiths<strong>on</strong>, M.J., Harangozo, S.A. <strong>and</strong>Woodworth, P.L., 1993. The ACCLAIM program inthe South Atlantic <strong>and</strong> Southern oceans. Internati<strong>on</strong>alHydrographic Review, 70, 7-21.Woodworth, P.L., Vassie, J.M., Spencer, R. <strong>and</strong> Smith, D.E.,1996. Precise datum c<strong>on</strong>trol for pressure tide gauges.Marine Geodesy, 19, 1-20.Secti<strong>on</strong> 3.3.5Lenn<strong>on</strong>, G.W., 1971. Sea <strong>level</strong> instrumentati<strong>on</strong>, its limitati<strong>on</strong>s<strong>and</strong> the optimisati<strong>on</strong> of the performance ofc<strong>on</strong>venti<strong>on</strong>al gauges in Great Britain. Internati<strong>on</strong>alHydrographic Review, 48(2), 129-147.Secti<strong>on</strong> 3.3.6Spencer, R. <strong>and</strong> Vassie, J.M., 1997. The evoluti<strong>on</strong> of deepocean pressure <strong>measurement</strong>s in the U.K. Progress inOceanography, 40, 423-435.IOC <str<strong>on</strong>g>Manual</str<strong>on</strong>g>s <strong>and</strong> Guides No 14 vol IV49
Sea Level Measurement <strong>and</strong> Interpretati<strong>on</strong>Secti<strong>on</strong> 3.4.1Gill, S.K., Mero, T.N. <strong>and</strong> Parker, B.B., 1993. NOAAOperati<strong>on</strong>al Experience with Acoustic Sea LevelMeasurement. pp. 13-25 in IOC (1994) ibid.Joseph, A., Peshwe, V.B., Vijaykumar <strong>and</strong> Desa E. 1997.Effects of water trapping <strong>and</strong> temperature gradient ina NGWLMS gauge deployed in Zuari estuary, Goa. pp.73-82 in Proceedings of the Symposium <strong>on</strong> OceanElectr<strong>on</strong>ics SYMPOL-”97 (ed. P.R.S. Pillai), CochinUniversity of Science <strong>and</strong> Technology, India.Lenn<strong>on</strong>, G.W., Woodl<strong>and</strong>, M.J. <strong>and</strong> Suskin, A.A., 1993.Acoustic Sea Level Measurements in Australia. pp.26-39 in IOC (1994) ibid.Shih, H.H. <strong>and</strong> Baer, L., 1991. Some errors in tide<strong>measurement</strong> caused by dynamic envir<strong>on</strong>ment. pp.641-671 in Tidal Hydrodynamics (ed. B. Parker), JohnWiley & S<strong>on</strong>s, 883pp.Vassie, J.M., Woodworth, P.L., Smith, D.E. <strong>and</strong> Spencer,R., 1993. Comparis<strong>on</strong> of NGWLMS, Bubbler <strong>and</strong> FloatGauges at Holyhead. pp. 40-51 of IOC (1994) ibid.Secti<strong>on</strong> 3.4.2Alvarez Fanjul, E., Pérez, B., <strong>and</strong> Rodríguez, I., 2001.Nivmar: a storm surge forecasting system for SpanishWaters. Scientia Marina, 65, 145-154.IOC, 2003. Workshop <strong>on</strong> new technical developmentsin <strong>sea</strong> <strong>and</strong> l<strong>and</strong> <strong>level</strong> observing systems.Intergovernmental Oceanographic Commissi<strong>on</strong>.Workshop Report No. 193. Paris, France 14-16October 2003.Pérez, B. <strong>and</strong> Rodriguez, I., 1994. Redmar. SpanishHarbours tide gauge network. Processing of tidaldata. Clima Maritimo Report 57.Secti<strong>on</strong> 3.5IOC, 2003. Workshop <strong>on</strong> new technical developmentsin <strong>sea</strong> <strong>and</strong> l<strong>and</strong> <strong>level</strong> observing systems.Intergovernmental Oceanographic Commissi<strong>on</strong>.Workshop Report No. 193. Paris, France 14-16October 2003.Martín, B., Pérez, B., Alvarez-Fanjul, E., 2005. The ESEAS-RI Sea Level Test Stati<strong>on</strong>: Reliability <strong>and</strong> Accuracy ofDifferent Tide Gauges. Internati<strong>on</strong>al HydrographicReview, Vol.6 No. 1. 44-53.Woodworth, P.L. <strong>and</strong> Smith, D.E., 2003. A <strong>on</strong>e-yearcomparis<strong>on</strong> of radar <strong>and</strong> bubbler tide gauges atLiverpool. Internati<strong>on</strong>al Hydrographic Review, 4(3),42-49.Secti<strong>on</strong> 4Emery, K.O. <strong>and</strong> Aubrey, D.G., 1991. Sea <strong>level</strong>s, L<strong>and</strong><strong>level</strong>s <strong>and</strong> Tide Gauges. New York: Springer Verlag,237pp.Secti<strong>on</strong> 4.4.1Bevis, M., Scherer, W. <strong>and</strong> Merrifield, M., 2002. Technicalissues <strong>and</strong> recommendati<strong>on</strong>s related to the installati<strong>on</strong>of c<strong>on</strong>tinuous GPS stati<strong>on</strong>s at tide gauges.Marine Geodesy, 25, 87-99.Carter, W.E., (ed.) 1994. Report of the Surrey Workshop ofthe IAPSO Tide Gauge Benchmark Fixing Committee.Report of a meeting held 13-15 December 1993at the Institute of Oceanographic Sciences Deac<strong>on</strong>Laboratory. NOAA Technical Report NOSOESOOO6,8lpp.Carter, W.E., Aubrey, D.G., Baker, T.F., Boucher, C., Provost,C. Le, Pugh, D.T., Peltier, W.R., Zumberge, M., Rapp,R.H., Schutz, R.E., Emery, K.O. <strong>and</strong> Enfeld, D.B., 1989.Geodetic Fixing of Tide Gauge Benchmarks. WoodsHole Oceanographic Instituti<strong>on</strong> Technical Report,WHOI-89-31, 44pp.Neilan, R., Van Scoy, P.A. <strong>and</strong> Woodworth, P.L., (eds)1998. Proceedings of the Workshop <strong>on</strong> Methods ForM<strong>on</strong>itoring Sea Level: GPS And Tide Gauge BenchmarkM<strong>on</strong>itoring, GPS altimeter calibrati<strong>on</strong> Workshop organizedby the IGS <strong>and</strong> PSMSL, Jet Propulsi<strong>on</strong> Laboratory,17-18 March 1997. 202pp.Secti<strong>on</strong> 4.4.2Bevis, M., Scherer, W. <strong>and</strong> Merrifield, M., 2002. Technicalissues <strong>and</strong> recommendati<strong>on</strong>s related to the installati<strong>on</strong>of c<strong>on</strong>tinuous GPS stati<strong>on</strong>s at tide gauges. MarineGeodesy, 25, 87-99.Ge, M., Gendt, G., Dick, G., Zhang., F. P. <strong>and</strong> Reigber,C., 2005. Impact of GPS satellite antenna offsets<strong>on</strong> scale changes in global network soluti<strong>on</strong>s.Geophysical Re<strong>sea</strong>rch Letters, 32, L06310, doi :10.1029/2004GL022224.Nerem, R.S., vanDam, T.M. <strong>and</strong> Schenewerk, M.S. 1997.A GPS Network for M<strong>on</strong>itoring Absolute Sea Level inThe Chesapeake Bay: BAYONET. pp. 107-115 of Neilanet al. (1998) ibid.Neilan, R., Van Scoy, P.A. <strong>and</strong> Woodworth, P.L., (eds)1998. Proceedings of the Workshop <strong>on</strong> MethodsFor M<strong>on</strong>itoring Sea Level: GPS And Tide GaugeBenchmark M<strong>on</strong>itoring, GPS altimeter calibrati<strong>on</strong>Workshop organized by the IGS <strong>and</strong> PSMSL,Jet Propulsi<strong>on</strong> Laboratory, 17-18 March 1997.202pp.Teferle, F.N., Bingley, R.M., Williams, S. D. P., Baker,T. F. <strong>and</strong> Dods<strong>on</strong> A.H., 2006. Using c<strong>on</strong>tinuousGPS <strong>and</strong> absolute gravity to separate verticall<strong>and</strong> movements <strong>and</strong> changes in <strong>sea</strong> <strong>level</strong> at tidegauges in the UK. Philosophical Transacti<strong>on</strong>s ofthe Royal Society, L<strong>on</strong>d<strong>on</strong>. 364, doi: 10.1098/rsta.2006.1746.Secti<strong>on</strong> 4.4.3Cazenave, A., Soudarin, L., Cretaux, J-F. <strong>and</strong> Le Provost, C.1999. Sea <strong>level</strong> changes from TopexPoseid<strong>on</strong> altimetry<strong>and</strong> tide gauges, <strong>and</strong> vertical crustal moti<strong>on</strong>s fromDORIS. Geophysical Re<strong>sea</strong>rch Letters, 26, 2077-2080.Secti<strong>on</strong> 4.4.4Niebauer, T.M., Sasagawa, G.S. Faller, J.E., Hilt, R. <strong>and</strong>Klopping, F., 1995. A New Generati<strong>on</strong> of AbsoluteGravimeters. Metrologia, 32 (3), 159-180.50IOC <str<strong>on</strong>g>Manual</str<strong>on</strong>g>s <strong>and</strong> Guides No 14 vol IV
Sea Level Measurement <strong>and</strong> Interpretati<strong>on</strong>Open University, 1989. Waves, Tides <strong>and</strong> Shallow-WaterProcesses. Open University Oceanography Series Vol.4.Oxford: Pergam<strong>on</strong> Press in associati<strong>on</strong> with the OpenUniversity, 187pp.Sasagawa, G., Klopping, F.J., Niebauer, T.M., Faller, J.E.<strong>and</strong> Hilt, R., 1995. Intracomparis<strong>on</strong> Tests of the FG5Absolute Gravity Meters. Geophysical Re<strong>sea</strong>rch Letters,22, 461-464.Soudarin, L., Cretaux, J-F. <strong>and</strong> Cazenave, A., 1999. VerticalCrustal Moti<strong>on</strong>s from the DORIS Space Geodesy System.Geophysical Re<strong>sea</strong>rch Letters, 26, 1207-1210.Teferle, F.N., Bingley, R.M., Williams, S. D. P., Baker, T. F.<strong>and</strong> Dods<strong>on</strong> A.H., 2006. Using c<strong>on</strong>tinuous GPS <strong>and</strong>absolute gravity to separate vertical l<strong>and</strong> movements<strong>and</strong> changes in <strong>sea</strong> <strong>level</strong> at tide gauges in the UK.Philosophical Transacti<strong>on</strong>s of the Royal Society, L<strong>on</strong>d<strong>on</strong>.364, doi: 10.1098/rsta.2006.1746.Secti<strong>on</strong> 8.1Hein, G. W., L<strong>and</strong>au, H. <strong>and</strong> Blomenhofer, H., 2000.Determinati<strong>on</strong> of instantaneous <strong>sea</strong> surface, waveheights, <strong>and</strong> ocean currents using satellite observati<strong>on</strong>sof the Global Positi<strong>on</strong>ing System. Marine Geodesy, 14,217-224.Kato, T., Terada, Y., Ito, K., Hattori, R., Abe, T., Miyake, T.,Koshimura, S. <strong>and</strong> Nagai, T., 2005. Tsunami due to the5 September 2004 off the Kii peninsula earthquake,Japan, recorded by a new GPS buoy. Earth PlanetsSpace, 57, 297–301.Schöne, T., Braun, A. <strong>and</strong> Reigber, C., 2001. Altimetrieund meeresspiegel - möglichkeiten und grenzen derBeobachtung, Zürich. GAIA 10, 3, 226-229.SSG2.194., 2003. Final Report of the SSG2.194 GPS WaterLevel Measurements Project. http://www.gfz-potsdam.de/pb1/op/altimetry/SSG_buoys/index.html.Wats<strong>on</strong>, C., White, N., Coleman, R., Church, J., Morgan,P. <strong>and</strong> Govind, R., 2004. TOPEX/Poseid<strong>on</strong> <strong>and</strong> Jas<strong>on</strong>-1:absolute calibrati<strong>on</strong> in Bass Strait, Australia. MarineGeodesy, 27(1-2), 107-132.Secti<strong>on</strong> 8.2Anders<strong>on</strong>, K.D., 2000. Determinati<strong>on</strong> of water <strong>level</strong> <strong>and</strong>tides using interferometric observati<strong>on</strong>s of GPS signals.Journal of Atmospheric <strong>and</strong> Oceanic Technology, 17(8),1118-1127, doi :10.1175/1520-0426.Beyerle, G., Hocke, K., Wickert, J., Schmidt, T. <strong>and</strong>Reigber, C., 2002. GPS radio occultati<strong>on</strong>s withCHAMP: A radioholographic analysis of GPS signalpropagati<strong>on</strong> in the troposphere <strong>and</strong> surface reflecti<strong>on</strong>s.Journal of Geophysical Re<strong>sea</strong>rch, 107(D24), 4802, doi:10.1029/2001JD001402.Cardellach, E., Ruffini, G., Pino, D., Rius, A., Komjathy,A. <strong>and</strong> Garris<strong>on</strong>, J.L., 2003. Mediterranean Ball<strong>on</strong>Experiment: Ocean wind speed sensing from thestratosphere using GPS reflecti<strong>on</strong>s. Remote Sensing ofthe Envir<strong>on</strong>ment, 88(3), 351-362, doi :10.1016/S0034-4257(03)00176-7.Garris<strong>on</strong>, J.L. <strong>and</strong> Katzberg, S.J., 2000. The applicati<strong>on</strong> ofreflected GPS signals to ocean remote sensing. RemoteSensing of the Envir<strong>on</strong>ment, 73, 175-187.Germain, O., Ruffini, G., Soulat, F., Caparrini, M., Chapr<strong>on</strong>,B. <strong>and</strong> Silvestrin, P., 2004. The Eddy Experiment: GNSS-R speculometry for directi<strong>on</strong>al <strong>sea</strong>-roughness retrievalfrom low altitude aircraft. Geophysical Re<strong>sea</strong>rch Letters,L21307, doi : 10.1029/2004 GL020991.Hajj, G.A. <strong>and</strong> Zuffada, C., 2003. Theoretical descripti<strong>on</strong>of a bistatic system for ocean altimetry usingthe GPS signal. Radio Science, 38(5), doi :10.1029/2002RS002,787.Hajj, G.A. et al. 2004. CHAMP <strong>and</strong> SAC-C atmosphericoccultati<strong>on</strong> results <strong>and</strong> intercomparis<strong>on</strong>s. Journal ofGeophysical Re<strong>sea</strong>rch, 109, D06109, doi:10.1029/2003JD003909.Katzberg, S.J., Walker, R.A., Roles, J.R., Lynch, T. <strong>and</strong> Black,P.G. 2001. First GPS signals reflected from the interiorof a tropical storm: preliminary results from hurricaneMichael. Geophysical Re<strong>sea</strong>rch Letters, 28(10), 1981-1984.Lowe, S.T., LaBrecque, J.L., Zuffada, C., Romans, L.J.,Young, L.E. <strong>and</strong> Hajj, G.A., 2002. First spaceborneobservati<strong>on</strong> of an Earth-reflected GPS signal. RadioScience, 37(1), doi : 10.1029/2000RS002539.Martín-Neira, M., 1993. A passive reflectometry <strong>and</strong>interferometry system {PARIS): Applicati<strong>on</strong> to oceanaltimetry. ESA Journal, 17, 331-355.Martín-Neira, M., Colmenarejo, P., Ruffini, G. <strong>and</strong> Serra,C., 2002. Altimetry precisi<strong>on</strong> of 1 cm over a p<strong>on</strong>d usingthe wide-lane carrier phase of GPS reflected signals.Canadian Journal of Remote Sensing, 28(3), 394-403.Pavelyev, A.G., Volkov, A.V., Zakharov, A.I., Krutikh, S.A.<strong>and</strong> Kucherjavenkov, A.I., 1996. Bistatic radar as atool for Earth investigati<strong>on</strong> using small satellites. ActaAstr<strong>on</strong>autica, 39(9-12), 721-730.Rius, A., Aparicio, J.M., Cardellach, E., Martín-Neira, M.<strong>and</strong> Chapr<strong>on</strong>, B., 2002. Sea surface state <strong>measurement</strong>using GPS reflected signals. Geophysical Re<strong>sea</strong>rchLetters, 29(23), doi :10.1029/ 2002GL015,524.Ruffini, G., Soulat, F., Caparrini, M., Germain, O. <strong>and</strong>Martín-Neira, M., 2004. The Eddy Experiment: AccurateGNSS-R ocean altimetry from low altitude aircraft.Geophysical Re<strong>sea</strong>rch Letters, L12306, doi :10.1029/2004GL019994.Treuhaft, R.N., Lowe, S.T., Zuffada, C. <strong>and</strong> Chao, Y., 2001.2-cm GPS altimetry over Crater Lake. GeophysicalRe<strong>sea</strong>rch Letters, 22(23), 4343-4346.IOC <str<strong>on</strong>g>Manual</str<strong>on</strong>g>s <strong>and</strong> Guides No 14 vol IV51
Sea Level Measurement <strong>and</strong> Interpretati<strong>on</strong>APPENDIX I.GLOSS Requirements for Tide Gauges(update from the third editi<strong>on</strong> of the manual)The aim of any tide gauge recording should be to operatea gauge which is accurate to better than 1 cm atall times; i.e. in all c<strong>on</strong>diti<strong>on</strong>s of tide, waves, currents,weather etc. This requires dedicated attenti<strong>on</strong> to gaugemaintenance <strong>and</strong> data quality c<strong>on</strong>trol. In brief, the majorrequirements for GLOSS stati<strong>on</strong>s are (IOC, 1997):• A sampling of <strong>sea</strong> <strong>level</strong>, averaged over a period l<strong>on</strong>genough to avoid aliasing from waves, at intervals oftypically 6 or 15 minutes, or even 1 minute or less ifthe instrument is to be used also for tsunami warning(IOC 1997 states: ‘but in all circumstances theminimum sampling interval should be <strong>on</strong>e hour’,which these days is an insufficient sampling formost agencies);• Gauge timing be compatible with <strong>level</strong> accuracy,which means a timing accuracy better than <strong>on</strong>eminute (<strong>and</strong> in practice, to sec<strong>on</strong>ds or better, withelectr<strong>on</strong>ic gauges);• Measurements must be made relative to a fixed <strong>and</strong>permanent local tide gauge bench mark (TGBM).This should be c<strong>on</strong>nected to a number of auxiliarymarks to guard against its movement or destructi<strong>on</strong>.C<strong>on</strong>necti<strong>on</strong>s between the TGBM <strong>and</strong> thegauge zero should be made to an accuracy of a fewmillimetres at regular intervals (e.g. annually);• GLOSS gauges to be used for studies of l<strong>on</strong>g termtrends, ocean circulati<strong>on</strong> <strong>and</strong> altimeter calibrati<strong>on</strong>need to be equipped with GPS receivers (<strong>and</strong>m<strong>on</strong>itored possible by other geodetic techniques)located as close to the gauge as possible;• The readings of individual <strong>sea</strong> <strong>level</strong>s should bemade with a target accuracy of 10 mm;• Gauge sites should, if possible, be equipped forrecording tsunami signals, implying that the site beequipped with a pressure sensor capable of 15-sec<strong>on</strong>dsor 1-minute sampling frequency, <strong>and</strong> possiblyfor recording wave c<strong>on</strong>diti<strong>on</strong>s, implying 1-sec<strong>on</strong>dsampling frequency;• Gauge sites should be also equipped for automaticdata transmissi<strong>on</strong> to data centres by means of satellite,Internet etc., in additi<strong>on</strong> to recording datalocally <strong>on</strong> site;• Sea <strong>level</strong> <strong>measurement</strong>s should be accompanied byobservati<strong>on</strong>s of atmospheric pressure, <strong>and</strong> if possiblewinds <strong>and</strong> other envir<strong>on</strong>mental parameters,which are of direct relevance to the <strong>sea</strong> <strong>level</strong> dataanalysis.Regular (e.g. daily) inspecti<strong>on</strong> of data will informoperators when a gauge is malfuncti<strong>on</strong>ing, <strong>and</strong>lead to overall better l<strong>on</strong>g-term data sets. Datafrom gauges in polar or other remote locati<strong>on</strong>s willinevitably be inspected less frequently, unless satellitedata transmissi<strong>on</strong> can be installed. Similarly, datafrom the relatively few gauges recording <strong>on</strong>ly <strong>on</strong>paper charts will be slow to reach centres for qualityc<strong>on</strong>trol; these must be c<strong>on</strong>sidered priorities forupgrading to meet modern st<strong>and</strong>ards.Operators of gauges must always be aware of possiblesystematic jumps in <strong>sea</strong> <strong>level</strong> time-series when<strong>on</strong>e form of recording is replaced by a ‘better’<strong>on</strong>e. All gauges have systematic errors, but thoseerrors will be irrelevant for time-series work if thesame technique is used throughout. New-technologygauges are, by definiti<strong>on</strong>, less well understoodthan old <strong>on</strong>es, <strong>and</strong> they must always be operatedal<strong>on</strong>gside the older <strong>on</strong>es until sufficient experiencehas been acquired.52IOC <str<strong>on</strong>g>Manual</str<strong>on</strong>g>s <strong>and</strong> Guides No 14 vol IV
Sea Level Measurement <strong>and</strong> Interpretati<strong>on</strong>APPENDIX II.Previous volumes of the IOC <str<strong>on</strong>g>Manual</str<strong>on</strong>g><strong>on</strong> Sea Level Measurement <strong>and</strong> Interpretati<strong>on</strong>Any reader of the present Volume of the IOC <str<strong>on</strong>g>Manual</str<strong>on</strong>g> would do well to also read Volumes 1, 2 <strong>and</strong> 3. They werepublished some years ago (in 1985, 1994 <strong>and</strong> 2000, respectively), but do c<strong>on</strong>tain secti<strong>on</strong>s that are still of interest.The c<strong>on</strong>tents of Volume 3 are shown below. Copies of the three earlier volumes can be downloaded from www.pol.ac.uk/psmsl/manualsTable of C<strong>on</strong>tents of <str<strong>on</strong>g>Manual</str<strong>on</strong>g> <strong>on</strong> Sea Level Measurement <strong>and</strong> Interpretati<strong>on</strong>, v. III: Reappraisals <strong>and</strong> recommendati<strong>on</strong>sas of the year 2000, IOC. <str<strong>on</strong>g>Manual</str<strong>on</strong>g>s <strong>and</strong> guides; 141. Introducti<strong>on</strong>1.1 Historical Background1.2 Tide Gauges1.3 GLOSS Requirements1.4 Layout of Volume 32. Tide Gauge Technologies2.1 Acoustic Tide Gauges2.1.1 Acoustic Gauges with Sounding Tubes2.1.1.1 The NOAA NGWLMS System2.1.1.2 The Australian SEAFRAME System2.1.1.3 Other Users of Acoustic Sounding Tube Gauges <strong>and</strong> Calibrati<strong>on</strong> Comments2.1.1.4 Similar Hardware Available2.1.2 Acoustic Gauges in the Open Air2.1.2.1 Experience in Spain2.1.2.2 Experience in South Africa2.2 Pressure Sensor Tide Gauges2.2.1 Single Transducer Systems2.2.1.1 The Datum of a Single Transducer Pressure System2.2.2 Multiple Pressure Transducer Systems (‘B’ Gauges)2.2.3 Pressure Transducers in Stilling Wells2.2.4 Bubbler Pressure Gauges2.2.5 Bottom Mounted Pressure Gauges2.3 Float Gauges in Stilling Wells2.4 Radar Tide Gauges <strong>and</strong> Other New Technologies2.5 General Principles of Choice of a Tide Gauge Site2.6 Comments <strong>on</strong> Desirable Recording Frequency2.7 Synthesis of the Merits of Different Technologies <strong>and</strong> Recommendati<strong>on</strong>s3. Data Transmissi<strong>on</strong> Methods3.1 Introducti<strong>on</strong>3.2 Satellite <strong>and</strong> Global Mobile Ph<strong>on</strong>e Data Links3.3 Packages Available within GLOSSIOC <str<strong>on</strong>g>Manual</str<strong>on</strong>g>s <strong>and</strong> Guides No 14 vol IV53
Sea Level Measurement <strong>and</strong> Interpretati<strong>on</strong>4. Datums <strong>and</strong> Datum C<strong>on</strong>necti<strong>on</strong>s at Tide Gauges4.1 Some Definiti<strong>on</strong>s (extended from Volume 1)4.2 Levelling between Local Bench Marks4.3 Levelling Between Wider Area Marks4.4 Geodetic Fixing of Tide Gauge Benchmarks4.4.1 Introducti<strong>on</strong>4.4.2 Geocentric Coordinates of Tide Gauge Benchmarks4.4.3 GPS Measurements4.4.4 DORIS Measurements4.4.5 Absolute Gravity Measurements4.5 Geodetic C<strong>on</strong>tact Points5. Data Documentati<strong>on</strong> <strong>and</strong> Processing5.1 Documentati<strong>on</strong> <strong>and</strong> Archiving5.2 PC-Based Software5.2.1 Comments <strong>on</strong> Tidal Predicti<strong>on</strong>s5.2.2 Tidal Filters for ‘Mean Sea Level’5.2.3 Comments <strong>on</strong> Computati<strong>on</strong>s of Extremes6. Data Exchange Procedures6.1 Background6.2 C<strong>on</strong>sequent Data Exchange Acti<strong>on</strong>s6.3 Fast Delivery Data6.4 Regi<strong>on</strong>al Programmes7. Training Materials, Training Courses <strong>and</strong> More Informati<strong>on</strong>7.1 Training Materials7.2 Sea Level Training Courses7.3 Further Informati<strong>on</strong>8. ReferencesAcknowledgementAnnex 1. GLOSS Requirements for Gauges54IOC <str<strong>on</strong>g>Manual</str<strong>on</strong>g>s <strong>and</strong> Guides No 14 vol IV
Sea Level Measurement <strong>and</strong> Interpretati<strong>on</strong>APPENDIX III.List of Websiteshttp://www.pol.ac.uk/psmsl/http://www.pol.ac.uk/psmsl/training/analysis.htmlhttp://www.stevenswater.comhttp://www.ix<strong>sea</strong>.com (for MORS, formerly www.oceano.co.uk)http://www.srduk.comhttp://www.GeneralAcoustics.com/products/index_loga<strong>level</strong>.htmlhttp://www.ott-hydrometry.dehttp://www.krohne.comhttp://www.vegac<strong>on</strong>trols.co.ukhttp://www.miros.nohttp://www.seba.dehttp://ids.cls.fr/html/report/publicati<strong>on</strong>s.htmlhttp://www.microgsoluti<strong>on</strong>s.comhttp://www.pol.ac.uk/psmsl/training/<strong>level</strong>ling.dochttp://adsc.gfz-potsdam.de/tiga/index_TIGA.htmlhttp://www.soest.hawaii.edu/UHSLC/http://www.bodc.ac.ukhttp://www.puertos.esIOC <str<strong>on</strong>g>Manual</str<strong>on</strong>g>s <strong>and</strong> Guides No 14 vol IV55
Sea Level Measurement <strong>and</strong> Interpretati<strong>on</strong>APPENDIX IV.List of Acr<strong>on</strong>ymsACCLAIMARGOAntarctic Circumpolar Currents Levels <strong>and</strong> Isl<strong>and</strong>MeasurementGlobal Array of Profiling FloatsGODAEGOESGlobal Ocean Data Assimilati<strong>on</strong> ExperimentGeostati<strong>on</strong>ary Operati<strong>on</strong>al Envir<strong>on</strong>mental SatelliteSystemARGOSBGANBODCCDDFCGPS@TGC-GOOSAutomatic Remote Geomagnetic ObservatorySystemBroadb<strong>and</strong> Global Area NetworkBritish Oceanographic Data CentreCentral Data Distributi<strong>on</strong> FacilityC<strong>on</strong>tinuous GPS at Tide GaugesGlobal Ocean Observing System – Coastal ModuleGOOSGPSGRGSGTSGTOSIALAGlobal Ocean Observing SystemGlobal Positi<strong>on</strong>ing SystemGroupe de Recherches de Geodesie Spatiale (France)Global Telecommunicati<strong>on</strong>s SystemGlobal Terrestrial Observing SystemInternati<strong>on</strong>al Associati<strong>on</strong> of Marine Aids toNavigati<strong>on</strong> <strong>and</strong> Lighthouse AuthoritiesCIESMInternati<strong>on</strong>al Commissi<strong>on</strong> for the ScientificExplorati<strong>on</strong> of the Mediterranean SeaIAPSOInternati<strong>on</strong>al Associati<strong>on</strong> for the Physical Sciences ofthe OceanCLIVARClimate Variability <strong>and</strong> PredictabilityICSUInternati<strong>on</strong>al Council for ScienceCLSCollecte Localisati<strong>on</strong> SatellitesIERSInternati<strong>on</strong>al Earth Rotati<strong>on</strong> ServiceCMSLTCommissi<strong>on</strong> <strong>on</strong> MSL <strong>and</strong> Tides of IAPSOIGOSSIntegrated Global Ocean Services SystemCNESCPCPACCCentre Nati<strong>on</strong>al d’Etudes Spatiales (France)C<strong>on</strong>tact PointCaribbean Planning for Adaptati<strong>on</strong> to ClimateChangeIGSIHOINMARSATInternati<strong>on</strong>al GNSS Service (formerly the Internati<strong>on</strong>alGPS Service)Internati<strong>on</strong>al Hydrographic Organizati<strong>on</strong>Internati<strong>on</strong>al Maritime Satellite Organisati<strong>on</strong>COOPDATARINGCoastal Ocean Observati<strong>on</strong>s PanelData Acquisiti<strong>on</strong> for Tidal Applicati<strong>on</strong>s for theRemote Interrogati<strong>on</strong> of Network GaugesIOCIPCCIntergovernmental Oceanographic Commissi<strong>on</strong> (ofUNESCO)Intergovernmental Panel <strong>on</strong> Climate ChangeDCPData Collecti<strong>on</strong> PlatformISLP-PacIGOSS Sea Level Programme in the PacificDORISENSODoppler Orbitography by Radiopositi<strong>on</strong>ing Integrated<strong>on</strong> SatelliteEl Niño Southern Oscillati<strong>on</strong>JASLJCOMMJoint Archive for Sea Level (of UHSLC)WMO-IOC Joint Technical Commissi<strong>on</strong> <strong>on</strong>Oceanography <strong>and</strong> Marine MeteorologyENVISATEnvir<strong>on</strong>mental SatelliteLATLowest Astr<strong>on</strong>omical TideESEASEuropean Sea Level ServiceLTTL<strong>on</strong>g-Term TrendsEUEuropean Uni<strong>on</strong>MEDALPEXMediterranean Sea During Alpine ExperimentEUMETSATEuropean Organisati<strong>on</strong> for the Exploitati<strong>on</strong> ofMeteorological SatellitesMEDGLOSSMediterranean Programme for the Global Sea-LevelObserving System (of IOC <strong>and</strong> CIESM)FAGSFederati<strong>on</strong> of Astr<strong>on</strong>omical <strong>and</strong> Geophysical ServicesMETEOSATGeostati<strong>on</strong>ary Meteorological SatelliteFIAMSGCNGCOSGEFlinders Institute for Atmospheric <strong>and</strong> MarineSciencesGLOSS Core NetworkGlobal Climate Observing SystemGroup of Experts (of GLOSS)MSLMTLNERCNESDISMean Sea LevelMean Tide LevelNatural Envir<strong>on</strong>ment Re<strong>sea</strong>rch CouncilNati<strong>on</strong>al Envir<strong>on</strong>mental Satellite <strong>and</strong> Data Informati<strong>on</strong>ServiceGFZGeo Forschungs Zentrum, Potsdam, GermanyNGWLMSNext Generati<strong>on</strong> Water Level Measurement SystemGIAGLOSSGMSGNSSGlacial Isostatic AdjustmentGlobal Sea Level Observing SystemGeostati<strong>on</strong>ary Meteorology SatelliteGlobal Navigati<strong>on</strong> Satellite SystemNOAANOSNTCNati<strong>on</strong>al Oceanic <strong>and</strong> Atmospheric Administrati<strong>on</strong>(USA)Nati<strong>on</strong>al Ocean Service (of NOAA)Nati<strong>on</strong>al Tidal Centre of the Bureau of Meteorology(Australia)56IOC <str<strong>on</strong>g>Manual</str<strong>on</strong>g>s <strong>and</strong> Guides No 14 vol IV
Sea Level Measurement <strong>and</strong> Interpretati<strong>on</strong>OOPCOcean Observati<strong>on</strong>s Panel for ClimateSRDS<strong>on</strong>ar Re<strong>sea</strong>rch <strong>and</strong> DevelopmentPERSGAPOLPSMSLPSTNPTTRegi<strong>on</strong>al Organizati<strong>on</strong> for the C<strong>on</strong>servati<strong>on</strong> of theEnvir<strong>on</strong>ment of the Red Sea &Gulf of AdenProudman Oceanography Laboratory (UK)Permanent Service for Mean Sea LevelPublic Switched Teleph<strong>on</strong>e NetworkPlatform Transmitter TerminalSTWSTASKTGBMTGITIGAStorm Tide Warning Service (UK)Tidal Analysis Software KitTide Gauge Bench MarkTide Gauge InspectorateTide Gauge <strong>and</strong> GPS Benchmark M<strong>on</strong>itoring Project(of IGS)PTWCPacific Tsunami Warning CentreTOGATropical Ocean Global AtmosphereRBGANRegi<strong>on</strong>al Broadb<strong>and</strong> Global Area NetworkTOPEXJoint US/French Ocean Topography ExperimentRLRRevised Local ReferenceUHSLCUniversity of Hawaii Sea Level CenterRONMACRTURed de Observaci<strong>on</strong> del Nivel del Mar para AmericaCentralRemote Terminal UnitUNEPUNESCOUnited Nati<strong>on</strong>s Envir<strong>on</strong>ment ProgrammeUnited Nati<strong>on</strong>s Educati<strong>on</strong>al, Scientific <strong>and</strong> CulturalOrganizati<strong>on</strong>SEAFRAMESLCSLRSOCSea Level Fine Resoluti<strong>on</strong> Acoustic MeasuringEquipmentSea Level CentreSatellite Laser RangingSouthampt<strong>on</strong> Oceanographic CentreVLBIVLMWMOWOCEVery L<strong>on</strong>g Baseline InterferometryVertical L<strong>and</strong> MovementWorld Meteorological Organizati<strong>on</strong>World Ocean Circulati<strong>on</strong> ExperimentIOC <str<strong>on</strong>g>Manual</str<strong>on</strong>g>s <strong>and</strong> Guides No 14 vol IV57
Sea Level Measurement <strong>and</strong> Interpretati<strong>on</strong>APPENDIX V.C<strong>on</strong>tributed Practical Experiences with VariousTide Gauge TechnologiesThis appendix c<strong>on</strong>tains c<strong>on</strong>tributi<strong>on</strong>s kindly provided by thefollowing people:Daniel Hareide, Hodnesdal, Tor Tørresen <strong>and</strong> Tor EllefHansen Østebøvik (Norwegian Hydrographic Service)B. Martín, B. Pérez, E. Alvarez Fanjul (Puertos del Estado,Spain)Christoph Blasi <strong>and</strong> Ulrich Barjenbruch (Federal Instituteof Hydrology, Germany)Ruth Farre (South African Navy Hydrographic Office)Ant<strong>on</strong>y Joseph, Prakash Mehra, Joseph Odammetey<strong>and</strong> Nkebi E. Kofi (Nati<strong>on</strong>al Institute of Oceanography, India,<strong>and</strong> Survey of Ghana)Juan Fierro, Chilean Navy Hydrographic <strong>and</strong> OceanographicService (SHOA)Bernie Kil<strong>on</strong>sky (University of Hawaii Sea Level Center,USA)Peter Foden (Proudman Oceanographic Laboratory, UK)Laura K<strong>on</strong>g (Internati<strong>on</strong>al Tsunami Informati<strong>on</strong> Centre,Hawaii, USA)Each of these experts is willing to discuss aspects of theirexperiences in more detail with any<strong>on</strong>e interested.Float Gauges in Stilling Wells: Experience in NorwayDaniel Hareide, Hanne Hodnesdal, Tor Tørresen <strong>and</strong> Tor Ellef Hansen ØstebøvikNorwegian Hydrographic Service, P.O. Box 60, 4001 Stavanger, NORWAYE-mail: daniel.hareide@statkart.noThe float gauge <strong>and</strong> stilling wellThe Norwegian Tide Gauge Network, operated by theNorwegian Hydrographic Service (NHS), records <strong>sea</strong><strong>level</strong> elevati<strong>on</strong>s with float gauges at 23 locati<strong>on</strong>s.c<strong>on</strong>e, <strong>and</strong> unwanted wave oscillati<strong>on</strong>s are not reducedas they are supposed to be. Inside the c<strong>on</strong>e there is aA typical Norwegian stilling well c<strong>on</strong>sists of a polyethylenetube with a c<strong>on</strong>ical inlet at the bottom (Figure1). The diameter of the tube is 30 or 40 cm <strong>and</strong> theinlet (c<strong>on</strong>e) is of copper to reduce marine fouling. Wehave seen that galvanic corrosi<strong>on</strong> can be a problem,probably since we have used parts of stainless steel toclamp the c<strong>on</strong>e to the tube. This can cause holes in theFigure 1. Sea <strong>level</strong> gauge in Norway <strong>and</strong> schematic descripti<strong>on</strong> of stilling well with copper c<strong>on</strong>e <strong>and</strong> br<strong>on</strong>ze plug.58IOC <str<strong>on</strong>g>Manual</str<strong>on</strong>g>s <strong>and</strong> Guides No 14 vol IV
Sea Level Measurement <strong>and</strong> Interpretati<strong>on</strong>removable orifice of br<strong>on</strong>ze <strong>and</strong> the orifice can beadjusted with <strong>on</strong>e or more nipples. Some of the tidalstati<strong>on</strong>s in Norway are exposed to ice <strong>and</strong> low temperatures,<strong>and</strong> 220 V AC heating cables are installed insidethese wells.Each <strong>sea</strong> <strong>level</strong> gauge has at least <strong>on</strong>e <strong>level</strong> switchused for quality c<strong>on</strong>trol. It is installed inside the stillingwell approximately at mean <strong>sea</strong> <strong>level</strong> (MSL). The <strong>level</strong>switch is a tiny float, which switches a current loopwhen the <strong>sea</strong> <strong>level</strong> passes the <strong>level</strong> at which the switchis mounted. The computer registers the time <strong>and</strong> <strong>sea</strong><strong>level</strong> when the switch turns <strong>on</strong> or off, <strong>and</strong> these datacan be compared with the <strong>level</strong> at which the switch ismounted. The <strong>level</strong> switch has been very important inthe detecti<strong>on</strong> of several problems, such as drift (trend)in the observati<strong>on</strong>s.An encoder with an SDI-12 output is installed abovethe tube, mounted <strong>on</strong> a c<strong>on</strong>crete block (Figure 2). Theencoder has a sprocket (wheel) <strong>on</strong> the shaft <strong>and</strong> is programmedto give an output with a resoluti<strong>on</strong> of 0.1cm. The encoder has internal battery backup whichremembers the angular positi<strong>on</strong>, in case of powerfailure. A chain with a float <strong>and</strong> a counterweight runsover the sprocket <strong>and</strong> the <strong>sea</strong> <strong>level</strong> is given by theangular positi<strong>on</strong> of the sprocket. It is important thatthe sprocket <strong>and</strong> chain fit well together. If not, therecould be very small tangential movements betweenthe sprocket <strong>and</strong> chain <strong>and</strong> this in turn presents itselfas very slow drift (trend) in the <strong>sea</strong> <strong>level</strong> observati<strong>on</strong>s.NHS is using a US manufacturer of the chain<strong>and</strong> sprocket (W.M.Berg Inc. (www.wmberg.com)).Leading marks <strong>on</strong> the chain <strong>and</strong> sprocket make it easyto c<strong>on</strong>trol the system.The data logger is a Sutr<strong>on</strong> 8210 <strong>and</strong> it collects <strong>and</strong>stores <strong>sea</strong> <strong>level</strong>, barometric pressure <strong>and</strong> switch-<strong>level</strong>data. The memory of the Sutr<strong>on</strong> 8210 has batterybackup <strong>and</strong> can hold several m<strong>on</strong>ths of data.Normally the data are retrieved twice a day from thedata logger, sometimes more often. The data loggerhas a serial port, which is used for communicati<strong>on</strong>,either through the ISDN-network or with a GPRS-router.We are now in the process of c<strong>on</strong>verting the datatransmissi<strong>on</strong> from the ISDN-network to GPRS-routerfor all the tidal stati<strong>on</strong>s. This work will be completedduring the next 2–3 years (depending <strong>on</strong> allocatedbudget) <strong>and</strong> <strong>sea</strong> <strong>level</strong> data will be sent to the office inStavanger every 10–20 min <strong>and</strong> will be immediately(an automatic quality c<strong>on</strong>trol is applied to the data)available <strong>on</strong> our website.The data logger <strong>and</strong> the communicati<strong>on</strong> unit have separatebattery backups. The data logger has less powerc<strong>on</strong>sumpti<strong>on</strong> than the communicati<strong>on</strong> unit, so, in caseof power failure, the gauge will c<strong>on</strong>tinue to store dataeven if the communicati<strong>on</strong> is broken.ChainC<strong>on</strong>tact PointEncoderFigure 2. Encoder, chain <strong>and</strong> c<strong>on</strong>tact point.Levelling is d<strong>on</strong>e from the TGBM <strong>and</strong> <strong>on</strong>e or twoadditi<strong>on</strong>al benchmarks to a c<strong>on</strong>tact point at thesame bracket as the encoder. The TGBM is in solidrock as close to the <strong>sea</strong> <strong>level</strong> gauge as possible.After modernizati<strong>on</strong> of the gauges between 1985<strong>and</strong> 1991, <strong>level</strong>ling has been d<strong>on</strong>e every year. Sincemost of the gauges are located <strong>on</strong> stable ground,the <strong>level</strong>ling interval now is three years, except for afew gauges which are sinking. The <strong>level</strong>ling followsthe procedures outlined in the UNESCO <str<strong>on</strong>g>Manual</str<strong>on</strong>g> <strong>on</strong>Sea-Level Measurement <strong>and</strong> Interpretati<strong>on</strong>, Volume I,<strong>and</strong> the accuracy is millimetric. It is more difficult tocalibrate the <strong>sea</strong> <strong>level</strong> gauge to the same accuracy.Calibrati<strong>on</strong> is d<strong>on</strong>e by measuring the distance fromthe <strong>sea</strong> surface to the c<strong>on</strong>tact point with a <strong>level</strong>lingstaff inside the well, <strong>and</strong> by taking simultaneouslyreadings <strong>on</strong> the <strong>sea</strong> <strong>level</strong> gauge. This is repeatedseveral times, <strong>and</strong> the <strong>sea</strong> <strong>level</strong> gauge is calibrated bymaking its readings equal to the observati<strong>on</strong>s <strong>on</strong> thestaff. Taking many readings will reduce the problemwith a moving <strong>sea</strong> surface. There might, however, besome individual differences in the way the calibrati<strong>on</strong>is performed <strong>and</strong> this may introduce systematicerrors of a few millimetres. We use a <strong>sea</strong> <strong>level</strong> gaugezero that is below the lowest observed <strong>sea</strong> <strong>level</strong>. Toavoid any c<strong>on</strong>fusi<strong>on</strong>, we never use <strong>level</strong>s like ChartDatum or L<strong>and</strong> Survey Datum as the gauge zero.The <strong>sea</strong> <strong>level</strong> gauges are inspected at intervals of 18m<strong>on</strong>ths. We should like to carry out <strong>level</strong>ling <strong>and</strong>inspecti<strong>on</strong>s more frequently, but we have to reducethe operati<strong>on</strong>al costs as much as possible.For all stati<strong>on</strong>s, a close co-operati<strong>on</strong> with localoperators is essential. They look after the equipment<strong>and</strong> assist us in various situati<strong>on</strong>s, i.e. whenthere are power or communicati<strong>on</strong> problems withthe gauge.IOC <str<strong>on</strong>g>Manual</str<strong>on</strong>g>s <strong>and</strong> Guides No 14 vol IV59
Sea Level Measurement <strong>and</strong> Interpretati<strong>on</strong>Analog dataFloat in stilling well Datalogger: Sutr<strong>on</strong> 8210Stilling wellAnalogLP-filterEncoderA/Dc<strong>on</strong>verterDigital dataData rate1 HzLP-filterArithmeticmean over3 minutesDecimatingto 10minutevaluesISDN orGPRSData rate1/600 HzFigure 3. Schematic descripti<strong>on</strong> of sampling <strong>and</strong> filtering in <strong>sea</strong> <strong>level</strong> gauge.Sampling <strong>and</strong> filtering in the <strong>sea</strong> <strong>level</strong> gaugeThe stilling well represents a mechanical low pass (LP) filter.The attenuati<strong>on</strong> R depends <strong>on</strong> the relati<strong>on</strong>ship betweenthe area of the cross-secti<strong>on</strong> of the well <strong>and</strong> the area ofthe orifice: R = (area of well)/(area of orifice) (Forrester1983). This relati<strong>on</strong>ship also affects the resp<strong>on</strong>se time,which is defined as the time it takes before the <strong>sea</strong> <strong>level</strong><strong>on</strong> the inside has changed to the mid-point of a sudden<strong>and</strong> permanent change <strong>on</strong> the outside. A high value of Rgives high attenuati<strong>on</strong> <strong>and</strong> l<strong>on</strong>g resp<strong>on</strong>se time. It is recommendedby Forrester (1983) to choose R = 100, whichwill pass waves with periods of, for example, 12 h (representativefor tide) <strong>and</strong> periods of 6 min (representative forharbour seiche), but will attenuate waves with a periodof 6 s (representative for surface swell). The –3 dB cutofffrequency will be roughly 1/40 Hz (taken from plot in Shih<strong>and</strong> Rodgers (1981). R = 100 signifies a resp<strong>on</strong>se time of11 s (Forrester 1983). Most of our <strong>sea</strong> <strong>level</strong> gauges have Rclose to 100. A sampling frequency of 1 Hz inside a stillingwell of this type should be satisfactory.In the datalogger a 3-min arithmetic mean is calculatedevery 10 min. Studies at NHS have shown that this filterdoes not remove all frequencies above the Nyquist frequencyfor 10-minute sampling (f Ny = f s /2 = 1/(2x10x60)Hz = 0.0008333… Hz). There is now a test of calculatingthe 1-minute arithmetic mean every minute in the datalogger <strong>and</strong> transmitting 1-minute data to the office. In thiscase the filter is better suited for the sampling rate, <strong>and</strong> weshall get access to a higher data rate as well.Processing of data at the officeThe received dataare stored in a database. Automatic <strong>and</strong> manual qualityc<strong>on</strong>trol are applied to the data.One-hour values are used for the harm<strong>on</strong>ic analysis. Toavoid aliasing, all frequencies above the Nyquist frequency(f Nyq ) should be removed before decimating from 10-minutevalues to 1-hour-values. The Nyquist frequency f Nyq ishalf of the sampling frequency f s = 1/(1 hour).A 4th-order Butterworth filter is used for this purpose(Hodnesdal 1983; see amplitude resp<strong>on</strong>se in Figure 4).The cut off frequency is 1/(3 hours). The time-series isrun forwards <strong>and</strong> backwards through this filter to ensurezero phase resp<strong>on</strong>se. The squared amplitude resp<strong>on</strong>se is–29.4 dB (=0.034 Hz) at f Nyq . This is an acceptable antialiasingfilter because almost all energy above the Nyquistfrequency is removed. The problem is, however, that someof the over-harm<strong>on</strong>ic c<strong>on</strong>stituents will be partly filtered aswell. Frequencies from the fifth-diurnal (period of circa 4.8h) <strong>and</strong> higher will be attenuated by the filter. For stati<strong>on</strong>swith significant shallow water c<strong>on</strong>stituents, a filter with ahigher cut-off <strong>and</strong> faster roll-off should be used.For further informati<strong>on</strong>, go to: http://vannst<strong>and</strong>.statkart.no/Magnitude SquaredFigure 4. Amplitude resp<strong>on</strong>se of 4th-order Butterworthfilter.ReferencesForrester, W.D. 1983. Canadian Tidal <str<strong>on</strong>g>Manual</str<strong>on</strong>g>. Departmentof Fisheries <strong>and</strong> Oceans, Canadian Hydrographic Service,Ottawa. 138pp.Hodnesdal, H. 2003. Use of Butterworth filter for LPfilteringof water <strong>level</strong> data in NHS. Technical Report.Norwegian Hydrographic Service, Stavanger, Norway.Shih, H.H. <strong>and</strong> Rogers, D. 1981. Error analysis for tide<strong>measurement</strong> systems utilizing stilling wells. TechnicalReport. US Department Commerce, Nati<strong>on</strong>al Oceanic<strong>and</strong> Atmospheric Administrati<strong>on</strong> (NOAA), USA.60IOC <str<strong>on</strong>g>Manual</str<strong>on</strong>g>s <strong>and</strong> Guides No 14 vol IV
Sea Level Measurement <strong>and</strong> Interpretati<strong>on</strong>The ESEAS-RI Sea Level Pilot Stati<strong>on</strong> in Vilagarcía de Arousa (Spain)B. Martín, B. Pérez, E. Alvarez FanjulPuertos del Estado, Madrid, Spain, E-mail: bego@puertos.esIntroducti<strong>on</strong>During the ESEAS-RI project (European Sea Level Service –Re<strong>sea</strong>rch Infrastructure), a test stati<strong>on</strong> for <strong>sea</strong> <strong>level</strong> sensorswas established at Vilagarcía de Arousa, <strong>on</strong> the northwestcoast of Spain. One of the objectives was to experimentwith different kinds of radar sensor, an emergingtechnology for measuring <strong>sea</strong> <strong>level</strong>, <strong>and</strong> compare theirperformance with other traditi<strong>on</strong>al <strong>and</strong> well proven tidegauges. The main advantage of radar appeared to be itsdem<strong>and</strong>ed accuracy, low maintenance <strong>and</strong> lack of influenceof air temperature, humidity or density of the water.The experiment was carried out when the existing networkswere requiring renewal, owing to the age of theequipment, <strong>and</strong> radar appeared as an even better opti<strong>on</strong>than acoustic sensors, <strong>and</strong> possible new applicati<strong>on</strong>s of<strong>sea</strong> <strong>level</strong> data had to be taken into account.Experiment <strong>and</strong> descripti<strong>on</strong> of the sensorsThe period of operati<strong>on</strong> of the different tide gauges isshown in Figure 2, <strong>and</strong> varies mainly due to the differentdates of incorporati<strong>on</strong> into the experiment <strong>and</strong> toproblems encountered during the first year, sometimeseven due to lack of experience with the equipment.Most of the equipment installed is very well known <strong>and</strong>described in the literature <strong>and</strong> in previous IOC manuals,such as the pressure (both the single pressure sensor<strong>and</strong> the bubbler sensor from POL) <strong>and</strong> the acousticgauges (both the Aquatrak from NOAA <strong>and</strong> the SRDfrom the REDMAR network). As was menti<strong>on</strong>ed, themain c<strong>on</strong>tributi<strong>on</strong> of the experiment was the testing ofseveral new radar sensors <strong>and</strong> the simultaneous installati<strong>on</strong>of so many tide gauges for the first time.Figure 1. Locati<strong>on</strong> of Vilagarcía de Arousa (left), photo of the test stati<strong>on</strong> (centre) <strong>and</strong> of the REDMAR stati<strong>on</strong> (right,an SRD acoustic sensor <strong>on</strong> another dock).The main modern technologies have been tested inVilagarcía: pressure, acoustic <strong>and</strong> radar, a total ofeight different sensors. Different instituti<strong>on</strong>s <strong>and</strong> privatecompanies provided sensors for the test; the Nati<strong>on</strong>alOceanographic <strong>and</strong> Atmospheric Administrati<strong>on</strong> (NOAA,USA) lent an Aquatrak acoustic sensor, <strong>and</strong> the ProudmanOceanographic Laboratory (POL, UK) lent a bubbler pressuresensor. Apart from this, two FMCW radar sensorswere provided by the companies Miros <strong>and</strong> ENRAF(Radac). The c<strong>on</strong>tributi<strong>on</strong> of Puertos del Estado was theacoustic sensor of the REDMAR network (SRD), <strong>and</strong> twopulse radar stati<strong>on</strong>s: Seba <strong>and</strong> Geónica. Finally, a SeaBirdpressure sensor was also installed during the experimentby the maintenance company SIDMAR Bernhard Pack.Focusing <strong>on</strong> the radar technology, two different typesof radar were installed (sensors were always located ata certain height above the <strong>sea</strong> surface):Pulse radar: operates <strong>on</strong> a similar principle to that ofthe acoustic sensor, by measuring the travel time ofmicrowave pulses between the sensor <strong>and</strong> the watersurface <strong>and</strong> the return echo to the sensor. The mainadvantage over the acoustic gauges is that the velocityof propagati<strong>on</strong> (light velocity, c, in air) of the wave doesnot depend <strong>on</strong> envir<strong>on</strong>mental c<strong>on</strong>diti<strong>on</strong>s, in particular<strong>on</strong> temperature gradients al<strong>on</strong>g the path of the pulse.This makes the installati<strong>on</strong> requirements less strict <strong>and</strong>no protective tube or pre-<strong>measurement</strong> calibrati<strong>on</strong> isneeded. Geónica <strong>and</strong> Seba radars are pulse radars <strong>and</strong>in fact use the same Vegapuls transducer.IOC <str<strong>on</strong>g>Manual</str<strong>on</strong>g>s <strong>and</strong> Guides No 14 vol IV61
Sea Level Measurement <strong>and</strong> Interpretati<strong>on</strong>2003 2004AQUGEOMIRPOLRADSBESEBSRD28/2 29/4 28/6 27/8 26/10 25/12 1/1 1/3 30/4 29/6 28/8Figure 2. Period of operati<strong>on</strong> of the different sensors during the two years of the experiment (the SeaBird [SBE] dataare not included in this report.Frequency-modulated c<strong>on</strong>tinuous-wave (FMCW):this is a more accurate method of measuring distancewith radar, by modulating the frequency of a c<strong>on</strong>tinuouslyemitted wave. A phase shift between the emittedwave <strong>and</strong> the reflected wave occurs, <strong>and</strong> the mixresults in a low-frequency signal (beat frequency) whichprovides a <strong>measurement</strong> of the distance. Miros <strong>and</strong>Radac sensors are FMCW radars.In any case, the installati<strong>on</strong> of these instruments ismuch easier <strong>and</strong> less expensive than the <strong>on</strong>e requiredby the acoustic or the bubbler sensors. On the otherh<strong>and</strong>, radar sensors have the advantage of beinglocated above the <strong>sea</strong> surface, so maintenance is easierthan for pressure sensors.Some of the systems allowed the storage of data everysec<strong>on</strong>d (Aquatrak, Miros <strong>and</strong> Radac), whereas othersstored averaged values: 10-s (POL bubbler), 1-min(Seba <strong>and</strong> Ge<strong>on</strong>ica) or 5-min (SRD). Only the Geónicatide gauge had a GPS-c<strong>on</strong>trolled assignment of time.The stati<strong>on</strong> was routinely maintained by the companySIDMAR every four m<strong>on</strong>ths, as is usually also d<strong>on</strong>efor the permanent REDMAR stati<strong>on</strong>, <strong>and</strong> this was thefrequency of adjustment of clocks for the rest of theinstallati<strong>on</strong>s. Apart from this, <strong>level</strong>ling of the transducer,datum calibrati<strong>on</strong> <strong>and</strong> downloading of data, as wellas draining of the bubbler compressor <strong>and</strong> the checkingof the oil <strong>level</strong> <strong>and</strong> air pressure, were all activitiesperformed during a maintenance campaign.During the experiment, the installati<strong>on</strong>s that operatedbetter <strong>and</strong> yielded a larger amount of data were theGeónica, Miros <strong>and</strong> POL bubbler sensors, as well asthe permanent SRD stati<strong>on</strong>. The percentage of spikesin the data sets was very small, particularly for all theradar sensors which also withstood the storm <strong>sea</strong>s<strong>on</strong>without failing.Five-minute data comparis<strong>on</strong>Comparis<strong>on</strong> of raw data is a difficult task, since,depending <strong>on</strong> the time interval, installati<strong>on</strong> characteristics(within a tube or in the open air) <strong>and</strong> measuringtechnique, each sensor really measures different things.So the first step was to obtain ‘comparable’ time-series,<strong>and</strong> averages over 5-min intervals were computed(also the time interval for the raw data of the SRD tidegauge).During the experiment, differences of up to 6 min werefound, with an impact <strong>on</strong> the mean difference betweentwo sensors of up to 5 cm. To correct for this effect,normally not attributable to the sensor but to the PCwhere data were stored, a correcti<strong>on</strong> of time shifts formultiples of 1 min was made for 3-day data windows.Although not possible during the Vilagarcía experiment,a precise c<strong>on</strong>trol of time assignment, by GPS orInternet (in case of a PC) should be no problem for anytide gauge nowadays. That is why we thought it wouldnot be reas<strong>on</strong>able to c<strong>on</strong>sider problems of time as ashortcoming of the sensor itself.Table 1. RMS (root mean-square error), in centimetres,of the differences between each pair of sensors(data every five -minutes).AQU GEO MIR POL RAD SEB SRDAQU 0.0 1.4 1.9 1.4 1.7 1.6 1.5GEO 1.4 0.0 1.2 1.0 0.9 0.7 1.3MIR 1.9 1.2 0.0 1.6 1.1 1.3 1.8POL 1.4 1.0 1.6 0.0 1.4 1.2 1.4RAD 1.7 0.9 1.1 1.4 0.0 1.0 1.6SEB 1.6 0.7 1.3 1.2 1.0 0.0 1.4SRD 1.5 1.3 1.8 1.4 1.6 1.4 0.062IOC <str<strong>on</strong>g>Manual</str<strong>on</strong>g>s <strong>and</strong> Guides No 14 vol IV
Sea Level Measurement <strong>and</strong> Interpretati<strong>on</strong>For this timing correcti<strong>on</strong>, the reference was of coursethe Geónica <strong>sea</strong> <strong>level</strong> series, as it was the <strong>on</strong>ly <strong>on</strong>e withGPS assignment of time during the experiment. Table1 shows the RMS errors of comparis<strong>on</strong>s for each pairof sensors after adjustment for time. These range from0.7 cm (corresp<strong>on</strong>ding to Geónica <strong>and</strong> Seba, whichis reas<strong>on</strong>able, since they use the same type of radarsensor) <strong>and</strong> 1.9 cm (Aquatrak <strong>and</strong> Miros, mainly dueto an effect of temperature <strong>on</strong> the Aquatrak beinghigher than expected <strong>and</strong> not corrected). These valuesdecreased by about 10% when repeated with the filteredhourly values. Following Woodworth <strong>and</strong> Smith(2003), who state that RMS values below 1.4 cm forthe differences yield a precisi<strong>on</strong> better than 1 cm foreach sensor, most of the tide gauges would meet thisc<strong>on</strong>diti<strong>on</strong> (GLOSS st<strong>and</strong>ard) for 5-min data, <strong>and</strong> all ofthem would do so for hourly data.By computing the slope of the linear regressi<strong>on</strong> for eachpair of sensors, an idea of the sensitivity of the sensorto the tidal range was obtained. The most interestingc<strong>on</strong>clusi<strong>on</strong> in this c<strong>on</strong>text is that the bubbler gauge fromPOL was the <strong>on</strong>e that recorded lower ranges (around0.5%). The explanati<strong>on</strong> for this is that it has operatedassuming a c<strong>on</strong>stant salinity, which may not be realisticfor Vilagarcía harbour, which is located in an estuary(ría). More details of this comparis<strong>on</strong> can be found inthe technical report of the experiment or the publicati<strong>on</strong>included in the reference (Martín et al., 2005).Spectral analysisTo get an idea of the differences am<strong>on</strong>g the time-seriesfor each frequency b<strong>and</strong>, a spectral analysis was madefor <strong>on</strong>e m<strong>on</strong>th of data from all the sensors, as well asfrom the 5-min time-series. Figure 3 illustrates thesedifferences, showing that all the sensors have exactlythe same resp<strong>on</strong>se to tidal frequencies, with differences<strong>on</strong>ly beginning to show up for frequencies corresp<strong>on</strong>dingto 30 <strong>and</strong> 100 min, for which it is very clear thatthe Miros sensor presents more energy. This might beimportant for the study of oscillati<strong>on</strong>s of these periods,such as seiches; so we thought the company shouldinvestigate it, which they did <strong>and</strong> found that it was dueto a problem, now solved, in an internal interpolati<strong>on</strong>algorithm of the sensor.Of course, the larger differences are found for frequencieslarger than 0.05 cycles/minute, <strong>and</strong> this was not asurprise for us, being due to the different measuringtechnique <strong>and</strong> the fact that some of the sensors (acoustic)measure inside a tube <strong>and</strong> others not (radar). Onthe other h<strong>and</strong>, for the computati<strong>on</strong> of the 5-min data,different amounts of raw data were used, depending<strong>on</strong> the sensor. Of course, differences in this range offrequency may still be significant if <strong>on</strong>e needs to detectseiches or tsunamis, since we are talking about periodsof between 10 <strong>and</strong> 20 min. That is why a more detailedstudy of the resp<strong>on</strong>se of the different sensors at higherfrequencies is required.Figure 3. Power spectral density for the 5-min time-series(December 2003–January 2004).Comparis<strong>on</strong> of hourly values <strong>and</strong> daily meansTo complete the study c<strong>on</strong>cerning st<strong>and</strong>ard <strong>sea</strong> <strong>level</strong>applicati<strong>on</strong>s, a harm<strong>on</strong>ic analysis for all the sensorswas carried out, following the st<strong>and</strong>ard procedureemployed by the Puertos del Estado (filtering to hourlyvalues, <strong>and</strong> use of Foreman tidal programme). Table 2shows the results for the main harm<strong>on</strong>ics, which arevery similar (differences similar tothe analytical error).Again, the POL sensor shows the lowest M2 amplitude,c<strong>on</strong>sistent with what was said above.The daily means were computed <strong>and</strong> compared, <strong>and</strong>trends during the period of the experiment werefound to be c<strong>on</strong>sistent for all sensors, in spite of thelimitati<strong>on</strong>s in the operati<strong>on</strong> of the sensors <strong>and</strong> in thecalibrati<strong>on</strong> of the datum, an aspect which was not fullyc<strong>on</strong>sidered at this test site.Table 2. Main tidal c<strong>on</strong>stituents for each of the sensors,for the period December 2003–June 2004.H (cm)Tide AQU GEO MIR POL RAD SEB SRDO1 6.3 6.4 6.3 6.3 6.4 6.3 6.3K1 6.6 7.3 7.3 7.2 7.4 7.3 7.4N2 23.4 23.3 23.4 23.2 23.5 23.6 23.7M2 114.3 114.2 114.4 113.8 114.2 114.2 114.6S2 40.9 40.9 41.1 40.8 41.0 41.0 40.7G (deg)Tide AQU GEO MIR POL RAD SEB SRDO1 71.8 73.5 71.1 70.5 71.3 71.0 71.7K1 48.0 53.1 54.0 51.8 51.3 52.7 60.0N2 66.9 68.1 66.9 67.0 67.9 66.9 64.5M2 80.0 80.5 79.9 80.0 80.5 79.9 79.3S2 104.9 105.1 105.2 105.3 105.8 105.2 104.9IOC <str<strong>on</strong>g>Manual</str<strong>on</strong>g>s <strong>and</strong> Guides No 14 vol IV63
Sea Level Measurement <strong>and</strong> Interpretati<strong>on</strong>C<strong>on</strong>clusi<strong>on</strong>sAll the <strong>sea</strong> <strong>level</strong> sensors installed at Vilagarcía havebeen shown to be accurate enough for such st<strong>and</strong>ardapplicati<strong>on</strong>s as tide, storm surges, <strong>and</strong> even mean <strong>sea</strong><strong>level</strong>, although the latter would need more study, tobe completely sure. However, differences were foundin the higher frequency range, which we have decidedto c<strong>on</strong>tinue to study. The reas<strong>on</strong> for this is our interest,<strong>and</strong> may be that of the rest of the <strong>sea</strong> <strong>level</strong> community,to detect seiches <strong>and</strong> tsunamis <strong>and</strong> even include thesensors in an alert system. C<strong>on</strong>cerning this, the sensorswith a lower sampling frequency of the raw datashould dem<strong>on</strong>strate that they are not measuring justnoise, but also other physical signals.C<strong>on</strong>cerning the radar sensors, a very important c<strong>on</strong>clusi<strong>on</strong>is that they have shown that they are very easyto install <strong>and</strong> require almost no maintenance, which isvery important for equipment for permanent networks.Nearly no incident occurred during the two years oftesting, especially with the Miros <strong>and</strong> Geónica sensors;<strong>on</strong>ly the Seba sensor was an excepti<strong>on</strong>. Nevertheless,care has to be taken when stating something like this,because, sometimes, a lack of informati<strong>on</strong> <strong>on</strong> the sensorc<strong>on</strong>figurati<strong>on</strong> <strong>and</strong> installati<strong>on</strong> requirements may bejust the explanati<strong>on</strong> for some of the failures.More detailed descripti<strong>on</strong> of the experiment <strong>and</strong> discussi<strong>on</strong>of the data can be found in ESEAS-RI (2005)<strong>and</strong> Martín et al. (2005).ReferencesESEAS-RI. (2005) Assessment of accuracy <strong>and</strong> operati<strong>on</strong>alproperties of different tide gauge sensors.WP4 Deliverable D4.1, Technical Report. (http://www.e<strong>sea</strong>s.org)Martín, B., Pérez, B., Alvarez Fanjul, E. 2005. TheESEAS-RI <strong>sea</strong> <strong>level</strong> test stati<strong>on</strong>: reliability <strong>and</strong> accuracyof different tide gauges. Internati<strong>on</strong>al HydrographicReview, 6, 44-53.Pérez, B. <strong>and</strong> López Mald<strong>on</strong>ado, J.D. 2003. Experiencewith S<strong>on</strong>ar Re<strong>sea</strong>rch <strong>and</strong> Development (SRD) acousticgauges in Spain. IOC Workshop Report 193Woodworth P.L. <strong>and</strong> Smith D.E. 2003. A <strong>on</strong>e-yearcomparis<strong>on</strong> of radar <strong>and</strong> bubbler tide gauges atLiverpool. Internati<strong>on</strong>al Hydrographic Review, 4,2-9.64IOC <str<strong>on</strong>g>Manual</str<strong>on</strong>g>s <strong>and</strong> Guides No 14 vol IV
Sea Level Measurement <strong>and</strong> Interpretati<strong>on</strong>Comparis<strong>on</strong> of Radar Devices in GermanyChristoph J Blasi <strong>and</strong> Ulrich BarjenbruchFederal Institute of Hydrology (BfG), D-56002 Koblenz, Germany,E-mail: blasi@bafg.deNearly all kinds of engineering in coastal area rely <strong>on</strong>the available informati<strong>on</strong> <strong>on</strong> water <strong>level</strong>. The classicalway of reading the water <strong>level</strong> is by a staff gauge <strong>and</strong>a float. These measuring systems were used for a veryl<strong>on</strong>g time <strong>and</strong> were upgraded in various ways to storethe recorded data.In the late 1990s, radar devices, which were mainlyused in process technology, were introduced intohydrometry. The Federal Institute of Hydrology (BfG)made the first investigati<strong>on</strong> at the beginning of 2000(BfG 2002). As technology of these devices developed,additi<strong>on</strong>al tests were made. These tests were part of are<strong>sea</strong>rch project with the aim of finding the core foundati<strong>on</strong>for <strong>measurement</strong>s of waves, <strong>sea</strong> state, water<strong>level</strong> <strong>and</strong> thickness of ice. The results are quite reas<strong>on</strong>able<strong>and</strong> available via http://www.bafg.de/servlet/is/7833/. One of the main parts of the project was the<strong>measurement</strong> of waves in a broader sense. Therefore alot of attenti<strong>on</strong> was paid to the theory of detecti<strong>on</strong> <strong>and</strong><strong>measurement</strong> of water <strong>level</strong> as a part of waves underdifferent c<strong>on</strong>diti<strong>on</strong>s. Different tests were undertakenunder both laboratory <strong>and</strong> field c<strong>on</strong>diti<strong>on</strong>s to accessthe influence of the <strong>measurement</strong>.The aim of this paper is to show the results from thefield test, with a view to giving the reader help <strong>and</strong>support in choosing the right radar gauge to measurewater <strong>level</strong>. However, the physical background <strong>and</strong> theapplicati<strong>on</strong> of radar in distance <strong>measurement</strong> will notbe discussed here. The reader may refer to the report ofthe re<strong>sea</strong>rch project available from the authors [pleasecite the source]. As menti<strong>on</strong>ed before, there were testsin the hydraulic laboratory <strong>and</strong> as well in the field.During the laboratory test, the backscatter from differentradar devices for various wave types <strong>and</strong> watersurfaces were investigated to determine the suitabilityfor wave <strong>and</strong> water-<strong>level</strong> <strong>measurement</strong>.With this informati<strong>on</strong>, four different devices werechosen for the field test. The field test was at thegauging stati<strong>on</strong> <strong>on</strong> Borkum Südstr<strong>and</strong>, which is <strong>on</strong>the isl<strong>and</strong> of Borkum <strong>and</strong> very close to the border withThe Netherl<strong>and</strong>s. This locati<strong>on</strong> has all the requiredc<strong>on</strong>diti<strong>on</strong>s, such as tidal range, different types of wave,<strong>sea</strong> state, changes of salinity, rough <strong>sea</strong>s, saline air<strong>and</strong> annual temperature variati<strong>on</strong>. Furthermore, theBorkum Südstr<strong>and</strong> Gauging Stati<strong>on</strong> is an official gaugeof the Water <strong>and</strong> Shipping Way Authority. The gauge<strong>and</strong> the setting up of the radar sensors are shown inFigure 1.The devices themselves are described as Rad_A up toRad_D. This was d<strong>on</strong>e under an agreement with themanufacturers. If detailed informati<strong>on</strong> is required, thereader may c<strong>on</strong>tact the author. For establishing thereference for the four radar sensors <strong>and</strong> the officialgauge, a calibrated Magnetostrictive-Sensor (a specialkind of float gauge without a stilling well) was used.Most of the radar gauges work <strong>on</strong> the same principle.Figure 1. The Borkum Südstr<strong>and</strong> Gauging Stati<strong>on</strong> <strong>and</strong> installati<strong>on</strong> of the of the radar gauges <strong>and</strong> the localreference.IOC <str<strong>on</strong>g>Manual</str<strong>on</strong>g>s <strong>and</strong> Guides No 14 vol IV65
Sea Level Measurement <strong>and</strong> Interpretati<strong>on</strong>A radar signal with a frequency of approximately 1–30GHz is sent from the antenna to the water surface.After reflecti<strong>on</strong> at the water surface, the return signal isreceived, with a time lag. The characteristic of the radargauge is written in Table 1.Table 1. Characteristics of the tested radar gauge.Rad_C Rad_BRad_D Rad_AMethod [-] Pulse Pulse Pulse FMCWMicrowavefrequency[GHz] 26 26 5.8 8.5-9.9The Rad_A gauge works with the frequency modulatedc<strong>on</strong>tinuous wave (FMCW); all the other devices work withthe pulse method, at different frequencies. As all radargauges have outliers in the data, the recorded time-serieshas to be examined in this way <strong>and</strong> the data have to besmoothed. The exp<strong>on</strong>ential smoothing, with a weightingfactor of 0.001 at a sample rate of 1.3 Hz achieved thebest results. Figure 2 shows the measured error probabilitiesof the radar gauges <strong>and</strong> the official gauge.In c<strong>on</strong>clusi<strong>on</strong>, the radar gauges Rad_C <strong>and</strong> Rad_B are themost suitable devices for measuring water <strong>level</strong>. The erroris in the same range as that of the official gauging stati<strong>on</strong>.The Rad_A sensor is the <strong>on</strong>ly <strong>on</strong>e with another measuringprocedure. The pulse method (see Table 1) for the water<strong>level</strong> <strong>measurement</strong> is more suitable. Rad_D, which hasalso been tested since summer 2003, had problems withits data communicati<strong>on</strong> system. Therefore the analysisshown in Figure 2 was not d<strong>on</strong>e. Furthermore, comparedto the classical gauge, the maintenance for the radargauge is much less <strong>and</strong> the latter has delivered data sincesummer 2003. Even various envir<strong>on</strong>mental factors, suchas bird excrement or saline air, have no influence at all <strong>on</strong>the <strong>measurement</strong>.ReferencesBarjenbruch, U., Mai, S., Ohle, N., Mertinatis, P. 2002.M<strong>on</strong>itoring water <strong>level</strong>, waves <strong>and</strong> ice with radargauges. Proceedings of the Hydro 2002 C<strong>on</strong>ference,Kiel, Germany. pp.328-337BfG (Bundesanstalt für Gewässerkunde). 2002. Testv<strong>on</strong> Radarsensoren im Küsten- und Küstenbereich,interner Bericht. BfG-1276, Koblenz, Germanyerror probabilityerror probabilityσµ σµerror probabilityσµerror probabilityerror probabilityσµFigure 2. Comparis<strong>on</strong> of the measured differences between each gauge <strong>and</strong> the Magnetostrictive-Sensor for aparticular day.66IOC <str<strong>on</strong>g>Manual</str<strong>on</strong>g>s <strong>and</strong> Guides No 14 vol IV
Sea Level Measurement <strong>and</strong> Interpretati<strong>on</strong>Experience with SRD Tide Gauges <strong>and</strong> the Reas<strong>on</strong>ingbehind a Change to Radar Tide GaugesRuth FarreSouth African Navy Hydrographic Office, E-mail: hydrosan@iafrica.comHistorical summaryThe SAN Hydrographic Office started installing itsown float-actuated ‘Kent’ gauges in 1958. As thesegauges aged, additi<strong>on</strong>al types, also float-actuated,were installed; they comprised LEA gauges, similar tothe Kents, Italian SAIP gauges in Saldanha <strong>and</strong> Sim<strong>on</strong>’sTown, <strong>and</strong> OTT gauges in Port Elizabeth <strong>and</strong> WalvisBay. These gauges proved to be reliable, but by themid-1980s, the Navy’s Tide Gauge (TG) network wasageing. Spares for the Kents were becoming difficultto come by <strong>and</strong> replacement <strong>on</strong> a significant scale wasurgently needed.A project was initiated with the CSIR, Stellenbosch,to develop an accurate, modern Acoustic Water LevelRecorder. These came into service in 1990 <strong>and</strong> eightwere installed throughout RSA <strong>and</strong> Namibia. Thesegauges were a failure. They were erratic, difficult totune <strong>and</strong> grossly inaccurate. Virtually no usable datawere obtained <strong>and</strong> the gauges were finally ab<strong>and</strong><strong>on</strong>edbetween 1996 <strong>and</strong> 1998.Specificati<strong>on</strong>s for the replacement gauges were drawnup in c<strong>on</strong>juncti<strong>on</strong> with IMT (Institute of MaritimeTechnology) in 1995 <strong>and</strong> were tendered for in 1996.The tender was w<strong>on</strong> by Messrs SMD Electr<strong>on</strong>ics CC,with their SRD acoustic gauges meeting our requirements.These promised well <strong>and</strong> were installed, somewhathurriedly, in 1996, mounted <strong>on</strong> tubes, as recommendedby the manufacturers. The supplier stated thatthe gauges were calibrated in the factory <strong>and</strong> weretherefore self-calibrating. It was immediately foundthat the gauges were very inaccurate, well outside thespecificati<strong>on</strong>. With assistance from IMT, remedial measureswere taken <strong>and</strong> the gauges were calibrated byIMT <strong>and</strong> remounted without tubes. The HydrographicOffice had to devise a method for check-calibratingthese gauges in situ. Their performance has subsequentlybeen just acceptable, but not of the accuracydesired. Their reliability has varied. Maintaining correctreadings <strong>and</strong> downloading the data are problematical.An OTT Kalesto Radar tide gauge was tested by theHydrographic Office in Sim<strong>on</strong>’s Town at the beginningof 2002. The results obtained from this test werereaffirmed by a test d<strong>on</strong>e at IMT in September 2002.The results from these tests indicated that the Kalestogauge performs with a higher degree of accuracy <strong>and</strong>stability than has been encountered in the past.Currently the SA Hydrographic Office maintains 10 tidegauges al<strong>on</strong>g the South African coastline. The networkis as follows:• Port Nolloth – A Kalesto gauge is installed. AHARTRAO GPS Rx is also fitted.• Saldanha Bay – At present there is an SRD gaugeinstalled.• Cape Town – At present there is an SRD gaugeinstalled.• Sim<strong>on</strong>’s Town – At present there is an SRD <strong>and</strong> aKalesto gauge installed. A HARTRAO GPS Rx is alsofitted.• Mossel Bay – At present there is an SRD gaugeinstalled.• Knysna – At present there is an SRD gaugeinstalled.• Port Elizabeth – A Kalesto gauge is installed• East L<strong>on</strong>d<strong>on</strong> – A ““Kalesto gauge is installed.• Durban – At present there is an SRD gaugeinstalled.• Richard’s Bay – A Kalesto gauge is installed. AHARTRAO GPS Rx is also fitted.The Hydrographic Office has purchased new Kalestoradar gauges with the intenti<strong>on</strong> of installing them untilsuch time as the entire South African tide gauge networkhas been upgraded.SRD gaugesAn independent study was d<strong>on</strong>e <strong>on</strong> the SRD gauge, byIMT, after the SAN Tidal Superintendent expressed c<strong>on</strong>cernover the accuracy <strong>and</strong> quality of the data beinggenerated by the SRD tide gauge network. The studyshowed that transducers housed in tubes producedlarge errors due to temperature gradients that formedin the tube. The soluti<strong>on</strong> to this was to remove ormodify the existing tubes to maintain a thermally wellmixed air column around the transducerThe accuracy of the two gauges used in the study wastested: <strong>on</strong>e was found to have a systematic error ofabout 6 mm per metre over <strong>and</strong> above a fixed offsetof about 24 mm. The other was found to have a systematicerror of approximately 10 mm per metre witha fixed offset of about 36 mm. This accuracy problemwas taken up with the manufacturers to establish whythe claimed accuracy of 0.05% over the 2- to 10-mworking range could not be achieved with the unitsIOC <str<strong>on</strong>g>Manual</str<strong>on</strong>g>s <strong>and</strong> Guides No 14 vol IV67
Sea Level Measurement <strong>and</strong> Interpretati<strong>on</strong>under test. The manufacturer could not solve the problem<strong>and</strong> a method of post-data-processing was devisedto improve the absolute accuracy of the data back tothe claimed 0.05%. This post-data-processing couldhowever <strong>on</strong>ly be carried out <strong>on</strong>ce all gauges in thenetwork had been calibrated in situ to establish theirindividual calibrati<strong>on</strong> factors.A refined method for in situ calibrati<strong>on</strong> was devised asa quality c<strong>on</strong>trol tool. The method allows the followingto be reliably established <strong>on</strong> site:• Absolute accuracy• Measurement repeatability• Instrument datum offset.All gauges in the SAN tide gauge network are nowcalibrated every six m<strong>on</strong>ths, using carb<strong>on</strong> graphitepoles of known length <strong>and</strong> a stainless steel target thatis suspended below the gauge.Data received from the gauge are very ‘spiked’. Thestability of the readings is also erratic. This spiking inthe data creates a problem when the time arrives forthe annual tidal predicti<strong>on</strong> run. The spikes have to beedited out of the data by h<strong>and</strong> – each day’s data haveto be manually plotted, checked against the graphicsproduced by the Tech Tidal Assistant <strong>and</strong> then editedinto the analysis programme, before predicti<strong>on</strong>s can becalculated. This is a very unscientific, time-c<strong>on</strong>sumingprocess <strong>and</strong> human error comes into play.The quality of the lightning protecti<strong>on</strong> within the unitis not up to st<strong>and</strong>ard. A perfect example of this is thegauge in East L<strong>on</strong>d<strong>on</strong>. It was struck by lightning <strong>and</strong>this caused a fire in the gauge. Since the HydrographicOffice had placed the instrument box inside a watertightmetal box, the fire burnt itself out, owing to lackof oxygen. It would appear that the data logger wasnot damaged in the lightning strike/fire. The powersupply, juncti<strong>on</strong>-box teleph<strong>on</strong>e line <strong>and</strong> modem weredamaged.What the tidal department calls a ‘kick-start’ is thesoluti<strong>on</strong> to the problem of periodic unwillingness todownload data. Periodically, the power supply has tobe disc<strong>on</strong>nected from the gauge, followed by a waitof 30 sec<strong>on</strong>ds <strong>and</strong> then restorati<strong>on</strong> of the power supply.This problem is becoming more <strong>and</strong> more frequent<strong>and</strong> the down-time that it is creating in data analysis isbecoming problematical.In the last five years it has become evident that thetransducers are beginning to rust <strong>and</strong> this is gettingprogressively worse. The HO is unsure whether the rustis affecting the quality of the data; however, this is apossibility, as the transducers that have little or no rustare not creating as many problems.Kalesto radar gaugeThe OTT Kalesto radar gauge was tested by the TidalDepartment <strong>and</strong> under calibrati<strong>on</strong> from 12 to 15 April2002. After analysis of 1,443 readings (with a mean of2.4955 m, say 2.496 m) it was found that, in general:• 81% of the readings were within 2 mm of theabove-stated mean• 93% of the readings were within 3 mm of thismean• 97% of the readings were within 5 mm of thismean.An independent study to check-calibrate the Kalestoradar tide gauge was carried out by IMT <strong>on</strong> request bythe SAN Tidal Superintendent. The study showed that,during the calibrati<strong>on</strong> period, the Kalesto performedc<strong>on</strong>sistently within the manufacturer’s claimed accuracyparameters over the 2–7 m range. The absoluteaccuracy of the gauge under test had a st<strong>and</strong>ard deviati<strong>on</strong>of better than 3 mm over the 2–7 m range. Theindependent study c<strong>on</strong>firmed the results achieved bythe SAN Hydrographic Office.The refined method for in situ calibrati<strong>on</strong> devised forthe SRD tide gauge as a quality c<strong>on</strong>trol tool is used tocalibrate the Kalesto gauge every six m<strong>on</strong>ths.The data received from the gauge have very little ‘spiking’in the graphics; this is due to the 17 s measuringinterval. The low spike density is evident in the graphics<strong>and</strong> in the l<strong>on</strong>g run there will be very little editing ofthe data before the predicti<strong>on</strong>s can be produced, thusimproving <strong>on</strong> the accuracy of the Hydrographic Office’spredicti<strong>on</strong>s. The quality of data being sent to theGLOSS Fast Centre has also increased, not <strong>on</strong>ly in qualitybut also in frequency of data transfer. (Fast Data)This gauge is factory-fitted with an integrated lightningprotector to reduce the possibility of damage caused byexcess voltage (e.g. lightning or power surges.)Future prospectsThe SAN Hydrographic Office intends to upgradeits entire tide gauge network with the Kalesto radartide gauges. It is proposed to install a GPS receiverat Durban. It is also proposed to install a tide gauge<strong>and</strong> GPS receiver <strong>on</strong> Mari<strong>on</strong> Isl<strong>and</strong>, in c<strong>on</strong>necti<strong>on</strong> withHARTRAO, thus restoring the South African GLOSS stati<strong>on</strong>status to its original 100% capability.Currently, ‘fast data’ are being sent to the GLOSS FastCentre, at the University of Hawaii, from the Sim<strong>on</strong>’sTown, Richards Bay, Port Nolloth, Port Elizabeth <strong>and</strong>East L<strong>on</strong>d<strong>on</strong> gauges. The remaining RSA stati<strong>on</strong>s willbe included in the fast-data streams <strong>on</strong>ce they havebeen upgraded to the Kalesto radar gauge.68IOC <str<strong>on</strong>g>Manual</str<strong>on</strong>g>s <strong>and</strong> Guides No 14 vol IV
Sea Level Measurement <strong>and</strong> Interpretati<strong>on</strong>Pressure-gauge-based GLOSS Sea Level Stati<strong>on</strong> at Takoradi Harbour(Ghana, West Africa): Experience over a YearAnt<strong>on</strong>y Joseph (+), Prakash Mehra (+), Joseph Odammetey (#), <strong>and</strong> Nkebi E. Kofi(#),(+) Nati<strong>on</strong>al Institute of Oceanography of India (NIO); (#) Survey of Ghana (SOG) E-mail: joseph@darya.nio.orgIntroducti<strong>on</strong>A GLOSS <strong>sea</strong> <strong>level</strong> stati<strong>on</strong> was commissi<strong>on</strong>ed atTakkoradi harbour in Ghana <strong>on</strong> 1 July 2004 <strong>and</strong> a year’sdata have been collected so far. The gauge has beendeveloped at NIO <strong>and</strong> was installed with logistic supportfrom the SOG.Pressure gaugeSea <strong>level</strong> is detected by a temperature-compensatedpiezoresistive semic<strong>on</strong>ductor pressure transducer (PPTR)located ~1.70 m below the Chart Datum (CD) <strong>level</strong>. Inc<strong>on</strong>formity with the GLOSS requirements, the gaugelogs 15-minute-averaged time-indexed pressure dataat 15-min intervals.TOSea <strong>level</strong>CDBottom pressure versus <strong>sea</strong> <strong>level</strong>Translati<strong>on</strong> of bottom pressure <strong>measurement</strong>s to <strong>sea</strong><strong>level</strong> elevati<strong>on</strong>s is achieved c<strong>on</strong>venti<strong>on</strong>ally with the useof <strong>sea</strong>s<strong>on</strong>ally measured water density <strong>measurement</strong>s.However, Joseph et al. (1999, 2004) have reportedinaccuracies creeping into bottom-pressure-based <strong>sea</strong><strong>level</strong> <strong>measurement</strong>s in shallow coastal water bodies;such inaccuracies arise primarily from various poorlyunderstood site-specific influences, which results inthe effective density (reff) of the water being generallylower than that obtained from c<strong>on</strong>venti<strong>on</strong>al <strong>measurement</strong>susing CTD or a density meter. In view of this, analternate method for translati<strong>on</strong> of bottom pressure<strong>measurement</strong>s to <strong>sea</strong> <strong>level</strong> elevati<strong>on</strong>s without the useof water density <strong>measurement</strong>s has been explored.This method involves the use of a statistically derivedmathematical model, which relates a sufficiently largeset of bottom pressure <strong>measurement</strong>s <strong>and</strong> c<strong>on</strong>currentgood-quality tide-staff <strong>measurement</strong>s for a given installati<strong>on</strong>.The model representing the linear regressi<strong>on</strong>between these two <strong>measurement</strong>s is of the form T =[(G ¥ Pw)–O] where T, Pw, G <strong>and</strong> O represent, respectively,chart-datum-referenced tide-staff <strong>measurement</strong>,c<strong>on</strong>current water pressure <strong>measurement</strong>, gain, <strong>and</strong>offset of the model. The value of O is negative in thepresent case, because the pressure port of the PPTRis located below the CD <strong>level</strong> (Fig. 1). The premiseis that, if a sufficiently large data set (during a given<strong>sea</strong>s<strong>on</strong>) has been used in c<strong>on</strong>structing the model, thenapplicati<strong>on</strong> of this model to a much larger time-seriesof water-pressure data during the same <strong>sea</strong>s<strong>on</strong> shouldprovide a realistic estimate of chart-datum-referenced<strong>sea</strong> <strong>level</strong> elevati<strong>on</strong>.PRESSURE PORTSea BEDFigure 1. Schematic diagram illustrating the modelparameters T <strong>and</strong> O.Figure 2. Illustrati<strong>on</strong> of optimal number of tidal cycles<strong>and</strong> their neap/spring relati<strong>on</strong>ships in achieving stabilizati<strong>on</strong>of model parameters G <strong>and</strong> O.IOC <str<strong>on</strong>g>Manual</str<strong>on</strong>g>s <strong>and</strong> Guides No 14 vol IV69
Sea Level Measurement <strong>and</strong> Interpretati<strong>on</strong>Optimizati<strong>on</strong> of tide-staff <strong>measurement</strong>sA bench-mark-<strong>level</strong>led tide-staff can be found inevery harbour. The Intergovernmental OceanographicCommissi<strong>on</strong> (IOC) of UNESCO has recommendedthe applicati<strong>on</strong> of tide-staff <strong>measurement</strong>s for qualityc<strong>on</strong>trol of <strong>sea</strong> <strong>level</strong> <strong>measurement</strong>s made fromaut<strong>on</strong>omous instrumentati<strong>on</strong> (IOC, 2002). However,no reports are available <strong>on</strong> the optimal quantumof tide-staff <strong>measurement</strong>s to be made, nor themost appropriate sequence of such <strong>measurement</strong>sin relati<strong>on</strong> to spring/neap cycles for their use inoptimizing quality c<strong>on</strong>trol. Thus, at present, lack ofclarity exists as to what c<strong>on</strong>stitutes a ‘sufficientlylarge’ <strong>and</strong> ‘representative’ data set to be used forthe c<strong>on</strong>structi<strong>on</strong> of the model. In an attempt to findan answer to these questi<strong>on</strong>s, we c<strong>on</strong>structed severalmodel equati<strong>on</strong>s of the type menti<strong>on</strong>ed above,wherein data sets (acquired at 15-minute intervals)corresp<strong>on</strong>ding to differing tidal cycles during neap<strong>and</strong> spring tides were used. We then examined theoptimal number of tidal cycles <strong>and</strong> their neap/springrelati<strong>on</strong>ships in achieving stabilizati<strong>on</strong> of the modelparameters G <strong>and</strong> O corresp<strong>on</strong>ding to each of thesemodel equati<strong>on</strong>s (Figure 2).In this study, it was observed that, in the case ofneap tide <strong>measurement</strong>s (indicated by ¥ <strong>on</strong> thegraphs), even after several tidal cycles, the valuesof G <strong>and</strong> O never stabilized (i.e. the values did notlie <strong>on</strong> a line parallel to the x-axis). However, unlikeneap tide, spring tide <strong>measurement</strong>s (indicated by_ <strong>on</strong> the graphs) provided significantly improvedresults. In this case, G <strong>and</strong> O stabilized with the useof the data set corresp<strong>on</strong>ding to a 3-tidal cycle (<strong>on</strong>e<strong>and</strong> half days), <strong>and</strong> the incorporati<strong>on</strong> of more tidalcycles for the c<strong>on</strong>structi<strong>on</strong> of the model did notprovide any added benefits in terms of stabilizati<strong>on</strong>of G <strong>and</strong> O. We then examined whether centeringthe data set <strong>on</strong> spring tide peak could reduce thesize of the data set for c<strong>on</strong>structi<strong>on</strong> of the model.With reference to Figure 2; points a, b, c, d, e, f, <strong>and</strong>g represent, respectively, the results achieved withthe use of quarter-hourly data sets acquired at/nearspring tide between points 4–5 (1 cycle), 5–6 (1cycle), 4–6 (2 cycles), 3–7 (4 cycles), 2–8 (6 cycles),1–9 (8 cycles), <strong>and</strong> 0–10 (10 cycles). It is seen that,in relati<strong>on</strong> to several of the G <strong>and</strong> O values obtainedfrom the models, the use of data sets corresp<strong>on</strong>dingto a single cycle that encompasses the largesttidal range (bounded by points 4–5 at spring tide)provided stabilized G <strong>and</strong> O values (indicated by a<strong>on</strong> the Gain <strong>and</strong> Offset graphs). However, data setscorresp<strong>on</strong>ding to another adjacent single cycle thatrepresented a much smaller tidal range (bounded bypoints 5–6 at spring tide) provided G <strong>and</strong> O values(indicated by b <strong>on</strong> the Gain <strong>and</strong> Offset graphs) thatdiffered significantly from the stabilized G <strong>and</strong> Ovalues. In many cases a single tidal cycle at springtide may not represent the maximum range of thewater column height. This explains why sometimes adata set corresp<strong>on</strong>ding to three or more tidal cyclesduring a given spring tide becomes necessary toachieve stabilizati<strong>on</strong> of the model parameters G <strong>and</strong>O. It may therefore be c<strong>on</strong>cluded that the crucialfactor, which determines stabilizati<strong>on</strong> of the modelparameters G <strong>and</strong> O is the incorporati<strong>on</strong> of data setsfrom that (those) tidal cycle(s) which encompassesthe largest range of water column height during agiven spring tide. Figure 3 provides the chart-datumreferenced<strong>sea</strong> <strong>level</strong> <strong>measurement</strong>s obtained fromTakoradi harbour during the period 1 July 2004 to30 June 2005 based <strong>on</strong> the above scheme.C<strong>on</strong>clusi<strong>on</strong>sThe primary objective of our present studies, based<strong>on</strong> the GLOSS <strong>sea</strong> <strong>level</strong> data from Takoradi harbour,was to examine a method to improve the accuracy ofbottom-pressure-based coastal <strong>and</strong> estuarine <strong>sea</strong> <strong>level</strong><strong>measurement</strong>s. In this method, time-series bottompressure <strong>measurement</strong>s are translated to chart-datumreferenced<strong>sea</strong> <strong>level</strong> elevati<strong>on</strong> through post-processingusing a statistically derived mathematical model. Thismodel is c<strong>on</strong>structed from a set of successive periodic(15-minute intervals) bottom pressure <strong>measurement</strong>sover a few tidal cycles during the spring tide, whichencompasses the maximum span of water columnFigure 3. Chart-datum-referenced <strong>sea</strong> <strong>level</strong> <strong>measurement</strong>s from Takoradi harbour, Ghana.70IOC <str<strong>on</strong>g>Manual</str<strong>on</strong>g>s <strong>and</strong> Guides No 14 vol IV
Sea Level Measurement <strong>and</strong> Interpretati<strong>on</strong>height <strong>and</strong> c<strong>on</strong>current benchmark-<strong>level</strong>ed tide-staff<strong>measurement</strong>s. Unlike in the c<strong>on</strong>venti<strong>on</strong>al method,the model provides a chart-datum-referenced <strong>sea</strong><strong>level</strong> record directly from bottom pressure <strong>measurement</strong>swithout the use of <strong>sea</strong>water density <strong>measurement</strong>s.This method is expected to be applicable for alltypes of water bodies <strong>and</strong> particularly appropriate forsuspended-sediment-laden water bodies whose effectivedensity has been reported to be less than thatobtained from c<strong>on</strong>venti<strong>on</strong>al <strong>measurement</strong>s.AcknowledgmentsThe authors acknowledge the logistic supportprovided by Mr. J. Wellens-Mensah (AG Director,Hydrological Services Department, Ghana) <strong>and</strong>Mr. Jean Dotse (Director of Surveys of Ghana).ReferencesJoseph, A., Desa, E., Desa, E.S., Smith, D., Peshwe, V.B.,Kumar, V., Desa, J.A.E. 1999. Evaluati<strong>on</strong> of pressuretransducers under turbid natural waters. Journal ofAtmospheric <strong>and</strong> Oceanic Technology, 16 (8) 1150-1155.Joseph A., Desa, E., Kumar, V., Desa, E.S., Prabhudesai,R.G., Prabhudesai, S. 2004. Pressure gauge experimentsin India. In: S. Holgate <strong>and</strong> T. Aarup (eds) IOCWorkshop <strong>on</strong> New Technical Developments in Sea<strong>and</strong> L<strong>and</strong> Level Observing Systems (14–16 October2003), Paris, France. IOC Workshop Report No. 19322-37.IOC <str<strong>on</strong>g>Manual</str<strong>on</strong>g>s <strong>and</strong> Guides No 14 vol IV71
Sea Level Measurement <strong>and</strong> Interpretati<strong>on</strong>Chilean Sea Level NetworkJuan Fierro, Chilean Navy Hydrographic <strong>and</strong> Oceanographic Service (SHOA)E-mail: jfiero@shoa.clIn 1941, the Chilean Navy Hydrographic <strong>and</strong>Oceanographic Service (SHOA) initiated the establishmentof the nati<strong>on</strong>al tide gauge network with theobjective of starting a systematic <strong>and</strong> permanentrecording of the <strong>sea</strong> surface <strong>level</strong> al<strong>on</strong>g the coast.Figure 2. Sea <strong>level</strong> stati<strong>on</strong> c<strong>on</strong>figurati<strong>on</strong>.obtained has been of great value to the nati<strong>on</strong>al <strong>and</strong>internati<strong>on</strong>al scientific communities.Figure 1. Chilean <strong>sea</strong> <strong>level</strong> network.At the end of 1950, the network c<strong>on</strong>sisted of five tidegauge stati<strong>on</strong>s, <strong>and</strong> the experience gained during itsdeployment <strong>and</strong> operati<strong>on</strong> was extremely important fora successful extensi<strong>on</strong> of the network.The great length of the Chilean coast <strong>and</strong> the accessibilityproblems in some areas have been the mainobstacles to extending the network in the short term.However, at the end of 1998, the <strong>sea</strong> <strong>level</strong> networkcomprised 19 permanent tide gauge stati<strong>on</strong>s, located<strong>on</strong> the mainl<strong>and</strong> as well as in some isl<strong>and</strong>s <strong>and</strong> inAntarctica. C<strong>on</strong>sidered as a system, the operati<strong>on</strong>of this network has allowed SHOA to provide usefulinformati<strong>on</strong> to mariners sailing in Chilean waters <strong>and</strong>to c<strong>on</strong>tribute to engineering projects associated withcoastal-z<strong>on</strong>e management. Moreover, the informati<strong>on</strong>The upgrading initiated in March 1999 c<strong>on</strong>sidered thedeployment of 17 HANDAR model 555C data-acquisiti<strong>on</strong>platforms, as shown in Figure 1. The new platforms,with satellite data-transmissi<strong>on</strong> capability, replaced theold recording tide gauges, whose operati<strong>on</strong> was based<strong>on</strong> nitrogen gas pressure. The present tide gauge stati<strong>on</strong>’scharacteristics are shown in Figure 2.For the comparis<strong>on</strong> of old <strong>and</strong> new gauges, six m<strong>on</strong>thsof overlapping (c<strong>on</strong>current) operati<strong>on</strong> were c<strong>on</strong>sidered.During this time, both systems operated in parallel <strong>and</strong>intercomparis<strong>on</strong>s were performed. Sea <strong>level</strong> data <strong>and</strong>ancillary data collected by the <strong>sea</strong> <strong>level</strong> network weretransmitted via the GOES satellite system. Incoming <strong>sea</strong><strong>level</strong> data were validated using a quality-c<strong>on</strong>trol packageprovided by the University of Hawaii. Plots of newcomputati<strong>on</strong>s of yearly residuals showed fewer errorsin comparis<strong>on</strong> with previous findings.The st<strong>and</strong>ard c<strong>on</strong>figurati<strong>on</strong> of every <strong>sea</strong> <strong>level</strong> stati<strong>on</strong>included a water-column pressure sensor, an atmo-72IOC <str<strong>on</strong>g>Manual</str<strong>on</strong>g>s <strong>and</strong> Guides No 14 vol IV
Sea Level Measurement <strong>and</strong> Interpretati<strong>on</strong>spheric pressure sensor, <strong>and</strong> <strong>sea</strong>water temperature <strong>and</strong>air temperature sensors. Recently, an ultras<strong>on</strong>ic windsensor was added to some stati<strong>on</strong>s <strong>on</strong> the northernpart of the Chilean coast.Sea LevelSensorGPSAntennaAir TempSensorSolar pannelWaterTemperature SensorInternalCircuitryGPSC<strong>on</strong>necti<strong>on</strong>Figure 4. Submerged sensors.• High cost compared to simpler systems• Requires c<strong>on</strong>tinuous maintenance for the DRUCKsensor• Requires <strong>level</strong>ling campaigns <strong>on</strong> a regular basis toensure accurate data• Modem communicati<strong>on</strong> with each DCP is not reliableFigure 3. Sea <strong>level</strong> stati<strong>on</strong> comp<strong>on</strong>ents.BatterryThe <strong>sea</strong> <strong>level</strong> sensor used is a submersible pressuretransducer, with an operating range from 0 to 70g/cm 2 (equivalent to 13.7 m) of water column. Thesignal c<strong>on</strong>ductor cable holds a ventilati<strong>on</strong> tube thateliminates the atmospheric pressure effect over thewater column.During the first semester of 2005, SHOA has performedfurther upgrades to its network, by installing a VaisalaDirect Readout Ground Stati<strong>on</strong> (DRGS) at SHOA’s headquartersat Valparaíso (Figure 5). This DRGS receivercollects informati<strong>on</strong> from our remote data collecti<strong>on</strong>platforms (DCP). The DRGS is fully user-c<strong>on</strong>figurablethrough the Data Management System (DMS) using aThe <strong>sea</strong> <strong>level</strong> height is recorded at two-minute intervals<strong>and</strong> the other envir<strong>on</strong>mental parameters <strong>on</strong>ce everyhour. The main comp<strong>on</strong>ents of the DCP are shown inFigures 3 <strong>and</strong> 4.The development of this modern data collecti<strong>on</strong> platform(DCP) network has several benefits which may besummarized as:• Flexible c<strong>on</strong>figurati<strong>on</strong>• Easy installati<strong>on</strong>, adaptable to different structures<strong>on</strong> the field• L<strong>on</strong>g aut<strong>on</strong>omy• Powerful data acquisiti<strong>on</strong> software• Better accuracy: 1 cm with DRUCK sensor complieswith GLOSS requirementsNevertheless, according to the experience accumulatedby SHOA, this system has a few drawbacks, summarizedas follows:Figure 5. DRGS antenna at SHOA headquarters.IOC <str<strong>on</strong>g>Manual</str<strong>on</strong>g>s <strong>and</strong> Guides No 14 vol IV73
Sea Level Measurement <strong>and</strong> Interpretati<strong>on</strong>Figure 6. Informati<strong>on</strong> flow across SHOA’s DCP network.bi-directi<strong>on</strong>al serial interface, which c<strong>on</strong>trols the entiresystem through a Pentium-based computer usingWindows 95/98/NT.The DRGS has greatly improved the informati<strong>on</strong> flowfrom <strong>sea</strong> <strong>level</strong> stati<strong>on</strong>s to the final user at our headquarters(Figure 6), enhancing the ability to take timelydecisi<strong>on</strong>s <strong>and</strong> improving SHOA’s cooperati<strong>on</strong> in internati<strong>on</strong>alwarning systems.One of the main comp<strong>on</strong>ents in the operati<strong>on</strong> of theNati<strong>on</strong>al Tsunami Warning System is the existing networkof <strong>sea</strong> <strong>level</strong> stati<strong>on</strong>s al<strong>on</strong>g the coast of c<strong>on</strong>tinentalChile <strong>and</strong> the Pacific isl<strong>and</strong>s. The informati<strong>on</strong> providedby the stati<strong>on</strong>s is crucial to the determinati<strong>on</strong> of thetsunami hazard whenever a big earthquake occurs inthe Pacific.The major upgrades performed in recent years have alsoincreased SHOA’s c<strong>on</strong>tributi<strong>on</strong> in internati<strong>on</strong>al studieslike the ENSO m<strong>on</strong>itoring network in the Pacific Ocean.The collecti<strong>on</strong> of envir<strong>on</strong>mental data, such as <strong>sea</strong>-surfacetemperature (SST) <strong>and</strong> mean <strong>sea</strong> <strong>level</strong> (MSL) al<strong>on</strong>gthe Chilean coast, has enhanced our underst<strong>and</strong>ing ofthis important phenomen<strong>on</strong> which affects several ec<strong>on</strong>omicactivities, such as fisheries <strong>and</strong> agriculture.74IOC <str<strong>on</strong>g>Manual</str<strong>on</strong>g>s <strong>and</strong> Guides No 14 vol IV
Sea Level Measurement <strong>and</strong> Interpretati<strong>on</strong>Gauges for Tsunami WarningBernie Kil<strong>on</strong>sky, University of Hawaii Sea Level Center, USA.E-mail: kil<strong>on</strong>sky@hawaii.eduThe University of Hawaii Sea Level Center (UHSLC)has been providing high frequency tide gauge datafor tsunami warning to the Pacific Tsunami WarningCenter (PTWC) for 25 years. This has led to anemphasis <strong>on</strong> multiple-use platforms that have thestability <strong>and</strong> accuracy to measure l<strong>on</strong>g-term <strong>sea</strong> <strong>level</strong>variability <strong>and</strong> trends, <strong>and</strong> the range, durability, <strong>and</strong>sampling capability to m<strong>on</strong>itor tsunamis. Serving thisdual purpose has resulted in a robust system; stati<strong>on</strong>malfuncti<strong>on</strong>s can be detected <strong>and</strong> addressed quicklygiven the immediate access to the data, <strong>and</strong> <strong>on</strong>goingmaintenance in support of <strong>sea</strong> <strong>level</strong> m<strong>on</strong>itoringensures the sustainability of the stati<strong>on</strong>s betweeninfrequent tsunami events. Here we briefly describethe basic c<strong>on</strong>figurati<strong>on</strong> used by the UHSLC for atide gauge stati<strong>on</strong> that can also be used for tsunamiwarning.Sensors - Since no single sensor is optimal for measuringboth mean <strong>and</strong> high amplitude fluctuatingcomp<strong>on</strong>ents of <strong>sea</strong> <strong>level</strong>, a combinati<strong>on</strong> of water<strong>level</strong> sensors are used. The primary <strong>sea</strong> <strong>level</strong> sensor isa pulsed radar, with sampling fast enough (3 minuteaverages or shorter) to serve also as a sec<strong>on</strong>dary tsunamisensor. The primary tsunami sensor is a ventedpressure transducer reporting 1 minute or shorteraverages. The pressure time series, c<strong>on</strong>verted to water<strong>level</strong>, is usually adequate to fill any short gaps thatmay occur in the radar record. In many cases, a stati<strong>on</strong>with a preexisting float gauge is also retrofittedfor tsunami m<strong>on</strong>itoring. In these situati<strong>on</strong>s the floatgauge is maintained as a third sensor that provides abackup for <strong>sea</strong> <strong>level</strong> m<strong>on</strong>itoring. Water <strong>level</strong> switches<strong>and</strong> a tide staff are also included to m<strong>on</strong>itor the stabilityof the data over time.Power – All UHSLC stati<strong>on</strong>s rely <strong>on</strong> batteries chargedby solar panels for power. At many remote sites, localpower is not an opti<strong>on</strong>. More importantly, local poweris susceptible to failure in the event of a local earthquakeor tsunami inundati<strong>on</strong> event, in which case it isadvantageous to be isolated from the power grid. Mostof the UHSLC stati<strong>on</strong>s are at low- to mid- latitudesmaking solar a viable opti<strong>on</strong>. This may not be the ca<strong>sea</strong>t high latitude sites.Siting - Because tide gauges require a stable platform,most of the UHSLC stati<strong>on</strong>s are located <strong>on</strong> piers ordocks within harbors or atoll lago<strong>on</strong>s. In terms oftsunami m<strong>on</strong>itoring, this has the disadvantage of notsampling the wave signal in an open coast setting.Tsunami amplitudes <strong>and</strong> frequencies within a protectedharbor are likely to be significantly different than al<strong>on</strong>gan unprotected coast. This is of particular c<strong>on</strong>cern fortsunami modelers who may be trying to assimilate tidegauge data. On the other h<strong>and</strong>, unprotected sites tendto be exposed to swell <strong>and</strong> low frequency wave energythat may in some cases mask a small tsunami eventor limit the early detecti<strong>on</strong> of a larger event. In additi<strong>on</strong>,the stati<strong>on</strong> is less likely to be destroyed during atsunami if it is situated in a harbor. For these reas<strong>on</strong>s,we c<strong>on</strong>sider sitting a stati<strong>on</strong> within a harbor a betteropti<strong>on</strong> if the main c<strong>on</strong>cern is to determine whether atsunami threat is present or not.Communicati<strong>on</strong>s – The UHSLC tsunami m<strong>on</strong>itoringexperience in the Pacific has been in the c<strong>on</strong>text of abasin-wide warning system. Given that the Pacific issuch a large area, transmitting data from the stati<strong>on</strong> tothe warning center within an hour or so of collecti<strong>on</strong> istypically sufficient for m<strong>on</strong>itoring the basin-wide extentof a tsunami event. As such, the UHSLC has used theGOES satellite in the Pacific, with the transmissi<strong>on</strong> of2-4 minute averages every hour.Following the December 2004 tsunami, UHSLC istransiti<strong>on</strong>ing to 1 minute averages transmitted every15 minutes for basin wide m<strong>on</strong>itoring. This transmissi<strong>on</strong>rate has been accomplished using the JapaneseMeteorological Agency (JMA) <strong>and</strong> EUMETSAT geostati<strong>on</strong>arysatellites in the Indian Ocean, <strong>and</strong> the GOES inthe Pacific. For stati<strong>on</strong>s located within a 1-hour traveltime of a known tsunami generati<strong>on</strong> site, 15 sec<strong>on</strong>dsampling with a 5-minute transmissi<strong>on</strong> cycle is underc<strong>on</strong>siderati<strong>on</strong>. At present, this may be feasible <strong>on</strong> theGOES system but not for stati<strong>on</strong>s using either the JMAor EUMETSAT downlinks. For these stati<strong>on</strong>s, <strong>and</strong> insupport of partners installing nati<strong>on</strong>al tsunami warningsystems, UHSLC plans to use the INMARSAT BGANsystem. This applicati<strong>on</strong> is currently under developmentin the Indian Ocean.IOC <str<strong>on</strong>g>Manual</str<strong>on</strong>g>s <strong>and</strong> Guides No 14 vol IV75
Sea Level Measurement <strong>and</strong> Interpretati<strong>on</strong>ODINAFRICA Tide Gauge Specificati<strong>on</strong> August 2005Peter Foden, Proudman Oceanographic Laboratory, Liverpool, UK. E-mail: prf@pol.ac.ukThe following lists technical details of UNESCO–IOCfunded radar <strong>and</strong> pressure sensor tide gauges that arebeing procured by POL for installati<strong>on</strong> at sites in Africaas part of the first phase of the ODINAFRICA project. Theinstrumentati<strong>on</strong> c<strong>on</strong>sists of four basic parts:• Sensors – the primary sensor is an OTT Kalesto radargauge measuring height above <strong>sea</strong> <strong>level</strong>, <strong>and</strong> sec<strong>on</strong>darysensors are OTT PS1 pressure sensors measuringwater pressure <strong>and</strong> temperature at two points in thewater column.• Housing – the fibreglass instrumentati<strong>on</strong> cabinethouses the mains power supply, 27 Ah lead–acidrechargeable battery, OTT HDR-DCP satellite telemetryunit which sends data through METEOSAT, Logosens2data logger, 2,400 baud line-powered modem <strong>and</strong>lightning suppressi<strong>on</strong> for the power <strong>and</strong> data lines.• Telemetry – yagi antenna <strong>and</strong> 10-m cable for datatelemetry <strong>and</strong> GPS antenna for the integrated receiversystem in the HDR-DCP.• Data logging – the principal data-retrieval system isby satellite telemetry, but the Logosens2 data loggerhas limited capacity to store the measured sensordata. Access to these data is by local operator or viadial-up modem; set-up <strong>and</strong> maintenance can also becarried out via the modem link.The radar sensor needs to be fitted to a locally-manufacturedsupport arm (specificati<strong>on</strong> can be supplied by POLor there is an OTT versi<strong>on</strong> available), a site-determinedlength of 4-core cable is provided enabling the sensorto be located a distance away from the instrumentati<strong>on</strong>cabinet, if required. The pressure sensors require to befitted in a stilling well <strong>and</strong> installati<strong>on</strong> kits for this purpo<strong>sea</strong>re included.The instrument cabinet is meant to be wall-mounted<strong>and</strong> should be inside a building that has a reliable mainspower supply <strong>and</strong> teleph<strong>on</strong>e c<strong>on</strong>necti<strong>on</strong>.The HDR-DCP antenna needs to have as good a viewof the sky <strong>and</strong> horiz<strong>on</strong> as possible <strong>and</strong> should bemounted away from physical obstructi<strong>on</strong>s, such asmetalwork <strong>and</strong> structures, where possible.Descripti<strong>on</strong> of operati<strong>on</strong>By using the OTT HDR-DCP satellite telemetry unit,accurate real-time data are available from the integratedGPS receiver. This means that the system doesnot need to be set up after switch-<strong>on</strong> <strong>and</strong> that time<strong>measurement</strong> is always accurate to ±1 s.The two pressure sensors are differential (air-pressurecompensated) sensors. One measures sub-surfacepressure <strong>and</strong> the other is positi<strong>on</strong>ed at approximatelyMSL to provide a form of ‘B’ gauge datum c<strong>on</strong>trolchecking both for the first pressure sensor <strong>and</strong> for theKalesto (see explanati<strong>on</strong> of ‘B’ gauges in the present<str<strong>on</strong>g>Manual</str<strong>on</strong>g>).The Kalesto radar sensor <strong>and</strong> the pressure sensors areinterrogated every minute by the Logosens2 data logger<strong>and</strong> the data are recorded. The <strong>on</strong>e-minute valuescan be averaged to whatever time interval is required,e.g. six-minute averages, <strong>and</strong> sent to the HDR-DCPfor transmissi<strong>on</strong> at the allotted time. Alternatively,data can be recovered via data modem c<strong>on</strong>necti<strong>on</strong>.The tide gauge has a back-up supply that is capableof keeping the whole system going for approximatelytwo days without mains power.Note that this equipment is similar to that providedby IOC <strong>and</strong> POL to two sites in Mozambique, <strong>and</strong>installed in early 2005 by the South African NavyHydrographic Office. In that set-up, the METEOSATDCP was replaced by Orbcomm telemetry whichprovides relatively cheap data transmissi<strong>on</strong> but withvariable latency (see secti<strong>on</strong> 5, above).76IOC <str<strong>on</strong>g>Manual</str<strong>on</strong>g>s <strong>and</strong> Guides No 14 vol IV
Sea Level Measurement <strong>and</strong> Interpretati<strong>on</strong>TideTool – A Software Package to Display <strong>and</strong> Decode Sea Level DataTransmitted over the WMO Global Telecommunicati<strong>on</strong>s SystemLaura K<strong>on</strong>g, Internati<strong>on</strong>al Tsunami Informati<strong>on</strong> Centre, Hawaii, USA. E-mail: l.k<strong>on</strong>g@unesco.orgThe software package TideTool provides end users withthe ability to decode, display <strong>and</strong> manipulate <strong>sea</strong> <strong>level</strong>data broadcast over the Global Telecommunicati<strong>on</strong>sSystem (GTS) of the World Meteorological Organizati<strong>on</strong>(WMO). The software utilizes the Tcl/Tk softwarepackage, specifically the BLT extensi<strong>on</strong>. Tcl/Tk is anopen source, platform-independent software packageoffering a powerful shell programming language <strong>and</strong>graphical toolkit.The software applicati<strong>on</strong> was developed by the USNOAA NWS Pacific Tsunami Warning Center to providean operati<strong>on</strong>al tool for real-time c<strong>on</strong>tinuous tsunamim<strong>on</strong>itoring in the Indian Ocean. Its primary users wouldbe nati<strong>on</strong>al meteorological <strong>and</strong> hydrological services(NMHS), or other agencies with a downlink from theGTS or to a data file c<strong>on</strong>taining those data formattedin a similar manner. It has been tested under Linux,Windows 2000 <strong>and</strong> Windows XP envir<strong>on</strong>ments inInd<strong>on</strong>esia <strong>and</strong> Malaysia. A <str<strong>on</strong>g>Manual</str<strong>on</strong>g> is available providinginformati<strong>on</strong> <strong>on</strong> its installati<strong>on</strong> <strong>and</strong> use. The tool <strong>and</strong>documentati<strong>on</strong> are available from the ITSU website:http://www.tsunamiwave.info/operati<strong>on</strong>sTideTool is stati<strong>on</strong> specific, but can be easily modifiedfor changes in formatting <strong>and</strong> the additi<strong>on</strong> of additi<strong>on</strong>al<strong>sea</strong> <strong>level</strong> stati<strong>on</strong>s when needed. The primaryuse of this software is as an operati<strong>on</strong>al programmerun by tsunami warning centres, or other operati<strong>on</strong>alcentres, which need to c<strong>on</strong>tinuously m<strong>on</strong>itor <strong>sea</strong> <strong>level</strong>s.Mouse-clickable functi<strong>on</strong>s include the expansi<strong>on</strong> of thetime-series, <strong>and</strong> <strong>measurement</strong> of the arrival time, waveheight <strong>and</strong> wave period from the incoming signal.RequirementsTo decode <strong>and</strong> display the data, the following arerequired:• Computer running Tcl/Tk software with BLT extensi<strong>on</strong>• Sea <strong>level</strong> data that are c<strong>on</strong>tinuously archived into adata file• Tide.tcl softwareComputer <strong>and</strong> Tcl/Tk software with BLT extensi<strong>on</strong>The TideTool software requires the installati<strong>on</strong> of theTcl/Tk software package <strong>and</strong> the BLT extensi<strong>on</strong>, both ofwhich are freely available for download <strong>and</strong> easy to install.TideTool has been installed <strong>and</strong> tested under Unix, Linux,Windows XP <strong>and</strong> Windows 2000 operating systems. Use<strong>on</strong> other platforms is possible, as it <strong>on</strong>ly depends <strong>on</strong> theTcl/Tk <strong>and</strong> BLT softwares being available. The softwaredoes not require heavy computing power, <strong>and</strong> can thusrun easily <strong>on</strong> a Pentium III or higher PC system.Sea <strong>level</strong> dataThe input is assumed to be a c<strong>on</strong>tinuously appended,ASCII-text flat file c<strong>on</strong>taining transmissi<strong>on</strong>s of datafrom different <strong>sea</strong> <strong>level</strong> stati<strong>on</strong>s in the Indian Ocean.Each stati<strong>on</strong> <strong>and</strong> its data transmissi<strong>on</strong> are described bya unique set of parameters, including a Satellite ProductHeaders, Stati<strong>on</strong> Platform, method of transmissi<strong>on</strong> <strong>and</strong>transmissi<strong>on</strong> time, <strong>and</strong> file formats (Figure 1).SWIO40 RJTD 250015:ENB 1 #1 M 3908 3908 3910 3909 3911 3909 39123910 3913 3913 3917 3917 3917 3917 3915 39183914 3917 3912 3913 3913 3913 3912 3913 39113908 3908 3905 3909 :ENC 1 #2 3409 3410 3411 34113413 3419 3419 3420 3419 3415 34143418 3411 3408 3410 3409 3409 3408 3409 34093414 3413 3409 3414 3414 3410 3412 3409 34103413 :BATTLOAD 0 12.83 :NAME=91642 46/// /1205 10296 40080 22200 00287555 77744 A0102 516`3 60029 6315B 03024 8303000A07 02548 02901 29631 6B090 24520 2400A 1302590036 00297 317B1 50240 60310 0A190 26230 3800296317 B2102 37103 100A2 50266 50330 02973 18B2702331 02800 A3102 70103 10029 8318B 33022 9202600A37 02736 03401 29831 8B390 22570 2801A 4302766028 00299 319B4 50222 50230 0A490 27960 3400298319 B5102 19202 901A5 50282 20380 02983 19B5702163 03200 BV289 134S1 41249 C0501 22080 0007023677 44777=^^33487552206011307M94168411DZpQ^@@rI}0uW@1[Am@~@BsBYB\AG@BrBYBzAM@BqBZCUAB@BoBZCmA@@BmBZDMAI@BlBZDrAG@BlBZD?AD@BkBZETAL@BjBZEwAGABhBZ”@qv@oL3@[DvAI4B[5Ad6a`=OE0uVW>ZAnA|BYBkCRCqCsDWDnER”@us@so0uVV>YCqC?DBCtDSD[DnDxEGEa”@wh@wB_OLAoP 50+1NN 116WFigure 1. Sample of transmissi<strong>on</strong>s from field stati<strong>on</strong>Data Collecti<strong>on</strong> Platform (DCP) in formats used bythe University of Hawaii Sea Level Center, by AustraliaNati<strong>on</strong>al Tidal Centre, <strong>and</strong> the US Nati<strong>on</strong>al OceanService, respectively.In general, <strong>sea</strong> <strong>level</strong> data are digitized <strong>and</strong> sampled atthe field stati<strong>on</strong>. Ideally, the data transmitted for tsunamim<strong>on</strong>itoring will be 1-minute (or better) averaged datavalues that are transmitted at least every 15 min; currently,stati<strong>on</strong>s transmit every 10–60 minutes <strong>and</strong> dataaverages are at 1 to 4-minute sampling intervals. Thedata are transmitted over a number of different satellitesto regi<strong>on</strong>al telecommunicati<strong>on</strong>s hubs of the WMO,IOC <str<strong>on</strong>g>Manual</str<strong>on</strong>g>s <strong>and</strong> Guides No 14 vol IV77
Sea Level Measurement <strong>and</strong> Interpretati<strong>on</strong>Figure 3. Figure 3. GUI showing all stati<strong>on</strong>s thatwere decoded.Each time-series can be manipulated using a mouse tozoom <strong>and</strong> pick an amplitude or wave period (Figure 4).Figure 2. Transmissi<strong>on</strong> from the data collecti<strong>on</strong> platformat the field stati<strong>on</strong> to the warning centres.<strong>and</strong> <strong>on</strong>wards to customers such as the Pacific TsunamiWarning Center, the Japan Meteorological Agency, <strong>and</strong> toany requesting nati<strong>on</strong>al hydrological agency (Figure 2).In the Indian Ocean, the primary satellites used fortransmissi<strong>on</strong> from the field stati<strong>on</strong>s are the JapaneseGMS for the eastern Indian Ocean <strong>and</strong> the EUMETSAToperati<strong>on</strong>al satellite system for the central <strong>and</strong> westernIndian Ocean. The PTWC receives its data through theUSA GOES satellite system. The satellites are part ofthe GTS. The GTS is a semi-private, reliable communicati<strong>on</strong>ssystemsupported by the 187-member WMO forthe transmissi<strong>on</strong> of envir<strong>on</strong>mental data, informati<strong>on</strong>messages <strong>and</strong> warnings. The GTS is the primary meansby which the PTWC receives <strong>sea</strong> <strong>level</strong> data <strong>and</strong> issuestsunami warnings.TideToolThe programme is started by typing bltwish Tide.tcl. Itdecodes the received <strong>sea</strong> <strong>level</strong> data that are found in asingle data-logging file, creates individual stati<strong>on</strong> filesc<strong>on</strong>taining the decoded data, <strong>and</strong> starts a graphicaluser interface display that allows each stati<strong>on</strong> to bedisplayed as a plot (Figure 3).Figure 4. Sea <strong>level</strong> time-series plot. A mouse is usedto select the part which should be enlarged to pickthe arrival time.Tide.tcl will operate c<strong>on</strong>tinuously <strong>on</strong>ce started. It willcheck every 20 s to see if any new data have arrived,<strong>and</strong> if so, it will decode <strong>and</strong> update the stati<strong>on</strong> timeseriesfile that is plotted. When Tide.tcl is started, itwill read data from the current day data log. Tide.tclwill keep up to 24 hours of data. As more data arrivebey<strong>on</strong>d what Tide.tcl is supposed to hold, it will discardthe older data to make room for the new. For eachstati<strong>on</strong>, two gauges are decoded. The gauge code isthree letters, where prs st<strong>and</strong>s for pressure sensor, bubindicates bubbler etc.For further informati<strong>on</strong> <strong>and</strong> questi<strong>on</strong>s, please c<strong>on</strong>tactthe IOC Internati<strong>on</strong>al Tsunami Informati<strong>on</strong> Centre (itic.tsunami@noaa.gov) or the Pacific Tsunami WarningCenter (stuart.weinstein@noaa.gov).78IOC <str<strong>on</strong>g>Manual</str<strong>on</strong>g>s <strong>and</strong> Guides No 14 vol IV
Sea Level Measurement <strong>and</strong> Interpretati<strong>on</strong>IOC <str<strong>on</strong>g>Manual</str<strong>on</strong>g>s <strong>and</strong> GuidesNo.Title1 rev. 2 Guide to IGOSS Data Archives <strong>and</strong> Exchange (BATHY <strong>and</strong> TESAC). 1993. 27 pp. (English, French, Spanish, Russian)2 Internati<strong>on</strong>al Catalogue of Ocean Data Stati<strong>on</strong>. 1976. (Out of stock)3 rev. 3 Guide to Operati<strong>on</strong>al Procedures for the Collecti<strong>on</strong> <strong>and</strong> Exchange of JCOMM Oceanographic Data. Third Revised Editi<strong>on</strong>,1999. 38 pp. (English, French, Spanish, Russian)4 Guide to Oceanographic <strong>and</strong> Marine Meteorological Instruments <strong>and</strong> Observing Practices. 1975. 54 pp. (English)5 rev. Guide for Establishing a Nati<strong>on</strong>al Oceanographic Data Centre, 1997. 42 pp. (English)6 rev. Wave Reporting Procedures for Tide Observers in the Tsunami Warning System. 1968. 30 pp. (English)7 Guide to Operati<strong>on</strong>al Procedures for the IGOSS Pilot Project <strong>on</strong> Marine Polluti<strong>on</strong> (Petroleum) M<strong>on</strong>itoring. 1976. 50 pp.(French, Spanish)8 (Superseded by IOC <str<strong>on</strong>g>Manual</str<strong>on</strong>g>s <strong>and</strong> Guides No. 16)9 rev. <str<strong>on</strong>g>Manual</str<strong>on</strong>g> <strong>on</strong> Internati<strong>on</strong>al Oceanographic Data Exchange. (Fifth Editi<strong>on</strong>). 1991. 82 pp. (French, Spanish, Russian)9 Annex I (Superseded by IOC <str<strong>on</strong>g>Manual</str<strong>on</strong>g>s <strong>and</strong> Guides No. 17)9 Annex II Guide for Resp<strong>on</strong>sible Nati<strong>on</strong>al Oceanographic Data Centres. 1982. 29 pp. (English, French, Spanish, Russian)10 (Superseded by IOC <str<strong>on</strong>g>Manual</str<strong>on</strong>g>s <strong>and</strong> Guides No. 16)11 The Determinati<strong>on</strong> of Petroleum Hydrocarb<strong>on</strong>s in Sediments. 1982. 38 pp. (French, Spanish, Russian)12 Chemical Methods for Use in Marine Envir<strong>on</strong>ment M<strong>on</strong>itoring. 1983. 53 pp. (English)13 <str<strong>on</strong>g>Manual</str<strong>on</strong>g> for M<strong>on</strong>itoring Oil <strong>and</strong> Dissolved/Dispersed Petroleum Hydrocarb<strong>on</strong>s in Marine Waters <strong>and</strong> <strong>on</strong> Beaches. 1984. 35pp. (English, French, Spanish, Russian)14 <str<strong>on</strong>g>Manual</str<strong>on</strong>g> <strong>on</strong> Sea-Level Measurements <strong>and</strong> Interpretati<strong>on</strong>.Vol. I: Basic Procedure. 1985. 83 pp. (English, French, Spanish, Russian)Vol. II: Emerging Technologies. 1994. 72 pp. (English)Vol. III: Reappraisals <strong>and</strong> Recommendati<strong>on</strong>s as of the year 2000. 2002. 55 pp. (English)Vol. IV: An Update to 2006. 2006. 78 pp. (English)15 Operati<strong>on</strong>al Procedures for Sampling the Sea-Surface Microlayer. 1985. 15 pp. (English)16 Marine Envir<strong>on</strong>mental Data Informati<strong>on</strong> Referral Catalogue. Third Editi<strong>on</strong>. 1993. 157 pp. (Composite English/French/Spanish/Russian)17 GF3: A General Formatting System for Geo-referenced DataVol. 1: Introductory Guide to the GF3 Formatting System. 1993. 35 pp. (English, French, Spanish, Russian)Vol. 2: Technical Descripti<strong>on</strong> of the GF3 Format <strong>and</strong> Code Tables. 1987. 111 pp. (English, French, Spanish, Russian)Vol. 3: St<strong>and</strong>ard Subsets of GF3. 1996. 67 pp. (English)Vol. 4: User Guide to the GF3-Proc Software. 1989. 23 pp. (English, French, Spanish, Russian)Vol. 5: Reference <str<strong>on</strong>g>Manual</str<strong>on</strong>g> for the GF3-Proc Software. 1992. 67 pp. (English, French, Spanish, Russian)Vol. 6: Quick Reference Sheets for GF3 <strong>and</strong> GF3-Proc. 1989. 22 pp. (English, French, Spanish, Russian)18 User Guide for the Exchange of Measured Wave Data. 1987. 81 pp. (English, French, Spanish, Russian)19 Guide to IGOSS Specialized Oceanographic Centres (SOCs). 1988. 17 pp. (English, French, Spanish, Russian)20 Guide to Drifting Data Buoys. 1988. 71 pp. (English, French, Spanish, Russian)21 (Superseded by IOC <str<strong>on</strong>g>Manual</str<strong>on</strong>g>s <strong>and</strong> Guides No. 25)22 GTSPP Real-time Quality C<strong>on</strong>trol <str<strong>on</strong>g>Manual</str<strong>on</strong>g>. 1990. 122 pp. (English)23 Marine Informati<strong>on</strong> Centre Development: An Introductory <str<strong>on</strong>g>Manual</str<strong>on</strong>g>. 1991. 32 pp. (English, French, Spanish, Russian)IOC <str<strong>on</strong>g>Manual</str<strong>on</strong>g>s <strong>and</strong> Guides No 14 vol IV79
Sea Level Measurement <strong>and</strong> Interpretati<strong>on</strong>No.Title24 Guide to Satellite Remote Sensing of the Marine Envir<strong>on</strong>ment. 1992. 178 pp. (English)25 St<strong>and</strong>ard <strong>and</strong> Reference Materials for Marine Science. Revised Editi<strong>on</strong>. 1993. 577 pp. (English)26 <str<strong>on</strong>g>Manual</str<strong>on</strong>g> of Quality C<strong>on</strong>trol Procedures for Validati<strong>on</strong> of Oceanographic Data. 1993. 436 pp. (English)27 Chlorinated Biphenyls in Open Ocean Waters: Sampling, Extracti<strong>on</strong>, Clean-up <strong>and</strong> Instrumental Determinati<strong>on</strong>. 1993. 36pp. (English)28 Nutrient Analysis in Tropical Marine Waters. 1993. 24 pp. (English)29 Protocols for the Joint Global Ocean Flux Study (JGOFS) Core Measurements. 1994. 178 pp . (English)30 MIM Publicati<strong>on</strong> Series:Vol. 1: Report <strong>on</strong> Diagnostic Procedures <strong>and</strong> a Definiti<strong>on</strong> of Minimum Requirements for Providing Informati<strong>on</strong> Services <strong>on</strong>a Nati<strong>on</strong>al <strong>and</strong>/or Regi<strong>on</strong>al Level. 1994. 6 pp. (English)Vol. 2: Informati<strong>on</strong> Networking: The Development of Nati<strong>on</strong>al or Regi<strong>on</strong>al Scientific Informati<strong>on</strong> Exchange. 1994. 22 pp.(English)Vol. 3: St<strong>and</strong>ard Directory Record Structure for Organizati<strong>on</strong>s, Individuals <strong>and</strong> their Re<strong>sea</strong>rch Interests. 1994. 33 pp.(English)31 HAB Publicati<strong>on</strong> Series:Vol. 1: Amnesic Shellfish Pois<strong>on</strong>ing. 1995. 18 pp. (English)32 Oceanographic Survey Techniques <strong>and</strong> Living Resources Assessment Methods. 1996. 34 pp. (English)33 <str<strong>on</strong>g>Manual</str<strong>on</strong>g> <strong>on</strong> Harmful Marine Microalgae. 1995. (English) [superseded by a sale publicati<strong>on</strong> in 2003, 92-3-103871-0.UNESCO Publishing]34 Envir<strong>on</strong>mental Design <strong>and</strong> Analysis in Marine Envir<strong>on</strong>mental Sampling. 1996. 86 pp. (English)35 IUGG/IOC Time Project. Numerical Method of Tsunami Simulati<strong>on</strong> with the Leap-Frog Scheme. 1997. 122 pp. (English)36 Methodological Guide to Integrated Coastal Z<strong>on</strong>e Management. 1997. 47 pp. (French, English)37 Post-Tsunami Survey Field Guide. First Editi<strong>on</strong>. 1998. 61 pp. (English, French, Spanish, Russian)38 Guidelines for Vulnerability Mapping of Coastal Z<strong>on</strong>es in the Indian Ocean. 2000. 40 pp. (French, English)39 Cancelled40 Guidelines for the Study of Shoreline Change in the Western Indian Ocean Regi<strong>on</strong>. 2000. 73 pp. (English)41 Potentially Harmful Marine Microalgae of the Western Indian OceanMicroalgues potentiellement nuisibles de l’océan Indien occidental. 2001. 104 pp. (English/French)42 Des outils et des hommes pour une gesti<strong>on</strong> intégrée des z<strong>on</strong>es côtières - Guide méthodologique, vol.II/Steps <strong>and</strong> Tools Towards Integrated Coastal Area Management – Methodological Guide, Vol. II. 2001. 64 pp. (French,English; Spanish)43 Black Sea Data Management Guide (Under preparati<strong>on</strong>)44 Submarine Groundwater Discharge in Coastal Areas – Management implicati<strong>on</strong>s, <strong>measurement</strong>s <strong>and</strong> effects. 2004.35 pp. (English)45 A Reference Guide <strong>on</strong> the Use of Indicators for Integrated Coastal Management. 2003. 127 pp. (English). ICAM DossierNo. 180IOC <str<strong>on</strong>g>Manual</str<strong>on</strong>g>s <strong>and</strong> Guides No 14 vol IV