Create successful ePaper yourself
Turn your PDF publications into a flip-book with our unique Google optimized e-Paper software.
URALKALI • ANNUAL REPORT <strong>2010</strong><br />
ANNUAL REPORT<br />
2 0 1 0
DISCLAIMER<br />
This annual report has been prepared on the basis of the information available to the Open Joint Stock Company <strong>Uralkali</strong> and its<br />
subsidiaries (hereinafter, <strong>Uralkali</strong>) as at the date hereof.<br />
This annual report contains forward looking statements. All forward looking statements contained herein and all subsequent<br />
oral or written forward looking statements attributable to <strong>Uralkali</strong> or any persons acting on its behalf are expressly qualifi ed in their<br />
entirety by the cautionary statements below.<br />
All statements included in this annual report, other than statements of historical facts, may be forward looking statements. Words<br />
such as “forecasts”, “believes”, “expects”, “intends”, “plans”, “prediction”, “will”, “may”, “should”, “could”, “anticipates”, “estimates”,<br />
“seeks”, “considers”, “assumes”, “continues”, “strives”, “projects”, or any expression or word with similar meaning or the negative<br />
thereof, usually indicate the forward looking nature of the statement.<br />
Forward looking statements may include statements relating to <strong>Uralkali</strong>’s operations, fi nancial performance, earnings, economic<br />
indicators, results of operation and production activities, dividend policies, capital expenditures, as well as trends relating to<br />
commodity prices, production and consumption volumes, costs, expenses, development prospects, useful lives of assets, reserves,<br />
the commencement and completion dates of certain production projects, and the acquisition, liquidation or disposal of certain<br />
entities, and other similar factors and economic projections with respect to <strong>Uralkali</strong>’s business, as well as the industry and markets<br />
in which it operates.<br />
Forward looking statements are not guarantees of future performance. They involve numerous assumptions regarding the present<br />
and future strategies of <strong>Uralkali</strong> and the environment in which it operates and will operate in the future and involve a number of<br />
known and unknown risks, uncertainties and other factors that could cause <strong>Uralkali</strong>’s or its industry’s actual results, levels of activity,<br />
performance or achievements to be materially different from any future results, levels of activity, performance or achievements<br />
expressed or implied by such forward looking statements.<br />
<strong>Uralkali</strong> provides no assurance whatsoever that its or its industry’s actual results, levels of activity, performance or achievements<br />
will be consistent with the future results, levels of activity, performance or achievements expressed or implied by any forward looking<br />
statements contained in this annual report or otherwise. <strong>Uralkali</strong> accepts no responsibility for any losses whatsoever that may result<br />
from any person’s reliance on any such forward looking statements.<br />
Except where required by applicable law, <strong>Uralkali</strong> expressly disclaims any obligation or undertaking to disseminate or publish<br />
any updates or amendments to forward looking statements to refl ect any change in expectations or new information or subsequent<br />
events, conditions or circumstances.<br />
Table of Contents<br />
1
TABLE OF CONTENTS<br />
Disclaimer 1<br />
1. Introduction 4<br />
1.1. Chairman’s Statement 4<br />
1.2. CEO's Statement 6<br />
1.3. <strong>Uralkali</strong>’s Key Figures 8<br />
2. Calendar of Major Events 12<br />
3. Group Description 14<br />
4. <strong>Uralkali</strong> Strategic Overview 16<br />
5. <strong>Uralkali</strong> and Silvinit: Proposed Combination 17<br />
6. What is Potash 25<br />
7. Potash Market 28<br />
8. Sales Review 31<br />
8.1. Export Sales 32<br />
8.2. Domestic Sales 32<br />
8.3. <strong>Uralkali</strong>’s Sales Geography 34<br />
9. Operations Review 36<br />
9.1. Production in <strong>2010</strong> 36<br />
9.2. Capacity Expansion Plans 38<br />
10. Financial Review 39<br />
10.1. Financial Management Discussion and Analysis 39<br />
10.2. Consolidated Financial Statements and Auditor’s <strong>Report</strong> 45<br />
11. Corporate and Social Responsibility 90<br />
11.1. Employees 90<br />
11.2. Labour Protection and Industrial Safety 91<br />
11.3. Environment 92<br />
11.4. Social Programmes 94<br />
12. Corporate Governance 98<br />
12.1. Principles and Structure of Corporate Governance 98<br />
12.2. Membership of the Board of Directors 111<br />
12.3. Information for Shareholders and Investors 117<br />
13. Risk Management 122<br />
13.1. <strong>Uralkali</strong>’s Risk Management System 122<br />
13.2. Key Risk Factors<br />
13.3. Key Features of Internal Control and the Risk Management System<br />
123<br />
in Relation to the Financial <strong>Report</strong>ing Process 125<br />
14. Responsibility Statement 127<br />
15. Review of the Mineral Resources and Ore Reserves 128<br />
16. Glossary 135
CHAIRMAN’S STATEMENT<br />
Dear Shareholders,<br />
This is the first time that I have addressed you<br />
as Chairman of the <strong>Uralkali</strong> Board of Directors.<br />
In the autumn of <strong>2010</strong>, when the <strong>Uralkali</strong> Board of<br />
Directors was re-elected, I was offered the position<br />
of the Chairman.<br />
It is true that the potash industry has uniquely<br />
attractive fundamental characteristics. Other<br />
nutrients cannot be substituted for potassium which<br />
is vital to the healthy growth of crops, the demand<br />
for which is constantly increasing. Consequently, the<br />
requirement for potash fertilisers is growing as well.<br />
At the same time, potash reserves of a good quality<br />
are scarce while the barriers to entry into the potash<br />
mining industry are high. Due to the production<br />
costs which are among the lowest in the industry,<br />
<strong>Uralkali</strong> is well positioned in the potash industry.<br />
<strong>2010</strong> was the year of change for <strong>Uralkali</strong>. The<br />
controlling stake in the Company was sold to new<br />
principle shareholders. This paved the way to the<br />
combination with Silvinit – the other largest potash<br />
producer in Russia. The management teams of<br />
both companies had been in discussion about the<br />
possibility of a merger for some time and – once the<br />
changes in shareholding structures of the companies<br />
were complete – the merger process became a reality.<br />
In December the Boards of <strong>Uralkali</strong> and Silvinit<br />
approved the merger leading to the creation of one<br />
of the global potash market leaders.<br />
4 <strong>Uralkali</strong> | <strong>Annual</strong> <strong>Report</strong> <strong>2010</strong> Table of Contents
CHAIRMAN’S STATEMENT<br />
The merger with Silvinit is expected to be value<br />
accretive for all <strong>Uralkali</strong> and Silvinit shareholders<br />
due to the companies’ synergy potential as well as<br />
improvements in global and Russian potash markets.<br />
Before 1983 <strong>Uralkali</strong> and Silvinit had operated the<br />
same production plant. Therefore, the concept of<br />
the creation of the Combined Company progressed<br />
naturally from their operations and the necessity<br />
to increase overall capitalisation. The combination<br />
was approved by the shareholders of both companies<br />
and it is expected to be completed during the second<br />
quarter of 2011.<br />
The strategy of the combined <strong>Uralkali</strong> will<br />
remain the same — raising effi ciency in production<br />
and sales of potassium chloride. The Company will<br />
continue to strengthen its position as one of the<br />
leading companies in the potash market through the<br />
realisation of its growth strategy. <strong>Uralkali</strong> intends to<br />
self-fund the investment projects aimed at capacity<br />
expansion in order to satisfy the growing demand<br />
for potash. The time-frame for the launch of new<br />
production capacity will be determined by the<br />
market supply/demand balance.<br />
The combined Company intends to uphold as well<br />
as to improve <strong>Uralkali</strong>’s already high standards of<br />
corporate governance. The Company will maintain<br />
transparency to its investors and respect for the rights<br />
Table of Contents<br />
of all its shareholders. The Company will strive to<br />
uphold appropriate levels of information disclosure.<br />
Independent directors will play an important role in<br />
the activities of the Board of Directors; furthermore,<br />
their infl uence will increase in the future.<br />
<strong>Uralkali</strong>’s dividend policy will remain effectively<br />
unchanged. The Company is planning to pay<br />
signifi cant part of the net income to the shareholders.<br />
Thus, the Company intends to continue its efforts<br />
to increase market capitalisation in the interests<br />
of all shareholders and other stakeholders in the<br />
Company.<br />
New challenging projects lie ahead of us: they will<br />
allow us to realise <strong>Uralkali</strong>’s potential and raise it to<br />
the leading position in the global potash industry.<br />
Alexander Voloshin<br />
5
CEO'S STATEMENT<br />
Dear Shareholders,<br />
As the global economy gradually recovered during<br />
<strong>2010</strong>, positive trends returned to the potash market.<br />
Potash demand stabilised due to the restoration<br />
of prices for agricultural products which allowed<br />
<strong>Uralkali</strong> to reach the pre-crisis level of production.<br />
In March <strong>2010</strong>, <strong>Uralkali</strong>’s trader – Belarusian<br />
Potash Company (BPC) – signed a contract with<br />
India, the parameters of which are considered<br />
indicative for the whole market. In December BPC<br />
signed an agreement with Yara, the world’s first<br />
mineral fertiliser producer, which became one<br />
of the largest contracts in the history of potash<br />
industry. These contracts laid a solid foundation for<br />
reaching production goals in <strong>2010</strong> as well as for price<br />
growth for <strong>Uralkali</strong>’s products. Furthermore, at the<br />
beginning of 2011 BPC reached an agreement over<br />
potash supplies with Chinese importers.<br />
Thanks to the recovery of potash fertiliser demand<br />
in key markets, <strong>Uralkali</strong>’s financial performance<br />
in <strong>2010</strong> significantly exceeded 2009 level. Thus,<br />
the Company’s revenues amounted to 51.6 billion<br />
RUR, which is 53% higher than the 2009 levels.<br />
<strong>Uralkali</strong>’s net profi t was 16.7 billion RUR, up 83%<br />
on 2009 levels. EBITDA margin increased to 60%,<br />
as compared to 56% in 2009.<br />
Overall, in <strong>2010</strong> the Company almost doubled its<br />
production volumes in comparison with previous<br />
year and produced about 5.1 million tonnes of<br />
potash. We strongly believe that the trends of demand<br />
and potash prices growth will remain stable in the<br />
future, which will encourage <strong>Uralkali</strong> to increase its<br />
production capacity.<br />
During <strong>2010</strong> <strong>Uralkali</strong> continued to focus its<br />
efforts on capacity modernisation. One of the key<br />
projects was the capacity expansion of Berezniki-4,<br />
a part of the Company’s larger programme aimed<br />
at production modernisation. We continue to<br />
realise this programme in 2011. In 2012, after the<br />
6 <strong>Uralkali</strong> | <strong>Annual</strong> <strong>Report</strong> <strong>2010</strong> Table of Contents
CEO'S STATEMENT<br />
programme has been successfully implemented,<br />
<strong>Uralkali</strong> will achieve new levels of production<br />
capacity which will amount to 7 million tonnes.<br />
In <strong>2010</strong> <strong>Uralkali</strong> continued to support the<br />
Russian agricultural sector. Prior to the spring<br />
sowing season, in line with the recommendations<br />
of Russia’s Ministry of Industry and Trade and the<br />
Federal Antimonopoly Service (FAS), the Company<br />
set subsidised prices for Russian complex fertiliser<br />
producers and Russian agricultural producers.<br />
These prices remained effective until the end<br />
of <strong>2010</strong>. Moreover, the subsidised price for the<br />
agricultural producers is maintained in the first<br />
half of 2011. From the beginning of 2011 onwards,<br />
complex fertiliser producers started purchasing<br />
potash at the minimum export price. However, to<br />
boost fertiliser deliveries to the domestic market,<br />
we will provide complex fertiliser producers with<br />
additional discounts for potash volumes intended<br />
for the production of complex fertilisers for sales on<br />
the domestic market.<br />
In <strong>2010</strong> the sale of the controlling share of <strong>Uralkali</strong><br />
marked a milestone in the Company’s history. After<br />
it was carried through, <strong>Uralkali</strong> set out to merge<br />
with Silvinit – a Russian potash producer that also<br />
develops the Verkhnekamskoye potash-magnesium<br />
salts fi eld. If the transaction is executed successfully,<br />
the Combined company will match by size the largest<br />
players in the world potash market. Moreover, it will<br />
continue to expand due to its organic growth and<br />
long-term investment programme. For example, it<br />
is planned to raise the capacities of the Combined<br />
Company from 10.6 million tonnes in <strong>2010</strong> to<br />
13 million tonnes in 2012 through several brownfi eld<br />
projects. The Company will also have the licences<br />
to develop two rich fi elds of the Verkhnekamskoye<br />
deposit, which will ensure a signifi cant increase in<br />
production volumes.<br />
Despite the changes, <strong>Uralkali</strong>’s management team<br />
remained essentially the same. The rationale is clear:<br />
Table of Contents<br />
the team is highly profi cient, devoted to its work and<br />
the Company, and is capable of achieving the most<br />
ambitious goals set by the Board of Directors.<br />
I would like to reassure all our stakeholders that<br />
the merger will be carried out with strict adherence<br />
to the principles of social responsibility which have<br />
always guided <strong>Uralkali</strong>’s activities. Regarding the<br />
proposed Combination, we will not forget about<br />
our employees who have always been the main<br />
asset of <strong>Uralkali</strong> and the keystone of its success.<br />
The Company intends to continue supporting its<br />
employees and their families through a wide range<br />
of social programmes. The Company will also assist<br />
the cities of Berezniki and Solikamsk where its<br />
production facilities are located and where most of its<br />
employees live. To remain among the most attractive<br />
and socially responsible employers in the Russian<br />
mining industry has always been one of <strong>Uralkali</strong>’s<br />
highest priorities.<br />
Vladislav Baumgertner<br />
7
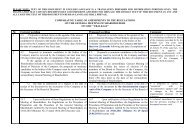
URALKALI KEY FIGURES<br />
<strong>Uralkali</strong> is one of the leading global potash fertiliser producers. The Company is vertically integrated,<br />
with control over the whole production chain, from potash ore mining to the supply of the ultimate<br />
consumers. <strong>Uralkali</strong> production assets are located in Berezniki, Perm Region (Russia) and include two<br />
mines and four processing plants. <strong>Uralkali</strong> current capacity is 5.5 million tonnes of KCl. In <strong>2010</strong> the<br />
Company produced 5.1 million tonnes of KCl.<br />
Currently, <strong>Uralkali</strong> is in the process of combination with Silvinit, another Russian potash producer.<br />
The Proposed Combination will create one of the world's leading potash producers.<br />
KEY FINANCIAL INDICATORS<br />
(RUR MLN) I<br />
2006 2007 2008 2009 <strong>2010</strong><br />
Revenues 22,290 29,499 62,798 33,809 51,592<br />
Net Sales II 16,673 22,673 54,355 29,314 40,603<br />
Cost of Sales (COGS) (6,307) (7,108) (9,410) (8,878) (11,830)<br />
COGS to Net Sales % 38% 31% 17% 30% 29%<br />
Gross Profi t 15,983 22,391 53,388 24,931 39,762<br />
Distribution Cost (6,691) (7,957) (9,840) (6,075) (12,819)<br />
General and Administrative Expenses (2,058) (3,473) (3,204) (3,838) (4,937)<br />
EBITDA III 8,558 12,098 41,349 16,375 24,298<br />
EBITDA Margin IV 51% 53% 76% 56% 60%<br />
Net Income 3,494 8,045 21,943 9,095 16,654<br />
Net Income Margin V 21% 35% 40% 31% 41%<br />
CAPEX 5,198 6,316 14,341 14,105 10,257<br />
Debt (bank loans) 11,088 10,600 13,987 13,463 11,253<br />
EQUITY 17,650 25,074 34,620 43,715 56,797<br />
CASH AND CASH EQUIVALENTS 2,892 7,291 16,174 4,297 14,765<br />
Notes<br />
I. All fi nancial indicators are based on IFRS Consolidated Financial Statements<br />
and are given in million RUR unless otherwise stated<br />
II. Net Sales is calculated as sales net of freight, railway tariff and transhipment<br />
costs<br />
III. Throughout the report EBITDA means adjusted EBITDA – calculated as<br />
Operating Profi t plus depreciation and amortisation and does not include mine<br />
fl ooding costs<br />
IV. EBITDA Margin is calculated as EBITDA divided by Net Sales<br />
V. Net Income Margin is calculated as Net Income divided by Net Sales<br />
KEY OPERATION INDICATORS<br />
(THS. TONNES)<br />
2006 2007 2008 2009 <strong>2010</strong><br />
Sales Volume 4,343 5,060 4,668 2,497 5,079<br />
Export 3,905 4,575 4,141 1,895 4,397<br />
Domestic 438 485 527 602 682<br />
Production Volume 4,165 5,119 4,793 2,621 5,061<br />
AUDITED MINERAL RESOURCE STATEMENT<br />
AS OF 1 JANUARY 2011 I<br />
All Mines<br />
Consumer Price Index (CPI) (Dec. <strong>2010</strong> – Dec. 2009) 8.8% III<br />
Consumer Price Index for food (CPI) (Dec. <strong>2010</strong> – Dec. 2009) 12.9%<br />
Producer Price Index (PPI) (Dec. <strong>2010</strong> – Dec. 2009) 3.0% IV<br />
RUR/US$ (average for <strong>2010</strong>) 30.36 V<br />
RUR/US$ (as of the end of <strong>2010</strong>) 30.48 VI<br />
Notes<br />
I. JORC valuation report as of 1 January 2011<br />
II. Federal State Statistics Service statistical review on socio-economic situation<br />
in the Russian Federation for <strong>2010</strong><br />
III. Includes food and non-food merchandise, as well as services, in the Russian<br />
Federation<br />
mln tonnes K 2 O, % K 2 O, mln tonnes<br />
Measured 1,338.1 21.3 284.7<br />
Indicated 2,106.7 20.8 438.2<br />
Inferred 310.3 26.8 83.3<br />
Total Measured + Indicated 3,444.8 21.0 723.0<br />
MACRO ECONOMIC FIGURES<br />
FOR <strong>2010</strong> II<br />
NB<br />
Additional Information:<br />
• FINANCIAL MANAGEMENT DISCUSSION AND ANALYSIS (P. 39)<br />
•REVIEW OF THE MINERAL RESOURCES (P. 128)<br />
IV. For potash mineral or chemical fertiliser producers<br />
V. Average Exchange Rate of Central Bank of the Russian Federation for the<br />
period from 1 January <strong>2010</strong> to 31 December <strong>2010</strong><br />
VI. Offi cial Exchange Rate set by Central Bank of the Russian Federation as of<br />
31 December <strong>2010</strong><br />
8 <strong>Uralkali</strong> | <strong>Annual</strong> <strong>Report</strong> <strong>2010</strong> Table of Contents Table of Contents<br />
9
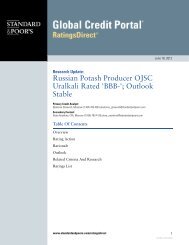
KEY FINANCIAL INDICATORS<br />
Net Sales<br />
RUR bln<br />
60<br />
50<br />
40<br />
30<br />
20<br />
10<br />
0<br />
EBITDA, Margin %<br />
RUR bln<br />
48<br />
40<br />
32<br />
24<br />
16<br />
8<br />
0<br />
CAPEX Evolution<br />
RUR bln<br />
16<br />
12<br />
8<br />
4<br />
0<br />
51%<br />
8.6<br />
16.7<br />
2006 2007 2008 2009 <strong>2010</strong><br />
EBITDA adjusted EBITDA Margin, %<br />
5.2<br />
53%<br />
12.1<br />
22.7<br />
6.3<br />
76%<br />
41.3<br />
54.4<br />
14.3<br />
56%<br />
16.4<br />
29.3<br />
2006 2007 2008 2009 <strong>2010</strong><br />
14.1<br />
60%<br />
10.3<br />
2006 2007 2008 2009 <strong>2010</strong><br />
Expansion (inc. cost cutting) Maintenance<br />
Note<br />
I. Cash cost of goods sold = Cost of goods sold less depreciation<br />
40.6<br />
80%<br />
60%<br />
40%<br />
24.3<br />
20%<br />
0%<br />
Cash Cost of Goods Sold I<br />
RUR bln RUR ths. /tonne<br />
10<br />
8<br />
6<br />
4<br />
2<br />
0<br />
Net Income, Margin %<br />
RUR bln<br />
25<br />
20<br />
15<br />
10<br />
5<br />
0<br />
Operating Cash Flow<br />
RUR bln<br />
35<br />
30<br />
25<br />
20<br />
15<br />
10<br />
5<br />
0<br />
4.9<br />
1.1<br />
21%<br />
3.5<br />
2006 2007 2008 2009 <strong>2010</strong><br />
Net Income Net Income Margin, %<br />
6.6<br />
5.7<br />
1.1<br />
35%<br />
8.0<br />
8.2<br />
7.5<br />
1.6<br />
40%<br />
21.9<br />
32.6<br />
2.6<br />
6.4<br />
Cash COGS Cash COGS per ton<br />
31%<br />
9.1<br />
4.5<br />
8.7<br />
1.7<br />
2006 2007 2008 2009 <strong>2010</strong><br />
41%<br />
16.7<br />
45%<br />
36%<br />
27%<br />
18%<br />
21.2<br />
2006 2007 2008 2009 <strong>2010</strong><br />
3.2<br />
2.4<br />
1.6<br />
0.8<br />
0<br />
9%<br />
0%<br />
Cash, Net Debt<br />
RUR bln<br />
20<br />
15<br />
10<br />
5<br />
0<br />
–5<br />
5.1<br />
2.9<br />
3.3<br />
7.3<br />
(2.2)<br />
16.2<br />
9.2<br />
4.3<br />
(3.5)<br />
2006 2007 2008 2009 <strong>2010</strong><br />
Cash Net Debt Dividends Payout Ratio, %<br />
OPERATING STATISTICS<br />
Production Volumes<br />
mln tonnes<br />
6<br />
5<br />
4<br />
3<br />
2<br />
1<br />
0<br />
4.2<br />
5.1<br />
4.8<br />
14.8<br />
2006 2007 2008 2009 <strong>2010</strong><br />
Average Potash Price: Export vs Domestic<br />
US$/tonne<br />
600<br />
400<br />
181<br />
200<br />
189<br />
0<br />
110<br />
219<br />
228<br />
137<br />
566<br />
529<br />
244<br />
485<br />
2.6<br />
405<br />
151<br />
352<br />
2006 2007 2008 2009 <strong>2010</strong><br />
Export Potash Price Domestic Potash Price<br />
Realised Potash Price<br />
5.1<br />
326<br />
149<br />
Dividends Payout Ratio<br />
100%<br />
80%<br />
60%<br />
40%<br />
20%<br />
0%<br />
55%<br />
Sales Volume<br />
mln tonnes<br />
6<br />
5<br />
4<br />
3<br />
2<br />
1<br />
0<br />
97%<br />
50%<br />
39%<br />
40%<br />
2005 2006 2007 2008 2009<br />
Potash Sales Structure<br />
40%<br />
30%<br />
20%<br />
10%<br />
0%<br />
4.3<br />
2006 2007 2008 2009 <strong>2010</strong><br />
Brazil<br />
5.1<br />
10% 10%<br />
4.7<br />
11%<br />
24%<br />
2.5<br />
Sales volume Domestic Sales, %<br />
5.1<br />
30%<br />
25%<br />
20%<br />
15%<br />
13% 10%<br />
China India Russia SEA Europe USA Other<br />
2006 2007 2008 2009 <strong>2010</strong><br />
10 <strong>Uralkali</strong> | <strong>Annual</strong> <strong>Report</strong> <strong>2010</strong> Table of Contents Table of Contents<br />
11<br />
5%<br />
0%
CALENDAR OF MAJOR <strong>2010</strong> EVENTS–2011<br />
12 March 9 April 15 April 14 June 18 June<br />
4 August<br />
7 September<br />
12 March 20 August 17 September<br />
12 MARCH<br />
India contract<br />
Belarusian Potash Company informed <strong>Uralkali</strong><br />
that it had agreed a contract with major Indian<br />
potash importer IPL. According to the contract<br />
terms, from April <strong>2010</strong> till March 2011 BPC will<br />
supply 900 thousand tonnes of potash at the price<br />
of US$ 370 (CFR).<br />
12 MARCH<br />
The Company allocates funds for the<br />
construction of Yayva-Solikamsk railroad<br />
In line with <strong>Uralkali</strong>’s social responsibility efforts,<br />
the Company volunteered to allocate an additional<br />
1 billion RUR to compensate Russian Railways<br />
for the costs it incurred in the construction of a<br />
53-kilometer Yayva-Solikamsk railroad bypass.<br />
Therefore, the Company's total allocations to<br />
pay the expenses incurred by Russian Railways to<br />
fi nance the construction of the Yayva-Solikamsk<br />
bypass is 6 billion RUR.<br />
9 APRIL<br />
Price levels for Russian agricultural<br />
producers<br />
<strong>Uralkali</strong> decided to maintain the price for<br />
potassium chloride for Russian agricultural<br />
producers at 4,250 RUR per tonne in Q2 of <strong>2010</strong>.<br />
This decision is in line with <strong>Uralkali</strong>’s policy to<br />
support Russian agricultural sector (for further<br />
information see 15 November <strong>2010</strong>).<br />
15 APRIL<br />
Contracts with Aсron and Uralchem<br />
<strong>Uralkali</strong> signed agreements to supply Russian<br />
complex fertiliser producers Acron and Uralchem<br />
with potassium chloride at 4,300 RUR per tonne<br />
in <strong>2010</strong>. Under the agreements, <strong>Uralkali</strong> supplied<br />
450 thousand tonnes of potash to Aсron and about<br />
85 thousand tonnes for Uralchem in <strong>2010</strong>. These<br />
volumes allowed for the Russian farmers’ demand<br />
for complex fertiliser to be fully met in <strong>2010</strong><br />
(for further information see 17 November <strong>2010</strong>,<br />
20 December <strong>2010</strong>).<br />
14 JUNE<br />
Holdings in the Company<br />
Madura Holding Limited, the main shareholder of<br />
<strong>Uralkali</strong>, informed <strong>Uralkali</strong> that it had disposed of<br />
53.2% of the issued share capital of the Company<br />
to Kaliha Finance Limited (“Kaliha”), Aerellia<br />
Investments Limited (“Aerellia”) and Becounioco<br />
Holdings Limited (“Becounioco”) on 11 June <strong>2010</strong>.<br />
Kaliha, Aerellia and Becounioco are benefi cially<br />
owned by Mr. Suleyman Kerimov, Mr. Alexander<br />
Nesis and Mr. Filaret Galchev, respectively. In the<br />
course of the disposal, the largest stake (25% of the<br />
Company’s share capital) was acquired by Kaliha<br />
(for further information see 19 April 2011).<br />
18 JUNE<br />
General Shareholders Meeting<br />
<strong>Annual</strong> General Shareholders Meeting of <strong>Uralkali</strong><br />
was held in Berezniki (Perm Region). The <strong>Annual</strong><br />
General Meeting approved the Company’s annual<br />
report and fi nancial statements. Shareholders<br />
resolved to remunerate independent directors for<br />
their work on the Board’s Committees, allocating<br />
16.8 million RUR for this purpose. Shareholders<br />
also resolved not to remunerate the other Board<br />
members. In addition, the AGM approved paying<br />
out 3.6 billion RUR in dividends (1.7 RUR per<br />
ordinary share, 8.5 RUR per GDR) for 2009.<br />
4 AUGUST<br />
P. Grachev appointed CEO of the Company<br />
Following the request of Kaliha Finance Limited,<br />
which holds a 25% stake in <strong>Uralkali</strong>, the Company<br />
held a meeting of its Board of Directors which<br />
passed a resolution on the early termination of<br />
powers of <strong>Uralkali</strong> President and CEO Denis<br />
Morozov. As of 5 August <strong>2010</strong>, the positions of<br />
the company’s President and CEO was to be<br />
taken by Pavel Grachev. Effective 5 August <strong>2010</strong>,<br />
Pavel Grachev was also appointed Chairman of<br />
the <strong>Uralkali</strong> Management Board (for further<br />
information see 21 February 2011).<br />
20 AUGUST<br />
Arbitration court decision regarding<br />
mineral extraction tax payments<br />
The Arbitration Court of Appeal ruled that<br />
the decision and claim of the Interdistrict<br />
Inspectorate No. 3 of the Federal Tax Service for<br />
Major Taxpayers, that <strong>Uralkali</strong> would pay mineral<br />
extraction tax of 604 million RUR for 2005–2006<br />
together with charges and penalties, be held null<br />
and void. The Company received the tax claim for<br />
this amount in January <strong>2010</strong>. The company then<br />
appealed to the courts against the decision and<br />
claim of the tax authority (for further information<br />
see 14 January 2011).<br />
7 SEPTEMBER<br />
<strong>Uralkali</strong>’s shares admitted to the quotation<br />
list “B” on MICEX<br />
<strong>Uralkali</strong>’s ordinary shares were admitted to the<br />
quotation list “B” on MICEX. <strong>Uralkali</strong> started<br />
trading its chares in the quotation list “B” on<br />
9 September <strong>2010</strong>.<br />
17 SEPTEMBER<br />
New Board of Directors of <strong>Uralkali</strong> elected<br />
<strong>Uralkali</strong>’s General Meeting of the Shareholders<br />
resolved to elect new members of the Company’s<br />
Board of Directors.<br />
15 OCTOBER<br />
<strong>Uralkali</strong>’s shares recognised as “Best<br />
Performing” in RTS index<br />
<strong>Uralkali</strong>’s shares were named “Best Performing<br />
in RTS Index”. Since 1 July 2003, when <strong>Uralkali</strong>’s<br />
shares were fi rst included in the Index, their<br />
value has grown 58.9 times from US$ 0.0715 to<br />
US$ 4.21. Thus, they demonstrated the largest<br />
growth in value among stock currently included<br />
in the RTS Index.<br />
15 NOVEMBER<br />
Price levels for Russian agricultural<br />
producers<br />
<strong>Uralkali</strong> decided to maintain the price for supplies<br />
to the Russian agricultural producers at the same<br />
level as in the second half of <strong>2010</strong>. In the fi rst half<br />
of 2011 the price was left at 4,250 RUR per tonne,<br />
which is signifi cantly lower than the global potash<br />
prices (for further information see 9 April <strong>2010</strong>).<br />
17 NOVEMBER<br />
Long-term contracts with ЕuroChem<br />
and PhosAgro<br />
<strong>Uralkali</strong> signed contracts with complex fertiliser<br />
producers, PhosAgro and ЕuroChem, to supply<br />
muriate of potash (MOP) at the price linked to the<br />
minimum export price. The contracts will remain<br />
effective from 1 January 2011 until 1 January<br />
2014. In order to support Russian agricultural<br />
producers, contracts specify premiums for the<br />
potash volumes intended for the domestic market<br />
(for further information see 15 April <strong>2010</strong>;<br />
20 December <strong>2010</strong>).<br />
25 NOVEMBER<br />
Surface subsidence near Berezniki<br />
A soil subsidence occurred under the train tracks<br />
of a 6-km bypass railroad spur near Berezniki<br />
(Perm Region). The subsidence occurred outside<br />
of the <strong>Uralkali</strong> industrial premises. The incident<br />
did not result in any changes in the Company’s<br />
production plan.<br />
13 DECEMBER<br />
Long-term agreement with Yara<br />
BPC informed <strong>Uralkali</strong> about a new long-term<br />
agreement with Norway-based Yara for the supply<br />
of potash. Under the contract, BPC will supply<br />
Yara with more than 1 million tonnes of potash<br />
fertilisers per year from 2011 until 2015. The<br />
price of potash supplied to Yara will be calculated<br />
according to a combination of market indicators.<br />
The contract became one of the largest in the<br />
potash industry’s history.<br />
20 DECEMBER<br />
Proposed combination of <strong>Uralkali</strong> and<br />
Silvinit<br />
The Boards of Directors of <strong>Uralkali</strong> and<br />
Silvinit announced the proposed combination<br />
of <strong>Uralkali</strong> with Silvinit, which would create<br />
a leader in the global potash market. The<br />
proposed combination will be effected through<br />
the acquisition of approximately 20% of Silvinit<br />
ordinary shares for US$ 894.5 per ordinary<br />
Silvinit share, a total sum of US$ 1.4 billion, and<br />
the subsequent merger of <strong>Uralkali</strong> and Silvinit<br />
through the issuance of <strong>Uralkali</strong> ordinary shares<br />
for the remaining ordinary and preferred shares<br />
of Silvinit. The Boards of Directors of <strong>Uralkali</strong><br />
and Silvinit recommended the shareholders<br />
to vote for the proposed acquisition and the<br />
proposed combination (for further information<br />
see 7 February 2011, 28 February 2011,<br />
4 April 2011).<br />
20 DECEMBER<br />
Long-term with contracts with Acron,<br />
Dorogobuzh and Minudobreniya<br />
<strong>Uralkali</strong> signed agreements with compound<br />
fertiliser producers OJSC Acron and OJSC<br />
Dorogobuzh (members of Acron Group) to supply<br />
potash at the price linked to the minimum export<br />
price in 2011–2013. In addition, Silvinit entered<br />
into agreements with OJSC Minudobreniya<br />
(Rossosh) and OJSC Acron about supplies of<br />
potash in 2011–2013. In order to support Russian<br />
12 <strong>Uralkali</strong> | <strong>Annual</strong> <strong>Report</strong> <strong>2010</strong> Table of Contents
15 October 15 November 25 November 13 December 20 December 12 January 7 February 21 February 2 March 21 March 4 April<br />
17 November 20 December 13 January 28 February 25 March 13 April<br />
14 January 19 April<br />
agricultural producers, contracts specify premiums<br />
for the potash volumes intended for the domestic<br />
market (for further information see 15 April <strong>2010</strong>,<br />
17 November <strong>2010</strong>).<br />
12 JANUARY 2011<br />
<strong>Uralkali</strong>’s bonds admitted to trading at<br />
MICEX Stock Exchange<br />
Russia’s MICEX Stock Exchange admitted<br />
<strong>Uralkali</strong> BO-01 exchange-traded bonds of total<br />
nominal value 50 billion RUR to trading without<br />
listing, being placed through a public offer with<br />
a redemption date falling on the 1,092nd day<br />
following the placement commencement date.<br />
Nominal value of each exchange-traded bond<br />
amounts to 1,000 RUR.<br />
13 JANUARY 2011<br />
China contract<br />
BPC informed <strong>Uralkali</strong> that it had agreed a contract<br />
on potash shipments with major Chinese fertiliser<br />
importers Sinochem and CNAMPGC. Under<br />
the contract, BPC will ship 600 thousand tonnes<br />
of potassium chloride (including 120 thousand<br />
tonnes of mutual optional quantities) at the price of<br />
US$ 400 (CFR) from 13 January to 30 June 2011.<br />
14 JANUARY 2011<br />
Arbitration court decision regarding mineral<br />
extraction tax payments<br />
The Russian Federal Arbitration Court in Moscow<br />
Judicial Circuit ruled to leave standing the decision<br />
issued by the Arbitration Court of Appeals and<br />
rejected the ruling and the claim issued by the<br />
Interregional Tax Inspectorate No. 3 for Major<br />
Taxpayers (a Russian Federal Tax Service division)<br />
for <strong>Uralkali</strong> to pay the mineral extraction tax of 604<br />
million RUR for 2005–2006 together with charges<br />
and penalties. Thus, the court entirely dismissed<br />
the cassation appeal fi led by the tax authorities<br />
against the decision issued by the lower court (for<br />
further information see 20 August <strong>2010</strong>).<br />
7 FEBRUARY 2011<br />
Shareholder approval of combination of<br />
<strong>Uralkali</strong> and Silvinit<br />
<strong>Uralkali</strong> announced that the Proposed Combination<br />
of <strong>Uralkali</strong> with Silvinit had been approved by<br />
shareholders of both companies voting at their<br />
Extraordinary General Shareholders Meetings<br />
held on 4 February 2011. Thus, 98.9% of <strong>Uralkali</strong><br />
shareholders voted to approve the merger of<br />
NB<br />
Additional Information:<br />
URALKALI AND SILVINIT: PROPOSED<br />
COMBINATION (P. 17)<br />
SALES REVIEW (P.32)<br />
CORPORATE GOVERNANCE (P. 98)<br />
INFORMATION FOR SHAREHOLDERS<br />
AND INVESTORS (P. 117)<br />
Table of Contents<br />
<strong>Uralkali</strong> and Silvinit. 90.9% of Silvinit shareholders<br />
voted for the related merger as well (for further<br />
information see 20 December <strong>2010</strong>, 28 February<br />
2011, 4 April 2011).<br />
21 FEBRUARY 2011<br />
V. Baumgertner appointed CEO<br />
of the Company<br />
The <strong>Uralkali</strong> Board of Directors resolved to appoint<br />
Vladislav Baumgertner CEO of the Company. The<br />
Board also resolved to cancel the position of <strong>Uralkali</strong><br />
president, and to increase the Company’s authorised<br />
capital by placing 1.2 billion additional uncertifi<br />
cated registered ordinary shares. To complete<br />
the merger, Silvinit ordinary and preferred shares<br />
will be converted into <strong>Uralkali</strong> additional ordinary<br />
shares. Ordinary and preferred shares of Silvinit,<br />
subject to redemption in accordance with requests<br />
from shareholders of Silvinit that voted against or<br />
abstained from voting on reorganisation and/or<br />
approval of a merger agreement, will be cancelled<br />
upon completion of the merger (for further<br />
information see 4 August <strong>2010</strong>).<br />
28 FEBRUARY 2011<br />
Acquisition court decision regarding<br />
temporary injunction<br />
The Perm Regional Arbitrazh Court issued a<br />
temporary injunction on Silvinit shareholder<br />
general meeting decisions and Merger Agreement.<br />
The injunction prohibited the implementation of<br />
the merger agreement, the registration of <strong>Uralkali</strong><br />
new share issuances and the reports on results<br />
of the share issuances, and the registration of<br />
Silvinit’s termination upon the merger (for further<br />
information see 21 March 2011, 13 April 2011).<br />
28 FEBRUARY 2011<br />
Acquisition of 20% ordinary shares of Silvinit<br />
As part of the process of the proposed merger of<br />
<strong>Uralkali</strong> and Silvinit approved by shareholders<br />
of both companies on 4 February 2011, <strong>Uralkali</strong><br />
completed the acquisition from Otkritie Securities<br />
Limited of 1,565,151 ordinary shares in Silvinit,<br />
representing approximately 20% of the ordinary<br />
share capital of Silvinit, for US$ 1.4 billion (for<br />
further information see 20 December <strong>2010</strong>,<br />
7 February 2011, 4 April 2011).<br />
2 MARCH 2011<br />
FSFM clarifi cation on GDR programme<br />
The Federal Service for Financial Markets of the<br />
Russian Federation (FSFM) issued a clarifi cation at<br />
its request about <strong>Uralkali</strong>’s GDR programme. The<br />
FSFM clarifi cation stated that new <strong>Uralkali</strong> shares,<br />
that will be issued upon conversion of ordinary and<br />
preferred shares of OJSC Silvinit in the merger of<br />
Silvinit into <strong>Uralkali</strong>, will be eligible for deposit into<br />
the GDR programme after registration of reports<br />
on results of new share issuances, which may take up<br />
to 3 weeks after completion of the merger.<br />
21 MARCH 2011<br />
Acquisition court decision regarding<br />
temporary injunction lift<br />
The Perm Regional Arbitrazh Court lifted the<br />
injunction prohibiting Silvinit and its bodies from<br />
implementation of the decision on reorganisation<br />
of Silvinit in the form of the merger with <strong>Uralkali</strong>,<br />
approved by Silvinit shareholders. The court<br />
also rejected the injunction prohibiting the<br />
implementation of the merger agreement and the<br />
registration of termination of Silvinit through<br />
entries into the unifi ed state register of legal<br />
entities upon completion of the merger. (for<br />
further information see 28 February 2011, 13 April<br />
2011).<br />
25 MARCH 2011<br />
<strong>Report</strong> on the share redemption requests<br />
The total number of <strong>Uralkali</strong> ordinary shares<br />
submitted for the redemption was 121,330. <strong>Uralkali</strong><br />
will spend approximately 24.7 million RUR on the<br />
redemption. The number of Silvinit ordinary shares<br />
subject to the redemption under the shareholder<br />
requests totaled 430. The amount of funds allocated<br />
for the redemption of ordinary shares by Silvinit will<br />
be approximately 11.7 million RUR. In addition,<br />
Silvinit will spend approximately 36.8 million RUR<br />
on the redemption of its 3,491 preferred shares. As a<br />
result, Silvinit’s overall amount of funds allocated to<br />
the redemption will be approximately 48.5 million<br />
RUR.<br />
4 APRIL 2011<br />
Antitrust approval<br />
The Federal Antimonopoly Service of the<br />
Russian Federation (FAS) approved the proposed<br />
combination of <strong>Uralkali</strong> and Silvinit. As a<br />
prerequisite to the Service’s approval, FAS had<br />
issued to <strong>Uralkali</strong> a set of conditions, aimed at<br />
maintaining competition in the domestic market.<br />
<strong>Uralkali</strong> fulfi lled the entire scope of conditions<br />
determined by the FAS, thus enabling the FAS to<br />
approve the combination (for further information<br />
see 20 December <strong>2010</strong>, 7 February 2011,<br />
28 February 2011).<br />
13 APRIL 2011<br />
Appeal court lifts injunction<br />
The 17th Arbitration Court of Appeal upheld the<br />
appeal of <strong>Uralkali</strong> and Silvinit on the injunction<br />
relating to the claim that sought to invalidate<br />
decisions approved by the Extraordinary General<br />
Shareholders Meeting of Silvinit, and the merger<br />
agreement entered into between <strong>Uralkali</strong> and Silvinit<br />
(for further information see 28 February 2011,<br />
21 March 2011).<br />
19 APRIL 2011<br />
Holdings in the Company<br />
Madura Holding Limited sold 10% of the issued<br />
share capital of the Company to Perfecthold<br />
Limited, benefi cially owned by Mr. Alexander Nesis.<br />
In turn Perfect hold sold 3.5% of the issued share<br />
capital of the Company to Serpentia Investments<br />
Limited, benefi cially owned by Mr. Alexander<br />
Mamut. Perfect hold also sold about 2% of the issued<br />
share capital to a group of investors (for further<br />
information see 14 June <strong>2010</strong>).<br />
13
GROUP DESCRIPTION<br />
The Company produces two main types of<br />
potash fertiliser: standard and granular.<br />
The Company is developing the<br />
Durymansky and Bygelsk-Troitsky<br />
fi elds of the Verkhnekamskoye potashmagnesium<br />
salts deposit. The total<br />
production capacity of the Company<br />
is 5.5 million tonnes KCl with plans of<br />
increase to 7 million tonnes in 2012.<br />
KEY ASSETS<br />
<strong>Uralkali</strong> is a vertically integrated company with control over the whole production<br />
chain, from potash ore mining through potash supply to end consumers<br />
2 potash mines<br />
4 processing plants that<br />
produce potash<br />
Licence to develop the<br />
Ust-Yayvinsky fi eld of the<br />
Verkhnekamskoye deposit<br />
Notes<br />
I. BPC together with <strong>Uralkali</strong> Trading S.A.<br />
II. JORC valuation report as of 1 January 2011<br />
THE COMPANY’S ASSETS INCLUDE:<br />
50% interest in Belarusian<br />
Potash Company (BPC) –<br />
world leader in exports<br />
of potash fertilisers with<br />
more than 30% I share of<br />
the export market<br />
100% interest in <strong>Uralkali</strong><br />
Trading S.A. – a trading<br />
company which provides a<br />
channel for part of <strong>Uralkali</strong><br />
export supplies<br />
PRODUCTION<br />
100% interest in Baltic<br />
Bulk Terminal (BBT)<br />
A fl eet of more than 4,600<br />
railcars – specialised mineral<br />
ore wagons<br />
Storage facilities in<br />
Berezniki and St. Petersburg<br />
to hold 540 thousand tonnes<br />
of fertiliser<br />
The Company owns a licence to develop<br />
the Ust-Yayvinsky fi eld which has total<br />
resources of 1.3 billion tonnes of ore II .<br />
BBT is a part of <strong>Uralkali</strong> group, a modern,<br />
highly automated shipping terminal built<br />
at the St. Petersburg seaport in 2004. It is a<br />
special facility dedicated to the shipment<br />
of mineral fertiliser, providing the shortest<br />
transportation route from the mines to the<br />
port. The terminal handled 5.1 million<br />
tonnes of fertiliser in <strong>2010</strong>, of which 3.4<br />
million tonnes was from <strong>Uralkali</strong>. The rest<br />
<strong>Uralkali</strong> owns over 4,600 railcars,<br />
one of the largest specialised fl eets<br />
in Russia. Rail shipment is a vital part<br />
of <strong>Uralkali</strong>’s operations, as <strong>Uralkali</strong>’s<br />
product is transported to BBT by rail.<br />
It ensures smooth deliveries and also<br />
provides a signifi cant competitive<br />
advantage for shipments to North<br />
Smooth product delivery requires<br />
adequate storage facilities. In addition<br />
to storage at BBT, which can house up<br />
to 240 thousand tonnes of product,<br />
<strong>Uralkali</strong> owns facilities in Berezniki,<br />
which have a combined capacity of up<br />
to 300 thousand tonnes. The facilities<br />
are divided into sections, each holding<br />
<strong>Uralkali</strong> owns interest in Belarusian<br />
Potash Company (BPC). With sales<br />
offices in seven countries BPC ships<br />
<strong>Uralkali</strong> and Belaruskali products<br />
to over 60 countries across the world.<br />
Note<br />
I. BPC together with <strong>Uralkali</strong> Trading S.A.<br />
BALTIC BULK TERMINAL (BBT)<br />
RAIL<br />
WAREHOUSING<br />
PRICING AND SALES<br />
BPC is a world leader in potash<br />
fertiliser export sales, with market<br />
share of around 31% I . BPC helps<br />
<strong>Uralkali</strong> to achieve highly efficient<br />
sales operation.<br />
was nitrogen-phosphorus fertilisers from<br />
Russian producers. The peak shipment<br />
capacity for BBT is 6.2 million tonnes.<br />
<strong>Uralkali</strong>’s planned increase in production<br />
will be supported by the current excess<br />
handling capacity at the terminal.<br />
As of 31 December <strong>2010</strong> <strong>Uralkali</strong> owned<br />
100% of BBT shares.<br />
China, a major consumer of potash<br />
fertiliser. Together with local producers,<br />
only Russian suppliers have access to this<br />
market.<br />
a different type of product. Warehouses<br />
are connected by a weatherproof<br />
conveyer system to the rail terminal.<br />
As of 31 December <strong>2010</strong> <strong>Uralkali</strong> owned<br />
50% of the BPC shares, Belaruskali –<br />
45%, Belarusian Railway – 5%.<br />
14 <strong>Uralkali</strong> | <strong>Annual</strong> <strong>Report</strong> <strong>2010</strong> Table of Contents Table of Contents<br />
15
STRATEGIC PRIORITIES<br />
<strong>Uralkali</strong>’s strategy is aimed at<br />
growth and increasing potash<br />
production effi ciency<br />
Strategy is based upon fundamental<br />
growth factors for potash<br />
markets such as growing population<br />
and decreasing arable lands,<br />
which drive farmers to use fertilisers<br />
in order to increase the effi<br />
ciency of agriculture<br />
To increase production capacity<br />
of existing operations from<br />
5.5 million to 7 million tonnes in<br />
2012 through brownfi eld capacity<br />
expansion at Berezniki-4 and<br />
other facilities<br />
To obtain approval of the<br />
project documentation in 2011<br />
to construct a new mine at<br />
Ust-Yayva block<br />
To maintain and increase market<br />
shares in the key distribution<br />
markets: China, Brazil, India<br />
and Southeast Asia<br />
To increase production effi<br />
ciency, <strong>Uralkali</strong> plans to keep<br />
pure potash focus and further<br />
optimise operating costs<br />
URALKALI STRATEGY<br />
OVERVIEW<br />
51<br />
US$ per tonne<br />
<strong>Uralkali</strong> Potash<br />
Cash COGS <strong>2010</strong><br />
Strong Potash<br />
Industry<br />
Fundamentals<br />
Medium Term Demand<br />
CAGR (1995–2020) II<br />
STRATEGY IN ACTION<br />
Low Cost<br />
Operation<br />
Shareholder<br />
Value<br />
2.7 % Organic Growth + 13<br />
Combination with<br />
Silvinit<br />
BPC I (<strong>Uralkali</strong>, Belaruskali)<br />
IPC, Agrifert S.A. (Silvinit)<br />
Other<br />
Leadership<br />
on Export Potash<br />
Market<br />
mln tonnes<br />
Capacity<br />
of the Combined<br />
Company in 2012<br />
BEING ONE OF THE LEADING POTASH COMPANIES<br />
THROUGH CLEAR STRATEGY, OPERATIONAL<br />
EXСELLENCE AND HIGN PROFITABILITY<br />
Notes<br />
I. BPC together with <strong>Uralkali</strong> Trading S.A.<br />
II. Fertecon Q4 <strong>2010</strong><br />
Global export<br />
sales breakdown, <strong>2010</strong><br />
58 %<br />
16 <strong>Uralkali</strong> | <strong>Annual</strong> <strong>Report</strong> <strong>2010</strong> Table of Contents<br />
11<br />
31
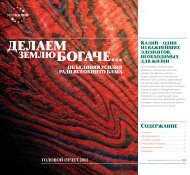
URALKALI AND SILVINIT:<br />
PROPOSED<br />
COMBINATION<br />
URALKALI<br />
99<br />
PROPOSED MERGER EXPECTED TO BE COMPLETED IN THE SECOND QUARTER 2011<br />
One of the major global Potash producers<br />
Employer of choice in Perm Region<br />
Among top 10 major Russian companies<br />
Note<br />
I. Of the shareholders participated in the EGM on 4 February 2011<br />
Table of Contents<br />
%<br />
VOTES IN FAVOUR I Approved by Federal<br />
Antimonopoly Service<br />
of Russia<br />
COMBINED COMPANY<br />
SILVINIT<br />
91<br />
%<br />
VOTES IN FAVOUR I<br />
~20% Potash production<br />
more than 23 thousand employees<br />
Listing at 3 stock exchanges: LSE, MICEX, RTS
20 December <strong>2010</strong><br />
<strong>Uralkali</strong> announced Proposed<br />
Combination; <strong>Uralkali</strong> and Silvinit<br />
Board announced recommendation<br />
to vote in favour<br />
In December <strong>2010</strong>, the Boards<br />
of Directors of <strong>Uralkali</strong> and Silvinit<br />
announced the proposed combination<br />
between two companies and<br />
recommended the shareholders to<br />
vote “for”. The proposed combination<br />
appeared to be a completely logical<br />
step as: both companies develop the<br />
same potash deposit; their assets have<br />
a natural strategic fi t; and the two<br />
businesses had previously operated as<br />
a single enterprise before 1983. The<br />
merger will create one of the world’s<br />
leading potash fertiliser producers in<br />
terms of production levels and capacity.<br />
The combined company will be able<br />
to strengthen its presence in the key<br />
export markets, including India, China,<br />
Brazil, and across Southeast Asia. In<br />
February 2011, the shareholders of<br />
both <strong>Uralkali</strong> and Silvinit approved<br />
the combination – in line with the<br />
recommendations of their two Boards.<br />
The combination will lead to signifi cant<br />
synergies, reducing selling, general<br />
and administrative expenses, and will<br />
give a unique opportunity to enhance<br />
shareholder value of the Company.<br />
The development of the combined<br />
<strong>Uralkali</strong> and Silvinit group will facilitate<br />
a single growth strategy through the<br />
effi cient implementation of production<br />
expansion projects.<br />
Shareholder Approval Financing<br />
Combination approved by<br />
shareholders of both companies on<br />
4 February 2011<br />
EGM results refl ect strong<br />
endorsement of the compelling<br />
rationale underlying the combination<br />
Votes in favour:<br />
— <strong>Uralkali</strong> – 99% I<br />
— Silvinit – 91% I<br />
Redemption requests minimal:<br />
— <strong>Uralkali</strong> – US$ 0.87 million<br />
— Silvinit – US$ 1.71 million (ordinary<br />
and preferred shares)<br />
Note<br />
I. Percentage of the shareholders voted in favour of the statutory merger from those participated in the EGM on 4 February 2011<br />
<strong>Uralkali</strong> shareholders also voted in favour of the acquisition of the 20% stake and the associated fi nancing<br />
PROPOSED COMBINATION:<br />
DECEMBER <strong>2010</strong> JANUARY FEBRUARY<br />
20 December <strong>2010</strong><br />
Record date for shareholders<br />
of <strong>Uralkali</strong> and Silvinit for<br />
participation in EGM<br />
4 February 2011<br />
EGMs approved:<br />
<strong>Uralkali</strong> EGM:<br />
• Proposed Acquisition<br />
• Proposed Merger<br />
~99% I<br />
Silvinit EGM:<br />
• Proposed Merger<br />
~91% I<br />
SIGNIFICANT PROGRESS HAS BEEN<br />
1. 2.<br />
COMPLETED<br />
Funds secured through bonds<br />
placement and loan facility<br />
— Placement of debut exchange<br />
traded bonds – 30 billion RUR (three<br />
year maturity)<br />
— Loan facility – 12 billion RUR (two<br />
year maturity)<br />
Improvement in loan portfolio<br />
through lengthening average maturity<br />
Cross-currency interest rate swap<br />
associated with both instruments<br />
COMPLETED<br />
ACQUISITION OF 20%<br />
STAKE COMPLETED<br />
ON 28 FEBRUARY 2011<br />
18 <strong>Uralkali</strong> | <strong>Annual</strong> <strong>Report</strong> <strong>2010</strong> Table of Contents
STRUCTURE AND CALENDAR<br />
MARCH<br />
28 February 2011<br />
Completion of the acquisition of<br />
20% stake in Silvinit by <strong>Uralkali</strong><br />
20% Acquisition FAS and Other Antitrust<br />
Approvals<br />
20% acquisition of Silvinit shares<br />
by <strong>Uralkali</strong> from Otkritie Securities<br />
Limited, completed on 28 February<br />
2011<br />
1 April 2011<br />
FAS of Russia approved the<br />
proposed combination of <strong>Uralkali</strong><br />
and Silvinit<br />
Brazil, Ukraine: unconditional<br />
approval received<br />
Federal Antimonopoly Service<br />
of Russia: approved<br />
Other anti-trust applications have<br />
been fi led<br />
Anticipated completion of Proposed Combination:<br />
• Silvinit subsumed by <strong>Uralkali</strong>; <strong>Uralkali</strong> shares distributed to Silvinit<br />
shareholders<br />
• Registration of the Proposed Merger by the Russian state authorities<br />
MADE SINCE ANNOUNCEMENT OF THE TRANSACTION<br />
3. 4. 5.<br />
COMPLETED<br />
APRIL MAY–JUNE<br />
ONGOING / PARTIALLY<br />
COMPLETED<br />
UKLA Re-listing<br />
Requirements<br />
Workstreams ongoing associated<br />
with reapplication for admission<br />
of GDRs to the Оffi cial List of the<br />
UKLA, including submission of a<br />
prospectus<br />
Admission to occur<br />
simultaneously with<br />
the combination completion<br />
ONGOING<br />
PROPOSED MERGER REMAINS ON-TRACK,<br />
EXPECTED TO BE COMPLETED<br />
IN THE SECOND QUARTER 2011<br />
Table of Contents<br />
19
COMPLEMENTARY SCALE AND<br />
UNIQUE ASSET ALIGNMENT<br />
COMBINATION REUNITES TWO<br />
COMPANIES THAT OPERATED AS ONE<br />
BUSINESS UNTIL 1983<br />
URALKALI<br />
RESOURCES<br />
Total resource base –<br />
3,444.8 million tonnes of ore I<br />
Resources at Ust-Yayvinsky block –<br />
1,290.6 million tonnes of ore I<br />
PRODUCTION<br />
Potash production capacity:<br />
5.5 million tonnes p.a. of KCl as of <strong>2010</strong><br />
Brownfi eld capacity potential:<br />
1.5 million tonnes of KCl<br />
Signifi cant greenfi eld capacity<br />
expansion potential expected from<br />
Ust-Yayvinsky<br />
<strong>2010</strong> production: 5.1 million tonnes<br />
of KCl<br />
SALES<br />
Part of BPC, a marketing joint venture<br />
organisation with Belaruskali<br />
Domestic sales volumes sold via in-house<br />
trading arm<br />
Exports account for 87% of total sales<br />
Owns a 6.2 million tonnes p.a. bulk<br />
terminal in St. Petersburg<br />
Own railcar fl eet<br />
PRODUCTS<br />
Standard grade MOP<br />
Granular grade MOP<br />
Source:<br />
<strong>Uralkali</strong>, Silvinit, Bloomberg, broker reports, Fertecon<br />
Note<br />
I. JORC valuation report as of 1 January 2011<br />
SILVINIT<br />
Total resource base –<br />
5,301.8 million tonnes of ore I<br />
Resources of Polovodovsky block –<br />
3,073.5 million tonnes of ore I<br />
Potash production capacity:<br />
5.1 million tonnes p.a. of KCl as of <strong>2010</strong><br />
Brownfi eld capacity potential:<br />
0.9 million tonnes of KCl<br />
Signifi cant greenfi eld capacity<br />
expansion potential expected from<br />
Polovodovsky<br />
<strong>2010</strong> production: 5.1 million tonnes<br />
of KCl<br />
IPC and Agrifert S.A. are the<br />
principal trading agents of Silvinit in<br />
export markets<br />
Domestic sales volumes sold via<br />
in-house trading arm<br />
Exports account for 79% of total sales<br />
Own railcar fl eet<br />
Standard grade MOP<br />
Granular grade MOP<br />
Carnallite<br />
Solikamsk<br />
Berezniki<br />
km<br />
Moscow<br />
2<br />
1<br />
1<br />
Ust-Yayvinsky<br />
Block<br />
PERM<br />
TERRITORY<br />
3<br />
3<br />
Railways 53 km<br />
2<br />
4<br />
Polovodovsky<br />
block<br />
0 2,5 5 7,5 10 12,5 15 17,5 20<br />
Railways Processing<br />
plants<br />
20 <strong>Uralkali</strong> | <strong>Annual</strong> <strong>Report</strong> <strong>2010</strong> Table of Contents<br />
Potash<br />
mines<br />
4<br />
Greenfi eld<br />
licences
Note<br />
I. JORC valuation report as of 1 January 2011<br />
SILVINIT AT A GLANCE<br />
Producing assets are located at<br />
Verkhnekamskoe deposit: three<br />
producing mines with a total resource<br />
base exceeding 2,228.3 million tonnes<br />
of oreI , the total resource base of the<br />
Company amounting to 5,301.8 million<br />
tonnes of oreI Brownfi eld capacity expansion from<br />
5.1 million tonnes to 5.6 million tonnes<br />
of KCl planned for 2011<br />
and further expansion to 6 million<br />
tonnes starting in 2012<br />
Notes<br />
I. Sales done primarily on FCA basis<br />
II. Net Revenue is calculated as sales net of freight, railway tariff and transhipment costs<br />
III. EBITDA margin calculated as % of Net Revenue<br />
IV. Restated<br />
OVERVIEW OF SILVINIT<br />
Substantial leverage to greenfi eld<br />
development through additional<br />
production growth potential at<br />
Polovodovsky block acquired in 2008:<br />
1) Resources of the block have been<br />
estimated at 3,073.5 million tonnes<br />
of oreI ; the largest Russian greenfi eld<br />
property<br />
2) Located next to Silvinit’s producing<br />
properties, facilitating considerable<br />
operational effi ciencies in mine<br />
development and transport logistics<br />
Domestic vs. Export Sales Breakdown<br />
(by volume, <strong>2010</strong>)<br />
21% Domestic<br />
79% Export<br />
Export Sales Structure<br />
(by volume, <strong>2010</strong>)<br />
27% SEA and Asia<br />
25% China<br />
20% India<br />
28% Other<br />
Source:<br />
Silvinit<br />
Low costs of production due to<br />
inexpensive labour and energy costs<br />
Export market share – 11% achieved<br />
from IPC and Agrifert S.A.<br />
Listed on RTS and MICEX since 1996<br />
and 2008 respectively<br />
In addition to potash, Silvinit<br />
produces carnallite<br />
FINANCIAL SNAPSHOT SALES STRUCTURE <strong>2010</strong><br />
2008 IV<br />
2009 <strong>2010</strong><br />
REVENUES, mln RUR I 55,402 33,994 39,025<br />
NET REVENUES, mln RUR II 50,494 32,083 34,925<br />
EBITDA, mln RUR 37,231 21,307 18,335<br />
EBITDA M A RGIN III 74% 66% 53%<br />
NET PROFIT, mln RUR 17,683 10,518 11,532<br />
NET PROFIT MARGIN 32% 31% 30%<br />
NET DEBT/(CASH), mln RUR 47,652 44,529 39,257<br />
Table of Contents<br />
100%<br />
100%<br />
Total sales<br />
(mln tonnes)<br />
4.9<br />
Export total<br />
(mln tonnes)<br />
3.9<br />
21
Industry fundamentals are<br />
highly attractive with excellent<br />
demand growth prospects<br />
Limited access to<br />
resources, few high quality<br />
potash ore deposits<br />
Low stock levels<br />
and rising demand<br />
should support<br />
prices in the<br />
medium term<br />
UNIQUE<br />
ASSET<br />
FIT:<br />
Historically<br />
operated as one<br />
company until 1983<br />
DRIVING NEAR TERM<br />
VALUE CREATION THROUGH<br />
A COMPELLING COMBINATION<br />
Mining and<br />
processing operations<br />
in close proximity,<br />
facilitating sizeable<br />
operational effi ciencies<br />
Attractive portfolio of<br />
development opportunities to<br />
sustain organic long-term growth<br />
Highly<br />
Attractive<br />
Potash Market<br />
Dynamics<br />
Compelling<br />
Strategic<br />
Fit<br />
Creation<br />
of a Global<br />
Leader in the<br />
Potash Sector<br />
Unique<br />
Opportunity<br />
to Unlock<br />
Value<br />
COMBINED COMPANY WILL BE POSITIONED AS ONE<br />
OF THE GLOBAL LEADERS; COMPELLING FIT WILL<br />
IMMEDIATELY ENHANCE SHAREHOLDER VALUE<br />
ONE OF THE LEADING GLOBAL<br />
POTASH PRODUCERS<br />
Cost-advantaged producer<br />
Global sales reach – c. 83% of<br />
combined sales in <strong>2010</strong> are made<br />
to export markets (including<br />
Brazil, India, China, SEA)<br />
The Combined<br />
Company will become<br />
one of the leaders<br />
among Russian<br />
mining companies<br />
Blue-chip stock<br />
SIGNIFICANT<br />
SYNERGY<br />
POTENTIAL OF<br />
US$ 100 MLN P. A.<br />
ACHIEVED<br />
STARTING 2013:<br />
Operational<br />
(c. US$ 55 million p.a.)<br />
SG&A (c. US$ 25 million p.a.)<br />
Transportation (c. US$ 20 million p.a.)<br />
Joint development of brownfi eld<br />
and greenfi eld capacity<br />
22 <strong>Uralkali</strong> | <strong>Annual</strong> <strong>Report</strong> <strong>2010</strong> Table of Contents
CLEAR LONGER TERM<br />
STRATEGY TO DELIVER<br />
FUTURE GROWTH<br />
CREATION OF ONE OF THE WORLD’S LEADING POTASH<br />
COMPANIES THROUGH LEVERAGING THE OPERATIONAL AND<br />
FINANCIAL STRENGTH OF THE COMBINED COMPANY<br />
Drive Organic Growth<br />
Driving organic growth through<br />
a value accretive investment programme,<br />
to include exploitation of<br />
brownfi eld projects and greenfi eld<br />
development opportunities<br />
Realise Synergies<br />
Realising the considerable synergy<br />
potential that exists through<br />
the Proposed Combination in an<br />
expedited timeframe to increase<br />
shareholder value<br />
Enhance Operating<br />
Effi ciency<br />
Pursuing improvements in operational<br />
effi ciency to maintain<br />
and enhance the Combined<br />
Group’s competitive cost position<br />
and profi tability<br />
Longer<br />
term value<br />
creation<br />
Focus on Corporate<br />
Governance<br />
Continued commitment to ongoing<br />
enhancements in <strong>Uralkali</strong>’s<br />
leading corporate governance<br />
standards<br />
Optimisation of Sales<br />
and Marketing<br />
Activities<br />
Determining optimum sales and<br />
marketing channels<br />
Employer of Choice<br />
Delivering value whilst operating<br />
in a socially responsible manner<br />
and positioning the Combined<br />
Group as the employer of choice in<br />
the Russian mining industry<br />
CLEAR STRATEGIC ROAD MAP TO POSITION THE COMBINED<br />
COMPANY AS ONE OF THE WORLD’S LEADING POTASH<br />
COMPANIES TO DRIVE LONGER TERM VALUE CREATION<br />
Table of Contents<br />
23
For more information:<br />
www.urkasilv-merger.com/eng<br />
FOR INVESTOR INQUIRIES<br />
Tel.: +7 (495) 730-23-71<br />
Fax.: +7 (495) 730-23-93<br />
ir@msc.uralkali.com<br />
Anna Batarina<br />
Vice-president for investor relations<br />
Daria Fadeeva<br />
Investor relations manager<br />
FOR MEDIA INQUIRIES<br />
Tel.: +7 (495) 730-23-71<br />
Fax.: +7 (495) 730-23-93<br />
pr@msc.uralkali.com<br />
Alexey Sotskov<br />
Head of Public Relations<br />
Vladimir Ravinsky<br />
Head of Media Relations Unit<br />
24 <strong>Uralkali</strong> | <strong>Annual</strong> <strong>Report</strong> <strong>2010</strong> Table of Contents
WHAT IS POTASH?<br />
PRIMARY NUTRIENTS<br />
N + P + K<br />
Nitrogen, phosphate and potash each play their<br />
role but only together they ensure balanced<br />
nourishment and cannot replace each other<br />
9%<br />
Sugar crops<br />
8%<br />
Soybeans<br />
14%<br />
Corn<br />
13%<br />
Rice<br />
Source: Scotia Capital <strong>Report</strong>, January 2011<br />
POTASH USE BY CROP<br />
K<br />
5%<br />
Palm oil<br />
6%<br />
Wheat<br />
22%<br />
Fruits and<br />
vegetables<br />
23%<br />
Other<br />
Improves roves<br />
resistance tance<br />
to crop diseases<br />
Maintains tains<br />
cell ell<br />
resilience ience<br />
Builds ilds<br />
cellulose ulose<br />
Reduces uces<br />
water r loss<br />
Potash (K)<br />
• A natural compound residing in soil<br />
• Responsible for the quality of the crop,<br />
resistance to drought and diseases<br />
• There is no natural or man-made<br />
substitute for potash<br />
Nitrogen (N)<br />
• Responsible for protein formation<br />
in plants<br />
• Responsible for growth and yield<br />
Phosphorus (P)<br />
• Plays an important part in plant<br />
root development<br />
• Responsible for photosynthesis<br />
BENEFITS OF POTASH<br />
Ass Assists in<br />
photo photosynthesis<br />
Inc Increases<br />
pro proteins<br />
avai available to<br />
pplants<br />
REDUCES UCE S THE DEVELOPMENT DEVELO PMENT OF O F WEAK STOCKS S T OCK S DISEASES<br />
DI<br />
95% OF GLOBALLY PRODUCED POTASH IS APPLIED<br />
AS A FERTILISER TO HELP FEED THE WORLD’S<br />
GROWING POPULATION<br />
Table of Contents<br />
Re Reduces<br />
wi wilting<br />
Imp Improves<br />
dro drought<br />
resi resistance<br />
25
The Recovery is to Continue (GDP growth, % qoq)<br />
12<br />
8<br />
4<br />
0<br />
–4<br />
–8<br />
–12<br />
GROWING DEMAND<br />
Increasing Population<br />
Changes in World Population by 2050 (mln people)<br />
1500<br />
1200<br />
900<br />
600<br />
300<br />
0<br />
–300<br />
–75<br />
Europe<br />
Source: Scotia Capital, United Nations<br />
Income Growth in Developing Countries<br />
Emerging and<br />
developing economies<br />
World<br />
Advanced economies<br />
Q1 2007 Q4 2007 Q3 2008 Q2 2009 Q1 <strong>2010</strong> Q4 <strong>2010</strong> Q3 2011 Q2 2012<br />
Source: IMF, 25 January 2011<br />
15<br />
Oceania<br />
125<br />
US and<br />
Canada<br />
250<br />
Latin<br />
America<br />
1000<br />
Africa<br />
1500<br />
Asia<br />
Arable Land per Capita is Shrinking Fast (Arable hectares per Capita)<br />
0.6<br />
0.5<br />
0.4<br />
0.3<br />
0.2<br />
Declining Arable Land per Person<br />
0.1<br />
0.0<br />
1950 1960 1970 1980 1990 2000 <strong>2010</strong> 2020E 2030E 2040E 2050E<br />
Biofuels and Scientifi c<br />
Recommendations Potential<br />
Higher Demand for Food Changing Diets New Source of Demand for Crops<br />
World Potash Deliveries (KCl, mln tonnes)<br />
80<br />
70<br />
60<br />
50<br />
40<br />
30<br />
20<br />
Source: Scotia Capital, US Census Bureau<br />
Actual vs. Potential I Potash Consumption (KCl, mln tonnes)<br />
30<br />
25<br />
20<br />
15<br />
10<br />
5<br />
0<br />
CAGR: 2,7%<br />
China India Brazil<br />
<strong>2010</strong><br />
Source: Fertecon, IPNI<br />
Potential I<br />
Note<br />
I. Scientifi cally recommended baset on 2:1:1 (N:P:K) ratio<br />
10<br />
0<br />
1995 2000 2005 <strong>2010</strong> 2015E 2020E<br />
Source:<br />
Fertecon Q4 <strong>2010</strong><br />
GROWING DEMAND AND HIGH SUPPLY VISIBILITY MAKE POTASH A UNIQUE INDUSTRY<br />
Chinese<br />
producers<br />
46.3 %<br />
CANADA<br />
1.37%<br />
USA<br />
VISIBLE SUPPLY<br />
Relatively Few Top Players High CAPEX Requirements and Long Lead Times<br />
Potash Production Capacity, <strong>2010</strong> (Mln tonnes of KCl Equivalent)<br />
Source: Companies information, Fertecon Q4 <strong>2010</strong><br />
Source: USGS, 25 January 2011<br />
0.74%<br />
CHILE<br />
Improved Supply<br />
Management<br />
3.2%<br />
BRAZIL<br />
11.3<br />
10.6<br />
10.4<br />
0.23%<br />
UK<br />
0.21%<br />
SPAIN<br />
9.2<br />
7.8<br />
7.5<br />
4.1<br />
2.2<br />
2.1<br />
1.3<br />
1.0<br />
Mineral Scarcity<br />
1.58%<br />
GERMANY<br />
Potash Industry Overview<br />
Market size I<br />
(2011E)<br />
Source: Fertecon Q4 <strong>2010</strong>, <strong>Uralkali</strong>, Potash Corp, IFA<br />
Notes<br />
I. Including fertiliser consumption<br />
II. 1 tonne KCl (product) =1.61 tonne K 2 O (nutrient)<br />
7.9%<br />
BELARUS<br />
0.42%<br />
ISRAEL<br />
0.26%<br />
UKRAINE<br />
0.42%<br />
JORDAN<br />
34.7 %<br />
RUSSIA<br />
33.6 mln tonnes K 2 O II<br />
(54.2 mln tonnes KCl)<br />
Geographic availability Very limited<br />
Industry members Several leading players<br />
Long-term pricing stability High<br />
Profi tability High<br />
Barriers to entry High<br />
Cost of greenfi eld capacity US$ 4.1 bln for 2 mln tonnes (KCl)<br />
Greenfi eld development time min 7 years<br />
2.2%<br />
CHINA<br />
Limited Number of Players able to Bring<br />
Additional Capacity<br />
26 <strong>Uralkali</strong> | <strong>Annual</strong> <strong>Report</strong> <strong>2010</strong> Table of Contents Table of Contents<br />
27
POTASH MARKET<br />
Potash market has seen fi rming recovery trend over the last twelve months. After the fi nancial crisis of 2009,<br />
when global fertiliser demand collapsed dramatically and forced producers, especially in the potash sector, to<br />
institute unprecedented curtailments in output, in <strong>2010</strong> most producers returned to the pre-crisis production<br />
levels. Many markets recovered fast, led by economic growth, strong commodity prices and the need to replenish<br />
depleted stocks. In the 2nd half of <strong>2010</strong> these trends became especially noticeable, with considerably more<br />
purchasing from the major potash consumers which in turn led to fi rmer potash pricing. As a result <strong>2010</strong> was a<br />
successful year for the international potash industry.<br />
Several important developments took place during <strong>2010</strong>, which point out to a stronger consolidation trend<br />
in the potash industry. Apart from the unsuccessful bid by BHP to acquire the largest industry manufacturer<br />
Potash Corp, another key development came at the very end of <strong>2010</strong>, with the announcement that Russia’s two<br />
leading potash producers – OJSC <strong>Uralkali</strong> and OJSC Silvinit – were to merge to form a single company, resulting<br />
in one of the leading manufacturers in the global potash market.<br />
MAJOR HIGHLIGHTS FOR POTASH MARKET IN <strong>2010</strong><br />
• Potash demand was still relatively weak at the<br />
beginning of <strong>2010</strong> after 2009 but showed some signs<br />
of recovery, with BPC concluding a contract with<br />
China thus traditionally establishing the “floor”<br />
price for the export contracts.<br />
• India continued to be the most active market in<br />
<strong>2010</strong> for potash purchasing. Contracts for imports<br />
in FY April <strong>2010</strong> – March 2011 totaled almost 5.3<br />
million tonnes with additional options for about 400<br />
thousand tonnes.<br />
• In Europe, the major driving force for price changes<br />
during <strong>2010</strong> was the depreciation of Euro vs US$.<br />
• Demand in South East Asian markets was supportive<br />
to the overall recovery of the potash market in <strong>2010</strong>,<br />
especially in Indonesia and Malaysia.<br />
Average Spot Monthly Prices for Standard KCl<br />
US$ per tonne<br />
420<br />
400<br />
380<br />
360<br />
340<br />
320<br />
300<br />
Jan <strong>2010</strong><br />
Feb <strong>2010</strong><br />
Mar <strong>2010</strong><br />
Apr <strong>2010</strong><br />
FOB Vancouver<br />
FSU FOB<br />
Source: Fertecon Q4 <strong>2010</strong>, FMB<br />
28 <strong>Uralkali</strong> | <strong>Annual</strong> <strong>Report</strong> <strong>2010</strong> Table of Contents<br />
May <strong>2010</strong><br />
Jun <strong>2010</strong><br />
Jul <strong>2010</strong><br />
Aug <strong>2010</strong><br />
Sep <strong>2010</strong><br />
Oct <strong>2010</strong><br />
Nov <strong>2010</strong><br />
Dec <strong>2010</strong><br />
Jan 2011<br />
Feb 2011<br />
MAr 2011
POTASH MARKET<br />
• Strong demand on potassium chloride prompted<br />
additional price increases in November. BPC lifted<br />
potash prices by US$ 25/tonnes to US$ 440–450/<br />
tonnes CFR in Brazil and by US$ 25/tonnes to<br />
US$ 430/tonnes CFR in Asia. Due to previous<br />
volume commitments which were fully executed in<br />
Q4, the positive effect of new prices is estimated to<br />
be refl ected in the fi nancial results of 2011.<br />
• Price increases in the North American market<br />
which took place in the autumn of <strong>2010</strong> helped<br />
<strong>Uralkali</strong> to achieve a better than average price for<br />
its products in other markets.<br />
• Q4 demand was exceptionally strong due to<br />
shrinking global harvest projections, an upward<br />
spike in prices for key crops and fertiliser products.<br />
Dealers were aggressively replenishing stocks due to<br />
customer pre-buying and a fi rm global outlook.<br />
• Consolidation remained one of the key driving<br />
forces in the industry in <strong>2010</strong>–2011:<br />
1) <strong>Uralkali</strong> and Silvinit announced their much<br />
anticipated merger.<br />
2) K+S reached an agreement to purchase Potash<br />
One.<br />
3) BHP Billiton unsuccessfully pursued a bid for<br />
Potash Corp which later failed.<br />
Table of Contents<br />
Potash Deliveries 1995–2020<br />
KCI mln tonnes<br />
80<br />
70<br />
60<br />
50<br />
40<br />
30<br />
20<br />
10<br />
0<br />
1995 2000 2005 <strong>2010</strong> 2015E 2020E<br />
Latin America<br />
North America<br />
Africa<br />
SEA & Oceania<br />
Source: Fertecon, Q4 <strong>2010</strong><br />
Soft Commodity Prices<br />
US$/bushel<br />
14.00<br />
12.00<br />
10.00<br />
8.00<br />
3.76 4.34<br />
6.00 5.28<br />
3.77<br />
4.00<br />
2.69<br />
2.00<br />
0.00<br />
2006<br />
2007<br />
CAGR: 2.7%<br />
5.98<br />
8.85<br />
12.35<br />
CIS<br />
Europe<br />
India<br />
China<br />
10.6<br />
10.4<br />
Corn Soybeans<br />
Wheat<br />
Source: Chicago Mercantile Exchange<br />
2008 <strong>2010</strong><br />
2009<br />
4.09<br />
7.71<br />
6.55<br />
5.29 5.85<br />
29
POTASH MARKET<br />
The long-term fundamentals for global<br />
consumption of potash fertilisers remain<br />
extremely strong:<br />
• Demand for potash is expected to improve steadily<br />
in the next decade and to be supported by stronger<br />
fundamentals of the potash industry, increasing<br />
world population and changing diets.<br />
• Growth in crop consumption will result not only<br />
from more food and feed required for growing<br />
number of people but from more grains and oilseeds<br />
used for biofuel production.<br />
• Increasing grain consumption and biofuel<br />
production will require more grains to be produced<br />
given the limited number of arable land and thus<br />
leading to increasing yields via more balanced<br />
fertiliser application.<br />
• We believe this should lead to active potash<br />
purchasing activity in 2011–2012.<br />
Note<br />
I. BPC together with <strong>Uralkali</strong> Trading S.A.<br />
30 <strong>Uralkali</strong> | <strong>Annual</strong> <strong>Report</strong> <strong>2010</strong><br />
Supplier's Market Shares in Global Export, <strong>2010</strong><br />
11% IPC/Agrifert S.A.<br />
25% Canpotex/Potash Corp<br />
3% SQM<br />
30% ICL/K+S/APC<br />
31% BPC I<br />
Source: IFA, BPC estimates<br />
World Biofuel Production<br />
mln gallons<br />
25<br />
20<br />
15<br />
10<br />
5<br />
0<br />
Source: FAPRI<br />
2005 2006 2007 2008 2009 <strong>2010</strong> 2011E<br />
Ethanol Biodiesel<br />
Table of Contents
Source: Scotia Capital <strong>Report</strong>, January 2011<br />
SOUTHEAST<br />
ASIA (SEA)<br />
In Japan, South<br />
Korea, and Taiwan,<br />
farmers cultivate less<br />
than 200 m 2 of land per<br />
person<br />
People in Asia<br />
consume over 350% more<br />
meat (at 28 kg per capita<br />
per year) than they did<br />
almost 50 years ago<br />
INDIA<br />
India’s population of<br />
1.1 billion is projected to add<br />
+150 million people over<br />
the next decade, with the<br />
majority from a middle-class<br />
demographic<br />
Despite having 17% of the<br />
world’s population, India<br />
accounts for only 11% of<br />
global arable land<br />
India’s government has set<br />
an agricultural sector growth<br />
target of 4% per year until at<br />
least 2012, a level last reached<br />
in Q1 2008<br />
Food infl ation is a serious<br />
concern in India, with food<br />
prices up 15% over the past<br />
year<br />
EUROPE<br />
URALKALI SALES<br />
STRUCTURE<br />
In <strong>2010</strong> Europe was<br />
among the regions with<br />
the largest changes in<br />
potash consumption<br />
+ 1.5 million tonnes<br />
compared to 2009<br />
14 %<br />
16 %<br />
BRAZIL<br />
14 %<br />
K<br />
1 %<br />
Brazil accounts for 75%<br />
of all potash consumed<br />
in Central and South<br />
America<br />
Unlike other countries,<br />
Brazil uses modern<br />
agronomic practices, and<br />
therefore prefers granular<br />
potash rather than the<br />
standard potash used in<br />
other countries OTHER<br />
23 %<br />
CHINA<br />
China has managed<br />
to feed over 20% of the<br />
world’s population using<br />
only 9% of the world’s<br />
arable land<br />
Since 1990 Chinese<br />
grain production has<br />
been roughly stable but<br />
the use of fertiliser —<br />
which is heavily<br />
subsidised – has risen by<br />
about 40%<br />
Meat consumption in<br />
China more than doubled<br />
in 1980–2005, to 50 kg a<br />
year per person<br />
Agriculture is the most<br />
important economic<br />
activity in China,<br />
providing an economic<br />
livelihood to almost twothirds<br />
of its population of<br />
1.33 billion<br />
China is virtually<br />
self-suffi cient in nitrogen<br />
and phosphates but not in<br />
potash<br />
In China, arable land<br />
per capita has shrunk to<br />
700 m 2 , from 1700 m 2 in<br />
1950<br />
5 % 14 RUSSIA<br />
%<br />
The Russian wheat<br />
crisis of <strong>2010</strong> was due to<br />
a drought (the worst in<br />
a century) and wildfi res<br />
that led the government<br />
to place a ban on wheat<br />
exports through mid-<br />
2011 – driving wheat spot<br />
cash prices to multiyear<br />
highs<br />
The worst in a century<br />
drought with a two-month<br />
heat wave, at temperatures<br />
exceeding 40°C, slashed<br />
wheat production there to<br />
~60 million tonnes from<br />
~90 million tonnes<br />
More than 70% of <strong>Uralkali</strong> sales in <strong>2010</strong> were in BRIC and SEA markets<br />
which account for major part of the world potash fertiliser consumption<br />
Table of Contents<br />
13 %<br />
USA<br />
In the United States<br />
and Canada, meat<br />
consumption is about<br />
125 kg per capita per year,<br />
up from 92 kg in 1963<br />
31
SALES REVIEW<br />
EXPORT SALES<br />
• BRIC and SEA countries account for c. 60% of<br />
world potash fertiliser consumption and have higher<br />
than industry average rates of growth in demand.<br />
• <strong>Uralkali</strong> deliveries to the BRIC and SEA markets<br />
accounted for more than 70% of the Company’s sales<br />
in <strong>2010</strong>.<br />
• <strong>Uralkali</strong> has leading positions in BRIC markets<br />
selling through the BPC and <strong>Uralkali</strong> Trading S.A.<br />
<strong>Uralkali</strong>’s sales strategy is based on striking the<br />
right balance between spot and long-term contract<br />
sales. Spot prices are set based on the current market<br />
situation, whereas long-term contracts set prices for<br />
an extended period, taking long-term trends into<br />
consideration. The major markets for <strong>Uralkali</strong>, where<br />
DOMESTIC SALES<br />
Together with the sharp increase in potash demand<br />
in its major overseas markets in <strong>2010</strong>, the volume of<br />
<strong>Uralkali</strong>’s domestic deliveries also continued to grow<br />
and amounted to 682 thousand tonnes. The main<br />
consumers of the Company’s products in the Russian<br />
market have been complex fertiliser producers.<br />
<strong>Uralkali</strong> maintained low prices for potash<br />
for Russian farmers taking into consideration<br />
adverse weather conditions, caused by anomalously<br />
high temperatures, and also in line with the<br />
recommendations of the Russian government.<br />
At the beginning of <strong>2010</strong> the ceiling price for<br />
potash sold directly to Russian farmers was set at<br />
4,550 RUR per tonne. However, in March <strong>2010</strong> in<br />
order to support Russian agricultural sector during<br />
the spring sowing season <strong>Uralkali</strong> decided to cut the<br />
price for potash for Russian farmers from 4,550 RUR<br />
to 4,250 RUR per tonne (in bulk, FCA, exclusive of<br />
VAT) until the end of the first half of <strong>2010</strong>. Later<br />
the Company decided to maintain this price for the<br />
long-term contracts are used, are India and China<br />
(sea shipments). The spot to long-term contract split<br />
in export sales was 40% to 60% respectively in <strong>2010</strong>.<br />
Maintaining a balance between spot and longterm<br />
sales allows the Company to be fl exible and<br />
to respond to changes in the market quickly. This<br />
strategy has been proven over time and <strong>Uralkali</strong><br />
intends to continue following it in the future.<br />
Historically exports account for the majority of<br />
the Company’s output. Its key markets are: Brazil,<br />
India, China, Southeast Asia, Russia, the US and<br />
Europe. Those are countries with high growth rates<br />
both in population and income, which drive demand<br />
for potash fertiliser.<br />
Russian farming sector for the second half of <strong>2010</strong>.<br />
About 29 thousand tonnes of potash was supplied to<br />
the Russian farmers in <strong>2010</strong>.<br />
Russian farmers were not the only consumers<br />
in the domestic market which <strong>Uralkali</strong> helped to<br />
overcome the consequences of the global fi nancial<br />
crisis. The Company also set discounted prices for<br />
Russian complex fertiliser producers.<br />
Hence, to ensure uninterrupted operations of<br />
the complex fertiliser producers, <strong>Uralkali</strong> devised<br />
a temporary anti-crisis measure which involved<br />
fl exible potash pricing in Q1 of <strong>2010</strong>. The temporary<br />
measures set the price for potassium chloride as the<br />
cost price for potassium chloride excluding part of<br />
expenses, but not less than 3,955 RUR per tonne (in<br />
bulk, FCA, exclusive of VAT) and not higher than<br />
4,700 RUR per tonne (in bulk, FCA, exclusive of<br />
VAT).<br />
In March <strong>2010</strong> based on recommendations from<br />
Russia’s Ministry of Industry and Trade and the<br />
32 <strong>Uralkali</strong> | <strong>Annual</strong> <strong>Report</strong> <strong>2010</strong> Table of Contents
SALES REVIEW<br />
Domestic Potash Sales in <strong>2010</strong><br />
10% Other industrial<br />
clients<br />
4% Farmers<br />
86% NPK fertilizer<br />
producers<br />
Federal Antimonopoly Service (FAS) <strong>Uralkali</strong> set<br />
the price for potash at 4,300 RUR per tonne (in<br />
bulk, FCA, exclusive of VAT) for complex fertiliser<br />
producers, effective till 31 December <strong>2010</strong>. Over<br />
590 thousand tonnes of potash was shipped to<br />
the complex fertiliser producers at this price. As a<br />
result of these measures the demand for complex<br />
fertilisers improved faster than that for potash, and<br />
the domestic complex fertiliser producers returned<br />
to full capacity operation in <strong>2010</strong>.<br />
The prices for Russian agricultural producers and<br />
complex fertiliser producers were signifi cantly lower<br />
than the global potash prices throughout the year.<br />
The Company intends to continue supporting the<br />
Russian agricultural and industrial sector.<br />
Another traditional group of <strong>Uralkali</strong>’s customers<br />
are companies in the oil, chemical and atomic<br />
industries, who use potash in their specialist<br />
technologies. Sales to these clients reached some 67<br />
thousand tonnes in <strong>2010</strong>. In setting prices for these<br />
customers, <strong>Uralkali</strong> used the formula set out in the<br />
agreement signed with the Russian Antimonopoly<br />
Service (FAS) in 2008. The formula is based on the<br />
average weighted export price in the lowest-priced<br />
Table of Contents<br />
market, excluding transport costs, and is used to<br />
count the price for domestic industrial consumers.<br />
In <strong>2010</strong> some 40 thousand tonnes of potash was<br />
sold through Moscow Stock Exchange at the price<br />
of 6,260 RUR per tonne (in bulk, FCA, exclusive of<br />
VAT).<br />
In November <strong>2010</strong> the Russian Antimonopoly<br />
Service (FAS) issued “Rules for Nondiscriminatory<br />
Access to Purchasing MOP”<br />
which prescribe potash producers who supply<br />
Russian complex fertiliser producers to set the price<br />
according to the average weighted export price in<br />
the lowest-priced market, excluding transport costs,<br />
(minimum export price).<br />
In accordance with rules set by FAS, <strong>Uralkali</strong><br />
concluded agreements on potash deliveries with<br />
the complex mineral fertiliser producers. The 3-year<br />
contracts were signed with JSC Acron, Phosagro and<br />
Eurochem.<br />
Potash supply long-term contracts with the<br />
complex fertiliser producers for the period of<br />
2011–2013; these contracts were concluded with<br />
the agreement to include price adjustment equal<br />
to US$ 27. Thus, the price for these customers with<br />
the additional discount will be about 5,700 RUR per<br />
tonne (FCA, in bulk, VAT excluding) in the Q1 of<br />
2011.<br />
Moreover, to support potash fertilisers supplies to<br />
the domestic market, the contracts specify discounts<br />
to be given to the complex fertiliser producers to<br />
the potash volumes intended for the production<br />
of complex fertilisers for the domestic market.<br />
This arrangement is expected to encourage potash<br />
consumption in the form of complex fertilisers in<br />
the domestic market, improve soil fertility and<br />
increase output volumes of high-quality agricultural<br />
products.<br />
33
URALKALI'S SALES GEOGRAPHY<br />
Total<br />
sales<br />
5,079<br />
Types of deliveries<br />
thousand<br />
tonnes<br />
Rail<br />
Sea shipments<br />
U S A<br />
Share in global potash consumption, %<br />
Potash production and<br />
consumption, mln tonnes KCl<br />
Production<br />
Consumption<br />
USA<br />
16%<br />
722<br />
THOUSAND<br />
TONNES<br />
B R A Z I L<br />
Brazil<br />
12%<br />
229<br />
THOUSAND<br />
TONNES<br />
Europe<br />
12%<br />
E U R O P E<br />
711<br />
THOUSAND<br />
TONNES<br />
BBT<br />
St. Petersburg<br />
Russia<br />
1%<br />
387<br />
THOUSAND<br />
TONNES<br />
790<br />
THOUSAND<br />
TONNES<br />
URALKALI<br />
Berezniki,<br />
Perm Region<br />
India<br />
12%<br />
706<br />
THOUSAND<br />
TONNES<br />
I N D I A<br />
682<br />
THOUSAND<br />
TONNES<br />
R U S S I A<br />
765<br />
THOUSAND<br />
TONNES<br />
C H I N A<br />
S O U T H E A S T<br />
Source: Fertecon Q4, <strong>2010</strong>, IFA, Companies<br />
10.3<br />
10.0<br />
<strong>Annual</strong> <strong>Report</strong>s<br />
9.2<br />
7.4 7.4<br />
6.0<br />
6.3<br />
7.0<br />
4.6<br />
34 <strong>Uralkali</strong> | <strong>Annual</strong> <strong>Report</strong> <strong>2010</strong> 1.2<br />
35<br />
0.6<br />
0.7<br />
0.0<br />
0.0<br />
China<br />
20%<br />
A S I A<br />
Southeast Asia<br />
14%
OPERATIONS REVIEW<br />
PRODUCTION IN <strong>2010</strong><br />
In <strong>2010</strong> <strong>Uralkali</strong> operated two potash mines<br />
and four processing plants that produce potash.<br />
Production capacity in <strong>2010</strong> was 5.5 million tonnes<br />
of KCl . The Company’s total output for the year<br />
was around 5.1 million tonnes, making capacity<br />
utilisation rate 92%.<br />
BEREZNIKI-4<br />
The Company continued to upgrade its<br />
production facilities as part of the programme<br />
started several years ago and also implemented<br />
its capacity expansion project aimed at increasing<br />
annual production capacity up to 7 million tonnes<br />
by 2012.<br />
The total cost of modernising Berezniki-4 in <strong>2010</strong><br />
was more than 4 billion RUR. The new production<br />
line was built at the enrichment plant and is now<br />
in the process of being commissioned. After it is<br />
fi nished in 2011, the Company plans to modernise<br />
its existing production line. In <strong>2010</strong> the skip hoist<br />
in the fi rst shaft was replaced; in 2011 the Company<br />
started to replace skip hoists in the second shaft.<br />
The Company has now fi nished the construction<br />
and installation of energy turbines. Their technical<br />
connection to the external grid is scheduled for<br />
2011.<br />
Production capacity<br />
mln tonnes KCl<br />
8<br />
6<br />
4<br />
2<br />
0<br />
4.2<br />
5.1<br />
5.3<br />
5.5 5.5 5.5<br />
7.0<br />
BEREZNIKI-3<br />
As part of the capacity expansion programme<br />
of the granulation section at Berezniki-3, the fi rst<br />
upgraded technological line was launched in <strong>2010</strong>.<br />
The Company also started the modernisation of the<br />
heating section which is scheduled for completion<br />
in 2011 and will increase <strong>Uralkali</strong>’s capacity for<br />
granular potash production from 1.3 million to<br />
1.7 million tonnes. In <strong>2010</strong> <strong>Uralkali</strong>’s investment in<br />
this project slightly exceeded 0.5 billion RUR.<br />
BEREZNIKI-2<br />
In addition to the projects mentioned above,<br />
in <strong>2010</strong> <strong>Uralkali</strong> replaced the skip hoist in the fi rst<br />
shaft and fi nished its reconstruction. In 2011 upon<br />
completion of the skip hoist installation, its annual<br />
lifting capacity will reach 11.4 million tonnes of ore.<br />
The Company spent 0.4 billion RUR on this project<br />
in <strong>2010</strong>.<br />
36 <strong>Uralkali</strong> | <strong>Annual</strong> <strong>Report</strong> <strong>2010</strong> Table of Contents
MINING CRUSHING<br />
CHEMICAL ENRICHMENT<br />
(HALURGIC METHOD)<br />
Ore extraction takes<br />
place underground<br />
at an approximate<br />
depth of 400 metres.<br />
Specialised mining<br />
combines drill for<br />
potash underground,<br />
then the extracted ore<br />
is moved by conveyor<br />
belts to the shafts and<br />
lifted to the surface.<br />
The halurgic method<br />
has been used since the<br />
potash industry started<br />
in the second half of<br />
the 19th century. The<br />
method is based on the<br />
varying joint solubility of<br />
potassium chloride (KCl)<br />
and sodium chloride<br />
(NaCl) in water at<br />
different temperatures.<br />
KCl crystallises out of<br />
saturated solution when<br />
it cools down.<br />
FLOTATION<br />
COMPACTING<br />
In the crushing section<br />
of the fl otation plant rod<br />
mills and screens break<br />
ore into smaller particles<br />
of the size required for<br />
further enrichment.<br />
The fl otation method<br />
has been used since the<br />
1960s to produce potash<br />
fertilisers for agriculture<br />
which contain up to 95%<br />
of the useful component.<br />
The method is based on<br />
the varying fl oatability of<br />
sylvite and halite minerals<br />
in the saturated aqueous<br />
solution of potassium<br />
chloride and sodium<br />
chloride in the presence<br />
of reagents. Partly purifi ed<br />
potash ore is placed in the<br />
fl otation machine, bubbles<br />
stick to potassium chloride<br />
particles and push them<br />
to the mixture surface for<br />
subsequent separation.<br />
The humidity of pink MOP<br />
after drying is only 0.1%.<br />
White Potash (MOP) Pink Potash (MOP) Granular Potash<br />
Chemical Enrichment (Halurgic method).<br />
White MOP is produced at <strong>Uralkali</strong>’s enrichment<br />
plants through the halurgic method. Potash<br />
fertilisers containing 95% and 98% of MOP<br />
and chemically pure 99.8% MOP (where the<br />
humidity of the end product after drying is<br />
only 0.2% of its weight) are produced using the<br />
halurgic method.<br />
Table of Contents<br />
PRODUCTION CHAIN<br />
STANDARD<br />
Flotation method. Pink MOP is produced<br />
at <strong>Uralkali</strong>’s enrichment plants through the<br />
fl otation method.<br />
Granulation. The process of making granular<br />
potash is identical to that for Pink MOP, up to<br />
the end of the fi nal drying phase. Following this<br />
phase, dried potash powder is compressed into<br />
fl akes (at 200–220 atm), then, fl akes are crushed<br />
and granules of the correct size are selected.<br />
These granules are treated to remove sharp<br />
edges and cracks and are hardened in furnaces<br />
to increase their strength. Granules are prepared<br />
for long transportation in the oil treatment<br />
blender. <strong>Uralkali</strong> also owns a technology of<br />
granular production from white MOP.<br />
37
OPERATIONS REVIEW<br />
CA PACITY EXPANSION PL ANS<br />
<strong>Uralkali</strong> is currently making signifi cant investment<br />
in capacity expansion. In 2012, once these projects<br />
have been completed, <strong>Uralkali</strong> will increase its<br />
production capacity by 27% – from 5.5 million<br />
tonnes to 7 million tonnes of KCl. Besides these<br />
current projects, there is a considerable potential<br />
for additional capacity expansion over the medium<br />
term. Currently, <strong>Uralkali</strong> develops a project of new<br />
mine construction. The new mine might provide<br />
signifi cant capacity increase.<br />
BEREZNIKI-4 CAPACITY<br />
EXPANSION INVESTMENT<br />
PROGRAMME<br />
The programme of investment will increase<br />
production capacity at Berezniki-4 from 1.3 million<br />
tonnes to 3 million tonnes of KCl. Additional capacity<br />
of 200 thousand tonnes was achieved in 2009 through<br />
the installation of a new dissolution unit. In 2012 the<br />
launch of the new production line will increase the<br />
plant’s capacity by a further 1.5 million tonnes of<br />
potash.<br />
NB<br />
Total cost of the project – 20 bln RUR<br />
Invested to date – 14 bln RUR<br />
Additional Information:<br />
• FINANCIAL MANAGEMENT DISCUSSION<br />
AND ANALYSIS (P. 39)<br />
38 <strong>Uralkali</strong> | <strong>Annual</strong> <strong>Report</strong> <strong>2010</strong><br />
EXPANSION OF GRANULAR<br />
CAPACITY<br />
<strong>Uralkali</strong>’s current capacity for granular potash<br />
production is 1.32 million tonnes.<br />
It is planned that this will increase to 1.7 million<br />
tonnes by the end of 2011.<br />
Total cost of the project – 1.5 bln RUR<br />
Invested to date – 1 bln RUR<br />
UST-YAYVINSKY FIELD<br />
The Company owns a licence to develop the<br />
Ust-Yayvinsky field which has total resources of<br />
1,290.6 million tonnes of ore I . <strong>Uralkali</strong> is currently<br />
considering different ways to develop this project.<br />
The Company intends to conduct an analysis of<br />
the potash market to develop an optimal strategic<br />
approach to the new mine construction. The analysis<br />
will be conducted following the completion of the<br />
merger of Silvinit and <strong>Uralkali</strong>.<br />
Note<br />
I. JORC valuation report as of 1 January 2011<br />
Table of Contents
FINANCIAL MANAGEMENT<br />
DISCUSSION AND ANALYSIS<br />
1. GROSS SALES<br />
In <strong>2010</strong>, there was a recovery in world demand for<br />
potash. As a result, the company’s sales volumes in<br />
<strong>2010</strong> were 103% above 2009 levels although the prices<br />
for potash fertilisers continued to decrease. The<br />
average export price (in US$) for <strong>Uralkali</strong> products<br />
was 28.9% lower in <strong>2010</strong> than in 2009.<br />
The growing demand resulted in an increase<br />
in <strong>2010</strong> revenues to 51.6 billion RUR (US$ 1,699<br />
million), up 53% on the previous year.<br />
Potash Sales Structure, <strong>2010</strong><br />
16% India<br />
15% China, rail<br />
14% SEA<br />
14% USA<br />
14% Europe<br />
Non-potash sales, at 1.5 billion RUR (US$ 51<br />
million), accounted for 3% of gross revenues. This<br />
figure includes non-core products and services,<br />
primarily sodium chloride (NaCl) solution and<br />
carnallite processing services, which made up 1.7%<br />
of total sales. It also includes transhipping services<br />
provided by the Baltic Bulk Terminal to complex<br />
fertiliser producers (1.3% of total sales).<br />
2. TRANSPORTATION<br />
Almost 79% of export sales in <strong>2010</strong> were shipped<br />
by sea through the company’s fully-owned terminal<br />
at the St. Petersburg seaport. Distribution costs for<br />
sea export include the railway tariff from Berezniki<br />
Table of Contents<br />
13% Russia<br />
8% China,<br />
sea<br />
5% Brazil<br />
1% Other<br />
Export Structure, <strong>2010</strong><br />
79% Sea export<br />
(through St. Petersburg)<br />
17% China rail<br />
4% Other<br />
to St. Petersburg, transhipment and freight costs<br />
(except for deliveries on an FOB basis).<br />
About 17% of export sales were transported to<br />
China by rail. The remaining 4% comprise other<br />
shipments, including deliveries by rail to customers<br />
in Europe and the CIS. Distribution costs for these<br />
deliveries include railway tariff costs to China,<br />
Europe and the CIS respectively.<br />
2.1 FREIGHT<br />
Average freight rates expressed in US$ were 5%<br />
higher than in 2009, at US$ 58 per tonne of product<br />
shipped by sea on a CFR basis.<br />
In <strong>2010</strong> the depreciation of the US$ against the<br />
rouble resulted in a 2% increase in average freight<br />
rates to 1,768 RUR per tonne of product shipped by<br />
sea on a CFR basis.<br />
<strong>Uralkali</strong>’s policy is to hedge sea shipping costs using<br />
long-term freight contracts. In <strong>2010</strong> approximately<br />
25% of sea deliveries were carried out using longterm<br />
freight contracts, a lower ratio than usual. This<br />
is because, having predicted a considerable drop in<br />
future freight rates, the Company did not book any<br />
new contracts for <strong>2010</strong>. In addition, the uncertainty<br />
in global potash markets would have made it risky to<br />
enter into new long-term agreements for signifi cant<br />
sales volumes.<br />
39
FINANCIAL MANAGEMENT DISCUSSION AND ANALYSIS<br />
Effective Freight Rates<br />
US$<br />
60<br />
45<br />
30<br />
15<br />
0<br />
55<br />
2%<br />
2.2 RAILWAY TARIFFS<br />
<strong>Uralkali</strong> typically delivers its products to the<br />
shipping terminal in St. Petersburg by rail. The<br />
company also carries out direct deliveries by rail<br />
to customers in North China, Europe and the CIS.<br />
Railway tariffs for all destinations are regulated by<br />
the State. In <strong>2010</strong> the State increased the tariffs to<br />
both St. Petersburg (resulting in an effective increase<br />
of 10%) and to China (resulting in an effective<br />
SPb Railway Tariff<br />
RUR per tonne<br />
1,000<br />
800<br />
600<br />
400<br />
200<br />
0<br />
NB<br />
58<br />
2009 <strong>2010</strong><br />
812<br />
10%<br />
897<br />
2009 <strong>2010</strong><br />
Additional Information:<br />
• URALKALI KEY FIGURES (P. 8)<br />
40 <strong>Uralkali</strong> | <strong>Annual</strong> <strong>Report</strong> <strong>2010</strong><br />
China Railway Tariff<br />
RUR per tonne<br />
2,000<br />
1,500<br />
1,000<br />
500<br />
0<br />
1,569<br />
increase of 13%). Overall, expenses for railway<br />
transportation have risen by 3 billion RUR, due to<br />
an increase in export volumes. Volumes transported<br />
to St. Petersburg were approximately doubled<br />
on 2009 levels, while rail deliveries to China were<br />
approximately seven times higher than in 2009.<br />
3. NET SALES<br />
13%<br />
1,779<br />
2009 <strong>2010</strong><br />
Net sales are defined as the gross revenues for<br />
the period net of certain distribution costs – freight<br />
costs, railway tariffs and transhipment costs. Net<br />
sales increased in <strong>2010</strong> by 39% to 40.6 billion RUR.<br />
4. TOTAL EXPENSES: POTASH<br />
SALES<br />
Total expenses for potash sales amounted to<br />
5,856 RUR per tonne I in <strong>2010</strong>. Total potash sales<br />
costs in the domestic market amounted to 3,640 RUR<br />
per tonne II .<br />
Notes<br />
I. Total expenses in the potash sales are calculated according to IFRS and include<br />
sales, distribution, general and administrative, and other operating expenses<br />
and taxes other than income tax for potash sales (See Note 7 to the Consolidated<br />
Financial Statement for the year ended 31 December <strong>2010</strong>)<br />
II. Total expenses of potash sales on the domestic market are calculated in<br />
accordance with <strong>Uralkali</strong>’s accounting policy and include expenses in lines №020,<br />
030, 040, 070, 100, 141, 142, 143, 149, 152, 153 of form №2 (See profi t and loss<br />
statement within <strong>Uralkali</strong>’s accounts for <strong>2010</strong>, prepared in line with the Russian<br />
accounting standards)<br />
Table of Contents
FINANCIAL MANAGEMENT DISCUSSION AND ANALYSIS<br />
5. CASH COST OF GOODS SOLD I<br />
Fixed costs account for more than 60% II of the cash<br />
cost of goods sold (COGS). As a result, COGS in <strong>2010</strong><br />
was signifi cantly impacted by the increase in sales<br />
volumes of 2.6 million tonnes (103% of 2009 sales<br />
volumes). The cash cost for products sold in <strong>2010</strong> was<br />
1,713 RUR per tonne (US$ 56).<br />
Cash COGS Structure, <strong>2010</strong><br />
33% Labour cost<br />
25% Fuel and energy<br />
15% Outsourced repairs<br />
15% Materials for repairs<br />
7% Production materials<br />
4% Transportation<br />
between mines<br />
1% Other<br />
5.1 LABOUR<br />
In <strong>2010</strong>, <strong>Uralkali</strong> has made some indexations of<br />
average monthly salary in order to align in with the<br />
market level. As the result, the average monthly salary<br />
was increased by 40% on 2009 to 27,800 RUR (about<br />
US$ 916 a month) mainly due to renewal of monthly<br />
bonuses (suspended in 2009 due to decrease in<br />
production levels) and indexation in line with market<br />
conditions. Labour compensation costs are fi xed as<br />
a result of social responsibility policy, meaning the<br />
company cannot reduce headcount during a period<br />
of temporary reduction in production volume. The<br />
salary is paid in RUR and is subject to devaluation in<br />
line with the fall in the rouble exchange rate.<br />
Notes<br />
I. Cash cost of goods sold = Cost of goods sold less depreciation<br />
II. For 100% utilisation rate. Actual utilisation rate in <strong>2010</strong> was approximately<br />
90%<br />
Table of Contents<br />
5.2 FUEL AND ENERGY<br />
Potash production is an energy-intensive process.<br />
For the most part, fuel and energy-related costs are<br />
variable and are set in RUR. In <strong>2010</strong>, tariffs for<br />
32% of supplied electricity and 70% of supplied gas<br />
were regulated by the State. The rest of the energy<br />
consumed by <strong>Uralkali</strong> was either purchased on<br />
the open market, or was produced by the company<br />
(electricity). Open market prices for gas and<br />
electricity in <strong>2010</strong> were respectively 4% and 15%<br />
higher than regulated prices.<br />
Gas Tariff<br />
ths. RUR/1000 m 3<br />
3<br />
2<br />
1<br />
0<br />
1.96<br />
Effective Electricity Tariff<br />
ths. RUR/1,000 kWh<br />
3<br />
2<br />
1<br />
0<br />
+ 20%<br />
2.36<br />
2009 <strong>2010</strong><br />
1.56<br />
+ 12%<br />
1.74<br />
2009 <strong>2010</strong><br />
41
FINANCIAL MANAGEMENT DISCUSSION AND ANALYSIS<br />
Gas Consumption<br />
mln m 3<br />
240<br />
200<br />
160<br />
120<br />
80<br />
40<br />
0<br />
167<br />
Electricity Consumption<br />
mln kWT<br />
1,000<br />
800<br />
600<br />
400<br />
200<br />
0<br />
+ 13%<br />
188<br />
2009 <strong>2010</strong><br />
605<br />
+ 31%<br />
793<br />
2009 <strong>2010</strong><br />
As a result, the effective tariff on gas in <strong>2010</strong><br />
increased by 20% on 2009 to 2,359 RUR (US$ 78)<br />
per thousand cubic meters. The effective tariff on<br />
electricity in <strong>2010</strong> rose by 12% to 1,739 RUR (US$ 57)<br />
per thousand kWh.<br />
NB<br />
Additional Information:<br />
• URALKALI KEY FIGURES (P. 8)<br />
42 <strong>Uralkali</strong> | <strong>Annual</strong> <strong>Report</strong> <strong>2010</strong><br />
Fuel and Energy Cost, <strong>2010</strong><br />
75% Other cash COGS<br />
16% Electricity<br />
6% Gas<br />
2% Heat<br />
1% Fuel oil<br />
5.3 OTHER CASH COSTS<br />
Other cash costs include variable costs (such as<br />
production materials and transportation between<br />
mines) and fixed costs (such as costs related to<br />
outsourced repairs and maintenance and materials<br />
for repairs and utilities). More than 90% of these<br />
costs are in RUR.<br />
6. GENERAL AND<br />
ADMINISTRATIVE EXPENSES<br />
On average general and administrative cash costs I<br />
in <strong>2010</strong> were 31% higher than in 2009. Personnel<br />
costs account for more than half of these expenses.<br />
General and Administrative Costs, <strong>2010</strong><br />
64% Labour<br />
20% Other<br />
7% Consulting<br />
4% Repairs<br />
3% Security<br />
2% Insurance<br />
Note<br />
I. Cash general and administrative expenses = General and administrative<br />
expenses less depreciation and amortisation<br />
Table of Contents
FINANCIAL MANAGEMENT DISCUSSION AND ANALYSIS<br />
7. COST REDUCTION<br />
PROGRAMMES<br />
7.1 PROGRAMME TO INCREASE<br />
PRODUCTIVITY<br />
At the end of <strong>2010</strong>, about 7,200 people were<br />
employed at <strong>Uralkali</strong>’s main production unit. In<br />
2009 and <strong>2010</strong> the company had a longstanding<br />
programme to increase productivity by 40% and<br />
reduce headcount in the main production unit fi nally<br />
to 6,000 through the optimisation and automation<br />
of production processes. To date the programme<br />
was suspended due to the process of combination of<br />
<strong>Uralkali</strong> and Silvinit. After the merger is completed,<br />
the programme will be renewed and continued.<br />
Headcount of Main Production Unit (period average)<br />
ths. employees<br />
15<br />
10<br />
5<br />
0<br />
10.2<br />
8.6 8.7<br />
7.8<br />
2006 2007 2008 2009 <strong>2010</strong><br />
Headcount of <strong>Uralkali</strong> group (period average)<br />
ths. employees<br />
15<br />
10<br />
5<br />
0<br />
12.7<br />
Table of Contents<br />
11.5<br />
12.5<br />
13.0<br />
7.2<br />
12.7<br />
2006 2007 2008 2009 <strong>2010</strong><br />
By the end of <strong>2010</strong> the company had mainly<br />
completed the planned separation of service<br />
divisions from the main production unit. The staff<br />
employed in service divisions (mainly involved in<br />
repairs, construction, motor freight and IT services)<br />
account for the difference between the headcount of<br />
the group and the headcount of the main production<br />
unit. During <strong>2010</strong> <strong>Uralkali</strong> sold its share in the<br />
healthcare services division. This mainly resulted<br />
in overall headcount decrease of the Group.<br />
7.2 POWER GENERATION<br />
PROGRAMME<br />
By the end of <strong>2010</strong> <strong>Uralkali</strong> had reached the fi nal<br />
stage of its power generation programme, which had<br />
been underway for several years.<br />
In the second half of 2011 we expect to start all four<br />
electricity generation turbines at Production Unit 4 and<br />
produce electricity in amount of 137 million kwt. We<br />
expect to obtain licences for the parallel operation of<br />
the turbines in mid-2011, which will enable us to realise<br />
energy cost savings of approximately 50 RUR per tonne<br />
of potash produced I . In <strong>2010</strong>, without the licence,<br />
electricity produced by the company was insignifi cant<br />
in the total volume of electricity consumed.<br />
8. EBITDA<br />
In <strong>2010</strong> adjusted EBITDA II increased by 48% to<br />
24.3 billion RUR. The adjusted EBITDA margin III in<br />
<strong>2010</strong> increased to 60% from 56% the previous year.<br />
Notes<br />
I. This is calculated as the difference between the cost of purchased electricity and<br />
the cost of generated electricity, based on the assumptions that the company will<br />
operate at full capacity and that gas prices will increase by 15%, and electricity by<br />
14% in 2011 respectively<br />
II. Adjusted EBITDA represents operating profit plus depreciation and<br />
amortisation. Adjusted EBITDA does not refl ect the impact of fi nance income<br />
and expenses and mine fl ooding costs<br />
III. Adjusted EBITDA margin is calculated as adjusted EBITDA divided by Net<br />
Sales<br />
43
FINANCIAL MANAGEMENT DISCUSSION AND ANALYSIS<br />
9. MINE FLOODING COSTS<br />
As of 31 December 2009 the company accrued<br />
additional provisions of 1 billion RUR related to<br />
additional expenses on the Yayva-Solikamsk railroad.<br />
To date this provision has not been utilised as the<br />
process for making payment has not been fi nalised.<br />
(For more details see Note 5 to the Consolidated<br />
Financial Statements for the year ended 31 December<br />
<strong>2010</strong>).<br />
10. CAPEX<br />
Structure of CAPEX Expension, <strong>2010</strong><br />
55% 2nd line at plant 4<br />
(+1,5 mln tonnes)<br />
14% Ust-Yayva 5<br />
9% Infrastructure<br />
8% Additional granulation at<br />
plant 2,3 (+0,4 mln tonnes)<br />
7% Shaft modernisation<br />
7% Power generation<br />
CAPEX Evolution<br />
bln RUR<br />
15<br />
10<br />
5<br />
0<br />
NB<br />
5.2<br />
Maintenance<br />
6.3<br />
14.3<br />
Expansion<br />
14.1<br />
2006 2007 2008 2009 <strong>2010</strong><br />
Additional Information:<br />
• CAPACITY EXPANSION PLANS (P. 38)<br />
• FINANCIAL MANAGEMENT DISCUSSION AND<br />
ANALYSIS (P. 39)<br />
44 <strong>Uralkali</strong> | <strong>Annual</strong> <strong>Report</strong> <strong>2010</strong><br />
10.3<br />
In <strong>2010</strong> total CAPEX amounted to 10.3 I billion<br />
RUR, of which more than a half was spent on<br />
expansion and cost reduction. The main projects<br />
included increasing production at Production Unit<br />
4 by 1.5 million tonnes (modernisation of the second<br />
production line); designing the shaft for Ust-Yayva;<br />
implementing the company’s power generation<br />
programme; and infrastructure development. More<br />
than 95% of maintenance costs are in RUR.<br />
11. CASH FLOW<br />
Due to increased sales volumes in <strong>Uralkali</strong>’s<br />
main markets net cash generated from operations<br />
increased to 21.2 billion RUR, approximately 5 times<br />
higher than in 2009.<br />
As of 31 December <strong>2010</strong> <strong>Uralkali</strong> had net cash of<br />
3.5 billion RUR (US$ 115 million). Its cash balance<br />
amounted to 14.8 billion RUR, with bank debt at 11.3<br />
billion RUR denominated in US$, with an average<br />
interest rate of around 3.4%.<br />
Operating Cash Flow vs. CAPEX<br />
bln RUR<br />
35<br />
30<br />
25<br />
20<br />
15<br />
10<br />
5<br />
0<br />
6.6 5.2<br />
2006<br />
8.2<br />
6.3<br />
2007<br />
Operating cash flow<br />
32.6<br />
14.3<br />
2008<br />
CAPEX<br />
2009<br />
Note<br />
I. CAPEX for the period includes additions to property, plant and equipment<br />
for the period, adjusted for the changes in balances of letters of credit and<br />
prepayments for acquisition of PPE<br />
4.5<br />
14.1<br />
21.2<br />
10.3<br />
<strong>2010</strong><br />
Table of Contents
URALKALI GROUP<br />
INTERNATIONAL FINANCIAL<br />
REPORTING STANDARDS<br />
CONSOLIDATED FINANCIAL STATEMENTS<br />
AND AUDITOR’S REPORT FOR THE YEAR ENDED<br />
31 DECEMBER <strong>2010</strong><br />
Independent Auditor’s <strong>Report</strong> 46<br />
Consolidated Statement of Financial Position 47<br />
Consolidated Statement of Income 48<br />
Consolidated Statement of Comprehensive Income 49<br />
Consolidated Statement of Cash Flows 50<br />
Consolidated Statement of Changes in Equity 51<br />
Notes to the Consolidated Financial Statements 52<br />
1 The <strong>Uralkali</strong> Group and its operations 52<br />
2 Basis of preparation and signifi cant accounting policies 52<br />
3 Adoption of new or revised standards and interpretations 62<br />
4 New accounting pronouncements 64<br />
5 Critical accounting estimates, and judgements in applying accounting policies 65<br />
6 Related parties 67<br />
7 Segment reporting 68<br />
8 Property, plant and equipment 70<br />
9 Investments in subsidiary and jointly controlled entities 72<br />
10 Intangible assets 72<br />
11 Inventories 73<br />
12 Trade and other receivables 73<br />
13 Cash and cash equivalents 74<br />
14 Shareholders’ equity 75<br />
15 Mine fl ooding provisions 75<br />
16 Borrowings 75<br />
17 Trade and other payables 77<br />
18 Revenues 77<br />
19 Cost of sales 78<br />
20 Distribution costs 78<br />
21 General and administrative expenses 78<br />
22 Labour costs 79<br />
23 Other operating income and expenses 79<br />
24 Finance income and expense 79<br />
25 Mine fl ooding costs 80<br />
26 Income tax expense 80<br />
27 Post employment benefi ts obligations 81<br />
28 Earnings per share 82<br />
29 Contingencies, commitments and operating risks 82<br />
30 Financial risk management 85<br />
31 Fair value of fi nancial instruments 87<br />
32 Events after reporting date 88<br />
International Financial <strong>Report</strong>ing Standards<br />
Consolidated Financial Statements and Auditor’s <strong>Report</strong> for the Year Ended 31 December <strong>2010</strong><br />
International Financial <strong>Report</strong>ing Standards<br />
Consolidated Table of Contents<br />
Financial Statements and Auditor’s <strong>Report</strong> for the Year Ended 31 December <strong>2010</strong><br />
45
INDEPENDENT AUDITOR’S REPORT<br />
To the Shareholders and Board of Directors of Open Joint Stock Company <strong>Uralkali</strong>:<br />
1. We have audited the accompanying consolidated financial statements of Open Joint Stock Company<br />
“<strong>Uralkali</strong>” (the “Company”) and its subsidiaries (the “Group”) which comprise the consolidated statement of<br />
fi nancial position as of 31 December <strong>2010</strong> and the consolidated statements of income, comprehensive income,<br />
cash fl ows and changes in equity for the year then ended and a summary of signifi cant accounting policies and<br />
other explanatory notes.<br />
MANAGEMENT’S RESPONSIBILITY FOR THE CONSOLIDATED FINANCIAL<br />
STATEMENTS<br />
2. Management is responsible for the preparation and fair presentation of these consolidated fi nancial statements<br />
in accordance with International Financial <strong>Report</strong>ing Standards, and for such internal control as management<br />
determines is necessary to enable the preparation of fi nancial statements that are free from material misstatement,<br />
whether due to fraud or error.<br />
AUDITOR’S RESPONSIBILITY<br />
3. Our responsibility is to express an opinion on these consolidated fi nancial statements based on our audit. We<br />
conducted our audit in accordance with International Standards on Auditing. Those Standards require that we<br />
comply with ethical requirements and plan and perform the audit to obtain reasonable assurance whether the<br />
fi nancial statements are free from material misstatement.<br />
4. An audit involves performing procedures to obtain audit evidence about the amounts and disclosures in the<br />
consolidated fi nancial statements. The procedures selected depend on the auditor’s judgment, including the<br />
assessment of the risks of material misstatement of the fi nancial statements, whether due to fraud or error. In making<br />
those risk assessments, the auditor considers internal control relevant to the entity’s preparation and fair presentation<br />
of the fi nancial statements in order to design audit procedures that are appropriate in the circumstances, but not<br />
for the purpose of expressing an opinion on the effectiveness of the entity’s internal control. An audit also includes<br />
evaluating the appropriateness of accounting policies used and the reasonableness of accounting estimates made<br />
by management, as well as evaluating the overall presentation of the fi nancial statements.<br />
5. We believe that the audit evidence we have obtained is suffi cient and appropriate to provide a basis for our<br />
audit opinion.<br />
OPINION<br />
6. In our opinion, the accompanying consolidated fi nancial statements present fairly, in all material respects,<br />
the fi nancial position of the Group as of 31 December <strong>2010</strong>, and its fi nancial performance and its cash fl ows for<br />
the year then ended in accordance with International Financial <strong>Report</strong>ing Standards.<br />
1 April 2011<br />
Moscow, Russian Federation<br />
46 <strong>Uralkali</strong> | <strong>Annual</strong> <strong>Report</strong> <strong>2010</strong> Table of Contents
URALKALI GROUP<br />
CONSOLIDATED STATEMENT<br />
OF FINANCIAL POSITION<br />
AS OF 31 DECEMBER <strong>2010</strong><br />
(IN MILLIONS OF RUSSIAN ROUBLES UNLESS OTHERWISE STATED)<br />
Note 31 December <strong>2010</strong> 31 December 2009<br />
ASSETS<br />
Non-current assets<br />
ASSETS<br />
Property, plant and equipment<br />
Non-current assets<br />
Prepayments for acquisition of property, plant and equipment<br />
Property, plant and equipment<br />
Letters of credit for acquisition of property, plant and equipment<br />
Prepayments for acquisition of property, plant and equipment<br />
Goodwill<br />
Letters of credit for acquisition of property, plant and equipment<br />
Intangible assets<br />
Goodwill<br />
Deferred income tax assets<br />
Intangible assets<br />
Financial assets<br />
Deferred income tax assets<br />
VAT recoverable<br />
Financial assets<br />
Total non-current assets<br />
VAT recoverable<br />
Note<br />
8<br />
8<br />
10<br />
26<br />
10<br />
26<br />
31 December <strong>2010</strong><br />
47,144<br />
1,022<br />
47,144<br />
130<br />
1,022<br />
366<br />
130<br />
142<br />
366<br />
258<br />
142<br />
228<br />
258<br />
-<br />
228<br />
49,290<br />
-<br />
31 December 2009<br />
42,208<br />
1,653<br />
42,208<br />
2,281<br />
1,653<br />
366<br />
2,281<br />
138<br />
366<br />
247<br />
138<br />
230<br />
247<br />
225<br />
230<br />
47,348<br />
225<br />
Total Current non-current assets assets 49,290 47,348<br />
Inventories<br />
Current assets<br />
Trade and other receivables<br />
Inventories<br />
Current income tax prepayments<br />
Trade and other receivables<br />
Loans issued to related parties<br />
Current income tax prepayments<br />
Cash and cash equivalents<br />
Loans issued to related parties<br />
Total current assets<br />
Cash and cash equivalents<br />
11<br />
12<br />
11<br />
12<br />
6<br />
13<br />
6<br />
13<br />
3,515<br />
7,164<br />
3,515<br />
62<br />
7,164<br />
10<br />
62<br />
14,765<br />
10<br />
25,516<br />
14,765<br />
3,481<br />
5,850<br />
3,481<br />
74<br />
5,850<br />
1,578<br />
74<br />
4,297<br />
1,578<br />
15,280<br />
4,297<br />
Total TOTAL current ASSETS assets 74,806 25,516 62,628 15,280<br />
TOTAL ASSETS EQUITY<br />
74,806 62,628<br />
Share capital<br />
EQUITY<br />
Treasury shares<br />
Share capital<br />
Share discount<br />
Treasury shares<br />
Revaluation reserve<br />
Share discount<br />
Retained earnings<br />
Revaluation reserve<br />
Equity attributable to the Company’s equity holders<br />
Retained earnings<br />
14<br />
14<br />
14<br />
14<br />
648<br />
(12)<br />
648<br />
(849)<br />
(12)<br />
150<br />
(849)<br />
56,837<br />
150<br />
56,774<br />
56,837<br />
648<br />
(12)<br />
648<br />
(849)<br />
(12)<br />
150<br />
(849)<br />
43,751<br />
150<br />
43,688<br />
43,751<br />
Equity Non-controlling attributable interest to the Company’s equity holders 56,774 23 43,688 27<br />
Non-controlling TOTAL EQUITY interest 56,797 23 43,715 27<br />
TOTAL EQUITY LIABILITIES<br />
56,797 43,715<br />
Non-current liabilities<br />
LIABILITIES<br />
Borrowings<br />
Non-current liabilities<br />
Post employment benefits obligations<br />
Borrowings<br />
Deferred income tax liability<br />
Post employment benefits obligations<br />
Total non-current liabilities<br />
Deferred income tax liability<br />
16<br />
27<br />
16<br />
26<br />
27<br />
26<br />
9,216<br />
282<br />
9,216<br />
647<br />
282<br />
10,145<br />
647<br />
8,361<br />
260<br />
8,361<br />
416<br />
260<br />
9,037<br />
416<br />
Total Current non-current liabilities liabilities 10,145 9,037<br />
Borrowings<br />
Current liabilities<br />
Trade and other payables<br />
Borrowings<br />
Mine flooding provisions<br />
Trade and other payables<br />
Current income tax payable<br />
Mine flooding provisions<br />
Other taxes payable<br />
Current income tax payable<br />
Total current liabilities<br />
Other taxes payable<br />
16<br />
17<br />
16<br />
5, 15<br />
17<br />
5, 15<br />
2,589<br />
3,489<br />
2,589<br />
1,000<br />
3,489<br />
306<br />
1,000<br />
480<br />
306<br />
7,864<br />
480<br />
5,654<br />
2,745<br />
5,654<br />
1,000<br />
2,745<br />
109<br />
1,000<br />
368<br />
109<br />
9,876<br />
368<br />
Total current liabilities<br />
TOTAL LIABILITIES<br />
7,864<br />
18,009<br />
9,876<br />
18,913<br />
TOTAL<br />
TOTAL<br />
LIABILITIES<br />
LIABILITIES AND EQUITY 74,806<br />
18,009<br />
62,628<br />
18,913<br />
TOTAL LIABILITIES AND EQUITY<br />
Approved on behalf of the Board of Directors<br />
1 April 2011<br />
Approved on behalf of the Board of Directors<br />
1 April 2011<br />
74,806 62,628<br />
Chief Executive Officer<br />
Chief Executive Officer<br />
The accompanying notes are an integral part of these consolidated fi nancial statements<br />
The accompanying notes are an integral part of these consolidated fi nancial statements<br />
International International Financial Financial <strong>Report</strong>ing Standards<br />
Standards<br />
Consolidated Financial Statements Statements and Auditor’s <strong>Report</strong> for the Year Ended 31 December <strong>2010</strong><br />
International Financial <strong>Report</strong>ing Standards<br />
Consolidated Table of Contents Financial Statements and Auditor’s <strong>Report</strong> for the Year Ended 31 December <strong>2010</strong><br />
Chief Financial Officer<br />
Chief Financial Officer<br />
47
URALKALI GROUP<br />
CONSOLIDATED STATEMENT OF INCOME<br />
FOR THE YEAR ENDED<br />
31 DECEMBER <strong>2010</strong><br />
(IN MILLIONS OF RUSSIAN ROUBLES UNLESS OTHERWISE STATED)<br />
Note <strong>2010</strong> 2009<br />
Revenues 18 51,592 33,809<br />
Cost of sales 19 (11,830) (8,878)<br />
Gross profit 39,762 24,931<br />
Distribution costs 20 (12,819) (6,075)<br />
General and administrative expenses 21 (4,937) (3,838)<br />
Taxes other than income tax (639) (502)<br />
Other operating income and expenses 23 (917) (1,328)<br />
Operating profit 20,450 13,188<br />
Mine flooding costs 25 (28) (1,060)<br />
Finance income 24 214 456<br />
Finance expense 24 (887) (1,350)<br />
Profit before income tax 19,749 11,234<br />
Income tax expense 26 (3,095) (2,139)<br />
Net profit for the year 16,654 9,095<br />
Profit is attributable to:<br />
Owners of the Company 16,650 9,089<br />
Non-controlling interests 4 6<br />
Net profit for the year 16,654 9,095<br />
Earnings per share – basic and diluted (in Roubles) 28 7.93 4.33<br />
The accompanying notes are an integral part of these consolidated fi nancial statements<br />
48 <strong>Uralkali</strong> | <strong>Annual</strong> <strong>Report</strong> <strong>2010</strong> Table of Contents
URALKALI GROUP<br />
CONSOLIDATED STATEMENT<br />
OF COMPREHENSIVE INCOME FOR<br />
THE YEAR ENDED 31 DECEMBER <strong>2010</strong><br />
(IN MILLIONS OF RUSSIAN ROUBLES UNLESS OTHERWISE STATED)<br />
<strong>2010</strong> 2009<br />
Net profit for the year 16,654 9,095<br />
Disposal of subsidiary to associate 1 -<br />
Total comprehensive income for the year 16,655 9,095<br />
Total comprehensive income for the year<br />
attributable to:<br />
Owners of the Company 16,651 9,089<br />
Non-controlling interests 4 6<br />
The accompanying notes are an integral part of these consolidated fi nancial statements<br />
International Financial <strong>Report</strong>ing Standards<br />
Consolidated Financial Statements and Auditor’s <strong>Report</strong> for the Year Ended 31 December <strong>2010</strong><br />
International Financial <strong>Report</strong>ing Standards<br />
Consolidated Table of Contents<br />
Financial Statements and Auditor’s <strong>Report</strong> for the Year Ended 31 December <strong>2010</strong><br />
49
URALKALI GROUP<br />
CONSOLIDATED STATEMENT<br />
OF CASH FLOWS<br />
FOR THE YEAR ENDED<br />
31 DECEMBER <strong>2010</strong><br />
(IN MILLIONS OF RUSSIAN ROUBLES UNLESS OTHERWISE STATED)<br />
Note <strong>2010</strong> 2009<br />
Cash flows from operating activities<br />
Profit before income tax 19,749 11,234<br />
Adjustments for:<br />
Depreciation of property, plant and equipment and amortisation of intangible assets 8, 10 3,849 3,188<br />
Net loss on disposal of property, plant and equipment 23 279 271<br />
Reversal of provision for impairment of receivables 23 (11) (20)<br />
Net change in mine flooding provisions 15 - (6,804)<br />
Finance income and expense, net 386 (7)<br />
Foreign exchange losses, net 24 225 751<br />
Operating cash flows before working capital changes 24,477 8,613<br />
(Increase)/decrease in trade and other receivables (1,096) 115<br />
Increase in inventories 11 (34) (516)<br />
Increase/(decrease) in accounts payable, accrued expenses and other creditors 895 (1,368)<br />
Increase in other taxes payable 112 70<br />
Cash generated from operations 24,354 6,914<br />
Interest paid 16 (465) (393)<br />
Income taxes paid (2,671) (2,049)<br />
Net cash generated from operating activities 21,218 4,472<br />
Cash flows from investing activities<br />
Acquisition of intangible assets 10 (60) (34)<br />
Acquisition of property, plant and equipment (10,310) (13,606)<br />
Proceeds from sales of property, plant and equipment 3,992 26<br />
Purchase and sale of investments, net (2) (39)<br />
Acquisition of subsidiaries, net of cash acquired (4) (753)<br />
Loans issued to related party 6 (555) (1,578)<br />
Loans repaid by related party 6 2,123 -<br />
Increase in irrevocable bank deposits 13 (77) (13)<br />
Dividends and interest received 174 628<br />
Net cash used in investing activities (4,719) (15,369)<br />
Cash flows from financing activities<br />
Repayments of borrowings 16 (14,768) (11,880)<br />
Proceeds from borrowings 16 12,411 10,774<br />
Finance lease payments 16, 24 (49) (38)<br />
Dividends paid to shareholders (3,575) (10)<br />
Net cash used in financing activities (5,981) (1,154)<br />
Effect of foreign exchange rate changes on cash and cash equivalents (127) 161<br />
Net increase/(decrease) in cash and cash equivalents 10,391 (11,890)<br />
Cash and cash equivalents at the beginning of the year, net of restricted cash 13 4,284 16,174<br />
Cash and cash equivalents at the end of the year, net of restricted cash 13 14,675 4,284<br />
The accompanying notes are an integral part of these consolidated fi nancial statements<br />
50 <strong>Uralkali</strong> | <strong>Annual</strong> <strong>Report</strong> <strong>2010</strong> Table of Contents
URALKALI GROUP<br />
CONSOLIDATED STATEMENT<br />
OF CHANGES IN EQUITY<br />
FOR THE YEAR ENDED<br />
31 DECEMBER <strong>2010</strong><br />
(IN MILLIONS OF RUSSIAN ROUBLES UNLESS OTHERWISE STATED)<br />
Share capital<br />
(Note 14)<br />
Attributable to equity holders of the Company<br />
Treasury<br />
shares<br />
(Note 14)<br />
Share<br />
discount<br />
Revaluation<br />
reserve<br />
Retained<br />
earnings<br />
Total<br />
attributable<br />
to owners of<br />
the Company<br />
Noncontrolling<br />
interest Total equity<br />
Balance at<br />
1 January 2009 648 (12) (849) 150 34,662 34,599 21 34,620<br />
Total comprehensive<br />
income for the year - - - - 9,089 9,089 6 9,095<br />
Balance at<br />
31 December 2009 648 (12) (849) 150 43,751 43,688 27 43,715<br />
Total comprehensive<br />
income for the year - - - 16,651 16,651 4 16,655<br />
Dividends declared<br />
(Note 14) - - - - (3,565) (3,565) - (3,565)<br />
Disposal of noncontrolling<br />
interest - - - - - - (8) (8)<br />
Balance at<br />
31 December <strong>2010</strong> 648 (12) (849) 150 56,837 56,774 23 56,797<br />
The accompanying notes are an integral part of these consolidated fi nancial statements<br />
International Financial <strong>Report</strong>ing Standards<br />
Consolidated Financial Statements and Auditor’s <strong>Report</strong> for the Year Ended 31 December <strong>2010</strong><br />
International Financial <strong>Report</strong>ing Standards<br />
Consolidated Table of Contents<br />
Financial Statements and Auditor’s <strong>Report</strong> for the Year Ended 31 December <strong>2010</strong><br />
51
URALKALI GROUP<br />
NOTES TO THE CONSOLIDATED<br />
FINANCIAL STATEMENTS<br />
FOR THE YEAR ENDED<br />
31 DECEMBER <strong>2010</strong><br />
(IN MILLIONS OF RUSSIAN ROUBLES UNLESS OTHERWISE STATED)<br />
1. THE URALKALI GROUP AND ITS OPERATIONS<br />
Open Joint Stock Company <strong>Uralkali</strong> (the “Company”) and its subsidiaries (together the “Group”) produce<br />
mineral fertilisers, primarily potassium based, which are extracted and processed in the vicinity of the city of<br />
Berezniki, Russia, and which are distributed both on domestic and foreign markets. The Group manufactures<br />
approximately ten types of products, the most signifi cant of which is a wide range of potassium salts. The Group<br />
is one of two major potash manufacturers in the Russian Federation. For the year ended 31 December <strong>2010</strong><br />
approximately 87% of potash fertiliser production was exported (for the year ended 31 December 2009: 76%).<br />
The Company holds operating licenses, issued by the Perm regional authorities for the extraction of<br />
potassium, magnesium and sodium salts from the Bereznikovskiy, Durimanskiy and Bigelsko-Troitsky plots of<br />
the Verkhnekamskoye fi eld. These licenses expire in 2013; however based on the statutory licensing regulations<br />
and prior experience, the Company’s management believes that the licenses will be renewed without incurring<br />
any signifi cant cost. The Company also owns a license for the Ust-Yayvinskiy plot of the Verkhnekamskoye fi eld,<br />
which expires in 2024.<br />
The Company was incorporated as an open joint stock company in the Russian Federation on 14 October 1992.<br />
The Company has its registered offi ce at 63 Pyatiletki St., Berezniki, Perm region, Russian Federation. Almost all<br />
of the Group’s productive capacities and all long-term assets are located in the Russian Federation.<br />
As of 31 December 2009, Madura Holdings Limited, registered in Cyprus, was the parent company of OJSC<br />
<strong>Uralkali</strong>. The Group was ultimately controlled by Mr. Dmitry Rybolovlev. On 11 June <strong>2010</strong> Madura Holdings<br />
Limited disposed majority of its stake in the Company to three companies that are benefi cially owned by a number<br />
of individuals. None of these companies exercise control over the Group and there is no joint control agreement<br />
between them. As of 31 December <strong>2010</strong> the Group had no ultimate controlling party.<br />
As of 31 December <strong>2010</strong> the Group employed approximately 12.7 thousand employees (31 December 2009:<br />
13.2 thousand).<br />
2. BASIS OF PREPARATION AND SIGNIFICANT ACCOUNTING POLICIES<br />
The principal accounting policies applied in the preparation of these consolidated fi nancial statements are set<br />
out below. These policies have been consistently applied to all the periods presented, unless otherwise stated.<br />
2.1 BASIS OF PREPARATION<br />
These consolidated fi nancial statements have been prepared in accordance with International Financial<br />
<strong>Report</strong>ing Standards (“IFRS”) under the historical cost convention except for certain fi nancial instruments that<br />
are presented at fair value as described in Note 2.13.<br />
Group companies maintain their accounting records in Russian Roubles (“RR”) and prepare their statutory<br />
fi nancial statements in accordance with the Federal Law on Accounting of the Russian Federation, except for<br />
<strong>Uralkali</strong> Trading SA, <strong>Uralkali</strong> Trading (Gibraltar) Ltd. and UKT Chicago which maintain their accounting records<br />
in US Dollars (“US$”) and prepare their fi nancial statements in accordance with IFRS. Belarusian Potash Company<br />
maintains its accounting records in Belorussian Roubles (“BYR”) and in accordance with Belarusian Laws and<br />
Regulations. These consolidated fi nancial statements are based on the statutory records, with adjustments and<br />
reclassifi cations recorded for the purpose of fair presentation in accordance with IFRS.<br />
52 <strong>Uralkali</strong> | <strong>Annual</strong> <strong>Report</strong> <strong>2010</strong> Table of Contents
URALKALI GROUP<br />
NOTES TO THE CONSOLIDATED FINANCIAL STATEMENTS FOR THE YEAR ENDED 31 DECEMBER <strong>2010</strong><br />
2. BASIS OF PREPARATION AND SIGNIFICANT ACCOUNTING POLICIES (CONTINUED)<br />
2.1 BASIS OF PREPARATION (CONTINUED)<br />
2.2 ACCOUNTING FOR THE EFFECT OF INFLATION<br />
The Russian Federation has previously experienced relatively high levels of infl ation and was considered to be<br />
hyperinfl ationary as defi ned by IAS 29 “Financial <strong>Report</strong>ing in Hyperinfl ationary Economies”. IAS 29 requires that<br />
fi nancial statements prepared in the currency of a hyperinfl ationary economy be stated in terms of the measuring<br />
unit current at the reporting date. Hyperinfl ation in the Russian Federation ceased effective from 1 January<br />
2003. Restatement procedures of IAS 29 are therefore only applied to assets acquired or revalued and liabilities<br />
incurred or assumed prior to that date. For these balances, the amounts expressed in the measuring unit current at<br />
31 December 2002 are treated as the basis for the carrying amounts in these consolidated fi nancial statements.<br />
2.3 CONSOLIDATED FINANCIAL STATEMENTS<br />
Subsidiaries are those companies and other entities in which the Group, directly or indirectly, has an interest<br />
of more than one-half of the voting rights or otherwise has power to govern the fi nancial and operating policies<br />
so as to obtain economic benefi ts.<br />
The existence and effect of potential voting rights that are presently exercisable or presently convertible are<br />
considered when assessing whether the Group controls another entity. Subsidiaries are consolidated from the<br />
date on which control is transferred to the Group (acquisition date) and are deconsolidated from the date that<br />
control ceases.<br />
The Group uses the acquisition method of accounting to account for business combinations. The consideration<br />
transferred for the acquisition of a subsidiary is the fair values of the assets transferred, the liabilities incurred<br />
and the equity interests issued by the Group. The consideration transferred includes the fair value of any asset<br />
or liability resulting from a contingent consideration arrangement. Acquisition-related costs are expensed as<br />
incurred. Identifi able assets acquired and liabilities and contingent liabilities assumed in a business combination<br />
are measured initially at their fair values at the acquisition date.<br />
On an acquisition-by-acquisition basis, the Group recognises any non-controlling interest in the acquiree either<br />
at fair value or at the non-controlling interest’s proportionate share of the acquiree’s net assets.<br />
The excess of the consideration transferred, the amount of any non-controlling interest in the acquiree and the<br />
acquisition-date fair value of any previous equity interest in the acquiree over the fair value of all identifi able net<br />
assets acquired is recorded as goodwill. If this is less than the fair value of the net assets of the subsidiary acquired<br />
in the case of a bargain purchase, the difference is recognised directly in profi t or loss.<br />
Intercompany transactions, balances and unrealised gains on transactions between Group companies are<br />
eliminated. Unrealised losses are also eliminated but considered an impairment indicator of the assets transferred.<br />
The Company and all of its subsidiaries use uniform accounting policies consistent with the Group’s policies.<br />
2.4 NON-CONTROLLING INTEREST<br />
Non-controlling interest is that part of the net results and net assets of a subsidiary, including fair value<br />
adjustments, which is attributable to interests which are not owned, directly or indirectly, by the Group. Noncontrolling<br />
interest forms a separate component of the Group’s equity.<br />
International Financial <strong>Report</strong>ing Standards<br />
Consolidated Financial Statements and Auditor’s <strong>Report</strong> for the Year Ended 31 December <strong>2010</strong><br />
International Financial <strong>Report</strong>ing Standards<br />
Consolidated Table of Contents<br />
Financial Statements and Auditor’s <strong>Report</strong> for the Year Ended 31 December <strong>2010</strong><br />
53
URALKALI GROUP<br />
NOTES TO THE CONSOLIDATED FINANCIAL STATEMENTS FOR THE YEAR ENDED 31 DECEMBER <strong>2010</strong><br />
2. BASIS OF PREPARATION AND SIGNIFICANT ACCOUNTING POLICIES (CONTINUED)<br />
2.4 NON-CONTROLLING INTEREST (CONTINUED)<br />
Any difference between the purchase consideration and the carrying amount of non-controlling interest<br />
acquired is recorded as an equity transaction directly in equity. The Group recognises the difference between sales<br />
consideration and carrying amount of non-controlling interest sold as a capital transaction in the consolidated<br />
statement of changes in equity.<br />
2.5 JOINT VENTURES<br />
JOINTLY CONTROLLED ENTITIES<br />
A joint venture is a contractual arrangement whereby two or more parties undertake an economic activity which<br />
is subject to joint control. Investments in joint ventures are accounted for using the equity method of accounting.<br />
Unrealised gains on transactions between the Group and its joint ventures are eliminated to the extent of the<br />
Group’s interest in the joint ventures; unrealised losses are also eliminated unless the transaction provides<br />
evidence of an impairment of the asset transferred.<br />
2.6 INVESTMENTS IN ASSOCIATES<br />
Associates are entities over which the Group has signifi cant infl uence, but not control, generally accompanying<br />
a shareholding of between 20 and 50 percent of the voting rights. Investments in associates are accounted<br />
for using the equity method of accounting and are initially recognised at cost. The carrying amount of associates<br />
includes goodwill identifi ed on acquisition less accumulated impairment losses, if any. The Group’s share of the<br />
post-acquisition profi ts or losses of associates is recorded in the consolidated statement of income, and its share of<br />
post-acquisition movements in reserves is recognised in reserves. When the Group’s share of losses in an associate<br />
equals or exceeds its interest in the associate, including any other unsecured receivables, the Group does not<br />
recognise further losses, unless it has incurred obligations or made payments on behalf of the associate.<br />
Unrealised gains on transactions between the Group and its associates are eliminated to the extent of the<br />
Group’s interest in the associates; unrealised losses are also eliminated unless the transaction provides evidence of<br />
an impairment of the asset transferred.<br />
2.7 PROPERTY, PLANT AND EQUIPMENT<br />
Property, plant and equipment acquired or constructed prior to 1 January 1997 is recorded at the amounts determined<br />
by an independent valuation as of 1 January 1997 less accumulated depreciation and impairment. Property, plant<br />
and equipment acquired or constructed subsequent to 1 January 1997 is recorded at cost less accumulated<br />
depreciation. Cost includes all costs directly attributable to bringing the asset to its working condition for its<br />
intended use.<br />
The amounts determined by the independent valuation represent gross replacement cost less accumulated<br />
depreciation to arrive at an estimate of depreciated replacement cost. This independent valuation was performed<br />
in order to determine a basis for cost because the historical accounting records for property, plant and equipment<br />
required for IFRS consolidated fi nancial statements preparation were not available. Therefore, this independent<br />
valuation is not a recurring feature, since it was intended to determine the historical costs. The changes in carrying<br />
value arising from this valuation were recorded directly to retained earnings.<br />
At each reporting date management assesses whether there is any indication of impairment of property, plant<br />
and equipment. If any such indication exists, the management estimates the recoverable amount, which is<br />
determined as the higher of an asset’s fair value less costs to sell and its value in use. The carrying amount is reduced to<br />
the recoverable amount and the impairment loss is recognised in profi t or loss.<br />
54 <strong>Uralkali</strong> | <strong>Annual</strong> <strong>Report</strong> <strong>2010</strong><br />
Table of Contents
URALKALI GROUP<br />
NOTES TO THE CONSOLIDATED FINANCIAL STATEMENTS FOR THE YEAR ENDED 31 DECEMBER <strong>2010</strong><br />
2. BASIS OF PREPARATION AND SIGNIFICANT ACCOUNTING POLICIES (CONTINUED)<br />
2.7 PROPERTY, PLANT AND EQUIPMENT (CONTINUED)<br />
An impairment loss recognised for an asset in prior years is reversed if there has been a change in the estimates<br />
used to determine the asset’s value in use and fair value less costs to sell.<br />
Repair and maintenance expenditures are expensed as incurred. Major renewals and improvements are<br />
capitalised. Gains and losses on disposals determined by comparing proceeds with the carrying amount are<br />
recognised in profi t or loss.<br />
Depreciation on property, plant and equipment items is calculated using the straight-line method to allocate<br />
their cost to their residual values over their estimated useful lives:<br />
Useful lives in years<br />
Buildings 10 to 50<br />
Mine development costs 10 to 30<br />
Plant and equipment 2 to 30<br />
Transport 5 to 15<br />
Others 2 to 15<br />
Land Not depreciated<br />
The residual value of an asset is the estimated amount that the Group would currently obtain from disposal of the<br />
asset less the estimated costs of disposal, if the asset were already of the age and in the condition expected at the end of<br />
its useful life. The residual value of an asset is nil if the Group expects to use the asset until the end of its physical<br />
life. Assets’ residual values and useful lives are reviewed, and adjusted if appropriate, at each reporting date.<br />
2.8 OPERATING LEASES<br />
Leases where a signifi cant portion of the risks and rewards of ownership are retained by the lessor are classifi ed<br />
as operating leases. Payments made under operating leases (net of any incentives received from the lessor) are<br />
charged to profi t or loss.<br />
2.9 FINANCE LEASE LIABILITIES<br />
Where the Group is a lessee in a lease which transfers substantially all the risks and rewards incidental to ownership<br />
to the Group, the assets leased are capitalised in property, plant and equipment at the commencement of the lease<br />
at the lower of the fair value of the leased asset and the present value of the minimum lease payments. Each lease<br />
payment is allocated between the liability and fi nance charges so as to achieve a constant rate on the fi nance<br />
balance outstanding. The corresponding rental obligations, net of future fi nance charges, are included in<br />
borrowings. The interest cost is charged to profi t or loss over the lease period using the effective interest method.<br />
The assets acquired under fi nance leases are depreciated over their useful life or the shorter lease term if the<br />
Group is not reasonably certain that it will obtain ownership by the end of the lease term.<br />
2.10 GOODWILL<br />
Goodwill is measured by deducting the net assets of the acquiree from the aggregate of the consideration<br />
transferred for the acquiree, the amount of non-controlling interest in the acquiree and fair value of an interest<br />
in the acquiree held immediately before the acquisition date. Any negative amount (“negative goodwill”) is<br />
recognised in profi t or loss, after management reassesses whether it identifi ed all the assets acquired and all<br />
liabilities and contingent liabilities assumed and reviews appropriateness of their measurement.<br />
International Financial <strong>Report</strong>ing Standards<br />
Consolidated Financial Statements and Auditor’s <strong>Report</strong> for the Year Ended 31 December <strong>2010</strong><br />
International Financial <strong>Report</strong>ing Standards<br />
Consolidated Table of Contents<br />
Financial Statements and Auditor’s <strong>Report</strong> for the Year Ended 31 December <strong>2010</strong><br />
55
URALKALI GROUP<br />
NOTES TO THE CONSOLIDATED FINANCIAL STATEMENTS FOR THE YEAR ENDED 31 DECEMBER <strong>2010</strong><br />
2. BASIS OF PREPARATION AND SIGNIFICANT ACCOUNTING POLICIES (CONTINUED)<br />
2.10 GOODWILL (CONTINUED)<br />
The consideration transferred for the acquiree is measured at the fair value of the assets given up, equity<br />
instruments issued and liabilities incurred or assumed, including fair value of assets or liabilities from contingent<br />
consideration arrangements but excludes acquisition related costs such as advisory, legal, valuation and similar<br />
professional services. Transaction costs incurred for issuing equity instruments are deducted from equity;<br />
transaction costs incurred for issuing debt are deducted from its carrying amount and all other transaction<br />
costs associated with the acquisition are expensed.<br />
Goodwill is carried at cost less accumulated impairment losses, if any. The Group tests goodwill for impairment<br />
at least annually and whenever there are indications that goodwill may be impaired. Goodwill is allocated to<br />
the cash-generating units, or groups of cash-generating units, that are expected to benefi t from the synergies of<br />
the business combination. Such units or groups of units represent the lowest level at which the Group monitors<br />
goodwill and are not larger than an operating segment.<br />
Gains or losses on disposal of an operation within a cash generating unit to which goodwill has been allocated<br />
include the carrying amount of goodwill associated with the operation disposed of, generally measured on the basis<br />
of the relative values of the operation disposed of and the portion of the cash-generating unit which is retained.<br />
2.11 OTHER INTANGIBLE ASSETS<br />
Expenditure on software, patents, trademarks, and mineral and non-mineral licenses are capitalised and<br />
amortised using the straight-line method over their useful lives.<br />
If impaired, the carrying amount of intangible assets is written down to the higher of value in use and fair<br />
value less cost to sell.<br />
2.12 CLASSIFICATION OF FINANCIAL ASSETS<br />
The Group classifi es its fi nancial assets into the following measurement categories: trading investments,<br />
available-for- sale, held to maturity and loans and receivables.<br />
Trading investments are securities or other fi nancial assets which are either acquired to generate a profi t from<br />
short-term fl uctuations in price or trader’s margin, or are included in a portfolio in which a pattern of short-term<br />
trading exists.<br />
The Group classifi es fi nancial assets into trading investments if it has the intention to sell them within a short<br />
period of time after the acquisition. Trading investments are not reclassifi ed out of this category even if the<br />
Group’s intentions subsequently change.<br />
Loans and receivables are unquoted non-derivative fi nancial assets with fi xed or determinable payments other<br />
than those that the Group intends to sell in the near term.<br />
The held to maturity classifi cation includes quoted non-derivative fi nancial assets with fi xed or determinable payments<br />
and fi xed maturities that the Group has both the intention and ability to hold to maturity. Management determines<br />
the classification of investment securities held to maturity at their initial recognition and reassesses the<br />
appropriateness of that classifi cation at each reporting date.<br />
All other fi nancial assets are included in the available-for-sale category.<br />
2.13 INITIAL RECOGNITION OF FINANCIAL INSTRUMENTS<br />
Trading investments and derivatives are initially recorded at fair value. All other fi nancial assets and liabilities<br />
are initially recorded at fair value plus transaction costs. Fair value at initial recognition is best evidenced by the<br />
transaction price. A gain or loss on initial recognition is only recorded if there is a difference between the fair<br />
value and the transaction price which can be evidenced by other observable current market transactions in the<br />
same instrument or by a valuation technique whose inputs include only data from observable markets.<br />
56 <strong>Uralkali</strong> | <strong>Annual</strong> <strong>Report</strong> <strong>2010</strong><br />
Table of Contents
URALKALI GROUP<br />
NOTES TO THE CONSOLIDATED FINANCIAL STATEMENTS FOR THE YEAR ENDED 31 DECEMBER <strong>2010</strong><br />
2. BASIS OF PREPARATION AND SIGNIFICANT ACCOUNTING POLICIES (CONTINUED)<br />
2.13 INITIAL RECOGNITION OF FINANCIAL INSTRUMENTS (CONTINUED)<br />
Changes in fair value are recognised in profi t or loss for trading investments and in equity for assets classifi ed<br />
as available for sale.<br />
All regular way purchases and sales of fi nancial instruments are recognised on the trade date, which is the date<br />
that the Group commits to purchase or sell the fi nancial instrument.<br />
2.14 DERECOGNITION OF FINANCIAL ASSETS<br />
The Group derecognises fi nancial assets when (i) the assets are redeemed or the rights to cash fl ows from the assets<br />
have otherwise expired or (ii) the Group has transferred substantially all the risks and rewards of ownership of the<br />
assets or (iii) the Group has neither transferred nor retained substantially all risks and rewards of ownership but has not<br />
retained control. Control is retained if the counterparty does not have the practical ability to sell the asset in its entirety<br />
to an unrelated third party without needing to impose additional restrictions on the sale.<br />
2.15 AVAILABLE-FOR-SALE INVESTMENTS<br />
Available-for-sale investments are carried at fair value. Interest income on available-for-sale debt securities is<br />
calculated using the effective interest method and recognised in profi t or loss. Dividends on available-for-sale<br />
equity instruments are recognised in profi t or loss when the Group’s right to receive payment is established and<br />
it is probable that the dividends will be collected. All other elements of changes in the fair value are deferred in<br />
other comprehensive income until the investment is derecognised or impaired at which time the cumulative gain<br />
or loss is removed from other comprehensive income to profi t or loss.<br />
Impairment losses are recognised in profi t or loss when incurred as a result of one or more events (“loss events”) that<br />
occurred after the initial recognition of available-for-sale investments. A signifi cant or prolonged decline in the fair<br />
value of an equity security below its cost is an indicator that it is impaired. The cumulative impairment loss – measured as<br />
the difference between the acquisition cost and the current fair value, less any impairment loss on that asset<br />
previously recognised in profi t or loss – is removed from other comprehensive income and recognised in profi t or<br />
loss. Impairment losses on equity instruments are not reversed through profi t or loss. If, in a subsequent period,<br />
the fair value of a debt instrument classifi ed as available for sale increases and the increase can be objectively<br />
related to an event occurring after the impairment loss was recognised in profi t or loss, the impairment loss is<br />
reversed through current period’s profi t or loss.<br />
2.16 INCOME TAXES<br />
Income taxes have been provided for in the consolidated fi nancial statements in accordance with legislation<br />
enacted or substantively enacted by the reporting date in the Russian Federation for entities incorporated in the<br />
Russian Federation, in Switzerland for <strong>Uralkali</strong> Trading SA, in Gibraltar for <strong>Uralkali</strong> Trading (Gibraltar) Ltd,<br />
in the USA for UKT Chicago and in Belarussia for Belarusian Potash Company. The income tax charge comprises<br />
current tax and deferred tax and is recognised in profi t or loss for the year except if it is recognised in other<br />
comprehensive income or directly in equity because it relates to transactions that are also recognised, in the same<br />
or a different period, in other comprehensive income or directly in equity.<br />
The Group’s uncertain tax positions are assessed by management at every reporting date. Liabilities are recorded<br />
for income tax positions that are determined by management as less likely than not to be sustained if challenged<br />
by tax authorities, based on the interpretation of tax laws that have been enacted or substantively enacted by<br />
the reporting date. Liabilities for penalties, interest and taxes other than on income are recognised based on<br />
management’s best estimate of the expenditure required to settle the obligations at the reporting date.<br />
Current tax is the amount expected to be paid to or recovered from the taxation authorities in respect of taxable profi ts<br />
or losses for the current and prior periods. Taxes other than on income are recorded within operating expenses.<br />
International Financial <strong>Report</strong>ing Standards<br />
Consolidated Financial Statements and Auditor’s <strong>Report</strong> for the Year Ended 31 December <strong>2010</strong><br />
International Financial <strong>Report</strong>ing Standards<br />
Consolidated Table of Contents<br />
Financial Statements and Auditor’s <strong>Report</strong> for the Year Ended 31 December <strong>2010</strong><br />
57
URALKALI GROUP<br />
NOTES TO THE CONSOLIDATED FINANCIAL STATEMENTS FOR THE YEAR ENDED 31 DECEMBER <strong>2010</strong><br />
2. BASIS OF PREPARATION AND SIGNIFICANT ACCOUNTING POLICIES (CONTINUED)<br />
2.16 INCOME TAXES (CONTINUED)<br />
Deferred income tax is provided using the balance sheet liability method for tax loss carry forwards and<br />
temporary differences arising between the tax bases of assets and liabilities and their carrying amounts for<br />
fi nancial reporting purposes. In accordance with the initial recognition exemption, deferred taxes are not<br />
recorded for temporary differences arising on initial recognition of an asset or a liability in a transaction other<br />
than a business combination if the transaction, when initially recorded, affects neither accounting nor taxable<br />
profi t. Deferred tax liabilities are not recorded for temporary differences on initial recognition or subsequently<br />
for goodwill which is not deductible for tax purposes.<br />
Deferred tax balances are measured at tax rates enacted or substantively enacted at the reporting date which<br />
are expected to apply to the period when the temporary differences will reverse or the tax loss carry forwards<br />
will be utilised.<br />
Deferred tax assets and liabilities are netted only within the individual companies of the Group. Deferred tax<br />
assets for deductible temporary differences and tax loss carry forwards are recorded only to the extent that it is<br />
probable that future taxable profi t will be available against which the deductions can be utilised.<br />
Deferred income tax is provided on post-acquisition retained earnings of subsidiaries, except where the Group<br />
controls the subsidiary’s dividend policy and it is probable that the difference will not reverse through dividends<br />
or otherwise in the foreseeable future.<br />
2.17 INVENTORIES<br />
Inventories are recorded at the lower of cost and net realisable value. The cost of inventory is determined on the<br />
weighted average basis. The cost of fi nished products and work in progress comprises raw material, direct labour,<br />
other direct costs and related production overhead (based on normal operating capacity) but excludes borrowing<br />
costs. The cost of fi nished goods includes transport expenses that the Company incurs in distributing goods from<br />
its factory to sea ports, vessels and overseas warehouses as these are costs incurred in bringing the inventory to<br />
its present location. Net realisable value is the estimated selling price in the ordinary course of business, less the<br />
cost of completion and selling expenses.<br />
2.18 TRADE AND OTHER RECEIVABLES<br />
Trade and other receivables are carried at amortised cost using the effective interest method. A provision for<br />
impairment of trade receivables is established when there is objective evidence that the Group will not be able<br />
to collect all amounts due according to the original terms of receivables. The amount of the provision is the<br />
difference between the asset’s carrying amount and the present value of estimated future cash fl ows discounted<br />
at the original effective interest rate. The amount of the provision is recognised in profi t or loss.<br />
2.19 CASH AND CASH EQUIVALENTS<br />
Cash and cash equivalents include cash in hand, deposits held at call with banks, and other short-term highly<br />
liquid investments with original maturities of three months or less and deposits with original maturity of more<br />
than three months held for the purpose of meeting short-term cash needs that are convertible into known amounts<br />
of cash and subject to insignifi cant risk of changes in value. Cash and cash equivalents are carried at amortised<br />
cost using the effective interest method. Restricted balances are excluded from cash and cash equivalents for<br />
the purposes of the consolidated statement of cash fl ows. Restricted balances being exchanged or used to settle<br />
liability at least twelve months after the reporting date are shown separately from cash and cash equivalents for<br />
the purposes of the consolidated statement of fi nancial position and are included in non-current assets.<br />
Bank overdrafts which are repayable on demand are included as a component of cash and cash equivalents.<br />
58 <strong>Uralkali</strong> | <strong>Annual</strong> <strong>Report</strong> <strong>2010</strong><br />
Table of Contents
URALKALI GROUP<br />
NOTES TO THE CONSOLIDATED FINANCIAL STATEMENTS FOR THE YEAR ENDED 31 DECEMBER <strong>2010</strong><br />
2. BASIS OF PREPARATION AND SIGNIFICANT ACCOUNTING POLICIES (CONTINUED)<br />
2.20 SHARE CAPITAL<br />
Ordinary shares are classifi ed as equity. Incremental costs directly attributable to the issue of new shares, other<br />
than on a business combination, are shown in equity as a deduction, net of tax, from the proceeds. Any excess of<br />
the fair value of consideration received over the par value of shares issued is presented as share premium.<br />
2.21 TREASURY SHARES<br />
Where any Group company purchases the Company’s equity share capital, the consideration paid, including any<br />
directly attributable incremental costs (net of income taxes) is deducted from equity attributable to the Company’s<br />
equity holders until the shares are cancelled, reissued or disposed of. Where such shares are subsequently sold<br />
or reissued, any consideration received, net of any directly attributable incremental transaction costs and the<br />
related income tax effects, is included in equity attributable to the Company’s equity holders.<br />
2.22 DIVIDENDS<br />
Dividends are recognised as a liability and deducted from equity at the reporting date only if they are declared<br />
before or on the reporting date. Dividends are disclosed when they are proposed before the reporting date<br />
or proposed or declared after the reporting date but before the consolidated fi nancial statements have been<br />
authorised for issue.<br />
2.23 VALUE ADDED TAX<br />
Output value added tax is payable to the tax authorities on the earlier of (a) collection of the receivables from<br />
customers or (b) delivery of the goods or services to customers. Input VAT is generally recoverable against output<br />
VAT upon receipt of the VAT invoice. The tax authorities permit the settlement of VAT on a net basis. VAT related<br />
to sales and purchases is recognised in the consolidated statement of fi nancial position on a gross basis and<br />
disclosed separately as an asset and liability. Where a provision has been made for impairment of receivables, the<br />
impairment loss is recorded for the gross amount of the debt, including VAT.<br />
2.24 BORROWINGS<br />
Borrowings are initially recognised at fair value less transactions costs. Borrowings are carried at amortised<br />
cost using the effective interest method. Borrowing costs are recognised as an expense on a time-proportion basis<br />
using the effective interest method. The Group capitalises borrowing costs relating to assets that take a substantial<br />
period of time to prepare for use or sale (qualifying assets) as part of the cost of the asset. The Group considers a<br />
qualifying asset to be an investment project with an execution period exceeding one year.<br />
Borrowings are classifi ed as current liabilities unless the Group has an unconditional right to defer settlement<br />
of the liability for at least 12 months after the reporting date.<br />
International Financial <strong>Report</strong>ing Standards<br />
Consolidated Financial Statements and Auditor’s <strong>Report</strong> for the Year Ended 31 December <strong>2010</strong><br />
International Financial <strong>Report</strong>ing Standards<br />
Consolidated Table of Contents<br />
Financial Statements and Auditor’s <strong>Report</strong> for the Year Ended 31 December <strong>2010</strong><br />
59
URALKALI GROUP<br />
NOTES TO THE CONSOLIDATED FINANCIAL STATEMENTS FOR THE YEAR ENDED 31 DECEMBER <strong>2010</strong><br />
2. BASIS OF PREPARATION AND SIGNIFICANT ACCOUNTING POLICIES (CONTINUED)<br />
2.25 PROVISIONS<br />
Provisions are recognised when the Group has a present legal or constructive obligation as a result of past<br />
events, it is probable that an outfl ow of resources will be required to settle the obligation, and a reliable estimate<br />
of the amount can be made. Where the Group expects a provision to be reimbursed, the reimbursement is<br />
recognised as a separate asset only when the reimbursement is virtually certain.<br />
The Group made no provision for warranties based on past experience of no warranty claims.<br />
2.26 TRADE AND OTHER PAYABLES<br />
Trade payables are accrued when the counterparty has performed its obligations under contract and are carried<br />
at amortised cost using the effective interest method.<br />
2.27 FOREIGN CURRENCY TRANSACTIONS<br />
Functional and presentation currency. Items included in the fi nancial statements of each of the Group’s entities are<br />
measured using the currency of the primary economic environment in which the entity operates (the “functional<br />
currency”). The Company’s functional currency and the Group’s presentation currency is the national currency<br />
of the Russian Federation, Russian Roubles (“RR”).<br />
Transactions and balances. Foreign currency transactions are translated into the functional currency using the<br />
exchange rates prevailing at the dates of the transactions. Foreign exchange gains and losses resulting from the<br />
settlement of such transactions and from the translation at year-end offi cial exchange rates of monetary assets<br />
and liabilities denominated in foreign currencies are recognised in profi t or loss. Translation at year-end rates<br />
does not apply to non-monetary items, including equity investments.<br />
Group companies. The results and fi nancial positions of all Group entities (none of which has the currency of<br />
a hyperinfl ationary economy) that have a functional currency different from the presentation currency are<br />
translated to the presentation currency as follows:<br />
(i) assets and liabilities for each statement of fi nancial position presented are translated at the closing rate at<br />
the end of the reporting period;<br />
(ii) income and expenses for each statement of income are translated at average exchange rates (unless this<br />
average is not a reasonable approximation of the cumulative effect of the rates prevailing on the transaction dates,<br />
in which case income and expenses are translated at the dates of the transactions); and<br />
(iii) all resulting exchange differences are recognised in other comprehensive income.<br />
At 31 December <strong>2010</strong>, the offi cial rate of exchange, as determined by the Central Bank of the Russian Federation<br />
(CBRF), was US$ 1 = Rouble 30.48 (31 December 2009: US$ 1 = Rouble 30.24). The offi cial Euro to RR exchange<br />
rate at 31 December <strong>2010</strong>, as determined by the CBRF, was Euro 1 = Rouble 40.33 (31 December 2009: Euro 1 =<br />
Rouble 43.39).<br />
2.28 REVENUE RECOGNITION<br />
Revenues are recognised on the date of risks transfer under the appropriate INCOTERMS specifi ed in the sales<br />
contracts, as this is the date when the risks and rewards of ownership are transferred to the customers. For “Free On<br />
Board” (FOB) transactions, the title to goods transfers as soon as the goods are loaded on the ship. For “Delivery<br />
At Frontier” (DAF) transactions, the title to goods transfers only when goods cross the Russian border. For “Free<br />
Carrier” (FCA) terms, the title transfers when goods are loaded on the fi rst carrier (railway carriages). For “Cost<br />
and Freight” (CFR) terms, the title transfers when goods pass the rail of the ship in the port of shipment.<br />
60 <strong>Uralkali</strong> | <strong>Annual</strong> <strong>Report</strong> <strong>2010</strong><br />
Table of Contents
URALKALI GROUP<br />
NOTES TO THE CONSOLIDATED FINANCIAL STATEMENTS FOR THE YEAR ENDED 31 DECEMBER <strong>2010</strong><br />
2. BASIS OF PREPARATION AND SIGNIFICANT ACCOUNTING POLICIES (CONTINUED)<br />
2.28 REVENUE RECOGNITION (CONTINUED)<br />
Sales of services are recognised in the accounting period in which the services are rendered.<br />
Sales are shown net of VAT, export duties and discounts, and after eliminating sales within the Group. Revenues<br />
are measured at the fair value of the consideration received or receivable.<br />
2.29 TRANSHIPMENT COSTS<br />
Transhipment costs incurred by OJSC Baltic Bulker Terminal (“BBT”), a 100% subsidiary whose activity is<br />
related to transhipment of fertilisers produced by the Group, are presented within distribution costs. These costs<br />
include depreciation, payroll, material expenses and various general and administrative expenses.<br />
2.30 EMPLOYEE BENEFITS<br />
Wages, salaries, contributions to the Russian Federation state pension and social insurance funds, paid annual leave<br />
and sick leave, bonuses, and non-monetary benefi ts (such as health services and kindergarten services) are accrued<br />
in the year in which the associated services are rendered by the employees of the Group.<br />
2.31 SOCIAL COSTS<br />
The Group incurs personnel costs related to the provision of benefi ts such as health services and charity costs<br />
related to various social programmes. These amounts have been charged to other operating expenses.<br />
2.32 PENSION COSTS<br />
In the normal course of business the Group contributes to the Russian Federation state pension scheme on behalf of<br />
its employees. Mandatory contributions to the governmental pension scheme are expensed as incurred.<br />
For defi ned benefi t pension plans, the cost of providing benefi ts is determined using the Projected Unit Credit<br />
Method and is charged to profi t or loss so as to spread the cost over the service period of the employees. An interest<br />
cost representing the unwinding of the discount rate on the scheme liabilities is charged to profi t or loss. The<br />
liability recognised in the consolidated statement of fi nancial position, in respect of defi ned benefi t pension plans<br />
is the present value of the defi ned benefi t obligation at the reporting date. The plans are not externally funded.<br />
The defi ned benefi t obligation is calculated annually by the Group. The present value of the defi ned benefi t<br />
obligation is determined by discounting the estimated future cash outfl ows using interest rates of government<br />
bonds that are denominated in the currency in which the benefi ts will be paid and that have terms of maturity<br />
approximating the terms of the relevant pension liability.<br />
All actuarial gains and losses which arise in calculating the present value of the defi ned benefi t obligation are<br />
recognised immediately in profi t or loss.<br />
2.33 EARNINGS PER SHARE<br />
Earnings per share are determined by dividing the net income attributable to equity holders of the Company<br />
by the weighted average number of participating shares outstanding during the reporting year.<br />
International Financial <strong>Report</strong>ing Standards<br />
Consolidated Financial Statements and Auditor’s <strong>Report</strong> for the Year Ended 31 December <strong>2010</strong><br />
International Financial <strong>Report</strong>ing Standards<br />
Consolidated Table of Contents<br />
Financial Statements and Auditor’s <strong>Report</strong> for the Year Ended 31 December <strong>2010</strong><br />
61
URALKALI GROUP<br />
NOTES TO THE CONSOLIDATED FINANCIAL STATEMENTS FOR THE YEAR ENDED 31 DECEMBER <strong>2010</strong><br />
2. BASIS OF PREPARATION AND SIGNIFICANT ACCOUNTING POLICIES (CONTINUED)<br />
2.34 SEGMENT REPORTING<br />
The Group identifi es the segment in accordance with the criteria set forth in IFRS 8 “Operating segments”, and<br />
based on the way the operations of the Company are regularly reviewed by the chief operating decision maker<br />
to analyse performance and allocate resources. The chief operating decision-maker has been determined as the<br />
Board of Directors. It was determined, that the Group has one operating segment – the extraction, production<br />
and sales of potash fertilisers.<br />
2.35 RESEARCH AND DEVELOPMENT COSTS<br />
Research expenditures are recognised as an expense as incurred. Costs incurred on development projects<br />
(relating to the design and testing of new or improved products) are recognised as intangible assets when it is<br />
probable that the project will be a success considering its commercial and technological feasibility and if costs can<br />
be measured reliably. Other development expenditures are recognised as an expense as incurred. Development<br />
costs previously recognised as an expense are not recognised as an asset in a subsequent period. Development<br />
costs with a fi nite useful life that have been capitalised are amortised from the commencement of the commercial<br />
production of the product on a straight-line basis over the period of its expected benefi t.<br />
3. ADOPTION OF NEW OR REVISED STANDARDS AND<br />
INTERPRETATIONS<br />
Certain new standards and interpretations became effective for the Group from 1 January <strong>2010</strong>:<br />
IFRIC 17, Distributions of Non-Cash Assets to Owners (effective for annual periods beginning on or after 1 July 2009).<br />
The interpretation clarifi es when and how distribution of non-cash assets as dividends to the owners should be<br />
recognised. An entity should measure a liability to distribute non-cash assets as a dividend to its owners at the<br />
fair value of the assets to be distributed. A gain or loss on disposal of the distributed non-cash assets should be<br />
recognised in profi t or loss when the entity settles the dividend payable. IFRIC 17 did not have an impact on the<br />
Group’s consolidated fi nancial statements.<br />
IFRIC 18, Transfers of Assets from Customers (effective for annual periods beginning on or after 1 July 2009). The<br />
interpretation clarifi es the accounting for transfers of assets from customers, namely, the circumstances in which<br />
the defi nition of an asset is met; the recognition of the asset and the measurement of its cost on initial recognition;<br />
the identifi cation of the separately identifi able services (one or more services in exchange for the transferred<br />
asset); the recognition of revenue, and the accounting for transfers of cash from customers. IFRIC 18 did not have<br />
an impact on the Group’s consolidated fi nancial statements.<br />
IFRS 1, First-time Adoption of International Financial <strong>Report</strong>ing Standards (following an amendment in December<br />
2008, effective for the fi rst IFRS fi nancial statements for a period beginning on or after 1 July 2009). The revised IFRS<br />
1 retains the substance of its previous version but within a changed structure in order to make it easier for the<br />
reader to understand and to better accommodate future changes. The revised standard did not have any impact<br />
on the Group’s consolidated fi nancial statements.<br />
Additional Exemptions for First-time Adopters – Amendments to IFRS 1, First-time Adoption of IFRS (effective for annual<br />
periods beginning on or after 1 January <strong>2010</strong>). The amendments exempt entities using the full cost method from<br />
retrospective application of IFRSs for oil and gas assets and also exempt entities with existing leasing contracts<br />
from reassessing the classifi cation of those contracts in accordance with IFRIC 4, ‘Determining Whether an<br />
Arrangement Contains a Lease’ when the application of their national accounting requirements produced the<br />
same result. The amendments do not have any impact on the Group’s consolidated fi nancial statements.<br />
62 <strong>Uralkali</strong> | <strong>Annual</strong> <strong>Report</strong> <strong>2010</strong><br />
Table of Contents
URALKALI GROUP<br />
NOTES TO THE CONSOLIDATED FINANCIAL STATEMENTS FOR THE YEAR ENDED 31 DECEMBER <strong>2010</strong><br />
3. ADOPTION OF NEW OR REVISED STANDARDS AND INTERPRETATIONS (CONTINUED)<br />
Group Cash-settled Share-based Payment Transactions – Amendments to IFRS 2, Share-based Payment (effective for<br />
annual periods beginning on or after 1 January <strong>2010</strong>). The amendments provide a clear basis to determine the<br />
classifi cation of share-based payment awards in both consolidated and separate fi nancial statements. The<br />
amendments incorporate into the standard the guidance in IFRIC 8 and IFRIC 11, which are withdrawn. The<br />
amendments expand on the guidance given in IFRIC 11 to address plans that were previously not considered<br />
in the interpretation. The amendments also clarify the defi ned terms in the Appendix to the standard. These<br />
amendments are not relevant to the Group.<br />
IFRS 3, Business Combinations (revised January 2008; effective for business combinations for which the acquisition<br />
date is on or after the beginning of the fi rst annual reporting period beginning on or after 1 July 2009). The revised IFRS<br />
3 allows entities to choose to measure non-controlling interests using the previous IFRS 3 method (proportionate<br />
share of the acquiree’s identifi able net assets) or at fair value. The revised IFRS 3 is more detailed in providing<br />
guidance on the application of the purchase method to business combinations. The requirement to measure at<br />
fair value every asset and liability at each step in a step acquisition for the purposes of calculating a portion of<br />
goodwill has been removed. Instead, in a business combination achieved in stages, the acquirer has to remeasure<br />
its previously held equity interest in the acquiree at its acquisition-date fair value and recognise the resulting<br />
gain or loss, if any, in profi t or loss for the year. Acquisition-related costs are accounted for separately from the<br />
business combination and therefore recognised as expenses rather than included in goodwill. An acquirer has<br />
to recognise a liability for any contingent purchase consideration at the acquisition date. Changes in the value of<br />
that liability after the acquisition date are recognised in accordance with other applicable IFRSs, as appropriate,<br />
rather than by adjusting goodwill. The revised IFRS 3 brings into its scope business combinations involving only<br />
mutual entities and business combinations achieved by contract alone. The revised IFRS 3 did not have a material<br />
impact on the Group’s consolidated fi nancial statements.<br />
IAS 27, Consolidated and Separate Financial Statements (revised January 2008; effective for annual periods beginning<br />
on or after 1 July 2009). The revised IAS 27 requires an entity to attribute total comprehensive income to the owners<br />
of the parent and to the non-controlling interests (previously “minority interest”) even if this results in the noncontrolling<br />
interests having a defi cit balance (the previous standard required the excess losses to be allocated<br />
to the owners of the parent in most cases). The revised standard specifi es that changes in a parent’s ownership<br />
interest in a subsidiary that do not result in the loss of control must be accounted for as equity transactions. It also<br />
specifi es how an entity should measure any gain or loss arising on the loss of control of a subsidiary. At the date<br />
when control is lost, any investment retained in the former subsidiary has to be measured at its fair value. The<br />
amendment did not have a material impact on the Group’s consolidated fi nancial statements.<br />
The Group has changed its accounting policy for transactions with non-controlling interests and the accounting<br />
for loss of control or signifi cant infl uence from 1 January <strong>2010</strong>. Previously transactions with non-controlling interests<br />
were treated as transactions with parties external to the Group. Disposals therefore resulted in gains or losses in<br />
profi t or loss and purchases resulted in the recognition of goodwill. On disposal or partial disposal, a proportionate<br />
interest in reserves attributable to the subsidiary was reclassifi ed to profi t or loss or directly to retained earnings.<br />
Previously, when the Group ceased to have control or signifi cant infl uence over an entity, the carrying amount<br />
of the investment at the date control or signifi cant infl uence became its cost for the purposes of subsequently<br />
accounting for the retained interests as associates, jointly controlled entity or fi nancial assets. The Group has<br />
applied the new accounting policies prospectively to transactions occurring on or after 1 January <strong>2010</strong>. As a<br />
consequence, no adjustments were necessary to any of the amounts previously recognised in the consolidated<br />
fi nancial statements.<br />
Eligible Hedged Items – Amendment to IAS 39, Financial Instruments: Recognition and Measurement (effective with<br />
retrospective application for annual periods beginning on or after 1 July 2009). The amendment clarifi es how the<br />
principles that determine whether a hedged risk or portion of cash fl ows is eligible for designation should be<br />
applied in particular situations. The amendment did not have a material impact on the Group’s consolidated<br />
fi nancial statements.<br />
International Financial <strong>Report</strong>ing Standards<br />
Consolidated Financial Statements and Auditor’s <strong>Report</strong> for the Year Ended 31 December <strong>2010</strong><br />
International Financial <strong>Report</strong>ing Standards<br />
Consolidated Table of Contents<br />
Financial Statements and Auditor’s <strong>Report</strong> for the Year Ended 31 December <strong>2010</strong><br />
63
URALKALI GROUP<br />
NOTES TO THE CONSOLIDATED FINANCIAL STATEMENTS FOR THE YEAR ENDED 31 DECEMBER <strong>2010</strong><br />
3. ADOPTION OF NEW OR REVISED STANDARDS AND INTERPRETATIONS (CONTINUED)<br />
Improvements to International Financial <strong>Report</strong>ing Standards (issued in April 2009; amendments to IFRS 2, IAS 38,<br />
IFRIC 9 and IFRIC 16 are effective for annual periods beginning on or after 1 July 2009; amendments to IFRS 5, IFRS<br />
8, IAS 1, IAS 7, IAS 17, IAS 36 and IAS 39 are effective for annual periods beginning on or after 1 January <strong>2010</strong>). The<br />
improvements consist of a mixture of substantive changes and clarifi cations in the following standards and<br />
interpretations: clarifi cation that contributions of businesses in common control transactions and formation<br />
of joint ventures are not within the scope of IFRS 2; clarifi cation of disclosure requirements set by IFRS 5 and<br />
other standards for non-current assets (or disposal groups) classifi ed as held for sale or discontinued operations;<br />
requiring to report a measure of total assets and liabilities for each reportable segment under IFRS 8 only if such<br />
amounts are regularly provided to the chief operating decision maker; amending IAS 1 to allow classifi cation<br />
of certain liabilities settled by entity’s own equity instruments as non-current; changing IAS 7 such that only<br />
expenditures that result in a recognised asset are eligible for classifi cation as investing activities; allowing<br />
classifi cation of certain long-term land leases as fi nance leases under IAS 17 even without transfer of ownership<br />
of the land at the end of the lease; providing additional guidance in IAS 18 for determining whether an entity<br />
acts as a principal or an agent; clarifi cation in IAS 36 that a cash generating unit shall not be larger than an<br />
operating segment before aggregation; supplementing IAS 38 regarding measurement of fair value of intangible<br />
assets acquired in a business combination; amending IAS 39 (i) to include in its scope option contracts that could<br />
result in business combinations, (ii) to clarify the period of reclassifying gains or losses on cash fl ow hedging<br />
instruments from equity to profi t or loss for the year and (iii) to state that a prepayment option is closely related<br />
to the host contract if upon exercise the borrower reimburses economic loss of the lender; amending IFRIC 9 to<br />
state that embedded derivatives in contracts acquired in common control transactions and formation of joint<br />
ventures are not within its scope; and removing the restriction in IFRIC 16 that hedging instruments may not be<br />
held by the foreign operation that itself is being hedged. In addition, the amendments clarifying classifi cation as<br />
held for sale under IFRS 5 in case of a loss of control over a subsidiary published as part of the <strong>Annual</strong> Improvements<br />
to International Financial <strong>Report</strong>ing Standards, which were issued in May 2008, are effective for annual periods<br />
beginning on or after 1 July 2009. The amendments did not have a material impact on the Group’s consolidated<br />
fi nancial statements.<br />
Unless otherwise stated above, the amendments and interpretations did not have any signifi cant effect on the<br />
Group’s consolidated fi nancial statements.<br />
4. NEW ACCOUNTING PRONOUNCEMENTS<br />
The following new standards, amendments to standards and interpretations have been published that are<br />
mandatory for the Group’s accounting periods beginning on or after 1 January 2011 or later periods and which<br />
the Group has not early adopted:<br />
· IFRS 9 Financial Instruments Part 1: Classifi cation and Measurement (issued in November 2009, effective for annual<br />
periods beginning on or after 1 January 2013, with earlier application permitted). The Group is currently assessing the<br />
impact of the amended standard on its consolidated fi nancial statements.<br />
· Classifi cation of Rights Issues – Amendment to IAS 32, Financial Instruments: Presentation (issued in October 2009,<br />
effective for annual periods beginning on or after 1 February <strong>2010</strong>). The amendment exempts certain rights issues<br />
of shares with proceeds denominated in foreign currencies from classifi cation as fi nancial derivatives. The<br />
amendment is not currently applicable to the Group.<br />
· Amendment to IAS 24, ‘Related party disclosures’ (issued in November 2009, effective for annual periods beginning on<br />
or after 1 January 2011). IAS 24 was revised in 2009 by: (a) simplifying the defi nition of a related party, clarifying its<br />
intended meaning and eliminating inconsistencies; and by (b) providing a partial exemption from the disclosure<br />
requirements for government-related entities. The Group is currently assessing the impact of the amended<br />
standard on its consolidated fi nancial statements.<br />
64 <strong>Uralkali</strong> | <strong>Annual</strong> <strong>Report</strong> <strong>2010</strong><br />
Table of Contents
URALKALI GROUP<br />
NOTES TO THE CONSOLIDATED FINANCIAL STATEMENTS FOR THE YEAR ENDED 31 DECEMBER <strong>2010</strong><br />
4. NEW ACCOUNTING PRONOUNCEMENTS (CONTINUED)<br />
· IFRIC 19 Extinguishing Financial Liabilities with Equity Instruments (issued November 2009; effective for annual<br />
periods beginning on or after 1 July <strong>2010</strong>) clarifi es the requirements of IFRSs when an entity renegotiates the terms of<br />
a fi nancial liability with its creditor and the creditor agrees to accept the entity’s shares or other equity instruments<br />
to settle the fi nancial liability fully or partially. The Group does not expect the amendment to have any impact<br />
on its consolidated fi nancial statements.<br />
· Prepayments of a Minimum Funding Requirement – Amendment to IFRIC 14 (effective for annual periods beginning<br />
on or after 1 January 2011). The Group does not expect the amendment to have any impact on its consolidated<br />
fi nancial statements.<br />
· Improvements to International Financial <strong>Report</strong>ing Standards (issued in May <strong>2010</strong> and effective for the Group from 1<br />
January 2011). The Group is currently assessing the impact of the amended standards on its consolidated fi nancial<br />
statements.<br />
· Limited exemption from comparative IFRS 7 disclosures for fi rst-time adopters – Amendment to IFRS 1 (effective for<br />
annual periods beginning on or after 1 July <strong>2010</strong>). The amendment is not applicable to the Group.<br />
· Disclosures – Transfers of Financial Assets – Amendments to IFRS 7 (issued in October <strong>2010</strong> and effective for annual<br />
periods beginning on or after 1 July 2011). The Group is currently assessing the impact of the amended standard on<br />
its consolidated fi nancial information.<br />
· Recovery of Underlying Assets – Amendments to IAS 12 (issued in December <strong>2010</strong> and effective for annual periods<br />
beginning on or after 1 January 2012). The amendment is not applicable to the Group.<br />
· Severe Hyperinfl ation and Removal of Fixed Dates for First-time Adopters – Amendments to IFRS 1 (issued in December<br />
<strong>2010</strong> and effective for annual periods beginning on or after 1 July 2011). The amendment is not applicable to the<br />
Group.<br />
Unless otherwise described above, the new standards and interpretations are not expected to signifi cantly<br />
affect the Group’s consolidated fi nancial statements.<br />
5. CRITICAL ACCOUNTING ESTIMATES, AND JUDGEMENTS<br />
IN APPLYING ACCOUNTING POLICIES<br />
The Group makes estimates and assumptions that affect the reported amounts of assets and liabilities within the<br />
next fi nancial year. Estimates and judgements are continually evaluated and are based on management’s experience<br />
and other factors, including expectations of future events that are believed to be reasonable under the circumstances.<br />
Management also makes certain judgements, apart from those involving estimations, in the process of applying<br />
the accounting policies. Judgements that have the most signifi cant effect on the amounts recognised in the<br />
consolidated fi nancial statements and estimates that can cause a signifi cant adjustment to the carrying amount<br />
of assets and liabilities within the next fi nancial year include:<br />
Provisions for mine fl ooding. On 28 October 2006, the Group ceased production operations in Mine 1 due to<br />
natural groundwater infl ow that reached a level which could not be properly controlled.<br />
On 1 November 2006, the commission of Rostekhnadzor issued an act on its technical investigation of the<br />
causes of fl ooding in Mine 1. According to the act, the cause of fl ooding was a “new kind of previously unknown<br />
anomaly of geological structure” and “the development of two sylvinite layers AB (1964–1965) and Kr II (1976–<br />
1977)”. The combination of circumstances in the run up to the accident, in terms of the source, scope and strength<br />
was classifi ed as “being extraordinary and unavoidable events under prevailing conditions not dependent on the<br />
will of the parties involved”.<br />
In November 2008, at the request of the Russian Deputy Prime Minister, Igor Sechin, a new commission<br />
was established by Rostekhnadzor for a second investigation into the cause of fl ooding in Mine 1. According to<br />
the report of the second commission, issued on 29 January 2009, the fl ooding was caused by a “combination of<br />
geological and technological factors”.<br />
International Financial <strong>Report</strong>ing Standards<br />
Consolidated Financial Statements and Auditor’s <strong>Report</strong> for the Year Ended 31 December <strong>2010</strong><br />
International Financial <strong>Report</strong>ing Standards<br />
Consolidated Table of Contents<br />
Financial Statements and Auditor’s <strong>Report</strong> for the Year Ended 31 December <strong>2010</strong><br />
65
URALKALI GROUP<br />
NOTES TO THE CONSOLIDATED FINANCIAL STATEMENTS FOR THE YEAR ENDED 31 DECEMBER <strong>2010</strong><br />
5. CRITICAL ACCOUNTING ESTIMATES, AND JUDGEMENTS IN APPLYING ACCOUNTING POLICIES (CONTINUED)<br />
Provision for compensations<br />
In February 2009, the Company decided voluntarily, as a part of its social responsibility, to compensate expenses<br />
incurred by different levels of the government for liquidation of fl ooding consequences in total amount RR 7,804<br />
including expenses for resettlement of citizens, construction of a 6-kilometer railway bypass incurred prior to<br />
31 December 2008, and also partially compensate for the defi cit of fi nancing related to the construction of a 53kilometer<br />
railway bypass.<br />
At the end of 2009 the Company was in negotiations with OJSC “Russian railways” regarding voluntarily<br />
compensation of additional actual expenditures related to the construction of a 53-kilometer railway bypass in<br />
the amount of RR 1,000. In March <strong>2010</strong> the Board of Directors of the Company approved this compensation, as<br />
a part of its social responsibility, and as of 31 December 2009 the determination that this compensation would<br />
crystallise was assessed as “probable” the Company accrued a provision in this amount. To date this provision has<br />
not been utilized as the process for making payment has not been fi nalised.<br />
Other risks not included in provision for compensations<br />
In July 2009, the Company received a request from OJSC TGK-9 to compensate expenses in the amount of<br />
RR 3,160. According to the request, this amount corresponds to the development of a reserve energy supply source<br />
in Berezniki. The parties established a technical commission in order to determine whether these expenses are<br />
in fact directly connected to the consequences of the mine fl ood. In July <strong>2010</strong> the Company received an amended<br />
request from TGK-9 to compensate expenses in the amount of RR 995. The Company believes that only the<br />
expenses that are directly caused by the fl ooding of the mine could be considered for compensation. Therefore<br />
the Company estimates the probability of having to pay this compensation to be from “remote” to “possible” and<br />
no accrual have been made in respect of this amount.<br />
The procedure for calculating and compensating for mineral deposits lost as a result of mine fl ooding is not<br />
established by Russian law. However, the Company evaluates the risk that such claims could arise as “possible”. In<br />
the appendices to the report of the second commission, there is a calculation of the value of lost mineral resources<br />
(from RR 25,380 to RR 84,602) and a calculation of losses resulting from mineral extraction tax not received by<br />
the government due to fl ooding (from RR 964 to RR 3,215). The Company analysed the calculations provided in<br />
the appendices and evaluated the risk of compensation in the stated amount as “remote”.<br />
In October 2009, the Company has received the decision of tax authorities based on the tax audit for 2005–<br />
2006. Tax authorities have stated that in October 2006 the Company should have charged mineral extraction<br />
tax for mineral deposits written off in the state records due to fl ooding. The sum of unpaid mineral extraction<br />
tax including fi nes and penalties amounted to RR 782. In January <strong>2010</strong> the Company received the claim of<br />
tax authorities to pay tax, fi nes and penalties. The decision of tax authorities of additional charge of mineral<br />
extraction tax was determined to be invalid in court. On 11 January 2011 Federal Arbitration Court in Moscow<br />
Judicial Circuit entirely dismissed the claim of tax authorities. The Company estimates the probability of this<br />
liability crystallising as “remote” and accordingly has not made an accrual for this amount.<br />
Remaining useful life of property, plant and equipment. Management assesses the remaining useful life of property,<br />
plant and equipment in accordance with the current technical conditions of assets and estimated period during<br />
which these assets will bring economic benefi t to the Group (Note 8). The estimated remaining useful life of<br />
some property, plant and equipment is beyond the expiry date of the relevant operating licenses (Note 1). The<br />
management believes that the licenses will be renewed in due order. However if the licenses are not renewed,<br />
property, plant and equipment with net book value of RR 1,931 (31 December 2009: RR 1,084) should be assessed<br />
for impairment in 2013.<br />
66 <strong>Uralkali</strong> | <strong>Annual</strong> <strong>Report</strong> <strong>2010</strong><br />
Table of Contents
URALKALI GROUP<br />
NOTES TO THE CONSOLIDATED FINANCIAL STATEMENTS FOR THE YEAR ENDED 31 DECEMBER <strong>2010</strong><br />
5. CRITICAL ACCOUNTING ESTIMATES, AND JUDGEMENTS IN APPLYING ACCOUNTING POLICIES (CONTINUED)<br />
Land. The main part of facilities of OJSC BBT are situated on land occupied on an annual lease basis, but the<br />
management plans to secure the land where the facilities of OJSC BBT are situated and adjoining land plots by<br />
a long-term rent agreement. If the Group cannot secure long-term use of this land, non-current assets of RR 2,330<br />
(31 December 2009: RR 2,417) should be assessed for impairment.<br />
Impairment of goodwill. The Group tests goodwill for impairment at least annually. The goodwill primarily relates<br />
to expected reduction of transport costs to be incurred from synergies with the Company when exporting potash<br />
by the Baltic Sea and is allocated to CGU OJSC <strong>Uralkali</strong>. The recoverable amount of the goodwill is determined<br />
based on value in use calculations whereby cash fl ow projections approved by management covering a fi ve-year<br />
period and analysis of synergies performed by an independent appraiser. Cash fl ows beyond that fi ve-year period<br />
have been extrapolated using a steady 3% growth rate. This growth rate does not exceed the long-term average<br />
growth rate for the business sector of the economy in which the Company operates. Pre-tax discount rate of 15%<br />
that refl ects risks relating to OJSC <strong>Uralkali</strong> was used in the calculation of the recoverable value. The Group did<br />
not recognise any impairment.<br />
Trade and other receivables. The Company’s management analyses overdue trade and other accounts receivable<br />
at each reporting date. Overdue accounts receivable are not provided if management has certain evidence of<br />
their recoverability. If management has no reliable information about the recoverability of overdue receivables, a<br />
100% impairment provision is accrued for trade and other receivables overdue by more than 90 days; receivables<br />
overdue by more than 45 (but less than 90) days are provided for at 50% of their carrying amount.<br />
Inventory. The Group engages an independent surveyor to verify the physical quantity of fi nished products<br />
at the reporting dates. In accordance with the surveyor’s guidance and technical characteristics of the devices used,<br />
the possible valuation error is +/-4-6%. At the reporting date the carrying amount of finished products<br />
may vary within this range.<br />
Tax legislation. Russian tax, currency and customs legislation is subject to varying interpretations (Note 29).<br />
6. RELATED PARTIES<br />
Related parties are defi ned in IAS 24 “Related Party Disclosures”. Parties are considered to be related if one<br />
party has the ability to control the other party, is under common control, or can exercise signifi cant infl uence<br />
over the other party in making fi nancial and operational decisions. In considering each possible related party<br />
relationship, attention is directed to the substance of the relationship, not merely the legal form. Key management<br />
and close family members are also related parties.<br />
The Company’s immediate parent and ultimate controlling party are disclosed in Note 1.<br />
The nature of the related party relationships for those related parties with whom the Group entered into<br />
signifi cant transactions or had signifi cant balances outstanding are detailed below.<br />
Statement of fi nancial position caption Nature of relationship 31 December <strong>2010</strong> 31 December 2009<br />
Loans issued to related parties 2009: Ultimate controlling party - 1,578<br />
Loans issued to related parties Associate 10 -<br />
Statement of income caption Nature of relationship<br />
Former key management personnel<br />
<strong>2010</strong> 2009<br />
Interest income<br />
(2009: Ultimate controlling party) 44 16<br />
Shareholder’s equity caption Nature of relationship <strong>2010</strong> 2009<br />
Dividends declared Former parent company (Note 1) 2,283 -<br />
International Financial <strong>Report</strong>ing Standards<br />
Consolidated Financial Statements and Auditor’s <strong>Report</strong> for the Year Ended 31 December <strong>2010</strong><br />
International Financial <strong>Report</strong>ing Standards<br />
Consolidated Table of Contents<br />
Financial Statements and Auditor’s <strong>Report</strong> for the Year Ended 31 December <strong>2010</strong><br />
67
URALKALI GROUP<br />
NOTES TO THE CONSOLIDATED FINANCIAL STATEMENTS FOR THE YEAR ENDED 31 DECEMBER <strong>2010</strong><br />
6. RELATED PARTIES (CONTINUED)<br />
LOAN ISSUED TO RELATED PARTY<br />
In September 2009, the Group entered into a loan agreement for a total amount of EUR 50 million with Mr<br />
Dmitry Rybolovlev, the former Chairman of the Board of Directors. The loan was provided at an interest rate of<br />
Euro Libor + 4% for 1 year. The loan was fully repaid on 2 July <strong>2010</strong>.<br />
CROSS SHAREHOLDING<br />
As of 31 December <strong>2010</strong> and 31 December 2009 LLC Kama, a 100% owned subsidiary of the Group, owned<br />
1.17% of the ordinary shares of the Company.<br />
MANAGEMENT COMPENSATION<br />
Compensation of key management personnel consists of remuneration paid to executive directors and vicepresidents<br />
for their services in full- or part-time positions. Compensation is made up of annual remuneration<br />
and a performance bonus depending on operating results.<br />
Total key management compensation represented by short-term employee benefi ts and included in general and<br />
administrative expenses in the consolidated statement of income was RR 1,305 and RR 702 for the years ended<br />
31 December <strong>2010</strong> and 2009, respectively.<br />
The structure of total key management compensations is set out below:<br />
<strong>2010</strong> 2009<br />
Salary and other compensations 903 702<br />
Termination bonuses 402 -<br />
Total key management compensations 1,305 702<br />
The termination bonuses are presented by the one-off benefi ts paid for highly paid professionals and managers,<br />
who left the Company. The termination bonuses were fully paid in <strong>2010</strong>.<br />
7. SEGMENT REPORTING<br />
The Group identifi es the segment in accordance with the criteria set forth in IFRS 8, and based on the way the<br />
operations of the Company are regularly reviewed by the chief operating decision maker to analyse performance<br />
and allocate resources. The chief operating decision-maker has been determined as the Board of Directors. It<br />
was determined, that the Group has one operating segment – the extraction, production and sales of potash<br />
fertilisers.<br />
The fi nancial information reported on operating segments is based on management accounts which are based<br />
on IFRS.<br />
a) Segment information for the reportable segment is set out below:<br />
Note <strong>2010</strong> 2009<br />
Revenue 51,592 33,809<br />
Segment result (Net profit) 16,654 9,095<br />
Depreciation and amortisation (3,849) (3,188)<br />
Accrual of provision for compensations 25 - (1,000)<br />
Finance income 24 214 456<br />
Finance expense 24 (887) (1,350)<br />
Income tax 26 (3,095) (2 139)<br />
68 <strong>Uralkali</strong> | <strong>Annual</strong> <strong>Report</strong> <strong>2010</strong><br />
Table of Contents
URALKALI GROUP<br />
NOTES TO THE CONSOLIDATED FINANCIAL STATEMENTS FOR THE YEAR ENDED 31 DECEMBER <strong>2010</strong><br />
7. SEGMENT REPORTING (CONTINUED)<br />
b) Geographical information<br />
The analysis of Group sales by region was:<br />
<strong>2010</strong> 2009<br />
Russia 4,632 4,587<br />
Latin America, China, India, South East Asia 30,186 20,239<br />
USA, Europe 16,342 8,713<br />
Other countries 432 270<br />
Total revenue 51,592 33,809<br />
The sales are allocated by region based on the destination country.<br />
c) Major customers<br />
The Group had no external customers which represented more than 10% of the Group’s revenues in the year<br />
ended 31 December <strong>2010</strong> (the Group had one external customer from India which represented 15% of the Group’s<br />
revenues in the year ended 31 December 2009).<br />
d) In addition to above segment disclosure management is preparing additional information that splits the<br />
result of Potash segment activity between export potash sales, domestic potash sales and other sales. Direct Cost<br />
of sales and Distribution expenses are allocated proportionally based on revenues. Indirect expenses, such as<br />
General and administrative expenses, Other operating income and expenses and Taxes other than income tax<br />
are allocated between categories proportionally based on Cost of sales. Some costs are considered as unallocated<br />
(Loss on disposal of fi xed assets, Net results on sale of Belaruskali goods, Mine fl ooding costs, Finance income<br />
and expense, Income tax expense). This split for the year ended 31 December <strong>2010</strong> was as follows:<br />
Export<br />
potash sales<br />
Domestic<br />
potash sales<br />
Total<br />
potash sales<br />
Other<br />
sales Unallocated Total<br />
Tonnes (thousands) 4,397 682 5,079 - - 5,079<br />
Revenues 46,960 3,092 50,052 1,540 - 51,592<br />
Cost of sales (9,579) (1,485) (11,064) (766) - (11,830)<br />
Distribution, general and administrative<br />
expenses, other operating income and<br />
expenses and taxes other than income tax (17,888) (790) (18,678) (367) (267) (19,312)<br />
Operating profit/(loss) 19,493 817 20,310 407 (267) 20,450<br />
Mine flooding costs (28) (28)<br />
Finance income and expense, net (673) (673)<br />
Profit before income tax 19,749<br />
Income tax expense (3,095) (3,095)<br />
Segment result/Net profit 16,654<br />
International Financial <strong>Report</strong>ing Standards<br />
Consolidated Financial Statements and Auditor’s <strong>Report</strong> for the Year Ended 31 December <strong>2010</strong><br />
International Financial <strong>Report</strong>ing Standards<br />
Consolidated Table of Contents<br />
Financial Statements and Auditor’s <strong>Report</strong> for the Year Ended 31 December <strong>2010</strong><br />
69
URALKALI GROUP<br />
NOTES TO THE CONSOLIDATED FINANCIAL STATEMENTS FOR THE YEAR ENDED 31 DECEMBER <strong>2010</strong><br />
7. SEGMENT REPORTING (CONTINUED)<br />
This split for the year ended 31 December 2009 was as follows:<br />
Export<br />
potash sales<br />
Domestic<br />
potash sales<br />
Total<br />
potash sales<br />
Other<br />
sales Unallocated Total<br />
Tonnes (thousands) 1,895 602 2,497 - - 2,497<br />
Revenues 29,189 2,878 32,067 1,742 - 33,809<br />
Cost of sales (6,109) (1,942) (8,051) (827) - (8,878)<br />
Distribution, general and administrative<br />
expenses, other operating income and<br />
expenses and taxes other than income tax (9,739) (1,195) (10,934) (545) (264) (11,743)<br />
Operating profit/(loss) 13,341 (259) 13,082 370 (264) 13,188<br />
Mine flooding costs (1,060) (1,060)<br />
Finance income and expense, net (894) (894)<br />
Profit before income tax 11,234<br />
Income tax expense (2,139) (2,139)<br />
Segment result/Net profit 9,095<br />
Cost<br />
8. PROPERTY, PLANT AND EQUIPMENT<br />
Property, plant and equipment and related accumulated depreciation consist of the following:<br />
Buildings<br />
Mine<br />
development<br />
costs<br />
Plant and<br />
equipment Transport<br />
Assets under<br />
construction Other Land Total<br />
Balance as of<br />
31 December 2009 9,431 6,030 21,043 6,178 20,187 643 189 63,701<br />
Additions - - - 126 12,913 - - 13,039<br />
Transfers 1,359 695 4,837 - (7,194) 301 2 -<br />
Disposals (40) (35) (651) (1,437) (2,787) (10) - (4,960)<br />
Balance as of<br />
31 December <strong>2010</strong> 10,750 6,690 25,229 4,867 23,119 934 191 71,780<br />
Accumulated Depreciation<br />
Balance as of<br />
31 December 2009 3,995 4,883 10,319 1,946 - 350 - 21,493<br />
Depreciation charge 298 196 2,999 430 - 43 - 3,966<br />
Disposals (24) (35) (603) (153) - (8) - (823)<br />
Balance as of<br />
31 December <strong>2010</strong> 4,269 5,044 12,715 2,223 - 385 - 24,636<br />
Net Book Value<br />
Balance as of<br />
31 December 2009 5,436 1,147 10,724 4,232 20,187 293 189 42,208<br />
Balance as of<br />
31 December <strong>2010</strong> 6,481 1,646 12,514 2,644 23,119 549 191 47,144<br />
70 <strong>Uralkali</strong> | <strong>Annual</strong> <strong>Report</strong> <strong>2010</strong><br />
Table of Contents
URALKALI GROUP<br />
NOTES TO THE CONSOLIDATED FINANCIAL STATEMENTS FOR THE YEAR ENDED 31 DECEMBER <strong>2010</strong><br />
8. PROPERTY, PLANT AND EQUIPMENT (CONTINUED)<br />
Cost<br />
Buildings<br />
Mine<br />
development<br />
costs<br />
Plant and<br />
equipment Transport<br />
Assets under<br />
construction Other Land Total<br />
Balance as of<br />
31 December 2008 8,547 5,785 16,649 4,733 13,011 543 179 49,447<br />
Additions - - - 192 14,837 - - 15,029<br />
Transfers 936 279 4,895 1,311 (7,538) 107 10 -<br />
Disposals (52) (34) (501) (58) (123) (7) - (775)<br />
Balance as of<br />
31 December 2009 9,431 6,030 21,043 6,178 20,187 643 189 63,701<br />
Accumulated Depreciation<br />
Balance as of<br />
31 December 2008 3,746 4,716 8,432 1,596 - 315 - 18,805<br />
Depreciation charge 271 175 2,340 395 - 42 - 3,223<br />
Disposals (22) (8) (453) (45) - (7) - (535)<br />
Balance as of<br />
31 December 2009 3,995 4,883 10,319 1,946 - 350 - 21,493<br />
Net Book Value<br />
Balance as of<br />
31 December 2008 4,801 1,069 8,217 3,137 13,011 228 179 30,642<br />
Balance as of<br />
31 December 2009 5,436 1,147 10,724 4,232 20,187 293 189 42,208<br />
DEPRECIATION<br />
For the year ended 31 December <strong>2010</strong> and 2009, respectively, the depreciation was allocated to statement of<br />
income as follows:<br />
Note <strong>2010</strong> 2009<br />
Cost of sales 19 3,132 2,502<br />
Distribution costs (including transhipment activities – Note 2.29) 381 356<br />
General and administrative expenses 21 227 241<br />
Loss on disposal of property, plant and equipment 53 32<br />
Total depreciation expense 3,793 3,131<br />
In <strong>2010</strong> the Group incurred depreciation amounting to RR 173 (2009: RR 92), directly related to the<br />
construction of new fi xed assets. These expenses were capitalised on the consolidated statement of fi nancial<br />
position in accordance with the Group accounting policy and included in assets under construction.<br />
FULLY DEPRECIATED ASSETS STILL IN USE<br />
As of 31 December <strong>2010</strong> and 31 December 2009 the gross carrying value of fully depreciated property, plant<br />
and equipment still in use was RR 7,686 and RR 7,072, respectively.<br />
ASSETS PLEDGED UNDER LOAN AGREEMENTS<br />
As of 31 December <strong>2010</strong> and 31 December 2009 the carrying value of property, plant and equipment pledged<br />
under bank loans was RR 3,987 and RR 6,729 (Note 16), respectively.<br />
International Financial <strong>Report</strong>ing Standards<br />
Consolidated Financial Statements and Auditor’s <strong>Report</strong> for the Year Ended 31 December <strong>2010</strong><br />
International Financial <strong>Report</strong>ing Standards<br />
Consolidated Table of Contents<br />
Financial Statements and Auditor’s <strong>Report</strong> for the Year Ended 31 December <strong>2010</strong><br />
71
URALKALI GROUP<br />
NOTES TO THE CONSOLIDATED FINANCIAL STATEMENTS FOR THE YEAR ENDED 31 DECEMBER <strong>2010</strong><br />
9. INVESTMENTS IN SUBSIDIARY AND JOINTLY CONTROLLED<br />
ENTITIES<br />
INVESTMENT IN JOINTLY CONTROLLED ENTITY<br />
The Company has a 50% interest in JSC Belarusian Potash Company (“BPC”) – the remaining 50% is divided<br />
between Belaruskali (which owns 45%) and Belorussian Railways (which owns 5%). According to BPC’s charter, all<br />
shareholders meeting decisions may be taken only with a majority of 75%. Therefore, BPC operations are under<br />
the joint control of Belaruskali and the Company (the “Participants”). BPC’s principal activity is marketing and<br />
exporting as an agent potash fertilisers produced by the participants.<br />
BPC’s charter provides for separate accounting of the operations of each participant, including separate<br />
accounting for the sales of the participants’ goods and the related cost of sale and distribution costs. Administrative<br />
expenses incurred by BPC are currently shared as follows: not more than 69% on Belaruskali operations, and<br />
not less than 31% on Group operations. The actual proportion depends on the volume of goods sold by each<br />
participant through BPC.<br />
The distribution of net income to each participant is made on the basis of their relevant results after deducting<br />
administrative costs, unless both participants decide not to distribute. Group’s operations through BPC, assets and<br />
the Group’s liabilities located in BPC in which the Group has a direct interest are included in these consolidated<br />
fi nancial statements. The consolidated statement of income refl ects the revenue from sales by BPC of <strong>Uralkali</strong>’s<br />
products, together with the related costs of sales, distribution and administrative costs.<br />
INVESTMENTS IN SUBSIDIARIES<br />
In May <strong>2010</strong> the Group sold a 51% share in LLC Poliklinika <strong>Uralkali</strong>-Med that provided healthcare services to<br />
the Group, for a consideration of RR 8 with RR 6 gain on disposal, recognised in the consolidated statement of<br />
income. The Group retained a 49% share in LLC Poliklinika <strong>Uralkali</strong>-Med and as of 31 December <strong>2010</strong> classifi ed<br />
this investment as associate.<br />
On 19 July <strong>2010</strong> the Group sold the entire share capital of Sophar Property Holding Inc. for net proceeds of<br />
RR 3,948 (US$ 129,600,000). The main identifi able assets of this subsidiary consisted of two corporate business<br />
jets. The gain on disposal reported on the sale was RR 14 (US$ 469,823).<br />
10. INTANGIBLE ASSETS<br />
Software Other Total<br />
Cost as of 1 January 2009 459 20 479<br />
Accumulated amortisation (318) - (318)<br />
Carrying amount as of 1 January 2009 141 20 161<br />
Additions 20 14 34<br />
Amortisation charge (57) - (57)<br />
Cost as of 31 December 2009 479 34 513<br />
Accumulated amortisation (375) - (375)<br />
Carrying amount as of 31 December 2009 104 34 138<br />
Additions 58 2 60<br />
Amortisation charge (56) - (56)<br />
Cost as of 31 December <strong>2010</strong> 537 36 573<br />
Accumulated amortisation (431) - (431)<br />
Carrying amount as of 31 December <strong>2010</strong> 106 36 142<br />
72 <strong>Uralkali</strong> | <strong>Annual</strong> <strong>Report</strong> <strong>2010</strong><br />
Table of Contents
URALKALI GROUP<br />
NOTES TO THE CONSOLIDATED FINANCIAL STATEMENTS FOR THE YEAR ENDED 31 DECEMBER <strong>2010</strong><br />
10. INTANGIBLE ASSETS (CONTINUED)<br />
The balances of intangible assets reported in these consolidated fi nancial statements as of 31 December <strong>2010</strong><br />
and 2009 respectively mainly represent management information and accounting system costs and fees charged<br />
by an external consultant for the installation of this software. The costs of the software are amortised over a period<br />
not exceeding fi ve years. Other intangible assets are mainly represented by licenses (Note 1).<br />
11. INVENTORIES<br />
Inventories consist of the following:<br />
<strong>2010</strong> 2009<br />
Raw materials 1,659 1,819<br />
Finished products 1,833 1,639<br />
Work in progress 23 23<br />
Total inventories 3,515 3,481<br />
As of 31 December <strong>2010</strong> no circulating fi nished goods were pledged as security for bank loans (31 December<br />
2009: 227) (Note 16).<br />
12. TRADE AND OTHER RECEIVABLES<br />
<strong>2010</strong> 2009<br />
Trade receivables 2,950 1,414<br />
Other accounts receivable 387 421<br />
Less: provision for impairment of trade and other receivables (209) (209)<br />
Total financial receivables 3,128 1,626<br />
VAT recoverable 2,056 1,797<br />
Other taxes receivable 1,474 1,876<br />
Advances to suppliers 360 432<br />
Insurance expenses prepaid 39 49<br />
Other prepayments 107 70<br />
Total trade and other receivables 7,164 5,850<br />
As of 31 December <strong>2010</strong> trade receivables of RR 2,920 (31 December 2009: RR 1,239), net of provision for<br />
impairment, were denominated in foreign currencies. 68% of this balance was denominated in US$ (31 December<br />
2009: 68%) and 32% was denominated in Euro (31 December 2009: 32%). Management believes that the fair value<br />
of accounts receivable does not differ signifi cantly from their carrying amount.<br />
Movements on the provision for impairment of trade and other receivables are as follows:<br />
Trade receivables<br />
<strong>2010</strong> 2009<br />
Other<br />
receivables<br />
Trade<br />
receivables<br />
Other<br />
receivables<br />
As of 1 January (109) (100) (79) (154)<br />
Provision accrued (38) (19) (147) (74)<br />
Provision reversed 30 16 117 124<br />
Provision written-off 3 8 - 4<br />
As of 31 December (114) (95) (109) (100)<br />
The accrual and reversal of the provision for impaired receivables have been included in other operating<br />
expenses in the consolidated statement of income (Note 23). Amounts charged to the provision account are<br />
generally written off when there is no expectation of recovering additional cash.<br />
International Financial <strong>Report</strong>ing Standards<br />
Consolidated Financial Statements and Auditor’s <strong>Report</strong> for the Year Ended 31 December <strong>2010</strong><br />
International Financial <strong>Report</strong>ing Standards<br />
Consolidated Table of Contents<br />
Financial Statements and Auditor’s <strong>Report</strong> for the Year Ended 31 December <strong>2010</strong><br />
73
URALKALI GROUP<br />
NOTES TO THE CONSOLIDATED FINANCIAL STATEMENTS FOR THE YEAR ENDED 31 DECEMBER <strong>2010</strong><br />
12. TRADE AND OTHER RECEIVABLES (CONTINUED)<br />
Analysis by credit quality of trade and other receivables is as follows:<br />
<strong>2010</strong> 2009<br />
Trade receivables Other receivables Trade receivables Other receivables<br />
Current and not impaired<br />
Customers from developed countries 1,136 - 443 34<br />
Customers from developing countries 1,082 - 512 79<br />
Domestic customers 69 214 101 201<br />
Total current and not impaired 2,287 214 1,056 314<br />
Past due but not impaired<br />
less than 45 days overdue 495 55 248 -<br />
45 to 90 days overdue 50 3 - 7<br />
over 90 days overdue 2 15 - -<br />
Total past due but not impaired 547 73 248 7<br />
Determined to be impaired (gross)<br />
45 to 90 days overdue 5 10 2 -<br />
over 90 days overdue 111 90 108 100<br />
Total gross amount of impaired accounts<br />
receivables 116 100 110 100<br />
Total financial receivables (gross) 2,950 387 1,414 421<br />
Less impairment provision (114) (95) (109) (100)<br />
Total financial receivables 2,836 292 1,305 321<br />
As of 31 December <strong>2010</strong> no trade and other receivables were pledged as collateral (31 December 2009: nil).<br />
13. CASH AND CASH EQUIVALENTS<br />
Cash and cash equivalents comprise the following:<br />
<strong>2010</strong> 2009<br />
RR denominated cash on hand and bank balances (interest rate:<br />
from 0.25% p.a. to 2% p.a. (2009: from 0.5% p.a. to 3.5% p.a.)) 449 882<br />
US$ denominated bank balances 2,595 1,792<br />
EUR denominated bank balances 505 305<br />
Other currencies denominated balances 29 11<br />
US$ term deposits (interest rate: from 0.3% p.a. to 1.35% p.a. (2009: 1.9% p.a.))<br />
EUR term deposits (interest rate: from 0.4% p.a. to 1.35% p.a. (2009: from 5% to 13%<br />
6,989 293<br />
p.a.)) 3,568 221<br />
RR term deposits (interest rate: from 3.13% p.a. to 7% p.a. (2009: from 5% to 15% p.a.)) 540 780<br />
Cash and cash equivalents, net of restricted cash 14,675 4,284<br />
Restricted cash<br />
Term bank deposits (4.1% p.a. (2009: 12.7% p.a.) 90 13<br />
Total restricted cash 90 13<br />
Total cash and cash equivalents 14,765 4,297<br />
Term deposits, except those included in restricted cash, as at 31 December <strong>2010</strong> have various original maturities<br />
but may upon request be withdrawn without any restrictions.<br />
74 <strong>Uralkali</strong> | <strong>Annual</strong> <strong>Report</strong> <strong>2010</strong><br />
Table of Contents
URALKALI GROUP<br />
NOTES TO THE CONSOLIDATED FINANCIAL STATEMENTS FOR THE YEAR ENDED 31 DECEMBER <strong>2010</strong><br />
14. SHAREHOLDERS’ EQUITY<br />
Number of ordinary shares<br />
(in millions) Ordinary shares Treasury shares Total<br />
At 1 January 2009 2,124 648 (12) 636<br />
At 31 December 2009 2,124 648 (12) 636<br />
At 1 January <strong>2010</strong> 2,124 648 (12) 636<br />
At 31 December <strong>2010</strong> 2,124 648 (12) 636<br />
The number of unissued authorised ordinary shares is 1,500 million (31 December 2009: 1,500 million) with<br />
a nominal value per share of 0.5 Roubles. All shares stated in the table above have been issued and fully paid.<br />
Treasury shares. As of 31 December <strong>2010</strong> treasury shares comprise 24,868,944 ordinary shares of the Company<br />
(31 December 2009: 24,868,944) with a nominal value per share of 0.5 Roubles owned by LLC Kama, a wholly<br />
owned subsidiary of the Group (Note 6). These ordinary shares carry voting rights in the same proportion as other<br />
ordinary shares. Voting rights of ordinary shares of the Company held by entities within the Group are effectively<br />
controlled by the management of the Group.<br />
Profi t distribution. In accordance with Russian legislation, the Company distributes profi ts as dividends or<br />
transfers them to reserves (fund accounts) on the basis of fi nancial statements prepared in accordance with<br />
Russian Accounting Rules.<br />
The Company’s statutory accounting reports are the basis for profi t distribution and other appropriations.<br />
Russian law identifi es net profi t as the basis of distribution. For the year ended 31 December <strong>2010</strong>, the current<br />
period net statutory profi t for the Company as reported in the published annual statutory reporting forms was<br />
RR 14,469 (for the year ended 31 December 2009: RR 1,153) and the closing balance of the accumulated profi t<br />
including the current period net statutory profi t totalled RR 44,527 (31 December 2009: RR 33,643). However, this<br />
legislation and other statutory laws and regulations are open to legal interpretation and accordingly management<br />
believes at present that it would not be appropriate to disclose the amount of the distributable reserves in these<br />
consolidated fi nancial statements.<br />
Dividends. In June <strong>2010</strong> the General Meeting of Shareholders of the Company approved dividends (based on<br />
the fi nancial results for the year ended 31 December 2009) amounting to RR 3,611 (1.70 Roubles per share). The<br />
total amount of dividends attributable to treasury shares has been eliminated. All dividends are declared and<br />
paid in Russian Roubles.<br />
15. MINE FLOODING PROVISIONS<br />
Note <strong>2010</strong> 2009<br />
Balance as of 1 January 1,000 7,804<br />
Utilisation of provision for compensations 5 - (7,804)<br />
Accrual of provision for compensations 25, 5 - 1,000<br />
Balance as of 31 December 1,000 1,000<br />
16. BORROWINGS<br />
<strong>2010</strong> 2009<br />
Bank loans 11,253 13,463<br />
Long-term company loans 45 45<br />
Finance lease payable 507 507<br />
Total borrowings 11,805 14,015<br />
International Financial <strong>Report</strong>ing Standards<br />
Consolidated Financial Statements and Auditor’s <strong>Report</strong> for the Year Ended 31 December <strong>2010</strong><br />
International Financial <strong>Report</strong>ing Standards<br />
Consolidated Table of Contents<br />
Financial Statements and Auditor’s <strong>Report</strong> for the Year Ended 31 December <strong>2010</strong><br />
75
URALKALI GROUP<br />
NOTES TO THE CONSOLIDATED FINANCIAL STATEMENTS FOR THE YEAR ENDED 31 DECEMBER <strong>2010</strong><br />
16. BORROWINGS (CONTINUED)<br />
As of 31 December <strong>2010</strong> and 31 December 2009 the fair value of the current and non-current borrowings is<br />
not materially different from their carrying amounts.<br />
The Group does not apply hedge accounting and has not entered into any hedging arrangements in respect<br />
of its interest rate exposures.<br />
<strong>2010</strong> 2009<br />
Balance as of 1 January 13,463 13,987<br />
Bank loans received, denominated in US$ 12,522 10,418<br />
Bank loans received, denominated in RR - 500<br />
Bank loans repaid, denominated in US$ (14,318) (11,830)<br />
Bank loans repaid, denominated in RR (450) (50)<br />
Interest accrued 453 384<br />
Interest paid (465) (393)<br />
Recognition of syndication fees (111) (144)<br />
Amortisation of syndication fees 125 27<br />
Currency translation difference 34 564<br />
Balance as of 31 December 11,253 13,463<br />
The table below provides interest rates as of 31 December <strong>2010</strong> and 31 December 2009 and the split of the bank<br />
loans into short- and long-term.<br />
SHORT-TERM BORROWINGS<br />
Interest rates<br />
From 1 month Libor +1.6% to 1 month<br />
Libor +3.5% (2009: from 1 month Libor<br />
<strong>2010</strong> 2009<br />
Bank loans in US$ – floating interest +1.6% to 1 month Libor +3.4%) 2,589 5,199<br />
Bank loans in RR – fixed interest 2009: 14% - 455<br />
Total short-term bank loans 2,589 5,654<br />
LONG-TERM BORROWINGS<br />
Interest rates<br />
From 1 month Libor +3.25% to 1 month Libor<br />
+3.5% (2009: from 1 month Libor +1.6% to 1<br />
<strong>2010</strong> 2009<br />
Bank loans in US$ – floating interest month Libor +3.4%) 8,664 7,809<br />
Total long-term bank loans 8,664 7,809<br />
US$ denominated bank loans bear a weighted average interest of 3.40% (31 December 2009: 2.49%).<br />
As of 31 December <strong>2010</strong> and 31 December 2009, loans (including short-term borrowings) were guaranteed by<br />
the collateral of property, plant and equipment (Note 8). As of 31 December <strong>2010</strong> no bank loans were collateralised<br />
by fi nished goods (31 December 2009: RR 455 (Note 11)).<br />
Bank loans of RR 11,253 (31 December 2009: RR 5,673) were collateralised by future export proceeds of the<br />
Group under sales contracts with certain customers acceptable to the banks.<br />
The Group’s bank borrowings mature as follows:<br />
<strong>2010</strong> 2009<br />
- within 1 year 2,589 5,654<br />
- between 2 and 4 years 8,664 7,809<br />
Total bank loans 11,253 13,463<br />
76 <strong>Uralkali</strong> | <strong>Annual</strong> <strong>Report</strong> <strong>2010</strong><br />
Table of Contents
URALKALI GROUP<br />
NOTES TO THE CONSOLIDATED FINANCIAL STATEMENTS FOR THE YEAR ENDED 31 DECEMBER <strong>2010</strong><br />
16. BORROWINGS (CONTINUED)<br />
In December 2009 OJSC BBT entered into the new fi nancial lease agreement with Federal State Unitary<br />
Enterprise Rosmorport (“FSUE Rosmorport”) for 49 years. Under this agreement, BBT has leased berth No. 106<br />
and renegotiated the lease terms for berth No. 107. As of 31 December <strong>2010</strong> the leased berths were included in<br />
buildings, with a net book value of RR 466 (31 December 2009: RR 476).<br />
Minimum lease payments under fi nance leases and their present values are as follows:<br />
<strong>2010</strong> 2009<br />
- within 1 year 49 49<br />
- between 2 and 5 years 196 196<br />
- after 5 years 2,132 2,157<br />
Minimum lease payments at the end of the year 2,377 2,402<br />
Less future finance charges (1,870) (1,895)<br />
Present value of minimum lease payments 507 507<br />
17. TRADE AND OTHER PAYABLES<br />
<strong>2010</strong> 2009<br />
Trade payables 1,461 1,110<br />
Accrued liabilities 174 134<br />
Dividends payable 44 107<br />
Other payables 442 407<br />
Total financial payables 2,121 1,758<br />
Accrued liabilities 557 446<br />
Advances received 312 147<br />
Deferred consideration of subsidiary acquisition 140 139<br />
Other payables 359 255<br />
Total trade and other payables 3,489 2,745<br />
18. REVENUES<br />
<strong>2010</strong> 2009<br />
Export<br />
Potassium chloride 33,101 16,474<br />
Potassium chloride (granular)<br />
Domestic<br />
13,859 12,715<br />
Potassium chloride 3,092 2,878<br />
Other 265 238<br />
Transportation and other revenues 1,275 1,504<br />
Total revenues 51,592 33,809<br />
In March 2008, the Government of the Russian Federation introduced duties, effective from April 2008 until<br />
April 2009, on the export of potassium chloride outside the CIS Customs Union. The duty applicable to <strong>Uralkali</strong>’s<br />
potassium chloride was 5% of the declared customs value, which the Group charged on almost all of the Group’s<br />
potassium chloride exports. Export revenues were shown net of the abovementioned duties, which amounted<br />
during the year ended 31 December 2009 to RR 267. No duties on the export of potassium chloride outside the<br />
CIS Customs Union were applicable during the year ended 31 December <strong>2010</strong>.<br />
International Financial <strong>Report</strong>ing Standards<br />
Consolidated Financial Statements and Auditor’s <strong>Report</strong> for the Year Ended 31 December <strong>2010</strong><br />
International Financial <strong>Report</strong>ing Standards<br />
Consolidated Table of Contents<br />
Financial Statements and Auditor’s <strong>Report</strong> for the Year Ended 31 December <strong>2010</strong><br />
77
URALKALI GROUP<br />
NOTES TO THE CONSOLIDATED FINANCIAL STATEMENTS FOR THE YEAR ENDED 31 DECEMBER <strong>2010</strong><br />
19. COST OF SALES<br />
Note <strong>2010</strong> 2009<br />
Depreciation 8 3,132 2,502<br />
Labour costs 22 2,890 2,083<br />
Fuel and energy 2,244 1,499<br />
Materials and components used 1,998 1,460<br />
Repairs and maintenance 1,357 1,242<br />
Transportation between mines by railway 333 201<br />
Utilities 13 16<br />
Change in work in progress, finished goods and goods in transit (179) (172)<br />
Other costs 42 47<br />
Total cost of sales 11,830 8,878<br />
Expenses of RR 124 (for the year ended 31 December 2009: RR 45) related to transportating ore between mines<br />
by automotive transport were incurred by CJSC Autotranskali, a 100% subsidiary of the Group, and are mainly<br />
included in labour costs, materials and components used and fuel and energy costs.<br />
20. DISTRIBUTION COSTS<br />
Note <strong>2010</strong> 2009<br />
Freight 5,882 2,611<br />
Railway tariff 4,631 1,628<br />
Transport repairs and maintenance 579 347<br />
Transhipment 476 340<br />
Depreciation 286 273<br />
Labour costs 22 243 217<br />
Commissions 203 52<br />
Travel expenses 139 157<br />
Other costs 380 450<br />
Total distribution costs 12,819 6,075<br />
21. GENERAL AND ADMINISTRATIVE EXPENSES<br />
Note <strong>2010</strong> 2009<br />
Labour costs 22 2,976 2,081<br />
Consulting, audit and legal services 309 318<br />
Depreciation 8 227 241<br />
Repairs and maintenance 171 141<br />
Security 147 119<br />
Mine-rescue crew 120 111<br />
Insurance 94 67<br />
Travel expenses 76 59<br />
Amortisation of intangible assets 10 56 57<br />
Communication and information system services 47 51<br />
Bank charges 33 24<br />
Other expenses 681 569<br />
Total general and administrative expenses 4,937 3,838<br />
78 <strong>Uralkali</strong> | <strong>Annual</strong> <strong>Report</strong> <strong>2010</strong><br />
Table of Contents
URALKALI GROUP<br />
NOTES TO THE CONSOLIDATED FINANCIAL STATEMENTS FOR THE YEAR ENDED 31 DECEMBER <strong>2010</strong><br />
22. LABOUR COSTS<br />
Note <strong>2010</strong> 2009<br />
Labour costs – Cost of sales 19 2,890 2,083<br />
Wages, salaries, bonuses and other compensations 2,336 1,689<br />
Contributions to social funds 515 397<br />
Post employment benefits 27 39 (3)<br />
Labour costs – Distribution costs 20 243 217<br />
Wages, salaries, bonuses, other compensations and<br />
contributions to social funds 243 217<br />
Labour costs – General and administrative expenses 21 2,976 2,081<br />
Wages, salaries, bonuses and other compensations 2,692 1,868<br />
Contributions to social funds 272 214<br />
Post employment benefits 27 12 (1)<br />
Total labour costs 6,109 4,381<br />
23. OTHER OPERATING INCOME AND EXPENSES<br />
Note <strong>2010</strong> 2009<br />
Social cost and charity 472 1,031<br />
Loss on disposal of fixed assets 279 271<br />
Provision for impairment of receivables 12 (11) (20)<br />
Net result on sale of Belaruskali goods (12) (7)<br />
Other expenses, net 189 53<br />
Total other operating income and expenses 917 1,328<br />
The Group entered into a sales agreement with BPC for processing the sales of Belaruskali goods through<br />
<strong>Uralkali</strong> Trading SA in <strong>2010</strong> and 2009, respectively, in order to overcome certain drawbacks in Belarusian export<br />
legislation.<br />
24. FINANCE INCOME AND EXPENSE<br />
The components of fi nance income and expense were as follows:<br />
<strong>2010</strong> 2009<br />
Interest income 168 313<br />
Fair value gains on investments 46 114<br />
Other financial income - 29<br />
Finance income 214 456<br />
<strong>2010</strong> 2009<br />
Interest expense 549 411<br />
Finance lease expense 49 38<br />
Foreign exchange loss, net 225 751<br />
Fair value losses on investments 2 -<br />
Letters of credit fees 62 150<br />
Finance expense 887 1,350<br />
Interest expense in total amount of RR 29 was capitalised for the year ended 31 December <strong>2010</strong> (for the year<br />
ended 31 December 2009: nill). The capitalisation rate was 3.49%.<br />
International Financial <strong>Report</strong>ing Standards<br />
Consolidated Financial Statements and Auditor’s <strong>Report</strong> for the Year Ended 31 December <strong>2010</strong><br />
International Financial <strong>Report</strong>ing Standards<br />
Consolidated Table of Contents<br />
Financial Statements and Auditor’s <strong>Report</strong> for the Year Ended 31 December <strong>2010</strong><br />
79
URALKALI GROUP<br />
NOTES TO THE CONSOLIDATED FINANCIAL STATEMENTS FOR THE YEAR ENDED 31 DECEMBER <strong>2010</strong><br />
25. MINE FLOODING COSTS<br />
Mine fl ooding costs include costs associated with fl ooding at Mine 1 (Note 5):<br />
Note <strong>2010</strong> 2009<br />
Monitoring costs 28 60<br />
Accrual of provision for compensations 5, 15 - 1,000<br />
Total mine flooding costs 28 1,060<br />
26. INCOME TAX EXPENSE<br />
<strong>2010</strong> 2009<br />
Current income tax expense 2,881 2,005<br />
Deferred income tax 214 134<br />
Income tax expense 3,095 2,139<br />
Income before taxation and non-controlling interests for fi nancial reporting purposes is reconciled to tax<br />
expense as follows:<br />
<strong>2010</strong> 2009<br />
Profit before income tax 19,749 11,234<br />
Theoretical tax charge at effective statutory rates 3,061 1,741<br />
Tax effect of items which are not deductible or assessable for taxation purposes 170 537<br />
Difference in tax rates (117) (193)<br />
Other (19) 54<br />
Consolidated tax charge 3,095 2,139<br />
Most companies of the Group were taxed at rates of 15.5% on taxable profi ts in the Russian Federation, the<br />
Perm region, for <strong>2010</strong> and 2009 respectively.<br />
Domestic deferred income tax has been computed in these consolidated fi nancial statements using the rate<br />
expected to apply in future periods (i.e. 15.5%). Deferred taxes in other countries were computed applying<br />
respective national income tax rates.<br />
31 December<br />
<strong>2010</strong><br />
31 December<br />
2009<br />
Disposal of<br />
subsidiary<br />
<strong>2010</strong><br />
(Charged)/credited<br />
to profi t or loss<br />
<strong>2010</strong><br />
(Charged)/credited<br />
to profi t or loss<br />
2009<br />
Tax effects of taxable temporary differences:<br />
Property, plant and equipment (555) (439) - (116) (97)<br />
Investments (4) (7) - 3 -<br />
Inventories (55) (23) - (32) (23)<br />
Borrowings (21) (25) - 4 (20)<br />
Accounts receivable - (4) - 4 (26)<br />
Tax effects of deductible temporary differences:<br />
(635) (498) - (137) (166)<br />
Finance lease 101 101 - - 36<br />
Accounts receivable 7 - - 7 -<br />
Accounts payable 51 48 - 3 (65)<br />
Inventories - - - - (131)<br />
Tax loss carry forward 85 156 - (71) 156<br />
Disposal of subsidiary - 6 (6) - -<br />
Other 2 18 - (16) 36<br />
246 329 (6) (77) 32<br />
Deferred income tax expense (214) (134)<br />
Total net deferred income tax liability (389) (169)<br />
80 <strong>Uralkali</strong> | <strong>Annual</strong> <strong>Report</strong> <strong>2010</strong><br />
Table of Contents
URALKALI GROUP<br />
NOTES TO THE CONSOLIDATED FINANCIAL STATEMENTS FOR THE YEAR ENDED 31 DECEMBER <strong>2010</strong><br />
26. INCOME TAX EXPENSE (CONTINUED)<br />
31 December <strong>2010</strong> 31 December 2009<br />
Reflected in the statement of financial position as follows:<br />
Deferred income tax asset 258 247<br />
Deferred income tax liability (647) (416)<br />
Deferred income tax liability, net (389) (169)<br />
The Group has not recognised a deferred income tax liability in respect of temporary differences associated<br />
with investments in subsidiaries in the amount of RR 12,697 (31 December 2009: RR 10,921). The Group controls<br />
the timing of the reversal of these temporary differences and does not expect their reversal in the foreseeable<br />
future.<br />
27. POST EMPLOYMENT BENEFITS OBLIGATIONS<br />
In addition to statutory pension benefi ts, the Company also has several post-employment benefi t plans, which<br />
cover most of its employees.<br />
The Company provides fi nancial support of a defi ned benefi t nature to its pensioners. The plans provide for<br />
the payment of retirement benefi ts starting from the statutory retirement age, which is currently 55 for women<br />
and 60 for men. The amount of benefi t depends on a number of parameters, including the length of service<br />
in the Company at retirement. The benefi ts do not vest until and are subject to the employee retiring from the<br />
Company on or after the above ages. This plan was introduced in the Collective Bargaining Agreement concluded<br />
in 2007.<br />
The Company further provides other long-term employee benefi ts such as lump-sum payments upon death of<br />
its current employees and pensioners and a lump-sum payment upon retirement of a defi ned benefi t nature.<br />
As of 31 December <strong>2010</strong> and 31 December 2009 the net liabilities of the defi ned benefi t plan and other postemployment<br />
benefi t plans comprised the following:<br />
<strong>2010</strong> 2009<br />
Present value of defined benefit obligations (DBO) 353 327<br />
Present value of unfunded obligations 353 327<br />
Unrecognised past service cost (71) (67)<br />
Post employment benefits obligations 282 260<br />
The amount of net expense for the defi ned benefi t pension plans recognised in the consolidated statement<br />
of income (Note 22) was as follows:<br />
<strong>2010</strong> 2009<br />
Current service cost 26 22<br />
Interest cost 18 34<br />
Net actuarial gains recognised during the year (2) (70)<br />
Amortisation of past service cost 9 10<br />
Post employment benefits 51 (4)<br />
International Financial <strong>Report</strong>ing Standards<br />
Consolidated Financial Statements and Auditor’s <strong>Report</strong> for the Year Ended 31 December <strong>2010</strong><br />
International Financial <strong>Report</strong>ing Standards<br />
Consolidated Table of Contents<br />
Financial Statements and Auditor’s <strong>Report</strong> for the Year Ended 31 December <strong>2010</strong><br />
81
URALKALI GROUP<br />
NOTES TO THE CONSOLIDATED FINANCIAL STATEMENTS FOR THE YEAR ENDED 31 DECEMBER <strong>2010</strong><br />
27. POST EMPLOYMENT BENEFITS OBLIGATIONS (CONTINUED)<br />
The movements in the liability for post-employment benefi t plans were as follows:<br />
<strong>2010</strong> 2009<br />
Present value of defined benefit obligations (DBO) as of 1 January 327 361<br />
Service cost 26 22<br />
Interest cost 18 34<br />
Actuarial gain (2) (70)<br />
Past service cost 14 -<br />
Benefits paid (30) (20)<br />
Present value of defined benefit obligations (DBO) as of 31 December 353 327<br />
As of 31 December <strong>2010</strong> and 2009, respectively, the principal actuarial assumptions for the post-employment<br />
benefi t plans were as follows:<br />
<strong>2010</strong> 2009<br />
Discount rate 8.00% 11.12%<br />
Salary increase 8.12% 10.16%<br />
Inflation 6.00% 8.00%<br />
Benefits increase (fixed-amount) 6.00% 8.00%<br />
Mortality tables Russia (1986-87) Russia (1986-87)<br />
Net defi cit on the post-employment benefi t plans and the number of experience adjustments for the years ended<br />
31 December <strong>2010</strong> and 2009, respectively, were as follows:<br />
<strong>2010</strong> 2009<br />
Present value of defined benefit obligations (DBO) 353 327<br />
Deficit in plan 353 327<br />
Losses/(gains) arising of experience adjustments on plan liabilities 26 (47)<br />
28. EARNINGS PER SHARE<br />
Basic earnings per share are calculated by dividing the net profi t attributable to equity holders of the Company by<br />
the weighted average number of ordinary shares in issue during the year, excluding treasury shares (Note 14).<br />
The Company has no dilutive potential ordinary shares: therefore, the diluted earnings per share equal the<br />
basic earnings per share.<br />
<strong>2010</strong> 2009<br />
Net profit 16,650 9,089<br />
Weighted average number of ordinary shares in issue (millions) 2,100 2,100<br />
Basic and diluted earnings per share (expressed in RR per share) 7.93 4.33<br />
29. CONTINGENCIES, COMMITMENTS AND OPERATING RISKS<br />
i LEGAL PROCEEDINGS<br />
From time to time and in the normal course of business, claims against the Group are received. On the basis<br />
of its own estimates and both internal and external professional advice, the management is of the opinion that<br />
there are no current legal proceedings or other claims outstanding that could have a material effect on the result<br />
of operations or fi nancial position of the Group which have not been accrued or disclosed in these consolidated<br />
fi nancial statements.<br />
82 <strong>Uralkali</strong> | <strong>Annual</strong> <strong>Report</strong> <strong>2010</strong><br />
Table of Contents
URALKALI GROUP<br />
NOTES TO THE CONSOLIDATED FINANCIAL STATEMENTS FOR THE YEAR ENDED 31 DECEMBER <strong>2010</strong><br />
29. CONTINGENCIES, COMMITMENTS AND OPERATING RISKS (CONTINUED)<br />
i LEGAL PROCEEDINGS (CONTINUED)<br />
Between September and November 2008, a number of purported class action lawsuits were fi led in US federal<br />
district courts in Minnesota and Illinois. Class actions are civil lawsuits typically fi led by a plaintiff seeking money<br />
damages on behalf of the named plaintiff and all others who are similarly situated. The plaintiffs in the suits fi led<br />
in Minnesota and Illinois are various corporations and individuals who have fi led the suits purportedly on behalf<br />
of all direct and indirect purchasers of potash from one of the defendants in the United States. The complaint<br />
alleges price fi xing violations of the US Sherman Act since 1 July 2003. The Company and BPC (Note 9) were<br />
listed among the defendants, as well as certain other potash producers. The plaintiffs in the suits have not claimed<br />
any specifi c amount in damages, and it is premature at this time to assess the Group’s potential exposure to the<br />
plaintiffs’ claims. The management of the Group believes that these suits have no merit and the Group intends<br />
to defend its position vigorously.<br />
At the end of 2009 the Federal Antimonopoly Service (FAS) concluded that the Company violated Clause 1 Part<br />
1 Article 11 of the Federal Law On Protection of Competition (coordinated actions restricting competition). FAS<br />
adopted a respective resolution and prescription and initiated administrative proceedings against the Company.<br />
In June <strong>2010</strong> FAS issued a decision to impose a fi ne on the Company in the amount of RR 104. The Company<br />
challenged the resolution and the prescription in the court of Moscow. The arbitration court of the fi rst instance<br />
has dismissed the Company’s petition. The Company challenged the decision of the court in the arbitration court<br />
of appeal. On 14 December <strong>2010</strong> the arbitration court of appeal sustained the Company’s appeal. This decision<br />
comes into force from the date of the ruling and can be challenged in the arbitration court during subsequent<br />
two months. Also the Company has challenged the decision of FAS to impose a fi ne in the court of Perm region.<br />
The proceedings were stayed until the court decision comes into force. The Company’s management estimates<br />
the possibility of this liability to crystallise as “possible” and accordingly has not recognised any provisions in<br />
respect of this risk.<br />
On the basis of its own estimates, as well as both internal and external professional advice, the management<br />
is of the opinion that no material losses will be incurred in respect of these claims.<br />
ii TAX LEGISLATION<br />
Russian tax, currency and customs law are subject to varying interpretations and changes, which can occur<br />
frequently. The management’s interpretation of such laws as applied to the Group’s transactions and activity of<br />
the Group may be challenged by the relevant regional and federal authorities.<br />
The Russian tax authorities may be taking a more aggressive position in their interpretation of the law and<br />
assessments, and it is possible that transactions and activities that have not been challenged in the past may now<br />
or in the future be challenged. This includes them following guidance from the Supreme Arbitration Court<br />
for anti-avoidance claims based on reviewing the substance and business purposes of the transactions, and it is<br />
possible that this will signifi cantly increase the level and frequency of scrutiny from the tax authorities. As a result,<br />
signifi cant additional taxes, penalties and interest may be assessed. Fiscal periods remain open to review by the<br />
authorities in respect of taxes for three calendar years proceeding the year of review. Under certain circumstances,<br />
reviews may cover longer periods.<br />
Russian transfer pricing legislation provides the possibility for the tax authorities to make transfer pricing<br />
adjustments and impose additional tax liabilities in respect of certain controllable transactions, provided that<br />
the tax authorities prove that the transaction price established by the parties deviates by more than 20% from<br />
the market price. Controllable transactions include transactions with interdependent parties under the Russian<br />
Tax Code, all cross-border transactions (irrespective of whether they are performed between related or unrelated<br />
parties), transactions where the price applied by a taxpayer deviates by more than 20% from the price applied<br />
in similar transactions by the same taxpayer within a short period of time. There is no formal guidance as to<br />
how these rules should be applied in practice. In the past, arbitration court practice in this respect has been<br />
contradictory.<br />
International Financial <strong>Report</strong>ing Standards<br />
Consolidated Financial Statements and Auditor’s <strong>Report</strong> for the Year Ended 31 December <strong>2010</strong><br />
International Financial <strong>Report</strong>ing Standards<br />
Consolidated Table of Contents<br />
Financial Statements and Auditor’s <strong>Report</strong> for the Year Ended 31 December <strong>2010</strong><br />
83
URALKALI GROUP<br />
NOTES TO THE CONSOLIDATED FINANCIAL STATEMENTS FOR THE YEAR ENDED 31 DECEMBER <strong>2010</strong><br />
29. CONTINGENCIES, COMMITMENTS AND OPERATING RISKS(CONTINUED)<br />
ii TAX LEGISLATION (CONTINUED)<br />
Tax liabilities arising from intercompany transactions are determined using actual transaction prices. It is<br />
possible, with the evolution of the interpretation of transfer pricing rules in the Russian Federation and the<br />
changes in the approach of the Russian tax authorities, that such transfer prices could potentially be challenged<br />
in the future. Given the nature of the current Russian transfer pricing rules, the impact of any such challenge<br />
cannot be reliably estimated; however, it may be signifi cant.<br />
The Group’s management believes that its interpretation of the relevant legislation is appropriate and that the<br />
Group’s tax, currency legislation and customs positions will be sustained. Accordingly, as of 31 December <strong>2010</strong> and<br />
31 December 2009, no provision for potential tax liabilities had been recorded. Management will continue to<br />
monitor the situation as legislation and practice evolve in the jurisdictions in which the Group operates.<br />
iii INSURANCE POLICIES<br />
The Company generally enters into insurance agreements when it is required by statutory legislation. The<br />
insurance agreements do not cover the risks of damage to third parties’ property resulting from the Group’s<br />
underground activities and the risks refl ected in Note 5; therefore, no losses from the fl ooding of Mine 1 are<br />
expected to be compensated.<br />
iv ENVIRONMENTAL MATTERS<br />
The enforcement of environmental regulation in the Russian Federation is evolving and the enforcement<br />
posture of government authorities is continually being reconsidered. The Group periodically evaluates its<br />
obligations under environmental regulations. In the current enforcement climate under existing legislation,<br />
management believes that there are no signifi cant liabilities for environmental damage due to legal requirements<br />
except for those mentioned in Note 5. The Company’s mining activities and the recent mine fl ooding may cause<br />
subsidence that may affect the Company’s facilities, and those of the city of Berezniki, state organisations and<br />
others.<br />
v OPERATING ENVIRONMENT OF THE GROUP<br />
Whilst there have been improvements in economic trends in the Russian Federation, the country continues to display<br />
certain characteristics of an emerging market. These characteristics include, but are not limited to, the existence of<br />
a currency that is in practice not convertible in most countries outside of the Russian Federation and relatively<br />
high infl ation. The tax, currency and customs legislation within the Russian Federation is subject to varying<br />
interpretations, and changes, which can occur frequently.<br />
The future economic direction of the Russian Federation is largely dependent upon the effectiveness of<br />
economic, fi nancial and monetary measures undertaken by the Government, together with tax, legal, regulatory,<br />
and political developments.<br />
Management is unable to reliably determine the effects on the Group’s future fi nancial position of any further<br />
deterioration in the Group’s operating environment. It believes it is taking all necessary measures to support the<br />
sustainability and growth of the Group’s business in the current circumstances.<br />
vi CAPITAL EXPENDITURE COMMITMENTS<br />
As of 31 December <strong>2010</strong> the Group had contractual commitments for the purchase of property, plant and<br />
equipment from third parties for RR 5,508 (31 December 2009: RR 5,012).<br />
The Group has already allocated the necessary resources in respect of these commitments. The Group believes<br />
that future net income and funding will be suffi cient to cover these and any similar such commitments.<br />
84 <strong>Uralkali</strong> | <strong>Annual</strong> <strong>Report</strong> <strong>2010</strong><br />
Table of Contents
URALKALI GROUP<br />
NOTES TO THE CONSOLIDATED FINANCIAL STATEMENTS FOR THE YEAR ENDED 31 DECEMBER <strong>2010</strong><br />
29. CONTINGENCIES, COMMITMENTS AND OPERATING RISKS(CONTINUED)<br />
vii GUARANTEES<br />
Guarantees are irrevocable assurances that the Group will make payments in the event that another party<br />
cannot meet its obligations. As of 31 December <strong>2010</strong> the Group issued guarantees in favour of third parties in<br />
the amount of RR 23 (31 December 2009: RR 3).<br />
30. FINANCIAL RISK MANAGEMENT<br />
30.1. FINANCIAL RISK FACTORS<br />
The Group’s activities expose it to a variety of fi nancial risks: market risk (including currency risk, fair value<br />
interest rate risk, cash fl ow interest rate risk and price risk), credit risk and liquidity risk. Overall risk management<br />
procedures adopted by the Group focus on the unpredictability of fi nancial and commodity markets and seek to<br />
minimise potential adverse effects on the Group’s fi nancial performance.<br />
(a) Market risk<br />
(i) Foreign exchange risk<br />
Foreign exchange risk arises when future commercial transactions or recognised assets or liabilities are<br />
denominated in a currency that is different from the functional currency of the companies of the Group.<br />
The Group operates internationally and exports approximately 87% of potash fertilisers produced. As a<br />
result the Group is exposed to foreign exchange risk arising from various currency exposures. Export sales are<br />
denominated in a hard currency, namely in US$ or Euro. The Group maintains a balance between US$ and Euro<br />
sales in order to mitigate the risk of US$/Euro exchange rate fl uctuations. The Company is exposed to the risk<br />
of RR/US$ and RR/Euro exchange rates fl uctuations: however the Company is currently benefi ting from weak<br />
exchange rate of the Rouble against the US$ and Euro, since all the Company’s major expenses are denominated<br />
in Roubles.<br />
As of 31 December <strong>2010</strong>, if the RR had weakened/strengthened by 10% against the US$ and Euro with all other<br />
variables held constant, the post-tax profi t for the year would have been RR 384 higher/lower (31 December 2009:<br />
RR 722 lower/higher), mainly as a result of foreign exchange gains/losses on the translation of US$ and Euro<br />
denominated trade receivables, cash in bank, deposits and foreign exchange losses/gains on the translation of<br />
US$ denominated borrowings.<br />
(ii) Price risk<br />
The Group is not exposed to commodity price risk, since the Group does not enter in any operations with<br />
fi nancial instruments whose value is exposed to the value of commodities traded on the public market.<br />
(iii) Interest rate risk<br />
The Group’s income and operating cash fl ows are exposed to market interest rates changes. The Group is<br />
exposed to fair value interest rate risk through market value fl uctuations of interest bearing short- and long-term<br />
borrowings, whose interest rates comprise a fi xed component. Borrowings issued at variable rates expose the<br />
Group to cash fl ow interest rate risk (Note 16). The Group has interest-bearing assets which are at fi xed interest<br />
rates (Note 13).<br />
The objective of managing interest rate risk is to prevent losses due to adverse changes in market interest rate<br />
level. The Group analyses its interest rate exposure on a dynamic basis. Various scenarios are simulated taking<br />
into consideration refi nancing, the renewal of existing positions and alternative fi nancing.<br />
International Financial <strong>Report</strong>ing Standards<br />
Consolidated Financial Statements and Auditor’s <strong>Report</strong> for the Year Ended 31 December <strong>2010</strong><br />
International Financial <strong>Report</strong>ing Standards<br />
Consolidated Table of Contents<br />
Financial Statements and Auditor’s <strong>Report</strong> for the Year Ended 31 December <strong>2010</strong><br />
85
URALKALI GROUP<br />
NOTES TO THE CONSOLIDATED FINANCIAL STATEMENTS FOR THE YEAR ENDED 31 DECEMBER <strong>2010</strong><br />
30. FINANCIAL RISK MANAGEMENT (CONTINUED)<br />
30.1. FINANCIAL RISK FACTORS (CONTINUED)<br />
(a) MARKET RISK (CONTINUED)<br />
(iii) INTEREST RATE RISK (CONTINUED)<br />
As of 31 December <strong>2010</strong>, if Libor rates on US$ denominated borrowings had been 100 basis points higher/<br />
lower with all other variables held constant, post-tax profi t for the year would have been RR 113 (31 December<br />
2009: RR 130) lower/higher, mainly as a result of higher/lower interest expense on fl oating rate borrowings.<br />
(b) Credit risk<br />
Credit risk arises from the possibility that counterparties to transactions may default on their obligations,<br />
causing fi nancial losses for the Group. The objective of managing credit risk is to prevent losses of liquid funds<br />
deposited with or invested in such counterparties. Financial assets, which potentially subject Group entities to<br />
credit risk, consist primarily of trade receivables, cash and bank deposits. The maximum exposure to credit<br />
risk resulting from fi nancial assets is equal to the carrying amount of the Group’s fi nancial assets – RR 18,050<br />
(31 December 2009: RR 9,783).<br />
The Group is exposed to concentrations of credit risk. As of 31 December <strong>2010</strong> the Group had eight counterparties<br />
(31 December 2009: two counterparties) with aggregated receivables balances above RR 100. The total aggregate<br />
amount of these balances was RR 2,173 (31 December 2009: RR 448) or 65% of the gross amount of fi nancial trade<br />
and other receivables (31 December 2009: 24%). Cash and short-term deposits are placed in banks and fi nancial<br />
institutions, which are considered at the time of deposit to have minimal risk of default. The Group has no other<br />
signifi cant concentrations of credit risk.<br />
Trade receivables are subject to a policy of active credit risk management which focuses on an assessment<br />
of ongoing credit evaluation and account monitoring procedures. The objective of the management of trade<br />
receivables is to sustain the growth and profi tability of the Group by optimising asset utilisation while at the same<br />
time maintaining risk at an acceptable level.<br />
The effective monitoring and controlling of credit risk is performed by the Group’s corporate treasury function.<br />
The credit quality of each new customer is analysed before the Group enters into contractual agreements. The<br />
credit quality of customers is assessed taking into account their fi nancial position, past experience, country of<br />
origin and other factors. The management believes that the country of origin is one of the major factors affecting<br />
a customer’s credit quality and makes a corresponding analysis (Note 12). Most customers from developing<br />
countries are supplied on secured payment terms.<br />
These terms include deliveries against opened letters of credit and arrangements with banks on non-recourse<br />
discounting of promissory notes received from customers. Only customers from developed countries with a high<br />
reputation are supplied on a credit basis.<br />
Although the collection of receivables could be infl uenced by economic factors, management believes that<br />
there is no signifi cant risk of loss to the Group beyond the provision already recorded (Note 12).<br />
The table below shows the credit quality of cash, cash equivalents and letters of credit balances on the reporting<br />
date, based on the credit ratings of independent agency Moody’s Investor Services (for the cash balances held on<br />
accounts in Russia the locally tailored ratings are used) as of 31 December <strong>2010</strong> and 2009:<br />
Rating <strong>2010</strong> 2009<br />
Aa3 6,616 3,407<br />
A1 1,780 902<br />
Aaa.ru 5,431 891<br />
Baa2.ru 495 793<br />
B1 167 393<br />
Aa2 387 165<br />
Unrated* 36 27<br />
Total 14,912 6,578<br />
* Unrated balance contains cash on hand and other cash equivalents.<br />
86 <strong>Uralkali</strong> | <strong>Annual</strong> <strong>Report</strong> <strong>2010</strong><br />
Table of Contents
URALKALI GROUP<br />
NOTES TO THE CONSOLIDATED FINANCIAL STATEMENTS FOR THE YEAR ENDED 31 DECEMBER <strong>2010</strong><br />
30. FINANCIAL RISK MANAGEMENT (CONTINUED)<br />
30.1. FINANCIAL RISK FACTORS (CONTINUED)<br />
(c) Liquidity risk<br />
In accordance with prudent liquidity risk management, the management of the Group aims to maintain<br />
suffi cient cash in order to meet its obligations. Group treasury aims to maintain suffi cient level of liquidity<br />
based on monthly cash fl ow budgets, which are prepared for the year ahead and continuously updated during<br />
the year.<br />
Liquidity risk is defi ned as the risk that an entity will encounter diffi culty in meeting obligations associated<br />
with fi nancial liabilities.<br />
The table below analyses the Group’s fi nancial liabilities into relevant maturity groupings based on the time<br />
remaining from the reporting to the contractual maturity date. The amounts disclosed in the table are the<br />
contractual undiscounted cash fl ows at spot rates.<br />
Note Less than 1 year Between 2 and 5 years Over 5 years<br />
As of 31 December <strong>2010</strong><br />
Trade and other payables 17 2,121 - -<br />
Borrowings 2,999 9,535 -<br />
Finance leasing<br />
As of 31 December 2009<br />
16 49 196 2,132<br />
Trade and other payables 17 1,758 - -<br />
Borrowings 6,071 8,166 -<br />
Finance leasing 16 49 196 2,157<br />
30.2. CAPITAL RISK MANAGEMENT<br />
The Group’s objectives when managing capital are to safeguard the Group’s ability to continue as a going<br />
concern, to provide returns for shareholders and benefi ts for other stakeholders and to maintain an optimal<br />
capital structure in order to reduce the cost of capital. The Group considers total capital to be total equity as<br />
shown in the consolidated statement of fi nancial position.<br />
Consistent with others in the industry, the Group monitors capital on a debt to equity ratio basis. This ratio is<br />
calculated as the sum of long- and short-term bank borrowings divided by total equity.<br />
The debt to equity ratios as of 31 December <strong>2010</strong> and 31 December 2009 were as follows:<br />
31 December <strong>2010</strong> 31 December 2009<br />
Total bank borrowings (Note 16) 11,253 13,463<br />
Total equity 56,797 43,715<br />
Debt to equity ratio 20% 31%<br />
As of 31 December <strong>2010</strong> management has set a level of 30% debt to equity ratio as a long-term strategic goal.<br />
31. FAIR VALUE OF FINANCIAL INSTRUMENTS<br />
Fair value is the amount at which a fi nancial instrument could be exchanged in a current transaction between<br />
willing parties, other than in a forced sale or liquidation, and is best evidenced by an active quoted market price.<br />
The estimated fair values of fi nancial instruments have been determined by the Group using available market<br />
information, where it exists, and appropriate valuation methodologies. However, judgement is necessarily required<br />
to interpret market data to determine the estimated fair value. The Russian Federation continues to display<br />
some characteristics of an emerging market and economic conditions continue to limit the volume of activity<br />
in the fi nancial markets. Market quotations may be outdated or refl ect distress sale transactions, and therefore<br />
not represent fair values of fi nancial instruments. Management has used all available market information in<br />
estimating the fair value of fi nancial instruments.<br />
International Financial <strong>Report</strong>ing Standards<br />
Consolidated Financial Statements and Auditor’s <strong>Report</strong> for the Year Ended 31 December <strong>2010</strong><br />
International Financial <strong>Report</strong>ing Standards<br />
Consolidated Table of Contents<br />
Financial Statements and Auditor’s <strong>Report</strong> for the Year Ended 31 December <strong>2010</strong><br />
87
URALKALI GROUP<br />
NOTES TO THE CONSOLIDATED FINANCIAL STATEMENTS FOR THE YEAR ENDED 31 DECEMBER <strong>2010</strong><br />
31. FAIR VALUE OF FINANCIAL INSTRUMENTS (CONTINUED)<br />
Financial instruments carried at fair value. Trading and available-for-sale investments are carried on the<br />
consolidated statement of fi nancial position at their fair value. Fair values were determined based on quoted<br />
market prices.<br />
Financial assets carried at amortised cost. The fair value of fl oating rate instruments is normally their carrying<br />
amount. The estimated fair value of fi xed interest rate instruments is based on estimated future cash fl ows expected<br />
to be received discounted at current interest rates for new instruments with similar credit risk and remaining<br />
maturity. Discount rates used depend on the credit risk of the counterparty. Carrying amounts of trade receivables<br />
approximate fair values. Cash and cash equivalents are carried at amortised cost which approximates current fair<br />
value.<br />
Liabilities carried at amortised cost. The fair value is based on quoted market prices, if available. The estimated<br />
fair value of fi xed interest rate instruments with stated maturity, for which a quoted market price is not available,<br />
was estimated based on expected cash fl ows discounted at current interest rates for new instruments with similar<br />
credit risk and remaining maturity. The fair value of liabilities repayable on demand or after a notice period<br />
(“demandable liabilities”) is estimated as the amount payable on demand, discounted from the fi rst date that the<br />
amount could be required to be paid. Estimated fair values of borrowings are presented in Note 16.<br />
32. EVENTS AFTER REPORTING DATE<br />
COMBINATION OF THE OJSC URALKALI AND OJSC SILVINIT<br />
On 20 December <strong>2010</strong> the Boards of Directors of the Company and OJSC Silvinit announce the proposed<br />
combination of the Company with OJSC Silvinit, creating a leader in the global potash market.<br />
The proposed combination will be effected through the acquisition of 1,565,151 OJSC Silvinit ordinary<br />
shares, representing approximately 20% of its ordinary share capital, for US$ 894.5 per ordinary OJSC Silvinit<br />
share, or a total cash consideration of US$ 1.4 billion, completed on 28 February 2011, and implementation of a<br />
statutory merger of the Company and OJSC Silvinit, through the issuance of OJSC <strong>Uralkali</strong> ordinary shares for<br />
the remaining ordinary and preferred share capital of OJSC Silvinit. In the proposed merger, OJSC Silvinit will<br />
cease to exist and OJSC Silvinit shareholders will receive 133.4 OJSC <strong>Uralkali</strong> ordinary shares for each 1 ordinary<br />
share in OJSC Silvinit and 51.8 OJSC <strong>Uralkali</strong> ordinary shares for each 1 preferred share in OJSC Silvinit.<br />
On 4 February 2011 the proposed combination of the Company with OJSC Silvinit had been approved by<br />
shareholders of both companies voting at their Extraordinary General Shareholders Meetings. The proposed<br />
combination is expected to be completed in May 2011, subject to receipt of required governmental and regulatory<br />
approvals.<br />
On 24 February 2011 OJSC Acron and other several OJSC Silvinit’s minority shareholders fi led a claim against<br />
the Company and OJSC Silvinit in the Perm Territory Arbitrage (Commercial) Court seeking to invalidate<br />
decisions approved by the Extraordinary General Shareholders Meeting of OJSC Silvinit on 4 February 2011,<br />
and the merger agreement entered into between the Company and OJSC Silvinit.<br />
On 28 February 2011 the Court issued a temporary injunction prohibiting the implementation of the merger<br />
agreement, the registration of OJSC <strong>Uralkali</strong> new share issuances and the reports on results of the share issuances,<br />
and the registration of OJSC Silvinit's termination upon the merger. The injunction imposed by the Court did<br />
not affect completion of acquisition by OJSC <strong>Uralkali</strong> of approximately 20% ordinary shares in OJSC Silvinit.<br />
On 18 March 2011 the Court partially lifted the injunction imposed in connection with the claim. The only<br />
measure remaining in force by the court relates to the prohibition on the Federal Service on Financial Markets<br />
from registering the OJSC <strong>Uralkali</strong> share issuance and report on results of share issuance to be placed as a result<br />
of conversion of OJSC Silvinit shares into OJSC <strong>Uralkali</strong> shares upon completion of the merger in accordance with<br />
the merger agreement. OJSC <strong>Uralkali</strong> and OJSC Silvinit challenged the injuction in the Arbitration Appellate<br />
Court. The hearing on the appeal is scheduled for 13 April 2011.<br />
88 <strong>Uralkali</strong> | <strong>Annual</strong> <strong>Report</strong> <strong>2010</strong><br />
Table of Contents
URALKALI GROUP<br />
NOTES TO THE CONSOLIDATED FINANCIAL STATEMENTS FOR THE YEAR ENDED 31 DECEMBER <strong>2010</strong><br />
32. EVENTS AFTER REPORTING DATE (CONTINUED)<br />
The preliminary hearing on the merits of the claim is scheduled for 12 April 2011. Should the court's decision<br />
on the merits of the claims be in favour of the claimants it may hinder the merger of OJSC <strong>Uralkali</strong> and OJSC<br />
Silvinit.<br />
FINANCING OF THE COMBINATION<br />
On 22 February 2011 the Company entered into loan facility agreement with Sberbank for approximately RR<br />
12 billion with a maturity of two years in conjunction with a cross-currency interest rate swap.<br />
On 25 February 2011 <strong>Uralkali</strong> has fi nished the placement of its debut exchange-traded bonds admitted to<br />
trading on 12 January 2011 for total nominal value of RR 30 billion at 8.25% p.a. with 3 years maturity. Together<br />
with the exchange-traded bond placement, the Company entered into a cross-currency interest rate swap<br />
transaction, conventing its ruble bond obligations into US$.<br />
The funds received as a result of bonds placement and loan facility provided to <strong>Uralkali</strong> along with interest<br />
rate currency swaps were used to fi nance the acquisition of approximately 20% stake in Silvinit.<br />
INVESTMENT IN JOINTLY CONTROLLED ENTITIES<br />
In January 2011 Belaruskali sold a 0.001% share in BPC to Grodno Azot. According to the amended BPC charter<br />
all decisions on shareholders meeting will continued to be taken by a majority of 75%, and the BPC operations<br />
remained to be under joint control of Belaruskali and the Company.<br />
International Financial <strong>Report</strong>ing Standards<br />
Consolidated Financial Statements and Auditor’s <strong>Report</strong> for the Year Ended 31 December <strong>2010</strong><br />
International Financial <strong>Report</strong>ing Standards<br />
Consolidated Table of Contents<br />
Financial Statements and Auditor’s <strong>Report</strong> for the Year Ended 31 December <strong>2010</strong><br />
89
CORPORATE AND SOCIAL<br />
RESPONSIBILITY<br />
EMPLOYEES<br />
Highly-skilled employees are <strong>Uralkali</strong>’s main asset and<br />
the foundation for its future growth. The Company<br />
is, therefore, deeply committed to constantly<br />
improving staff training and development: <strong>Uralkali</strong><br />
works closely with higher education institutions and<br />
funds specialist training for its employees.<br />
STAFF TRAINING AND<br />
DEVELOPMENT<br />
In <strong>2010</strong>, more than 6 thousand employees<br />
received training through various vocational<br />
education, professional development and career<br />
training programmes. 4,2 thousand managers<br />
and professionals, as well as about 2 thousand<br />
workers, were trained at various refresher courses<br />
and vocational education programmes. <strong>Uralkali</strong><br />
sponsored vocational training and specialist higher<br />
education for 100 employees in <strong>2010</strong>. The total cost of<br />
staff training and development was 76 million RUR,<br />
which is 1.7 times higher than the similar costs of the<br />
Company in 2009.<br />
MANAGEMENT AND STAFF<br />
RESERVE DEVELOPMENT<br />
In <strong>2010</strong> <strong>Uralkali</strong> continued the implementation<br />
of its unique programme of management and staff<br />
reserve development which is run in cooperation with<br />
the St. Petersburg International Management Institute.<br />
236 employees, which include 23 top level managers,<br />
70 mid-level managers, 43 employees who comprise<br />
the management personnel and 100 employees of<br />
the line staff reserve, received training through the<br />
programme. In December <strong>2010</strong> mid-level managers<br />
fi nished their training, while other participants of the<br />
programme continue their studies.<br />
This programme allows employees to receive systematised<br />
knowledge on business-processes and up-todate<br />
approaches to enterprise management as well as<br />
develop their business and professional skills, which are<br />
essential for successful management. The programme<br />
involves professionals at all levels, which helps to improve<br />
the overall management of the Company.<br />
CORPORATE CULTURE<br />
DEVELOPMENT<br />
In <strong>2010</strong> <strong>Uralkali</strong> continued to focus on developing<br />
a goal-oriented corporate culture. The Company has<br />
changed its system of remuneration and introduced<br />
a new corporate award: “The Best Employee of the<br />
Year”. Based on the results of 2009, 148 employees<br />
received this award in the following categories:<br />
“Professionalism”, “Team Work”, “Transfer of<br />
Experience”, “Prospect”.<br />
In November <strong>Uralkali</strong> approved its “Code of<br />
Corporate Culture” which refl ects the Company’s<br />
mission, vision and values as well as defining its<br />
main principles, standards, rules of conduct and<br />
cooperation between employees.<br />
During <strong>2010</strong> the Company celebrated various<br />
professional holidays – Chemist’s Day, Miner’s Day, as<br />
well as held corporate events, the main one of which<br />
was the Company Day. In addition, the Company<br />
organised a sports contest involving 13 different<br />
sports, and arranged a 50% discount for its employees<br />
to participate in health and fi tness recreation events<br />
in the swimming pool and ski lodge. In <strong>2010</strong> <strong>Uralkali</strong><br />
spent a total of 26.1 million RUR on corporate events<br />
and health and fi tness programmes.<br />
90 <strong>Uralkali</strong> | <strong>Annual</strong> <strong>Report</strong> <strong>2010</strong> Table of Contents
CORPORATE AND SOCIAL RESPONSIBILITY<br />
LABOUR PROTECTION AND INDUSTRIAL SAFETY<br />
The production of potash fertiliser is a complex<br />
engineering process which requires stringent safety<br />
measures. Industrial safety, labour protection and<br />
fi re fi ghting systems are installed and in operation<br />
at all <strong>Uralkali</strong>’s facilities. Workplace inspections<br />
are conducted every year on a regular basis, and<br />
personnel are trained and certifi ed in the fi eld of<br />
industrial safety rules and standards.<br />
<strong>Uralkali</strong> is constantly improving its industrial<br />
safety systems and invests heavily in labour protection<br />
programmes. The Company’s expenses on labour<br />
safety was 107.2 million RUR in 2008, 267.4 million<br />
RUR in 2009, and 243.5 million RUR in <strong>2010</strong>.<br />
The decrease in investment in <strong>2010</strong> is related to<br />
outsourcing of underground repairs services.<br />
During <strong>2010</strong> <strong>Uralkali</strong> continued its work on<br />
developing and improving the monitoring of<br />
observation of industrial safety requirements at<br />
hazardous locations throughout the production<br />
chain. At present, over 1,200 employees have<br />
completed training at accredited training centres<br />
and are certified in industrial safety and labour<br />
protection.<br />
In September <strong>2010</strong> the West-Urals Agency of the<br />
Federal Service for Environmental, Technological<br />
and Nuclear Supervision conducted an integrated<br />
inspection of labour protection and industrial safety<br />
at all <strong>Uralkali</strong> facilities. Following this inspection the<br />
Company has worked out a plan of action to tackle<br />
the violations that were uncovered.<br />
The effi ciency of the Company’s efforts in labour<br />
protection is supported by the statistics: throughout<br />
the last several years <strong>Uralkali</strong> experienced a<br />
steady decline in the number of work-related<br />
injuries. Over the period from 2007 to <strong>2010</strong> the<br />
number of accidents fell by half.<br />
Table of Contents<br />
In <strong>2010</strong> a total of 10 accidents happened<br />
throughout <strong>Uralkali</strong>’s operations, which is 7<br />
accidents fewer than in 2009. Moreover, in <strong>2010</strong><br />
accidents took place only at Berezniki-2 and<br />
Berezniki-4. No work-related injuries were recorded<br />
at <strong>Uralkali</strong>’s other operational divisions. In addition,<br />
in <strong>2010</strong> the number of fatal accidents and accidents<br />
that resulted in heavy injuries decreased; no group<br />
injuries happened.<br />
Cause of Accident 2009 <strong>2010</strong><br />
Process violations 0 1<br />
Traffic rules violations 3 1<br />
Safety rules violations when operating a<br />
transport vehicle 3 1<br />
Unsatisfactory organisation of production<br />
process 1 2<br />
Personal negligence 5 0<br />
Other 5 5<br />
TOTAL: 17 10<br />
Accident Frequency Rate I<br />
Total amount of accidents Accidents frequency<br />
8<br />
6<br />
4<br />
2<br />
2.2<br />
2.6<br />
2.3<br />
4 4<br />
2 2 2 2<br />
1 1 1<br />
0 0<br />
2006 2007 2008 2009 <strong>2010</strong><br />
Note<br />
I. Accident frequency rate is calculated as number of reported accidents<br />
x 1000/average headcount of <strong>Uralkali</strong><br />
2.2<br />
1.4<br />
Fatal Serious Group Frequency<br />
3<br />
3<br />
2<br />
1<br />
91
CORPORATE AND SOCIAL RESPONSIBILITY<br />
ENVIRONMENT<br />
<strong>Uralkali</strong> operates on the basis of strict compliance<br />
with the environmental protection law. The Company<br />
is aware of its corporate and social responsibility to<br />
protect the environment, and therefore, constantly<br />
strives to improve levels of environmental safety. All<br />
<strong>Uralkali</strong>’s operations are carried out in compliance<br />
with the regulations of the environmental protection<br />
law and a programme of measures to protect the<br />
environment is developed every year.<br />
In <strong>2010</strong> the programme included 12 measures<br />
aimed at protecting the atmosphere and water basin;<br />
improving waste disposal and the internal monitoring<br />
systems and training staff in environmental<br />
protection. The Company planned to allocate about<br />
432 million RUR for the programme; however,<br />
<strong>Uralkali</strong> exceeded its targets and carried out 20<br />
environmental protection measures, the total cost<br />
of which amounted to 595 million RUR.<br />
In <strong>2010</strong> the rate of discharge<br />
of air pollutants was<br />
0.281 kg per tonne of potash,<br />
which is 30% lower than<br />
the corresponding rate<br />
in 2009<br />
AIR PROTECTION<br />
In <strong>2010</strong> the state-of-the-art drying furnace<br />
manufactured by Binder replaced the old gasjet<br />
dryers in the drying shop of Berezniki-2. The<br />
Company expects that it will signifi cantly decrease<br />
the potassium chloride and sodium chloride dust<br />
emissions. In addition, a new gas and dust collector<br />
was installed in the drying shop of Berezniki-4,<br />
92 <strong>Uralkali</strong> | <strong>Annual</strong> <strong>Report</strong> <strong>2010</strong><br />
<strong>Uralkali</strong>’s Environmental Protection Costs<br />
mln RUR<br />
600<br />
500<br />
400<br />
300<br />
200<br />
100<br />
0<br />
317<br />
2009 <strong>2010</strong><br />
which will increase the efficiency of air filtration<br />
in the facility. According to the results of <strong>2010</strong>, the<br />
Company did not exceed the annual air pollution<br />
and emission norms.<br />
WATER PROTECTION<br />
595<br />
<strong>Uralkali</strong> production involves significant fresh<br />
water consumption and water borne sewage.<br />
Throughout <strong>2010</strong> the Company conducted<br />
hydrological and geological monitoring of its water<br />
bodies to prevent negative effects of production<br />
facilities on underground and land surface waters.<br />
Biological water cleaning facilities were upgraded<br />
at Berezniki-2 and Berezniki-3, which helped to<br />
In <strong>2010</strong> <strong>Uralkali</strong>’s gross air<br />
pollutant emissions were<br />
lower than the maximum<br />
allowed emissions almost<br />
by 2.5 times<br />
Table of Contents
CORPORATE AND SOCIAL RESPONSIBILITY<br />
In <strong>2010</strong> the rate of industrial<br />
water discharge intensity<br />
was 1.2 m 3 per tonne<br />
of potash, which is by 32%<br />
lower than the corresponding<br />
rate in 2009<br />
maintain the enforceable levels of water borne<br />
sewage disposal into the Lenva River.<br />
The water recycling supply system at Berezniki-1<br />
was upgraded, which significantly increased<br />
its reliability and reduced levels of waste water.<br />
Construction and installation of a new mineralised<br />
water cooling tower as well as upgrading the existent<br />
fresh water cooling tower at Berezniki-4 will allow<br />
the Company to decrease its industrial water<br />
consumption by 32%.<br />
Table of Contents<br />
WASTE UTILISATION<br />
The Company is constantly working to minimise<br />
the surface storage of production waste. In <strong>2010</strong>,<br />
potassium chloride solution of halite wastes reduced<br />
surface storage by almost 700 thousand tonnes. In<br />
addition, over 200 thousand tonnes of clay-salt mud<br />
was deposited underground at Berezniki-4.<br />
Throughout <strong>2010</strong> the Company carried out the<br />
utilisation of 1–4 class hazard wastes. In addition, the<br />
Company developed a project to construct sites for<br />
temporary waste storage at the mines and has started<br />
its realisation which will prevent soil and surface<br />
water pollution.<br />
Waste water removal at <strong>Uralkali</strong> amounted to<br />
2,195 thousand m 3 in <strong>2010</strong>, which is 18% lower than<br />
the rate of waste water removal in 2009, and 40%<br />
lower than the permissible limit.<br />
Waste Water discharge<br />
intensity at <strong>Uralkali</strong><br />
diminished by almost<br />
2.4 times — from 1.02 m 3 for<br />
a tonne in 2009 to 0.43 m 3<br />
for a tonne in <strong>2010</strong><br />
93
CORPORATE AND SOCIAL RESPONSIBILITY<br />
SOCIAL PROGRAMMES<br />
<strong>Uralkali</strong> aims to be one of the most attractive<br />
employers in the Russian mining industry. One<br />
of the Company’s main priorities is to provide<br />
assistance and support, as well as additional benefi ts<br />
and social services to its employees. The Company<br />
believes that motivating its employees is essential<br />
for improving effi ciency and productivity. In <strong>2010</strong><br />
the Company allocated more than 283 million RUR<br />
for implementing social programmes for its staff<br />
which include a housing programme, health care<br />
and rehabilitation, etc.<br />
In <strong>2010</strong> <strong>Uralkali</strong> continued to participate in<br />
social projects in Berezniki where the Company’s<br />
production facilities are located. The Company<br />
allocated 54 million RUR for implementation of<br />
these projects. In addition, <strong>Uralkali</strong> supports the<br />
94 <strong>Uralkali</strong> | <strong>Annual</strong> <strong>Report</strong> <strong>2010</strong><br />
schools of Berezniki on a long-term basis and has<br />
built a new children’s day care facility as well as a<br />
new outpatients’ clinic.<br />
CORPORATE MEALS<br />
<strong>Uralkali</strong> believes that healthy nutrition is essential<br />
for the well-being and productivity of its employees.<br />
The Company not only provides corporate catering<br />
for staff, but also seeks to offset the major part of<br />
the cost of meals. The programme of Corporate<br />
Meals has been run at <strong>Uralkali</strong> for several years,<br />
under which employees can buy wholesome cooked<br />
meals at a 70% discount. Food quality, menu, and<br />
the quality of service are strictly monitored in the<br />
seven cafeterias and seven canteens which operate<br />
at <strong>Uralkali</strong> facilities. Over 50 million RUR went into<br />
catering in <strong>2010</strong>, an increase of 20% from 2009.<br />
HEALTH CARE<br />
<strong>Uralkali</strong> cares about the health of its employees<br />
and makes every effort to ensure that they receive<br />
high-quality, affordable healthcare. <strong>Uralkali</strong><br />
employees have access to a corporate medical<br />
centre (<strong>Uralkali</strong>-Med Polyclinic, LLC) – both under<br />
the state’s Obligatory Medical Insurance (OMI)<br />
scheme, and the Company’s voluntary medical<br />
insurance (VMI). Employees who have worked at<br />
the Company for more than one year are eligible<br />
for the extended services package under the VMI<br />
programme. <strong>Uralkali</strong> spent a total of 22.4 million<br />
RUR on voluntary medical insurance programme<br />
in <strong>2010</strong>, 2.3 million RUR of which went to pay for<br />
medical check-ups, surgeries and medication of 356<br />
employees.<br />
In <strong>2010</strong> a new department of industrial health<br />
care was organised at <strong>Uralkali</strong>-Med Polyclinic. The<br />
new department will let doctors monitor employees’<br />
health, detect threats of illnesses at early stages, and<br />
Table of Contents
CORPORATE AND SOCIAL RESPONSIBILITY<br />
develop necessary preventive recommendations.<br />
In <strong>2010</strong> 5,707 employees of the Company attended an<br />
annual medical examination at the new department;<br />
204 employees who had worked in harmful and<br />
hazardous work environment for more than five<br />
years attended in-depth medical examinations.<br />
HEALTH REHABILITATION AND<br />
RECREATION<br />
<strong>Uralkali</strong> is aware that the effi ciency and productivity<br />
of its employees depend on their recreation<br />
and rest, and therefore regularly organises various<br />
health rehabilitation activities. In <strong>2010</strong> more than<br />
700 employees of the Company improved their<br />
health in the corporate recreation center, about 70<br />
employees had an opportunity to visit with their children.<br />
<strong>Uralkali</strong> allocated approximately 11.6 million<br />
RUR for these purposes; about 2.6 million RUR<br />
came from the Social Insurance Fund. In addition,<br />
125 employees were able to improve their health at<br />
the various resorts of the Perm Region, for which<br />
<strong>Uralkali</strong> spent around 2.5 million RUR.<br />
Table of Contents<br />
<strong>Uralkali</strong> also cares for the children of its<br />
employees. The company always pays great attention<br />
to the organisation of the children’s recreation and<br />
rehabilitation in summer. In <strong>2010</strong> 875 children of<br />
<strong>Uralkali</strong>’s employees visited the corporate holiday<br />
retreat Uralskoye Razdolie. The Company spent 10.3<br />
million RUR on organising summer holidays; about<br />
4 million RUR in subsidies were received from the<br />
budget of Perm Region. During the winter holidays<br />
of <strong>2010</strong>–2011 165 children of employees went travelling.<br />
The Company reimbursed 90% of the price<br />
of each travel package, which amounted to approximately<br />
1.4 million RUR.<br />
HOUSING<br />
The housing programme is one of the most<br />
effective ways to ensure employees remain motivated.<br />
In <strong>2010</strong> the Company continued to implement its<br />
housing programme, meeting its obligation of<br />
covering employees’ mortgage interest payments.<br />
The Company spent more than 16 million RUR on<br />
mortgage interest payments for 262 employees. This<br />
programme is fi rst and foremost intended to attract<br />
and retain highly-skilled professionals.<br />
ASSISTANCE TO THE VETERAN<br />
COUNCIL<br />
<strong>Uralkali</strong> strives to provide special care, support<br />
and attention to retired former employees. In <strong>2010</strong><br />
all retired members of the Veteran Council, with<br />
regards to the number of years they worked for<br />
<strong>Uralkali</strong>, received quarterly allowances. The total cost<br />
of allowances was 11.5 million RUR. The Company<br />
provides support to the former employees in relation<br />
to healthcare: in <strong>2010</strong>, 217 former employees were<br />
able to visit the corporate recreation center, which<br />
included receiving standard medical treatment.<br />
<strong>Uralkali</strong> spent about 3.6 million RUR on costs of<br />
95
CORPORATE AND SOCIAL RESPONSIBILITY<br />
veterans’ recreation, and about 5.6 million RUR on<br />
other costs to ensure veterans’ wellbeing.<br />
In <strong>2010</strong> Russia celebrated the 65th-anniversary<br />
of the Victory in Great Patriotic War. The Company<br />
organised various events for the Great Patriotic<br />
War veterans, war workers and widows of veterans –<br />
former employees of <strong>Uralkali</strong>, at a total cost of 1.56<br />
million RUR. An additional 450 thousand RUR were<br />
spent on the renovation of war veterans’ and war<br />
workers’ apartments. Total expenditure of assistance<br />
to the Veteran Council of <strong>Uralkali</strong> was 22 million<br />
RUR in <strong>2010</strong>.<br />
NEW YEAR GIFTS FOR<br />
CHILDREN<br />
One of the Company’s longstanding traditions is<br />
the giving of New Year gifts to the children of the<br />
employees. In <strong>2010</strong> about 3,500 children received<br />
gifts from <strong>Uralkali</strong>, at a cost of more than 1.7 million<br />
RUR.<br />
EDUCATION FOR CHILDREN<br />
As part of <strong>Uralkali</strong>’s social responsibility, the<br />
Company provides longstanding support to the<br />
children’s educational institutions of Berezniki.<br />
In <strong>2010</strong> <strong>Uralkali</strong> concluded an agreement with<br />
the City Board of Education on providing charity<br />
support in the fields of education and science.<br />
The Company funded training and professional<br />
development of teachers as well as awarding<br />
grants to educators and students for developing<br />
innovative learning programmes and outstanding<br />
educational achievement. In <strong>2010</strong> the Company<br />
allocated approximately 3.9 million RUR for these<br />
purposes. In addition, in <strong>2010</strong> <strong>Uralkali</strong> continued<br />
to implement a comprehensive programme of<br />
developing children’s educational institutions of<br />
the city. For example, the Company paid about 550<br />
96 <strong>Uralkali</strong> | <strong>Annual</strong> <strong>Report</strong> <strong>2010</strong><br />
thousand RUR for the services of software support<br />
and equipment maintenance in Gymnasium No 9,<br />
whereas in Kindergarten No 88 the Company partly<br />
fi nanced children’s meals for 200 thousand RUR.<br />
BEREZNIKI CONSTRUCTION<br />
AND DEVELOPMENT<br />
As a socially responsible company, <strong>Uralkali</strong><br />
contributes to the ongoing development of Berezniki.<br />
In <strong>2010</strong> <strong>Uralkali</strong> donated to the city an outpatients’<br />
clinic and a children day care centre in the rightbank<br />
area of Berezniki. The state-of-the-art clinic has<br />
children’s and adults’ departments, an emergency<br />
room, and day patient facility. The kindergarten with<br />
the swimming-pool, sauna, winter garden room and<br />
assembly hall is designed to accommodate up to 260<br />
children. The company has purchased necessary<br />
equipment, furniture, toys and educational aids<br />
for children. The kindergarden was donated to the<br />
city in July <strong>2010</strong>. The total cost of construction and<br />
equipment purchases was about 424 million RUR.<br />
Table of Contents
CORPORATE AND SOCIAL RESPONSIBILITY<br />
BEREZNIKI SOCIAL PROJECTS<br />
<strong>Uralkali</strong> is the largest business in Berezniki,<br />
and therefore pays great attention to the safety<br />
of citizens and their recreational opportunities.<br />
In <strong>2010</strong>, the Company continued to fund the<br />
Berezniki Character social fund, which supports<br />
various projects in culture, the arts, education and<br />
sports; it also contributed funding to the Safe City<br />
project, aimed at tackling street crime. <strong>Uralkali</strong><br />
spent about 54 million RUR on these programmes.<br />
The Company allocated a total of some 240 million<br />
RUR to charity support throughout <strong>2010</strong>.<br />
Table of Contents<br />
INDIVIDUAL SCHOLARSHIPS<br />
Developing an effi cient and multi-level system of<br />
staff training and development is one of the longterm<br />
strategic goals of <strong>Uralkali</strong>. This is the fourth<br />
successive year that <strong>Uralkali</strong> has been granting<br />
individual scholarships and awards to the best and<br />
most talented students through its scholarship<br />
programme with Perm State Technical University<br />
(PSTU) and its Berezniki branch (BB PSTU). In<br />
<strong>2010</strong>, 20 students of PSTU and 10 students of BB<br />
PSTU were awarded individual scholarships from<br />
<strong>Uralkali</strong>.<br />
97
CORPORATE GOVERNANCE<br />
PRINCIPLES AND STRUCTURE<br />
OF CORPORATE GOVERNANCE<br />
PRINCIPLES OF CORPORATE<br />
GOVERNANCE<br />
The Company is constantly working on the<br />
improvement and perfection of its corporate<br />
governance system in compliance with the best<br />
international practices and with due regard to the<br />
recommendations of the Russian Code of Corporate<br />
Conduct I .<br />
Transparency of all operations and full disclosure<br />
of information have always been high priorities of<br />
the Company. In <strong>2010</strong> the Company won three<br />
specialised contests which were organised in order<br />
to determine the best annual reports of 2009. The<br />
Company won in fi ve nominations:<br />
· 8th <strong>Annual</strong> <strong>Report</strong> Contest organised by OJSC<br />
RTS Stock Exchange – nominated in the category<br />
Best <strong>Annual</strong> <strong>Report</strong> Investment Appeal;<br />
· 8th <strong>Annual</strong> Federal Contest for <strong>Annual</strong> <strong>Report</strong>s<br />
and corporate websites, organised by the magazine<br />
Securities Market and the Ministry of Finance of the<br />
Russian Federation – nominated in the category Best<br />
<strong>Annual</strong> <strong>Report</strong> from the Ural Federal District,<br />
also, 3rd place in the category Best Disclosure in<br />
the <strong>Annual</strong> <strong>Report</strong> in the Ural Federal District;<br />
· 9th <strong>Annual</strong> <strong>Report</strong> Contest organised by Expert<br />
RA – nominated in the category Best <strong>Annual</strong><br />
<strong>Report</strong> (Non-Financial sector) and Best Design<br />
and Printwork.<br />
In <strong>2010</strong> the investor liaison team of <strong>Uralkali</strong> was<br />
recognised as the most progressive investor liaison<br />
team in Russia and the CIS by IR Magazine.<br />
Note<br />
I. Code of Corporate Conduct recommended by the Order No. 421/r<br />
of 04.04.2002 of FCSM of the Russian Federation<br />
GOVERNANCE AND CONTROL<br />
STRUCTURE (AS OF 31.12.<strong>2010</strong>)<br />
In compliance with the Federal Law “On Joint<br />
Stock Companies” and the Charter of the Company,<br />
the General Meeting of the Shareholders of the<br />
Company is the supreme governing body of the<br />
Company. The Board of Directors of the Company<br />
is responsible for general management and longterm<br />
strategy of the Company. The Company’s<br />
executive bodies – the General Director (Chairman<br />
of the Management Board) and the Management<br />
Board – are responsible for day-to-day operations<br />
management.<br />
The Revision Commission controls the fi nancial<br />
and economic activity of the Company.<br />
GENERAL MEETING<br />
OF SHAREHOLDERS<br />
The General Meeting of the Shareholders of<br />
the Company is the supreme management body<br />
of <strong>Uralkali</strong>. The order of convocation and the<br />
procedure of the General Meeting of Shareholders<br />
are established under the Regulations on the General<br />
Meeting of the Shareholders of OJSC <strong>Uralkali</strong>. The<br />
competence of the General Meeting of Shareholders<br />
is established under the Charter of the Company in<br />
compliance with the Federal Law “On Joint Stock<br />
Companies”. The shareholders of <strong>Uralkali</strong> participate<br />
in the management of the Company by adopting<br />
resolutions at the General Meetings of Shareholders.<br />
The <strong>Annual</strong> General Meeting of Shareholders is held<br />
not earlier than two months after and not later than<br />
six months after the end of the reporting fi scal year.<br />
Sessions of the General Meeting of Shareholders<br />
held additionally to the <strong>Annual</strong> General Meeting of<br />
Shareholders are considered Extraordinary General<br />
Meetings of Shareholders.<br />
98 <strong>Uralkali</strong> | <strong>Annual</strong> <strong>Report</strong> <strong>2010</strong> Table of Contents
CORPORATE GOVERNANCE<br />
AUDIT<br />
COMMITTEE<br />
DEPARTMENT<br />
OF INTERNAL<br />
AUDIT<br />
GENERAL<br />
MEETING<br />
OF SHAREHOLDERS<br />
In <strong>2010</strong> <strong>Uralkali</strong> held an annual General Meeting<br />
of the Shareholders and an Extraordinary General<br />
Meeting of the Shareholders. The agenda of the<br />
<strong>Annual</strong> General Meeting of the Shareholders,<br />
which was held on 18 June <strong>2010</strong>, included the<br />
following issues: approval of the annual report and<br />
the annual accounting statements of <strong>Uralkali</strong>, profi t<br />
distribution, election of the members of the Board<br />
of Directors and the Revision Commission, approval<br />
of the auditor of the Company, approval of the<br />
internal regulations of the Company and approval<br />
of interested-party transactions.<br />
The agenda of the Extraordinary General Meeting<br />
of the Shareholders of <strong>Uralkali</strong>, which was held on<br />
17 September <strong>2010</strong>, included the following issues:<br />
early termination of powers of the members of the<br />
Board of Directors and election of the members of<br />
the Board of Directors as well as approval of the new<br />
edition of the Charter of OJSC <strong>Uralkali</strong>.<br />
On 4 February 2011 the shareholders of the<br />
Company were gathered for an Extraordinary<br />
General Meeting of Shareholders to discuss the<br />
strategic issue of reorganisation of OJSC <strong>Uralkali</strong><br />
Table of Contents<br />
GENERAL<br />
DIRECTOR<br />
BOARD<br />
OF DIRECTORS<br />
MANAGEMENT<br />
BOARD<br />
APPOINTMENTS AND<br />
REMUNERATION<br />
COMMITTEE<br />
in the form of merger with OJSC Silvinit. The<br />
shareholders were also asked to ratify the merger<br />
agreement between OJSC <strong>Uralkali</strong> and OJSC<br />
Silvinit. The shareholders of the Company voted in<br />
favor of the proposed reorganisation and approved<br />
the merger agreement. The General Meeting also<br />
approved several major transactions connected with<br />
the reorganisation of the Company and ratifi ed the<br />
new editions of the Charter of the Company, the<br />
new edition of the Regulations on the Board of<br />
Directors of the Company and the new edition of the<br />
Regulations on Remuneration and Compensations<br />
paid to the members of the Board of Directors of<br />
OJSC <strong>Uralkali</strong>.<br />
BOARD OF DIRECTORS<br />
INVESTMENTS AND<br />
DEVELOPMENT<br />
COMMITTEE<br />
The Board of Directors of OJSC <strong>Uralkali</strong> (further<br />
referred to as the “Board of Directors”) exercises<br />
overall control over the Company’s activities within<br />
its remit. Its key priorities include ensuring long-term<br />
sound development of the Company in accordance<br />
with the interests of the shareholders, overseeing the<br />
99
CORPORATE GOVERNANCE<br />
activities of the management bodies of the Company,<br />
rigorous observation and protection of the rights<br />
and interests of the Company’s shareholders, and<br />
enterprise-wide management succession planning.<br />
The Board of Directors is constantly seeking to<br />
improve its effectiveness. This includes working<br />
to achieve the optimal balance of professional<br />
knowledge and skills within the Board, as well as<br />
a balance among executive, non-executive and<br />
independent directors.<br />
In compliance with global corporate governance<br />
practices and the recommendations of the Code<br />
of Corporate Conduct, independent directors are<br />
elected to the Board of Directors of OJSC <strong>Uralkali</strong>.<br />
The criteria of independence for members of the<br />
Board of Directors are outlined under the internal<br />
documentation of <strong>Uralkali</strong> and comply with the best<br />
international practices of corporate governance.<br />
The Board of Directors of the Company consists<br />
of nine members. Three of the nine members of the<br />
Board are independent directors in compliance with<br />
the criteria established by the Federal Law “On Joint<br />
Stock Companies”, the Corporate Governance Code<br />
of OJSC <strong>Uralkali</strong> and the UK Combined Corporate<br />
Governance Code.<br />
In <strong>2010</strong> executive directors served on the Board<br />
of Directors of OJSC <strong>Uralkali</strong>. From 1 January<br />
<strong>2010</strong> until 18 June <strong>2010</strong>, when the annual General<br />
Meeting of Shareholders was held, there were two<br />
executive directors on the Board of Directors of the<br />
Company. Both Boards of Directors elected by the<br />
annual and the extraordinary General Meetings of<br />
Shareholders included one executive director – the<br />
General Director of the Company. Since 21 February<br />
2011, when the Board of Directors terminated the<br />
authority of P. Grachev as the General Director<br />
of the Company, there are no executive directors<br />
serving on the Board of Directors. Thus, as of the<br />
date of approval of this annual report, six members<br />
100 <strong>Uralkali</strong> | <strong>Annual</strong> <strong>Report</strong> <strong>2010</strong><br />
of the Board of Directors of OJSC <strong>Uralkali</strong> are nonexecutive<br />
directors.<br />
The Investments and Development Committee<br />
of the Board of Directors of the Open Joint Stock<br />
Company <strong>Uralkali</strong> (hereinafter the Investments<br />
and Development Committee) is chaired by a nonexecutive<br />
director, whereas the Audit Committee<br />
of the Board of Directors of the Open Joint<br />
Stock Company <strong>Uralkali</strong> (hereinafter the Audit<br />
Committee) as well as the Appointments and<br />
Remuneration Committee of the Open Joint Stock<br />
Company <strong>Uralkali</strong> (hereinafter Appointments<br />
and Remuneration Committee) I are chaired by<br />
independent directors. In compliance with the<br />
current legislation, the members of the Board of<br />
Directors are elected by the General Meeting of<br />
Shareholders until the next <strong>Annual</strong> Meeting of the<br />
Shareholders of the Company. The General Meeting<br />
of Shareholders has a right to make a resolution<br />
on early termination of the powers of all members<br />
of the Board of Directors. In <strong>2010</strong> the Board of<br />
Directors was elected twice – at the <strong>Annual</strong> General<br />
Meeting of the Shareholders on 18 July <strong>2010</strong> and at<br />
the Extraordinary General Meeting of Shareholders<br />
which was held on 17 September <strong>2010</strong>. The members<br />
of the Board of Directors were elected by cumulative<br />
voting.<br />
Note<br />
I. On 29 April <strong>2010</strong> the Committee for Personnel and Remunerations was renamed<br />
the Appointments and Remuneration Committee by the resolution of the Board<br />
of Directors<br />
Table of Contents
CORPORATE GOVERNANCE<br />
The General Meeting of the Shareholders of OJSC <strong>Uralkali</strong> elected the following Board of Directors on 18 June<br />
<strong>2010</strong> I :<br />
Name Post<br />
D. Rybolovlev<br />
Yu. Gavrilov<br />
А. Konogorov<br />
А. Koff<br />
K. Marchuk<br />
D. Morozov<br />
V. Ruga<br />
Hans Jochum<br />
Horn<br />
I. Yuzhanov<br />
Number of years served<br />
on the Board of Directors<br />
Director’s<br />
status<br />
Attendance<br />
at the<br />
meetings of<br />
the Board of<br />
Directors II<br />
Membership<br />
of the Audit<br />
Committee and<br />
the attendance at<br />
the meetings<br />
Membership of<br />
the Appointments<br />
and<br />
Remuneration<br />
Committee and<br />
the attendance at<br />
the meetings<br />
Chairman of<br />
the Board of<br />
Directors 16 Non-executive 13 (13) 2 (4)<br />
Membership of<br />
the Investments<br />
and DevelopmentCommittee<br />
and the<br />
attendance at<br />
the meetings<br />
Member of<br />
the Board of<br />
Directors 10 Non-executive 13 (13) 4 (4)<br />
Member of<br />
the Board of<br />
Directors 8 Non-executive 13 (13) 4 (4) Chairman 4 (4) 3 (4)<br />
Member of<br />
the Board of<br />
Directors<br />
Elected to the Board of<br />
Directors for the first time<br />
on 18 June <strong>2010</strong> Independent 6 (6) +<br />
Member of<br />
the Board of<br />
Directors 3 Non-executive 12 (13) 4 (4) 4 (4)<br />
Member of<br />
the Board of<br />
Directors<br />
Chairman<br />
4 (4)<br />
Elected to the Board of<br />
Directors for the first time<br />
on 18 June <strong>2010</strong> Executive 6 (6) +<br />
Member of<br />
the Board of<br />
Directors 2 Independent 12 (13) 2 (4)<br />
Member of<br />
the Board of<br />
Directors 2 Independent 10 (13)<br />
Chairman<br />
4 (4)<br />
Member of<br />
the Board of<br />
Directors 4 Independent 13 (13) 3 (4)<br />
Notes<br />
I. From 30.06.2009 until 18.06.<strong>2010</strong> V. Baumgertner and M. Antonov served on the Board of Directors and the Investments and Development Committee of the Board of<br />
Directors. They attended all Board and Committee meetings which were held in the indicated period<br />
II. The number of meetings attended by the member of the Board of Directors in <strong>2010</strong> is hereinafter provided on the left; the total number of meetings held by the Board of<br />
Directors/Committee in <strong>2010</strong> is given in parentheses<br />
Table of Contents<br />
101
CORPORATE GOVERNANCE<br />
At the extraordinary General Meeting of the Shareholders of <strong>Uralkali</strong> of 17 September <strong>2010</strong> the following<br />
individuals were elected to the Board of Directors:<br />
Name Post<br />
A. Voloshin<br />
A. Averin<br />
P. Grachev<br />
A. Kolonchina<br />
A. Malakh<br />
A. Mosionzhik<br />
A. Nesis<br />
Hans Jochum<br />
Horn<br />
I. Yuzhanov<br />
Chairman of<br />
the Board of<br />
Directors<br />
Member of<br />
the Board of<br />
Directors<br />
Member of<br />
the Board of<br />
Directors<br />
Member of<br />
the Board of<br />
Directors<br />
Member of<br />
the Board of<br />
Directors<br />
Member of<br />
the Board of<br />
Directors<br />
Member of<br />
the Board of<br />
Directors<br />
Number of years served<br />
on the Board of Directors<br />
Director’s<br />
Status<br />
Attendance<br />
at the<br />
meetings of<br />
the Board of<br />
Directors<br />
Elected to the Board of<br />
Directors for the first time<br />
on 17 September <strong>2010</strong> Independent 4 (4)<br />
Membership<br />
of the Audit<br />
Committee and<br />
the attendance at<br />
the meetings<br />
Membership<br />
of the Appointments<br />
and<br />
Remuneration<br />
Committee and<br />
the attendance<br />
at the meetings<br />
Membership of<br />
the Investments<br />
and Development<br />
Committee and<br />
the attendance at<br />
the meetings<br />
Elected to the Board of<br />
Directors for the first time<br />
on 17 September <strong>2010</strong> Non-executive 4 (4) 2 (2)<br />
Elected to the Board of<br />
Directors for the first time<br />
on 17 September <strong>2010</strong> Executive I 4 (4) 2 (2)<br />
Elected to the Board of<br />
Directors for the first time<br />
on 17 September <strong>2010</strong> Non-executive 4 (4) 1 (1)<br />
Elected to the Board of<br />
Directors for the first time<br />
on 17 September <strong>2010</strong> Non-executive 4 (4) 0 (1)<br />
Elected to the Board of<br />
Directors for the first time<br />
on 17 September <strong>2010</strong> Non-executive 4 (4) 2 (2)<br />
Chairman<br />
2 (2)<br />
Elected to the Board of<br />
Directors for the first time<br />
on 17 September <strong>2010</strong> Non-executive 4 (4) 0 (2) 2 (2)<br />
Member of<br />
the Board of<br />
Directors 2 Independent 4 (4)<br />
Member of<br />
the Board of<br />
Directors 4 Independent 4 (4)<br />
The meetings of the Board of Directors of the<br />
Company constitute a quorum if at least fi ve elected<br />
Board members participate in the meeting. Decisions<br />
are adopted by the majority vote of the members of<br />
the Board of Directors present at the meeting and<br />
(or) in accordance with their written opinions,<br />
unless otherwise stipulated under the Federal Law<br />
Note<br />
I. Since 22 February 2011, following termination of the authority of P. Grachev as<br />
General Director of OJSC <strong>Uralkali</strong>, P. Grachev is a non-executive director<br />
102 <strong>Uralkali</strong> | <strong>Annual</strong> <strong>Report</strong> <strong>2010</strong><br />
Chairman<br />
1 (1)<br />
Chairman<br />
2 (2)<br />
“On Joint Stock Companies” and the Charter of the<br />
Company. The Chairman of the Board of Directors<br />
and the two deputies of the Chairman are elected<br />
from among the members of the Board of Directors<br />
by the majority vote of the members of the Board.<br />
The Chairman of the Board of Directors organises<br />
the work of the Board, convokes Board meetings and<br />
chairs them; the Chairman also organises proper<br />
keeping of the minutes of the meetings of the Board<br />
of Directors.<br />
Table of Contents
CORPORATE GOVERNANCE<br />
ACTIVITY OF THE BOARD<br />
OF DIRECTORS IN <strong>2010</strong><br />
In <strong>2010</strong> the Board of Directors had seventeen<br />
meetings, six of which were held “in presentia”.<br />
During the year <strong>2010</strong> the Board of Directors<br />
continued working on the development of the<br />
Company’s long-term strategy, its investment plans<br />
and the improvement of the effi ciency of its internal<br />
control systems, risk management systems and control<br />
over affi liated and dependent companies, as well as<br />
the development of corporate management systems<br />
within the Company. In December <strong>2010</strong> the Board of<br />
Directors decided to propose for the consideration of<br />
the General Meeting of Shareholders of the Company<br />
the issues of reorganisation of OJSC <strong>Uralkali</strong> as the<br />
result of the merger with OJSC Silvinit, approval<br />
of the merger agreement and approval of major<br />
transactions connected with the reorganisation of<br />
the Company.<br />
During the course of <strong>2010</strong> the Board of Directors<br />
reviewed other issues connected with the activity of<br />
the Company within its remit, including organisation<br />
of the Committees of the Board of Directors of OJSC<br />
<strong>Uralkali</strong>, establishment of the size of the Management<br />
Board of the Company and appointment of its<br />
members, confi rmation of senior managers of the<br />
Company in offi ce, convocation and organisation of<br />
the General Meetings of the Shareholders of OJSC<br />
<strong>Uralkali</strong>, approval of interested-party transactions,<br />
approval of fi nancial reports and approval of the<br />
budget and amendments thereto.<br />
All key issues of the Company are reviewed at<br />
the meetings of the Board of Directors held “in<br />
presentia”.<br />
Table of Contents<br />
COMMITTEES OF THE BOARD<br />
OF DIRECTORS<br />
The Board of Directors of OJSC <strong>Uralkali</strong> has<br />
established several committees for preliminary<br />
review of the most important issues and preparation<br />
of recommendations to the Board of Directors. The<br />
Board of Directors has the following permanent<br />
committees:<br />
• Audit Committee.<br />
• Investments and Development Committee.<br />
• Appointments and Remuneration Committee.<br />
The Committees of the Board of Directors consist<br />
of the acting members of the Board of Directors.<br />
When a member of the Board of Directors is<br />
appointed to serve on one of the Board’s Committees,<br />
his/her professional experience and independence<br />
are taken into account in compliance with the<br />
requirements of the current legislation.<br />
In order to improve the system of corporate<br />
governance, in April <strong>2010</strong> the Board of Directors<br />
ratifi ed new editions of the Regulations on the Audit<br />
Committee and the Appointments and Remuneration<br />
Committee as well as the fi rst edition of Regulations<br />
on the Investments and Development Committee.<br />
These Regulations clarifi ed the objectives and goals<br />
of the committees, the areas of their competence and<br />
the procedure of their work. In September <strong>2010</strong> the<br />
Board of Directors ratifi ed several amendments to<br />
the Regulations on the Audit Committee and the<br />
Regulations on the Investments and Development<br />
Committee regarding the number of the members<br />
of the committees. In December <strong>2010</strong> and in April<br />
2011 the Board of Directors approved new editions<br />
of the Regulations on the Appointments and<br />
Remuneration Committee. The changes were related<br />
to the organisation of the work of the Committee, the<br />
competence of the Committee and included various<br />
amendments as to the membership of the Committee<br />
in order to bring the provisions of the Regulations in<br />
103
CORPORATE GOVERNANCE<br />
line with the requirements of A-lists of the Russian<br />
stock exchanges.<br />
The Board of Directors and the specialised<br />
Committees monitor the best practices of corporate<br />
governance in order to improve the existing<br />
regulations and procedures of the Company.<br />
AUDIT COMMITTEE<br />
As of 31 December <strong>2010</strong> there are three members<br />
in the Audit Committee of the Board of Directors:<br />
Hans Jochum Horn (Chairman), Anna Kolonchina<br />
and Alexander Malakh.<br />
The Audit Committee acts in compliance with the<br />
Regulations on the Audit Committee of the Board of<br />
Directors of OJSC <strong>Uralkali</strong>, the Regulations on the<br />
Board of Directors of OJSC <strong>Uralkali</strong>, and the Charter<br />
of the Company.<br />
The Audit Committee is responsible for overseeing<br />
risk management processes, internal control,<br />
reporting, the work of the outside auditor of the<br />
Company, corporate governance and compliance<br />
with legislation as well as internal auditing.<br />
In particular, the Audit Committee must make<br />
sure of and confi rm to the Board of Directors the<br />
fact that all key risks have been identifi ed, evaluated<br />
and remain within the established limits, that the<br />
management has implemented all key controlling<br />
procedures and executes them effectively to minimise<br />
risks; that the fi nancial statements of the Company<br />
are comprehensive, reliable and up-to-date.<br />
Overseeing the effectiveness of internal audit<br />
includes the management of the internal audit<br />
subdivision. Specifically, the Audit Committee<br />
approves internal documentation which regulates<br />
the subdivision’s activities, its annual working<br />
plan, key performance indicators, monitors the<br />
achievement of the approved performance indicators<br />
and prepares recommendations for the Board of<br />
Directors concerning the appointment/termination<br />
104 <strong>Uralkali</strong> | <strong>Annual</strong> <strong>Report</strong> <strong>2010</strong><br />
of powers of the head of the subdivision, drafting<br />
labor contracts and remuneration plan. As part<br />
of overseeing internal auditing, the Committee<br />
regularly reviews the reports of the internal audit<br />
subdivision together with the General Director<br />
and the operating management of the Company<br />
and ensures the organisational independence and<br />
objectivity of the subdivision, including review of all<br />
unsettled confl icts and all cases when the activities of<br />
the subdivision appear to be restrained.<br />
In <strong>2010</strong> fi ve meetings of the Committee were held.<br />
The main matters the Audit Committee oversaw in<br />
<strong>2010</strong> were the preliminary review of IFRS fi nancial<br />
statements, preparation of the recommendations for<br />
the Board of Directors concerning the Company’s<br />
outside auditor and the issues of internal control<br />
and risk-management, including identification<br />
and evaluation of key risks to the activity of the<br />
Company.<br />
INVESTMENTS<br />
AND DEVELOPMENT<br />
COMMITTEE<br />
As of 31 December <strong>2010</strong>, the Investments and<br />
Development Committee consists of three members<br />
of the Board of Directors: Alexander Malakh<br />
(Chairman), Anton Averin and Alexander Nesis.<br />
The Committee acts in compliance with the<br />
Regulations on the Investments and Development<br />
Committee of the Board of Directors of OJSC<br />
<strong>Uralkali</strong>, the Regulations on the Board of Directors<br />
of OJSC <strong>Uralkali</strong> and the Charter of the Company.<br />
The main responsibilities of the Committee<br />
include the following: establishment of policies and<br />
procedures of strategic management; monitoring of<br />
their implementation and execution; development of<br />
alternative strategic initiatives; analysis and evaluation<br />
of the results of the strategic initiatives implemented;<br />
monitoring of the expectations of the Company’s<br />
Table of Contents
CORPORATE GOVERNANCE<br />
shareholders; establishment and amendment of<br />
budgets for the next financial year; review of the<br />
Company’s key investment projects and preparation<br />
of recommendations to the Board of Directors<br />
for their approval; establishment of the range and<br />
target values of performance indicators in relation<br />
to their strategic priority; and further evaluation of<br />
performance indicators of the Company.<br />
In <strong>2010</strong> six meetings were held, one of which<br />
was conducted jointly with the Appointments and<br />
Remuneration Committee. In <strong>2010</strong> the Investments<br />
and Development Committee focused on reviewing<br />
the Company’s investment projects, developing<br />
the methods of implementation of the investment<br />
projects; the Company’s budget, including<br />
determination of the budget variance and preparing<br />
recommendations concerning amendment to the<br />
budget, reviewing cost reduction programmes,<br />
analysing internal regulations of the Company<br />
within the Committee’s remit and preparing<br />
recommendations to review the Company’s existing<br />
regulations. In <strong>2010</strong> the Committee started to work<br />
on the development of an integrated long-term<br />
strategy of the Company.<br />
APPOINTMENTS AND<br />
REMUNERATION COMMITTEE<br />
As of 31 December <strong>2010</strong>, the Appointments and<br />
Remuneration Committee consists of four members<br />
of the Board of Directors: Ilya Yuzhanov (Chairman),<br />
Pavel Grachev, Alexander Mosionzhik and Alexander<br />
Nesis.<br />
The Committee acts in compliance with the<br />
Regulations on the Appointments and Remuneration<br />
Committee of the Board of Directors of OJSC<br />
<strong>Uralkali</strong>, the Regulations on the Board of Directors<br />
of OJSC <strong>Uralkali</strong>, and the Charter of the Company.<br />
The Appointments and Remuneration Committee<br />
is responsible for ensuring that the Company is<br />
Table of Contents<br />
managed by highly-qualified professionals. This<br />
involves developing incentives necessary for the<br />
successful work of the members of the governing<br />
bodies to guarantee the achievement of the<br />
Company’s strategic goals, assessing the activities<br />
of the company’s governing bodies, succession<br />
planning and implementation.<br />
In <strong>2010</strong> six meetings of the Appointments<br />
and Remuneration Committee were held, one of<br />
which was held jointly with the Investments and<br />
Development Committee. During the reporting<br />
year the Committee focused its efforts on the<br />
improvement of the existing system of assessment and<br />
remuneration of the top managers of the Company,<br />
optimisation of the Company’s organisational<br />
structure, succession planning projects, and<br />
programmess aimed to attract and motivate the<br />
Company’s employees.<br />
In <strong>2010</strong> the Committee started to work on the<br />
development of an effective system of long-term<br />
motivation of the Company’s top-management, which<br />
is intended to motivate the top-management to achieve<br />
both short-term and long-term strategic goals.<br />
EXECUTIVE BODIES<br />
The General Director and the Management Board<br />
are responsible for day-to-day management of the<br />
Company. The General Director is the Chairman of<br />
the Management Board.<br />
The rights and duties of the General Director and<br />
the members of the Management Board in exercising<br />
day-to-day control over the Company are regulated<br />
by the Federal Law “On Joint Stock Companies”, the<br />
Charter of the Company, the Regulations on the<br />
Management Board of OJSC <strong>Uralkali</strong> and various<br />
internal regulatory documents. The members of<br />
the Management Board are appointed for the same<br />
term as the Board of Directors which appointed<br />
them. The Board of Directors has the right to<br />
105
CORPORATE GOVERNANCE<br />
change the composition and the membership of<br />
the Management Board as well as to terminate the<br />
powers of the General Director pre-term.<br />
The Management Board of the Company and the<br />
General Director do not have the right to resolve<br />
issues which fall under the competence of the<br />
General Meeting of Shareholders of the Company<br />
and/or the competence of the Board of Directors.<br />
The Management Board and the General Director<br />
ensure implementation of the resolutions of the<br />
General Meeting of Shareholders and the resolutions<br />
of the Board of Directors.<br />
On 29 April <strong>2010</strong> the Board of Directors of<br />
OJSC <strong>Uralkali</strong> resolved to terminate the powers<br />
of V. Baumgertner as the General Director of the<br />
Company as of 30 June <strong>2010</strong>.<br />
106 <strong>Uralkali</strong> | <strong>Annual</strong> <strong>Report</strong> <strong>2010</strong><br />
From 1 July <strong>2010</strong> until 4 August <strong>2010</strong> the post<br />
of the General Director of OJSC <strong>Uralkali</strong> was<br />
held by D. Morozov, and from 5 August <strong>2010</strong> – by<br />
P. Grachev.<br />
In <strong>2010</strong> the composition and membership of the<br />
Management Board underwent a series of changes,<br />
which, among other things, had to do with the<br />
fact that the General Director of the Company was<br />
changed several times.<br />
As of 1 January <strong>2010</strong>, the Management Board of<br />
the Company consisted of the following members:<br />
M. Antonov, V. Baumgertner, V. Belyakov, S. Dyakov,<br />
E. Samsonova and M. Shvetsova.<br />
As of 31 December <strong>2010</strong> the Management Board<br />
consisted of: P. Grachev, V. Belyakov, Y. Bogdanov,<br />
O. Petrov, E. Samsonova and M. Shvetsova.<br />
Table of Contents
CORPORATE GOVERNANCE<br />
MANAGEMENT BOARD AS OF 31 DECEMBER <strong>2010</strong><br />
Name Post Biography<br />
Pavel Grachev<br />
Victor Belyakov<br />
Yuri Bogdanov<br />
Oleg Petrov<br />
Elena<br />
Samsonova<br />
Marina<br />
Shvetsova<br />
General Director,<br />
President II ,<br />
Chairman of the<br />
Management<br />
Board<br />
Executive Vice-<br />
President for<br />
Economics and<br />
Finance<br />
Vice-President<br />
for Efficiency<br />
Management<br />
Vice-President<br />
for Sales and<br />
Marketing<br />
Vice-President for<br />
Personnel<br />
Director for Legal<br />
and Corporate<br />
Affairs<br />
Chairman of the Management Board since 5 August <strong>2010</strong>.<br />
Born in 1973.<br />
In 1998 graduated from the Italian University of Trieste and Saint Petersburg State University<br />
with a degree in law.<br />
Since 5 August <strong>2010</strong> – General Director and President of OJSC <strong>Uralkali</strong> III . 1 (11)<br />
Attendance<br />
at meetings I<br />
Member of the Management Board since 2007.<br />
Born in 1973.<br />
Graduated from Tver State Technical University in 1995, specialised in “automated systems<br />
of information processing”, and qualified as a systems engineer. In 1997 graduated from Tver<br />
State Technical University with a degree in Economics, specialised in “information systems<br />
in economics”. Victor Belyakov holds a CMA diploma (Certified Management Accountant)<br />
and an MBA from Kingston Business School.<br />
Director for Economics and Finance since 2007; Deputy General Director – Director<br />
for Economics and Finance – since 2008; since May <strong>2010</strong> – Executive Vice-President for<br />
Economics and Finance.<br />
Serves on the boards of directors of several companies affiliated with OJSC <strong>Uralkali</strong>. 11 (11)<br />
Member of the Management Board since <strong>2010</strong>.<br />
Born in 1980.<br />
Graduated from the Financial Academy under the patronage of the Russian Government<br />
with a degree in Economics, specialised in finances and credit.<br />
From 2004 until 2006 worked in OJSC <strong>Uralkali</strong> as leading manager for reporting in the<br />
corporate reporting and control department; in 2006–2008 worked as head of corporate<br />
reporting and control department; from 2008 until <strong>2010</strong> occupied the post of Vice-President<br />
for organisational development and restructuring; since <strong>2010</strong> – Vice-President for efficiency<br />
management in OJSC <strong>Uralkali</strong>.<br />
Serves on the boards of directors of several companies affiliated with OJSC <strong>Uralkali</strong>. 4 (11)<br />
Member of the Management Board since <strong>2010</strong>.<br />
Born in 1963.<br />
Graduated from the Military Institute, specialised in “foreign languages”.<br />
Graduated from the Russian Economic Academy n.a. G.V. Plekhanov, qualified as Economist<br />
specialising in finances and credit.<br />
Since 2005 – First Deputy General Director of CJSC Belarusian Potash Company.<br />
Since <strong>2010</strong> – Vice-President for Sales and Marketing of OJSC <strong>Uralkali</strong>. 2 (11)<br />
Member of the Management Board since 2004.<br />
Born in 1976.<br />
Graduated from Perm State University with a diploma in English Philology, qualified<br />
as a philologist, translator and teacher of the English language and literature. In 2000<br />
graduated from Durham Business School (UK) with a Master’s Degree in Management.<br />
Director for Personnel in 2004–<strong>2010</strong>, since <strong>2010</strong> – Vice-President for Personnel in OJSC<br />
<strong>Uralkali</strong>.<br />
Serves on the boards of directors of several companies affiliated with OJSC <strong>Uralkali</strong>. 11 (11)<br />
Member of the Management Board since 2005.<br />
Born in 1972.<br />
Graduated from Perm State University in 1994 with a degree in law.<br />
Director for Legal and Corporate Affairs since 2006.<br />
Serves on the boards of directors of several companies affiliated with OJSC <strong>Uralkali</strong>. 11 (11)<br />
Notes<br />
I. The total number of the meetings of the Management Board attended by the Board member is indicated on the left; the total number of the meetings of the Management<br />
Board held in <strong>2010</strong> is indicated in parentheses<br />
II. By the resolution of the Board of Directors of OJSC <strong>Uralkali</strong> the post of President of the Company was cancelled as of 22 February 2011<br />
III. Pavel Grachev was the General Director of the Company and the Chairman of the Management Board from 05 August <strong>2010</strong> until 21 February 2011<br />
Table of Contents<br />
107
CORPORATE GOVERNANCE<br />
On 21 February 2011 the Board of Directors<br />
resolved to terminate the powers of P. Grachev as<br />
the General Director of OJSC <strong>Uralkali</strong> pre-term.<br />
The Board of Directors appointed V. Baumgertner I<br />
General Director of OJSC <strong>Uralkali</strong> as of 22 February<br />
2011. At the same meeting the composition of the<br />
Management Board of the Company was changed<br />
and the following persons were appointed to the<br />
Management Board: V. Baumgertner, V. Belyakov,<br />
Y. Bogdanov, O. Petrov, E. Samsonova and<br />
M. Shvetsova.<br />
ACTIVITY OF THE<br />
MANAGEMENT BOARD IN <strong>2010</strong><br />
The main issues dealt with at the meetings<br />
of the Management Board in <strong>2010</strong> were related<br />
to controlling the activities of the structural<br />
subdivisions of the Company, preliminary approval<br />
of the budgets, approval of the Company’s local<br />
regulatory acts, introduction of changes to the<br />
Company’s organisational structure, and a range of<br />
other matters within the Management Board’s remit<br />
in compliance with the provisions of the Charter of<br />
the Company.<br />
Note<br />
I. The information on V. Baumgertner is provided in the section “Membership<br />
of the Board of Directors”<br />
108 <strong>Uralkali</strong> | <strong>Annual</strong> <strong>Report</strong> <strong>2010</strong><br />
REVISION COMMISSION<br />
The Revision Commission is an internal<br />
controlling body which monitors financial and<br />
economic activity of the Company.<br />
The Revision Commission is responsible for<br />
ensuring that the information contained in the<br />
Company’s <strong>Annual</strong> <strong>Report</strong>s, annual and interim<br />
fi nancial statements, reports prepared for statistical<br />
and other state authorities, is accurate, verifying the<br />
competences of the decisions made by the Company’s<br />
governing bodies and monitoring the execution<br />
of the decisions and compliance with the internal<br />
regulations of the Company as stipulated in its<br />
Charter by the Company’s executive offi cers, review<br />
of the correctness of profi t distribution in accordance<br />
with the resolution of the General Meeting of<br />
Shareholders on profi t distribution, accuracy and<br />
timeliness of distribution of dividends on shares<br />
and interest on bonds, review of the legality of<br />
contracts signed on behalf of the Company and other<br />
transactions; review of the accuracy and timeliness<br />
of payments according to the Company’s contracts<br />
and obligations; and evaluation of the internal audit<br />
system as well as analysis of the causes and effects of<br />
budget variance.<br />
The Revision Commission acts in compliance<br />
with the Charter and the Regulations on the<br />
Revision Commission and reviews the fi nancial and<br />
economic activity of the Company in order to ensure<br />
that the activities and operations of OJSC <strong>Uralkali</strong><br />
are in compliance with the current legislation of<br />
the Russian Federation and the interests of the<br />
Company’s shareholders and that the financial<br />
reports of the Company accurately represent its<br />
fi nancial status.<br />
Table of Contents
CORPORATE GOVERNANCE<br />
REMUNERATION OF THE<br />
MEMBERS OF THE GOVERNING<br />
BODIES OF THE COMPANY<br />
THE BOARD OF DIRECTORS OF OJSC<br />
URALKALI<br />
On 18 June <strong>2010</strong> the <strong>Annual</strong> General Meeting of the<br />
Shareholders of <strong>Uralkali</strong> adopted a resolution to pay<br />
16,821,800 RUR to the independent members of the<br />
Board of Directors for their service as the members<br />
of the Committees of the Board of Directors.<br />
Members of the Board<br />
of Directors Amount of remuneration<br />
Hans Jochum Horn 6,728,720 RUR<br />
V. Ruga 5,046,540 RUR<br />
I. Yuzhanov 5,046,540 RUR<br />
The Shareholder <strong>Annual</strong> General Meeting<br />
of <strong>Uralkali</strong> also resolved to approve the new<br />
edition of the Regulations on Remuneration and<br />
Compensations paid to the members of the Board<br />
of Directors of <strong>Uralkali</strong>. These Regulations were<br />
intended to change the system of remuneration,<br />
which would lead to dividing remuneration of the<br />
members of the Board into base remuneration – for<br />
independent and non-executive members of the<br />
Board of Directors – and additional remuneration –<br />
for service on the Committees and additional<br />
responsibilities of the Chairman of the Committee<br />
or the Deputy Chairman of the Board of Directors<br />
as well as the Chairman of the Board of Directors.<br />
According to the approved Regulations, only<br />
executive directors – members of the Board of<br />
Directors – were not compensated for their service<br />
on the Board.<br />
On 17 September <strong>2010</strong>, the Extraordinary<br />
General Meeting of Shareholders took place.<br />
The elected members of the Board of Directors,<br />
with the exception of the three independent<br />
directors, refused the remuneration offered, in<br />
Table of Contents<br />
accordance with the right granted to them under<br />
the Regulations.<br />
On 4 February 2011 an Extraordinary General<br />
Meeting of Shareholders was held, and its agenda<br />
included approval of the new edition of the<br />
Regulations on Remuneration and Compensations<br />
paid to the members of the <strong>Uralkali</strong> Board of<br />
Directors. Under the new edition of the document,<br />
base and additional remuneration are paid only to<br />
the independent directors. It is also stipulated that<br />
the amount of annual remuneration of the Chairman<br />
of the Board of Directors totals US$ 1 million. Any<br />
member of the Board has the right to refuse to<br />
receive remuneration for their service. The new<br />
edition of the Regulations was approved by the<br />
General Meeting of Shareholders and took effect<br />
on 4 February 2011.<br />
THE MANAGEMENT OF OJSC<br />
URALKALI<br />
The remuneration paid to the management<br />
of <strong>Uralkali</strong> (General Director, Members of the<br />
Management Board, Vice-Presidents and Directors)<br />
consists of a monthly salary and an annual bonus. The<br />
salary is established under employment agreements<br />
between the managers and OJSC <strong>Uralkali</strong>. The<br />
annual bonus is paid according to the achievement<br />
of the goals, included in the performance score card<br />
of the manager. The regulations on performance<br />
management and on bonuses establish the order<br />
of devising and approving the performance score<br />
cards as well as approving the achievement of the<br />
performance goals during the financial year and<br />
calculating the bonus amount to be paid to the<br />
manager.<br />
The salary and annual bonus ratio for the<br />
management of the Company conforms to the widely<br />
accepted global practices.<br />
109
CORPORATE GOVERNANCE<br />
The total remuneration paid to the members<br />
of the Board of Directors, General Director, and<br />
members of the Management Board, following the<br />
<strong>2010</strong> results, amounted to 363,711,000.00 RUR.<br />
Employment termination indemnities paid to the<br />
management in <strong>2010</strong> totaled 401,487,000.00 RUR.<br />
The managers of the Company do not receive<br />
any additional remuneration for their services in<br />
the governing bodies of <strong>Uralkali</strong> or its affiliated<br />
companies.<br />
SHAREHOLDINGS OF MEMBERS<br />
OF GOVERNING BODIES<br />
OF URALKALI<br />
(AS OF 31 DECEMBER <strong>2010</strong>)<br />
According to the information recorded in<br />
the share register of <strong>Uralkali</strong>, provided by CJSC<br />
Registrator Intraco as of 31 December <strong>2010</strong>, Sergey<br />
Dyakov, who was the member of the Management<br />
110 <strong>Uralkali</strong> | <strong>Annual</strong> <strong>Report</strong> <strong>2010</strong><br />
Board of the Company as of 1 January <strong>2010</strong>,<br />
is registered in the Company’s share register.<br />
According to the share register, Sergey Dyakov<br />
owns 3,171,000 ordinary shares of <strong>Uralkali</strong>, which is<br />
equal to 0.1493% of the Company’s holding. Other<br />
members who held posts in the governing bodies<br />
of <strong>Uralkali</strong> during <strong>2010</strong> are not registered in the<br />
Company’s share register both as of 1 January <strong>2010</strong><br />
and as of 31 December <strong>2010</strong>. There is no information<br />
on any transactions made by the members of the<br />
governing bodies of <strong>Uralkali</strong> with the intention<br />
to buy or transfer shares of the Company nor<br />
information of the date when these transactions<br />
were carried out, their content or the type and<br />
amount of the shares sold during the period from 1<br />
January <strong>2010</strong> to 31 December <strong>2010</strong>. Moreover, there<br />
is no information on the owners whose shares are<br />
held in nominal shareholding both as of 1 January<br />
<strong>2010</strong> and as of 31 December <strong>2010</strong>.<br />
Table of Contents
CORPORATE GOVERNANCE<br />
MEMBERSHIP OF THE BOARD OF DIRECTORS<br />
This section contains information on the<br />
individuals who were members of the Board of<br />
Directors of <strong>Uralkali</strong> from 01 January <strong>2010</strong> until<br />
31 December <strong>2010</strong>. I<br />
Dmitry Rybolovlev<br />
Chairman of the Board of Directors in 1996–<br />
<strong>2010</strong>.<br />
Dmitry Rybolovlev was born in 1966. He graduated<br />
from the Perm Medical Institute with a degree in<br />
General Medicine.<br />
In 2005–<strong>2010</strong> Dmitry Rybolovlev was the Chairman<br />
of the Supervisory Board of CJSC Belarusian Potash<br />
Company.<br />
He is a member of the Board of the Russian Union<br />
of Industrialists and Entrepreneurs, a non-profit<br />
organisation which promotes the interests of Russian<br />
business.<br />
Dmitry Rybolovlev was a member of the Appointments<br />
and Remuneration Committee of <strong>Uralkali</strong>.<br />
The powers of D. Rybolovlev as a member of the<br />
Board of Directors of the Company were terminated<br />
on 17 September <strong>2010</strong>.<br />
Mikhail Antonov<br />
Member of the Board of Directors and member<br />
of the Management Board of the Company in 2009–<br />
<strong>2010</strong>.<br />
Vice President for Strategic Development in 2008–<br />
2011, Acting President in July 2009 – February <strong>2010</strong>.<br />
Mikhail Antonov was born in 1966. He graduated<br />
from Moscow State University n. a. M.V. Lomonosov<br />
in 1988 where he studied Economics and Computer<br />
Science, qualifi ed as an Economist-Mathematician<br />
and subsequently earned a PhD in Economics.<br />
Mikhail Antonov was a member of the Investments<br />
and Development Committee of the Board of<br />
Directors of <strong>Uralkali</strong>.<br />
Note<br />
I. The information on the place of employment and posts held is as of 31.12.<strong>2010</strong><br />
unless indicated otherwise<br />
Table of Contents<br />
The powers of M. Antonov as a member of the<br />
Board of Directors of the Company were terminated<br />
on 18 June <strong>2010</strong>.<br />
Vladislav Baumgertner<br />
Member of the Board of Directors in 2004–<strong>2010</strong>.<br />
Vladislav Baumgertner was born in 1972.<br />
In 1994 he graduated from the State Technical<br />
University of the Urals and qualifi ed as an Electrical<br />
Engineer.<br />
In 2001 Mr. Baumgertner completed his studies<br />
at Kingston Business School and earned an MBA<br />
(Master of Business Administration).<br />
In 2003 Vladislav Baumgertner graduated from<br />
the University of London with an MSc degree in<br />
Financial Management.<br />
From 2004 until 2008 Mr. Baumgertner was the<br />
President of OJSC <strong>Uralkali</strong>.<br />
From 2005 until July <strong>2010</strong> he served as the General<br />
Director of the Company.<br />
In 2004–<strong>2010</strong> he served on the Boards of Directors<br />
of several of the <strong>Uralkali</strong>'s subsidiaries and was also<br />
a member of the Board of Directors of OJSC Silvinit<br />
and CJSC Belarusian Potash Company.<br />
Vladislav Baumgertner was a member of the<br />
Investments and Development Committee of the<br />
Board of Directors of the Company.<br />
The powers of V. Baumgertner as a member of the<br />
Board of Directors of the Company were terminated<br />
on 18 June <strong>2010</strong>.<br />
From October <strong>2010</strong> until February 2011 Vladislav<br />
Baumgertner worked as the General Director of<br />
OJSC Silvinit. Mr. Baumgertner currently serves on<br />
the Boards of Directors of the following companies:<br />
OJSC Silvinit, OJSC Galurgia, CJSC VNII Galurgii<br />
and CJSC Solikamsky construction trust. He is a<br />
member of the Supervisory Board of CJSC Belarusian<br />
Potash Company.<br />
On 21 February 2011 Vladislav Baumgertner was<br />
appointed General Director of OJSC <strong>Uralkali</strong>.<br />
111
CORPORATE GOVERNANCE<br />
Yury Gavrilov<br />
Member of the Board of Directors in 2000–<strong>2010</strong>.<br />
Yury Gavrilov was born in 1969.<br />
He holds a degree in Mechanical Engineering and<br />
Research from Perm State Technical University.<br />
Since 1999 he has served as the General Director of<br />
the investment company Finansovy Dom (Financial<br />
House).<br />
Yurу Gavrilov was a member of <strong>Uralkali</strong>’s<br />
Investments and Development Committee of the<br />
Board of Directors of <strong>Uralkali</strong>.<br />
The powers of Yurу Gavrilov as a member of the<br />
Board of Directors of the Company were terminated<br />
on 17 September <strong>2010</strong>.<br />
Andrey Konogorov<br />
Member of the Board of Directors in 1996–1998,<br />
2000–2004, and in 2008–<strong>2010</strong>.<br />
Advisor to the Chairman of the Board of Directors<br />
since October 2009.<br />
Andrey Konogorov was born in 1964.<br />
He graduated from Perm Polytechnic Institute in<br />
1986 with a degree in Mining Engineering and in<br />
2003 was awarded a degree in Strategic Management<br />
and Business by the Academy of National Economy<br />
under the patronage of the Government of the<br />
Russian Federation.<br />
Andrey Konogorov was the Chairman of the<br />
Appointments and Remuneration Committee<br />
and served on both the Audit Committee and the<br />
Investments and Development Committee of the<br />
Board of Directors of <strong>Uralkali</strong>.<br />
The powers of Andrey Konogorov as a member<br />
of the Board of Directors of the Company were<br />
terminated on 17 September <strong>2010</strong>.<br />
112 <strong>Uralkali</strong> | <strong>Annual</strong> <strong>Report</strong> <strong>2010</strong><br />
Kuzma Marchuk<br />
Member of the Board of Directors in 2007–<strong>2010</strong>.<br />
Kuzma Marchuk was born in 1973. He graduated<br />
from the Russian Academy of Economics n. a.<br />
Plekhanov in 1995 with a degree in Foreign Economic<br />
Activities of Enterprises and Organisations and<br />
received a degree in Physics from Moscow State<br />
University n. a. Lomonosov in 1996.<br />
Vice President for Finance (CFO) of OJSC <strong>Uralkali</strong><br />
in 2004–2009.<br />
Kuzma Marchuk was the Chairman of the<br />
Investments and Development Committee and<br />
served on both the Audit Committee and the<br />
Appointments and Remuneration Committee of the<br />
Board of Directors of <strong>Uralkali</strong>.<br />
The powers of Kuzma Marchuk as a member of the<br />
Board of Directors were terminated on 17 September<br />
<strong>2010</strong>.<br />
Vladimir Ruga<br />
Member of the Board of Directors in 2008–<strong>2010</strong>.<br />
Vladimir Ruga was born in 1970.<br />
He graduated from Moscow State Pedagogical<br />
University with a degree in History in 1993.<br />
In 2003–<strong>2010</strong> Mr. Ruga worked in TNK-<br />
BP Management as Vice-President for Public<br />
Relations.<br />
Vladimir Ruga was a member of the Appointments<br />
and Remuneration Committee of the Board of<br />
Directors of <strong>Uralkali</strong>.<br />
The powers of Vladimir Ruga as a member of the<br />
Board of Directors of the Company were terminated<br />
on 17 September <strong>2010</strong>.<br />
Anna Koff<br />
Member of the Board of Directors in June-<br />
September <strong>2010</strong>.<br />
Anna Koff was born in 1965.<br />
Table of Contents
CORPORATE GOVERNANCE<br />
In 1988 she graduated from Moscow State<br />
University n.a. M.V. Lomonosov with a degree in<br />
History.<br />
Senior Partner, Director of Consulting of CJSC<br />
Development of the basics of the expert-personnel<br />
system (Razrabotka Osnov Sistemy Expert- Personal).<br />
The powers of Anna Koff as a member of the Board<br />
of Directors were terminated on 17 September <strong>2010</strong>.<br />
Denis Morozov<br />
Member of the Board of Directors in June-<br />
September <strong>2010</strong>.<br />
Denis Morozov was born in 1973.<br />
In February-August <strong>2010</strong> he was the President<br />
of OJSC <strong>Uralkali</strong>. From 1 July until 4 August<br />
<strong>2010</strong> Mr. Morozov was the General Director and<br />
the Chairman of the Management Board of the<br />
Company.<br />
He graduated from Moscow State University n.a.<br />
M.V. Lomonosov in 1993 with a degree in Political<br />
Economy. In 1996 earned his Law degree from the<br />
same university. Denis Morozov also holds a degree<br />
in Commerce and Banking from the Swiss School of<br />
Banking, which he earned in 1999. In the same year<br />
Mr. Morozov fi nished his postgraduate studies at the<br />
Moscow State University of International Relations<br />
under the patronage of the Ministry of Foreign<br />
Affairs of the Russian Federation. He specialised<br />
in International Economic Relations and earned a<br />
Candidate degree in Economics.<br />
Denis Morozov has served on the Boards of<br />
Directors of OJSC MMC Norilsk Nickel, CJSC Gold<br />
Mining Company Polyus and OJSC Polyus Gold.<br />
During his work for MMC Norilsk Nickel he worked<br />
as the Head of the Offi ce of the Board of Directors,<br />
Deputy General Director and as a member of the<br />
Management Board. In April 2007 – June 2008<br />
Mr. Morozov held the post of the General Director<br />
and Chairman of the Management Board of OJSC<br />
MMC Norilsk Nickel.<br />
Table of Contents<br />
The powers of Denis Morozov as a member of the<br />
Board of Directors of the Company were terminated<br />
on 17 September <strong>2010</strong>.<br />
Hans Jochum Horn<br />
Member of the Board of Directors since 2008.<br />
Hans Jochum Horn was born in 1948.<br />
He earned a degree in Commerce from<br />
the University of Mannheim in 1974 (Diplom<br />
Kaufmann, MBA), and in 1977 graduated from<br />
Bergen University as a State Authorised Public<br />
Accountant. Mr. Horn came to Moscow in 1990 in<br />
order to open representative offi ces of the company<br />
Arthur Andersen in Russia. Mr. Horn managed<br />
Arthur Andersen for fi fteen years, during which time<br />
Arthur Andersen became integrated with Ernst &<br />
Young in the CIS and now employs 1900 people. Mr.<br />
Horn was in charge of 13 offi ces in 7 countries of the<br />
Commonwealth of Independent States. As an advisor<br />
to various government and business organisations<br />
in Russia and the CIS, Mr. Horn has worked with<br />
numerous companies in the spheres of auditing,<br />
business consulting and fi nance; he has worked with<br />
large local companies as well as with the leading<br />
foreign investors in Russia and the CIS. Mr. Horn<br />
is the Head of the Norwegian Association of MBA<br />
Graduates; he is one of the founders of the German<br />
Chamber of Commerce in Russia and is the President<br />
of “Junior Achievement Russia”. In 2004 Kommersant<br />
Publishing House included Mr. Horn into the list of<br />
one hundred top leading businessmen in Russia.<br />
Hans Jochum Horn is a Deputy Chief Executive<br />
Offi cer of Renaissance Group.<br />
Mr. Horn is the Chairman of the Audit Committee<br />
of the Board of Directors of <strong>Uralkali</strong>.<br />
Hans Jochum Horn is an independent director<br />
within the meaning of the Federal Law “On Joint<br />
Stock Companies”, the Corporate Governance Code<br />
of OJSC <strong>Uralkali</strong> and the UK Combined Corporate<br />
Governance Code.<br />
113
CORPORATE GOVERNANCE<br />
Ilya Yuzhanov<br />
Member of the Board of Directors since 2006.<br />
Ilya Yuzhanov was born in 1960.<br />
He graduated from Zhdanov Leningrad State<br />
University with a degree in Economics in 1982. He<br />
has a PhD in Economics.<br />
In 1993–1997 Mr. Yuzhanov held various executive<br />
positions in state agencies of St. Petersburg. In 1997–<br />
1998 Mr. Yuzhanov headed the State Committee<br />
on Land Resources and Land Utilisation of the<br />
Russian Federation. In 1998 he chaired the Ministry<br />
of Land Policy, Construction and Utilities of the<br />
Russian Federation. In 1999–2004 he served as the<br />
Minister of Antimonopoly Policy and Entrepreneur<br />
Support of the Russian Federation. In 2000–2003<br />
Ilya Yuzhanov served on the Board of Directors of<br />
OJSC Gazprom. In 2003–2004 he was a member of<br />
the Board of Directors of OJSC Russian Railroads. In<br />
2000–2008 Mr. Yuzhanov was a member of the Board<br />
of Directors of RJSC UES of Russia. In 2004–2006 he<br />
served as the Chairman of the Supervisory Board<br />
of OJSC NOMOS-BANK; he has been a member of<br />
the Supervisory Board of this company since 2006.<br />
From 2006 until 2009 Mr. Yuzhanov served on the<br />
Boards of Directors of OJSC Novatek and OJSC<br />
Kirovsky plant. In 2008 he also served on the Board<br />
of Directors of JSC IDGC Holding. He has worked<br />
as the Chairman of the Board of Directors of OJSC<br />
Polymetal since 2008. Mr. Yuzhanov has been a<br />
member of the Supervisory Board of JSC Alrosa since<br />
2009. In 2009–<strong>2010</strong> Ilya Yuzhanov held the post of<br />
the Managing Director of LLC Deutsche Bank.<br />
Mr. Yuzhanov has been serving on the Appointments<br />
and Remuneration Committee of the Board<br />
of Directors of <strong>Uralkali</strong> as its Chairman since September<br />
<strong>2010</strong>.<br />
Ilya Yuzhanov is an independent director within the<br />
meaning of the Federal Law “On Joint Stock Companies”,<br />
Corporate Governance Code of OJSC <strong>Uralkali</strong> and the<br />
UK Combined Corporate Governance Code.<br />
114 <strong>Uralkali</strong> | <strong>Annual</strong> <strong>Report</strong> <strong>2010</strong><br />
Alexander Voloshin<br />
Member of the Board of Directors since <strong>2010</strong>.<br />
Alexander Voloshin was born in 1956.<br />
He graduated from the Moscow University of<br />
Transport Engineering in 1978 and the All-Union<br />
Academy of Foreign Trade in 1986.<br />
In 1999–2003 – Head of Administration of the<br />
President of the Russian Federation.<br />
In 1999–2008 – the Chairman of the Board of<br />
Directors of RJSC UES of Russia.<br />
In 2005–2008 – member of the Boards of<br />
Directors of OJSC Federal network company of the<br />
United Energy System and OJSC Systems operator –<br />
Central call center of the United Energy System. In<br />
2008 – served on the Board of Directors of JSC IDGC<br />
Holding. In 2008–<strong>2010</strong> – Chairman of the Board<br />
of Directors of the OJSC MMC Norilsk Nickel. In<br />
2011 Alexander Voloshin was elected to the Board<br />
of Directors of OJSC MMC Norilsk Nickel and on<br />
01 April 2011 became the Chairman of the Board of<br />
Directors of this company.<br />
He was appointed Head of the task group<br />
responsible for establishment of the International<br />
Financial Center in July <strong>2010</strong> by the Order of the<br />
President of the Russian Federation.<br />
Since August <strong>2010</strong> he has served on the Board of<br />
Diretors of Yandex NV.<br />
Mr. Voloshin was elected Chairman of the Board<br />
of Directors of <strong>Uralkali</strong> on 17 September <strong>2010</strong>.<br />
Alexander Voloshin is an independent director<br />
within the meaning of the Federal Law “On Joint<br />
Stock Companies”, Corporate Governance Code<br />
of OJSC <strong>Uralkali</strong> and the UK Combined Corporate<br />
Governance Code.<br />
Table of Contents
CORPORATE GOVERNANCE<br />
Anton Averin<br />
Member of the Board of Directors since <strong>2010</strong>.<br />
Anton Averin was born in 1966.<br />
In 1988 he graduated from Moscow State<br />
University with a degree in Mathematics.<br />
In 1995 he earned a Master’s Degree in<br />
Management from the International University in<br />
Moscow.<br />
In 2002–2005 Mr. Averin worked as the Director<br />
of the Investment Department of Nafta Moskva LLC,<br />
and since 2005 – as the Director of the Investment<br />
Department of the OJSC GNK Nafta Moskva. In 2008<br />
Mr. Averin was appointed Managing Director of the<br />
Company Nafta Moskva.<br />
Anton Averin is a Member of the Investments and<br />
Development Committee of the Board of Directors<br />
of <strong>Uralkali</strong>.<br />
Pavel Grachev<br />
Member of the Board of Directors since <strong>2010</strong>.<br />
Pavel Grachev was born in 1973.<br />
Mr. Grachev graduated from the Italian University<br />
of Trieste and Saint Petersburg State University in<br />
1998 with a degree in Law.<br />
In 1998–2006 Pavel Grachev worked for the law<br />
firm Pavia e Ansaldo as the Managing Partner of<br />
the Moscow representative offi ce. In 2006 he was<br />
appointed Director of the legal department of Nafta<br />
Moskva and in 2008 – Managing Director of this<br />
company.<br />
In 2009 Mr. Grachev became a member of the<br />
Boards of Directors of the OJSC PIK Group and OJSC<br />
Polyus Gold. He has been serving on the Board of<br />
Directors of PIK Group as its Chairman since <strong>2010</strong>.<br />
From August <strong>2010</strong> until February 2011 he worked<br />
as the General Director and President of OJSC<br />
<strong>Uralkali</strong>.<br />
Table of Contents<br />
In <strong>2010</strong> Pavel Grachev became a member of<br />
the Supervisory Board of CJSC Belarusian Potash<br />
Company I .<br />
P. Grachev served on the Appointments and<br />
Remuneration Committee of <strong>Uralkali</strong> from<br />
September <strong>2010</strong> until April 2011. His powers as a<br />
Member of this Committee are terminated as of the<br />
date of approval of this annual report.<br />
Anna Kolonchina<br />
Member of the Board of Directors since <strong>2010</strong>.<br />
Anna Kolonchina was born in 1972.<br />
In 1994 she graduated from the Financial<br />
Academy under the patronage of the Government of<br />
the Russian Federation with a degree in Accounting<br />
and Audit.<br />
From 2001 to 2008 Ms. Kolonchina worked as a<br />
Director at Deutsche Bank AG, London. In 2008<br />
Ms. Kolonchina worked as the Managing Director<br />
of Wainbridge Limited. From November 2008<br />
until February <strong>2010</strong> worked as Vice-President for<br />
economics and finance of OJSC PIK Group. In<br />
February <strong>2010</strong> was appointed Managing Director of<br />
Nafta Moskva.<br />
Since <strong>2010</strong> Anna Kolonchina has been serving on<br />
the Boards of Directors of OJSC PIK Group, OJSC<br />
Polyus Gold, OJSC JSCB International Financial<br />
Club. She is a member of the Supervisory Board of<br />
CJSC Belarusian Potash Company.<br />
Anna Kolonchina is a Member of the Audit<br />
Committee of the Board of Directors of <strong>Uralkali</strong>.<br />
Alexander Malakh<br />
Member of the Board of Directors since <strong>2010</strong>.<br />
Alexander Malakh was born in 1964.<br />
In 1985 he graduated from the State University<br />
of Kazan with a degree in Applied Mathematics.<br />
Note<br />
I. On 09.03.2011 the powers of P. Grachev as a member of the Supervisory Board<br />
of CJSC Belarusian Potash Company were terminated<br />
115
CORPORATE GOVERNANCE<br />
He earned a Master’s degree in Computational<br />
Mechanics from the University of New York in 1994<br />
and received an MBA from Wharton Business School<br />
at the University of Pennsylvania in 1998.<br />
From 1998 till 2001 Mr. Malakh worked as a<br />
consultant at McKinsey & Company. From 2001 until<br />
2004 Mr. Malakh held executive positions at Mars<br />
Incorporated: Head of New Business in the CIS,<br />
General Director of Mars Ukraine.<br />
In 2004–2007 Mr. Malakh held the post of<br />
Managing Director of Alfa Eco Group and served<br />
as the Chairman of the Boards of Directors of all<br />
its subsidiaries. In 2007–<strong>2010</strong> Mr. Malakh served as<br />
CEO of Rosvodokanal.<br />
Mr. Malakh has been working as Deputy CEO of<br />
ICT Group.<br />
Alexander Malakh is the Chairman of the<br />
Investments and Development Committee and a<br />
member of the Audit Committee of the Board of<br />
Directors of <strong>Uralkali</strong>.<br />
Alexander Mosionzhik<br />
Member of the Board of Directors since <strong>2010</strong>.<br />
Alexander Mosionzhik was born in 1961.<br />
In 1983 he graduated from Tula Polytechnic<br />
University, with a degree in Applied Mathematics.<br />
He has a PhD in Mathematics.<br />
Mr. Mosionzhik has worked for Nafta Mosvka<br />
since 1999. He fi rst started in the company as the<br />
First Deputy CEO and later became the CEO. In<br />
2006 he was elected the Chairman of the Board of<br />
Directors of Nafta Moskva.<br />
In 2005–2008 Mr. Mosionzhik was the Chairman<br />
of the Board of Directors of OJSC Polymetal.<br />
Since 2009 Mr. Mosionzhik has been serving on<br />
the Boards of Directors of PIK Group and OJSC<br />
Polyus Gold; he is also a Deputy Chairman of the<br />
Board of Directors of OJSC Polyus Gold.<br />
116<br />
Since <strong>2010</strong> Alexander Mosionzhik has been<br />
serving as a member of the Board of Directors of<br />
OJSC JSCB International Financial Club, member<br />
of the Supervisory Board of CJSC Belarusian Potash<br />
Company.<br />
Since April 2011 – member of the Board of the<br />
Russian Union of Industrialists and Entrepreneurs, a<br />
non-profi t organisation which promotes the interests<br />
of Russian business.<br />
Alexander Mosionzhik is the Deputy Chairman of<br />
the Board of Directors of <strong>Uralkali</strong> and a member of<br />
the Appointments and Remuneration Committee of<br />
the Board of Directors of <strong>Uralkali</strong>.<br />
Alexander Nesis<br />
Member of the Board of Directors since <strong>2010</strong>.<br />
Alexander Nesis was born in 1962.<br />
In 1985 he graduated from Lensovet Leningrad<br />
Institute of Technology with a degree in Radiochemistry.<br />
Alexander Nesis started his professional career in<br />
1986 in Baltiysky Plant where he worked until 1989.<br />
In 1991 founded and managed a business entity<br />
which was then formed into an ICT Group in 1993.<br />
In 1993–1998 and in 2002–2005 Mr. Nesis served as<br />
the Chairman of the Board of Directors of Baltiysky<br />
Plant.<br />
In 1998–2003 Mr. Nesis worked as CEO of OJSC<br />
Polymetal – an ICT Group mining company.<br />
CEO of ICT Group.<br />
Alexander Nesis is Deputy Chairman of the Board<br />
of Directors of <strong>Uralkali</strong> , member of the Investments<br />
and Development Committee and member of the<br />
Appointments and Remuneration Committee of the<br />
Board of Directors of <strong>Uralkali</strong>.<br />
<strong>Uralkali</strong> | Anual <strong>Report</strong> <strong>2010</strong> Table of Contents
CORPORATE GOVERNANCE<br />
INFORMATION FOR SHAREHOLDERS<br />
AND INVESTORS<br />
<strong>Uralkali</strong> securities are listed and traded on LSE,<br />
RTS and MICEX stock exchanges. The Company<br />
strictly observes the Federal Law “On Joint<br />
Stock Companies” as well as the rules governing<br />
companies listed on the Russian and London Stock<br />
Exchanges.<br />
<strong>Uralkali</strong> discloses all relevant information to<br />
shareholders and investors in full and in a timely<br />
fashion.<br />
ORDINARY SHARES<br />
As of 31 December <strong>2010</strong> the authorised capital<br />
of <strong>Uralkali</strong> was 1,062,195,000 RUR, divided I into<br />
2,124,390,000 registered ordinary shares with a par<br />
value of 0.5 RUR per share.<br />
A 16 January 2004 directive of the Federal<br />
Commission for the Securities Market of Russia<br />
No. 04-81/r combined the additional issues of<br />
<strong>Uralkali</strong> securities. As a result, issues of registered<br />
ordinary uncertificated shares were assigned the<br />
state registration number 1-01-00296-A.<br />
On 4 February 2011 <strong>Uralkali</strong>’s Shareholder<br />
Extraordinary General Meeting approved the<br />
proposal of the Board of Directors to introduce<br />
amendments to the Charter of the Company and<br />
pass the Charter in a new version. One of the key<br />
amendments was changing the number of the<br />
authorised shares, as it was stated in the Charter of<br />
the Company: instead of 1,500,000,000 (one billion<br />
five hundred million) shares with a par value of<br />
0.5 rouble per share the shareholders resolved that<br />
the Company has a right to issue 2,700,000,000 (two<br />
billion seven hundred million) ordinary registered<br />
shares with a par value of 0.5 rouble per share<br />
(hereinafter “authorised shares”). The increase in<br />
the number of the authorised shares was executed in<br />
order to convert OJSC Silvinit shares into <strong>Uralkali</strong>’s<br />
Note<br />
I. <strong>Uralkali</strong>’s 2009 fi nancial statement, prepared in accordance with Russian<br />
Accounting Standards (Balance Sheet, line 410)<br />
Table of Contents<br />
shares when the merger between the two companies<br />
takes place.<br />
On 21 February 2011 the Board of Directors<br />
resolved to increase the authorised capital of the<br />
Company within the limits of the authorised shares<br />
through an additional offering of the ordinary<br />
registered shares of the Company to the number of<br />
1,200,000,000 (one billion two hundred million)<br />
shares with a par value of 0.5 rouble per share, with<br />
the combined value of 600,000,000 (six hundred<br />
million) RUR. The method of offering was to convert<br />
the ordinary and privileged shares of Silvinit into<br />
the ordinary shares of <strong>Uralkali</strong>. In connection with<br />
the increase of the authorised capital the Board of<br />
Directors also passed a resolution on the issuance of<br />
additional 1,050,000,000 shares and on the issuance<br />
of 150,000,000 shares to convert privileged shares of<br />
Silvinit into the ordinary shares of <strong>Uralkali</strong>.<br />
As of 1 January <strong>2010</strong>, there were 9,871 holders<br />
of record in <strong>Uralkali</strong>’s shareholder register; as<br />
of 31 December <strong>2010</strong>, there were 9,626 holders of<br />
record.<br />
GLOBAL DEPOSITARY<br />
RECEIPTS (GDRS)<br />
GDRs are issued in respect of ordinary shares in<br />
<strong>Uralkali</strong> at the ratio of 5 registered ordinary shares<br />
per 1 GDR. Global Depository Receipts are listed and<br />
traded on the London Stock Exchange (LSE).<br />
Securities traded on the stock exchanges (LSE,<br />
MICEX and RTS) are fungible – ordinary shares may<br />
be converted into GDRs and vice versa.<br />
The Federal Service for Financial Markets of the<br />
Russian Federation (FSFM) has issued a clarifi cation<br />
at <strong>Uralkali</strong>’s request that the FSFM permission<br />
granted to <strong>Uralkali</strong> with respect to its ordinary shares<br />
eligible for deposit into <strong>Uralkali</strong> GDR programme<br />
allows newly issued <strong>Uralkali</strong> shares to be deposited<br />
into the programme provided there is a headroom<br />
117
CORPORATE GOVERNANCE<br />
within the limit of <strong>Uralkali</strong> ordinary shares specifi ed<br />
in the FSFM permission. The FSFM permission<br />
allows up to 616,073,100 <strong>Uralkali</strong> ordinary shares to<br />
be deposited into the programme. As a result, new<br />
<strong>Uralkali</strong> ordinary shares that will be issued upon<br />
conversion of ordinary and preferred shares in OJSC<br />
Silvinit on the merger of Silvinit into <strong>Uralkali</strong> will<br />
become eligible for deposit into the <strong>Uralkali</strong> GDR<br />
programme after registration of the prospectus,<br />
which may take up to 3 weeks after completion of<br />
the merger.<br />
As of 31 December <strong>2010</strong>, GDRs traded on the LSE<br />
amounted to 20% of the authorised capital of the<br />
Company. The depository is Bank of New York (see<br />
contacts on p. 121).<br />
STOCK EXCHANGES<br />
As of 31 December <strong>2010</strong>, <strong>Uralkali</strong>’s ordinary<br />
shares and GDRs, certifying the rights in respect<br />
to ordinary shares of <strong>Uralkali</strong>, are traded on the<br />
following stock exchanges: LSE, MICEX and RTS.<br />
Equity structure, 31 December, <strong>2010</strong><br />
25.00% Kaliha Finance Ltd<br />
20.31% The Bank of New York<br />
16.48% Legal entities<br />
and individuals<br />
13.20% Aerellia Investments Ltd<br />
10.01% Madura Holding Ltd<br />
8.00% Becounioco Holdings Ltd<br />
7.00% Cosmopro Trading Ltd<br />
118 <strong>Uralkali</strong> | <strong>Annual</strong> <strong>Report</strong> <strong>2010</strong><br />
Equity structure is given as of 19 April 2011<br />
25.00% Kaliha Finance Ltd<br />
21.10% The Bank of New York<br />
17.70% Legal entities and individuals<br />
8.00% Becounioco Holdings Ltd<br />
I<br />
5.65% Sterosol Holdings LtdII 7.55% Aerellia Investments Ltd<br />
7.00% Cosmopro Trading Ltd<br />
4.50% Perfecthold Ltd<br />
3.50% Serpentia Investments Ltd<br />
Company Benefi ciary<br />
Share in<br />
<strong>Uralkali</strong><br />
Kaliha Finance Ltd Suleiman Kerimov 25.0%<br />
Aerellia Investments Ltd Alexander Nesis 7.55%<br />
Sterosol Holdings Ltd Alexander Nesis 5.65II %<br />
Perfecthold Ltd Alexander Nesis 4.5%<br />
Becounioco Holdings Ltd Filaret Galchev 8.0%<br />
Cosmopro Traiding Ltd Filaret Galchev 7.0%<br />
Serpentia Investments Ltd Alexander Mamut<br />
The Bank of New York<br />
3.5%<br />
(depositary) 21.1 I Legal entities and<br />
%<br />
individuals 17.7%<br />
Notes<br />
I. As of 15 April 2011<br />
II. Includes 0.95% of the ordinary shares of OJSC <strong>Uralkali</strong> represented by GDRs<br />
of <strong>Uralkali</strong> held by Sterosol Holdings Ltd<br />
Table of Contents
CORPORATE GOVERNANCE<br />
Ticker code<br />
RTS URKA, URKAG, URKAS<br />
MICEX URKA<br />
LSE URKA<br />
CUSIP I :<br />
– Regulation S GDRs 91688E206<br />
– Rule 144A GDRs 91688E107<br />
ISIN II :<br />
– Regulation S GDRs US91688E2063<br />
– Rule 144A GDRs US91688E1073<br />
RU0007661302<br />
Shares price performance on the RTS, <strong>2010</strong><br />
RUR<br />
250.00<br />
200.00<br />
150.00<br />
100.00<br />
50.00<br />
0.00<br />
Jan <strong>2010</strong><br />
Feb <strong>2010</strong><br />
Mar <strong>2010</strong><br />
Apr <strong>2010</strong><br />
May <strong>2010</strong><br />
Shares price performance on the MICEX, <strong>2010</strong><br />
US$<br />
40.00<br />
35.00<br />
30.00<br />
25.00<br />
20.00<br />
15.00<br />
10.00<br />
5.00<br />
0.00<br />
Jan <strong>2010</strong><br />
Feb <strong>2010</strong><br />
Mar <strong>2010</strong><br />
Jun <strong>2010</strong><br />
Notes<br />
I. CUSIP (Committee on Uniform Security Identification Procedures) –<br />
identifi cation number given to the issue of shares for the purposes facilitating<br />
clearing<br />
II. ISIN (International Securities Identification Number) – International<br />
Identifi cation Number of the share<br />
Table of Contents<br />
Apr <strong>2010</strong><br />
May <strong>2010</strong><br />
Jun <strong>2010</strong><br />
Jul <strong>2010</strong><br />
Jul <strong>2010</strong><br />
Aug <strong>2010</strong><br />
Aug <strong>2010</strong><br />
Sep <strong>2010</strong><br />
Sep <strong>2010</strong><br />
Oct <strong>2010</strong><br />
Oct <strong>2010</strong><br />
Nov <strong>2010</strong><br />
Nov <strong>2010</strong><br />
Dec <strong>2010</strong><br />
Dec <strong>2010</strong><br />
GDR price performance on the LSE, <strong>2010</strong><br />
RUR<br />
250.00<br />
200.00<br />
150.00<br />
100.00<br />
50.00<br />
0.00<br />
Jan <strong>2010</strong><br />
Feb <strong>2010</strong><br />
Mar <strong>2010</strong><br />
Apr <strong>2010</strong><br />
May <strong>2010</strong><br />
LSE: TRADING IN GDR URKA<br />
<strong>2010</strong> 2009<br />
Maximum 36.7 26.5<br />
Minimun 15.0 4.2<br />
Price at the end of the year 36.7 21.0<br />
Trading Volume (mln GDRs) 286.8 291.3<br />
(US$)<br />
MICEX: TRADING IN ORDINARY<br />
SHARES URKA (MARKET<br />
TRANSACTIONS)<br />
Jun <strong>2010</strong><br />
<strong>2010</strong> 2009<br />
Maximum 220.5 153.9<br />
Minimum 94.2 35.3<br />
Price at the end of the year 219.3 125.5<br />
Trading Volume (mln shares) 731.4 1,486.3<br />
(RUR)<br />
RTS: TRADING IN ORDINARY SHARES<br />
URKA (MARKET TRANSACTIONS)<br />
<strong>2010</strong> 2009<br />
Maximum 220.0 152.0<br />
Minimum 97.1 34.0<br />
Price at the end of the year 220.0 123.9<br />
Trading Volume (mln shares) 4.3 7.3<br />
(RUR)<br />
Jul <strong>2010</strong><br />
Aug <strong>2010</strong><br />
Sep <strong>2010</strong><br />
Oct <strong>2010</strong><br />
Nov <strong>2010</strong><br />
Dec <strong>2010</strong><br />
119
CORPORATE GOVERNANCE<br />
DIVIDENDS<br />
TAXATION<br />
Dividend payments in Russia are taxed at 9%<br />
for domestic shareholders, both individuals and<br />
corporate entities, and 15% for overseas investors. In<br />
situations when a double taxation treaty is applied,<br />
the tax payable is determined by reference to this<br />
agreement.<br />
The company discloses taxation data as general<br />
information. Potential and existing investors in<br />
<strong>Uralkali</strong> shares, including GDRs, are advised to consult<br />
their investment advisors on tax implications.<br />
DIVIDEND POLICY<br />
Dividend payment is subject to Russian federal law.<br />
Dividends are paid from <strong>Uralkali</strong>’s net profi t (profi t<br />
after tax), which is determined based on its accounting<br />
Period<br />
DIVIDENDS PER CHARE<br />
Date of decision Dividend per ordinary share<br />
on dividend payment<br />
/ one GDR, RUR<br />
statements. In accordance with the Federal Law “On<br />
Joint Stock Companies”, the Company Charter and<br />
the Regulations on Dividend Policy, the Company<br />
is entitled to decide (announce) on the full-year<br />
dividend, as well as quarterly dividends at three, six<br />
and nine months (interim dividends). Decisions on<br />
the payment and size of dividends are made by the<br />
Shareholder General Meeting. However, the dividend<br />
amount may not exceed the amount recommended<br />
by the Company’s Board of Directors.<br />
<strong>Uralkali</strong>’s dividend policy stipulates that dividend<br />
payments should amount to at least 15 percent of net<br />
profi t, determined on the basis of the Company’s<br />
fi nancial statements for the corresponding period,<br />
prepared in accordance with the International<br />
Financial <strong>Report</strong>ing Standards (IFRS). At the same<br />
time, <strong>Uralkali</strong> draws shareholders’ attention to the<br />
fact that setting dividend payments is a right, and not<br />
an obligation, of the Company.<br />
Accrued dividends, RUR<br />
in ths<br />
Dividend payout ratio<br />
(dividend payment as % of<br />
net profi t)<br />
9 months of 2005 30.12.2005 2.46 5,225,999.4 55%<br />
9 months of 2006 15.12.2006 1.59 3,377,780.1 97%<br />
2007 18.06.2008 1.90/9.5 4,036,341.0 50%<br />
6 months of 2008 19.09.2008 4.0/20.0 8,497,560.0 39%<br />
2009 18.06.<strong>2010</strong> 1.7/8.5 3,611,463.0 40%<br />
<strong>Uralkali</strong> discloses all relevant information on dividends in the quarterly issuer reports which are available on the<br />
Company’s website: www.uralkali.com.<br />
120 <strong>Uralkali</strong> | <strong>Annual</strong> <strong>Report</strong> <strong>2010</strong><br />
Table of Contents
CONTACTS<br />
REGISTRAR:<br />
Closed Joint Stock Company Registrator Intraco<br />
Abbreviated name: Registrator Intraco<br />
64, Lenina Street, Perm, Russian Federation,<br />
614990<br />
Tel: +7(342) 233-01-64<br />
Fax: +7(342) 233-01-63<br />
Web: www.intraco.ru<br />
E-mail: root@intraco.ru<br />
Operating licence to maintain share register<br />
Licence number: 10-000-1-00272<br />
Date of issue: 24.12.2002<br />
Date of expiry: Perpetual<br />
Issuing authority: Federal Financial Markets<br />
Service<br />
DEPOSITORY:<br />
Bank of New York<br />
101 Barclay Street<br />
22nd Floor<br />
New York, New York 10286<br />
United States of America<br />
Table of Contents<br />
IR CONTACTS:<br />
Anna Batarina<br />
Vice President for Investor Relations<br />
Daria Fadeeva<br />
Investor Relations Manager<br />
Tel: +7(495) 730-2371<br />
ir@msc.uralkali.com<br />
MEDIA CONTACTS:<br />
Alexey Sotskov<br />
Head of Media Relations<br />
Vladimir Ravinsky<br />
Head of Media Relations Unit<br />
Tel: +7(495) 730-2371<br />
pr@msc.uralkali.com<br />
121
RISK MANAGEMENT<br />
URALKALI’S RISK MANAGEMENT SYSTEM<br />
The Audit Committee of <strong>Uralkali</strong>’s Board of<br />
Directors has designated the development of an<br />
effective risk management system as one of the<br />
Company’s most important strategic aims.<br />
This includes identifying the events that can<br />
adversely affect the Company’s ability to meet its<br />
business objectives in a timely and effi cient manner<br />
and implementing adequate countermeasures,<br />
ensuring the balance between the responsibilities<br />
and authorities of the decision-makers.<br />
Risk management is an indispensible part of<br />
<strong>Uralkali</strong>’s system of corporate governance: all<br />
employees of the Company participate in the<br />
process of managing risks on continuing basis. In<br />
<strong>2010</strong> the Company aimed its efforts at identifying<br />
and assessing risks, developing and implementing<br />
the countermeasures directed at minimising these<br />
risks. <strong>Uralkali</strong>’s key risk ranking Matrix was regularly<br />
updated with regard to the changes of external and<br />
internal risk factors<br />
To minimise risks, the Company’s management<br />
focused their efforts on implementing plans of<br />
corrective measures aimed at addressing high risks<br />
in the fi elds of <strong>Uralkali</strong>’s corporate governance and<br />
investment management, production, environment<br />
and industrial safety, purchasing and distribution.<br />
To provide reasonable assurance that the Company’s<br />
risk appetite corresponds to the remaining risks,<br />
<strong>Uralkali</strong>’s management oversaw timeliness and<br />
effi ciency of implementation of corrective measures<br />
and the subsequent risk assessment.<br />
122 <strong>Uralkali</strong> | <strong>Annual</strong> <strong>Report</strong> <strong>2010</strong> Table of Contents
RISK MANAGEMENT<br />
KEY RISK FACTORS<br />
This section describes only those key risk factors<br />
(in addition to the risks inherent to the jurisdictions<br />
in which <strong>Uralkali</strong> operates) which are likely to affect<br />
severely <strong>Uralkali</strong>’s business, fi nancial condition and<br />
operational performance. All estimates and forecasts<br />
presented in this <strong>Annual</strong> <strong>Report</strong> should be viewed<br />
taking into account the risk factors described in this<br />
section.<br />
Other risks that <strong>Uralkali</strong> is currently not aware of,<br />
or believes to be immaterial, could become material<br />
in future and may also have a severe adverse effect<br />
on <strong>Uralkali</strong>’s business, financial condition and<br />
operational results.<br />
The <strong>Annual</strong> <strong>Report</strong> does not present an exhaustive<br />
account of all risks facing the Company. <strong>Uralkali</strong> will<br />
make further disclosures of relevant information<br />
on an ongoing basis as required according to the<br />
demands of Russian legislation and the Disclosure<br />
and Transparency Rules of the UK Listing<br />
Authority.<br />
Inflation Inflationary pressures and currency fluctuations resulting in higher production costs due to the rise in<br />
prices of materials, resources and services (for example, freight services) may lead to a reduction in net<br />
profit and increase of investment outlay.<br />
Insufficient potash demand Macroeconomic factors, which include changes in the world population, availability of arable land per<br />
capita, reduced levels of income and lack of potash consumer finance, may result in reduced world demand<br />
for potash.<br />
Excess potash supply Excessive global potash production by potash producers and high inventory levels among consumers may<br />
lead to excess potash supply in the market, which could cause a decline in potash demand and create<br />
downwards pressure on potash prices. As a result, this may reduce revenue volumes and, consequently, the<br />
Company’s profitability.<br />
Investment activity The cost of expanding capacity and boosting performance as well as other investment costs account for a<br />
significant proportion of <strong>Uralkali</strong>’s budget. There is a risk that investment projects could exceed their time<br />
limits or planned costs, or that it may prove impossible to meet the projects’ technological targets.<br />
Suppliers and contractors <strong>Uralkali</strong>’s suppliers and contractors include key contractors that are of strategic importance for the<br />
Company’s operations. The loss of such contractors, substantial changes in the costs of their goods and<br />
services, and risk of default may adversely affect the Company's business.<br />
Employees <strong>Uralkali</strong>’s operations are dependent on the availability of professional and highly qualified employees<br />
in the labour market. <strong>Uralkali</strong> may fail to attract, retain and motivate high-quality staff and may face<br />
additional costs for training and professional development of the Company’s personnel. All this may<br />
adversely affect the Company’s ability to meet its business objectives.<br />
Licensing activity <strong>Uralkali</strong>’s activities depend on the continuing validity of its licences and compliance with their terms.<br />
Changes in legislation and withdrawal or restriction of licences by regulatory bodies may adversely affect<br />
the business of the Company.<br />
Production capacity and<br />
output<br />
<strong>Uralkali</strong>’s potash production may be diminished by various internal factors, such as emergency downtime<br />
or deterioration of physical infrastructure, and external factors, such as deterioration of ore quality or<br />
reduced capacity owing to technological changes prescribed by regulatory bodies as well as other internal<br />
and external factors.<br />
Production costs <strong>Uralkali</strong>’s production costs could rise as a result of the physical depreciation of the production equipment,<br />
utilisation of outdated technology in the process of production, ineffective productivity improvement<br />
programmes or the failure to implement cost reduction programmes. Exposure to such risks is likely to<br />
directly affect the level of the Company’s net profit.<br />
Mineral resources <strong>Uralkali</strong>’s estimates of its reserves and resources may be considerably different from the mineral quantities<br />
that can be actually recovered while certain ore reserves or mineral deposits may become unprofitable to<br />
mine.<br />
Table of Contents<br />
123
RISK MANAGEMENT<br />
Natural and mining hazards <strong>Uralkali</strong>’s mining and production operations are subject to hazards and risks associated with the<br />
exploration, development and processing of mineral resources, including potential flooding, fires and<br />
other accidents, which may lead to accidental losses and overall decrease of the Company’s efficiency.<br />
Risks related to Berezniki-1<br />
flooding<br />
Additional costs related to<br />
regulatory reviews<br />
The flooding of <strong>Uralkali</strong>’s Berezniki-1, which took place in October 2006, had a significant impact on the<br />
volume of <strong>Uralkali</strong>’s potash reserves and may result in additional costs, losses and liabilities.<br />
<strong>Uralkali</strong>’s activity is subject to various reviews by tax authorities, the Federal Service for Environmental,<br />
Technological and Nuclear Supervision (Rostekhnadzor) and other relevant regulatory bodies. These<br />
reviews may lead to the imposition of additional obligations, costs and restrictions (for example, if<br />
governmental authorities take a more assertive position in their assessment and interpretation of the<br />
legislation).<br />
Legislative changes <strong>Uralkali</strong> is subject to changes in Russian and international legislation, which may severely affect the<br />
Company’s business and result in additional costs the Company will accrue in order to operate in<br />
accordance with new legislative norms<br />
Antimonopoly law <strong>Uralkali</strong> is subject to antimonopoly legislation in Russia and other countries. Antimonopoly claims and<br />
lawsuits may lead to additional costs for the Company.<br />
Subsidiaries and joint<br />
ventures<br />
Health, safety and<br />
environment<br />
Proposed Combination<br />
124 <strong>Uralkali</strong> | <strong>Annual</strong> <strong>Report</strong> <strong>2010</strong><br />
Risks associated with <strong>Uralkali</strong>’s key subsidiaries and joint ventures (such as BPC and BBT) may adversely<br />
affect the Company’s business, including its distribution network.<br />
<strong>Uralkali</strong>’s operations and specificity of its property are subject to complex environmental and health and<br />
safety regulations (which may allow variant readings). Compliance with these regulations may result in<br />
additional costs and obligations for <strong>Uralkali</strong>.<br />
Various factors relating to the merger of OJSC «<strong>Uralkali</strong>» and OJSC «Silvinit», including court claims of<br />
minority shareholders, may have an adverse effect on the completion of the merger or may result in delay,<br />
additional costs, losses and liabilities.<br />
Table of Contents
RISK MANAGEMENT<br />
KEY FEATURES OF INTERNAL CONTROL<br />
AND RISK MANAGEMENT SYSTEM IN RELATION<br />
TO THE FINANCIAL REPORTING PROCESS<br />
The Company has a system of internal control in<br />
place. The system covers all key business processes of<br />
the Company including the process of preparation<br />
of fi nancial statements and reports.<br />
The system of internal control is governed by the<br />
Regulations on the System of Internal Control of<br />
Financial and Economic Activity of the Company,<br />
which is approved by the Board of Directors of the<br />
Company.<br />
Internal control procedures are primarily<br />
intended to ensure reliability and fairness of fi nancial<br />
statements and governance reports of the Company.<br />
Some of the key elements of the system of internal<br />
control are organisation of the system of collection,<br />
processing and transmission of information as well<br />
as generation of reports and messages containing<br />
operational, fi nancial and other information on the<br />
Company.<br />
The system of internal control implemented in the<br />
Company is based on the principle of separation of<br />
key functions and competences of the offi cers and<br />
departments of the Company that are responsible<br />
for the development, approval, implementation<br />
and assessment of the Company’s existing internal<br />
control procedures.<br />
Proper and timely actions of the management and<br />
the departments of the Company in compliance with<br />
their responsibilities are the main elements of the<br />
system of internal control in regards to its reliability,<br />
completeness and timeliness.<br />
The main aims of the risk management system are:<br />
identifi cation and assessment of risks to the existing<br />
business processes of the Company, and development<br />
and implementation of control procedures, which<br />
allow the Company to minimise its risks or to avoid<br />
them altogether.<br />
Table of Contents<br />
EXTERNAL AUDIT OF FINANCIAL<br />
STATEMENTS<br />
Every year the Company elects an external<br />
auditor who is responsible for the auditing and<br />
inspection of the consolidated fi nancial statements<br />
of the Company in compliance with the IFRS and<br />
who prepares reviews of the consolidated interim<br />
abbreviated fi nancial information of the Company in<br />
compliance with the requirements of the IFRS. The<br />
external auditor of the Company is selected from<br />
the “top four” auditing companies after a thorough<br />
review of their proposals. Following the review of<br />
the auditors’ proposals, the Audit Committee gives<br />
its recommendations to the Board of Directors<br />
regarding the candidature of the auditor and the<br />
amount of the auditor’s compensation, and advises<br />
the Board of Directors on other terms and conditions<br />
of the contract with the auditor. In <strong>2010</strong>, based on the<br />
recommendation of the Audit Committee, the Board<br />
of Directors selected CJSC PricewaterhouseCoopers<br />
Audit to conduct the audit of the fi nancial statements<br />
of the Company for the year <strong>2010</strong>.<br />
EXECUTIVE VICE-PRESIDENT FOR<br />
ECONOMICS AND FINANCE<br />
The Executive Vice-President for Economics and<br />
Finance is responsible for the following:<br />
• Ensuring availability of necessary information<br />
in the enterprise resource planning system of<br />
the Company; supervision and confirmation of<br />
reliability of the information entered into the<br />
enterprise resource planning system by the offi ce<br />
of the Executive Vice-President for Economics and<br />
Finance;<br />
• Coordination and management of relationship<br />
with the auditors of the Company;<br />
• Inventory of the assets of the Company.<br />
125
RISK MANAGEMENT<br />
REVISION COMMISSION<br />
The Revision Commission is responsible for the<br />
following aspects of preparation of the Company’s<br />
fi nancial statements:<br />
• confi rmation of the reliability of information<br />
included in the annual reports of the Company,<br />
its annual and periodic accounting statements<br />
and confi rmation of the reliability of information<br />
included in the reporting documents submitted to<br />
government authorities responsible for statistics and<br />
other government bodies;<br />
• assessment of the system of internal control.<br />
AUDIT COMMITTEE<br />
The Audit Committee is responsible for the<br />
following aspects of preparation of the Company’s<br />
fi nancial statements:<br />
• preliminary review of the Company’s reports<br />
and draft conclusions of the external auditor,<br />
discussion of these documents with the management<br />
of the Company prior to their review by the Board of<br />
Directors of the Company;<br />
• analysis of the annual report of the Company<br />
and other publicised information, development<br />
of recommendations regarding its preliminary<br />
approval;<br />
• development of recommendations regarding the<br />
candidature of the external auditor of the Company.<br />
Analysis of the auditor’s professional qualifi cations<br />
and independent status;<br />
• settlement of confl icts which may arise during<br />
the process of audit, including all restrictions of<br />
audit procedures and access to information;<br />
• supervision and monitoring of efficiency<br />
of internal control systems and procedures,<br />
development of recommendations regarding their<br />
improvement;<br />
126 <strong>Uralkali</strong> | <strong>Annual</strong> <strong>Report</strong> <strong>2010</strong><br />
• supervision and monitoring of effi ciency of risk<br />
management processes implemented in the Company<br />
and in the Group of companies; development of<br />
recommendations regarding possible improvement<br />
of risk management processes;<br />
• approval of the map of the key risks of the<br />
Company and monitoring of actions intended to<br />
minimise/hedge these key risks;<br />
• functional management of the department<br />
of internal audit, ensuring its independence and<br />
objectivity.<br />
BOARD OF DIRECTORS<br />
The Board of Directors of the Company approves<br />
the consolidated fi nancial statements of the Company<br />
prepared in compliance with the IFRS; the Board<br />
also approves the reviews of the consolidated interim<br />
abbreviated financial information prepared in<br />
accordance with the requirements of the IFRS, based<br />
on the recommendations of the Audit Committee<br />
which is responsible for preliminary review of the<br />
indicated documents.<br />
Table of Contents
RESPONSIBILITY STATEMENT<br />
Directors’ responsibility statement<br />
We confi rm that to the best of our knowledge:<br />
- the consolidated fi nancial statements, prepared in accordance with IFRS, give a true and fair view of the<br />
assets, liabilities, fi nancial position and profi t or loss of the Company and the undertakings included in the<br />
consolidation taken as a whole;<br />
- this <strong>Annual</strong> <strong>Report</strong> includes a fair review of the development and performance of the business and the position<br />
of the Company and the undertakings included in the consolidation taken as a whole, together with a description<br />
of the principal risks and uncertainties that they face.<br />
On behalf of the Board, which approved the making of the responsibility statement for the Company at a Board<br />
Meeting on 27 April 2011.<br />
Table of Contents<br />
127
REVIEW OF THE MINERAL RESOURCES<br />
AND ORE RESERVES OF JOINT STOCK<br />
COMPANY URALKALI LOCATED<br />
IN THE RUSSIAN FEDERATION<br />
This is a letter to confi rm that SRK Consulting (UK) Limited (SRK) has reviewed all of the key information on<br />
which the most recently (1 January 2011) reported Mineral Resource and Ore Reserve statements for the mining<br />
assets of Joint Stock Company <strong>Uralkali</strong> (<strong>Uralkali</strong>) are based. Specifi cally it sets out SRK’s view regarding the<br />
tonnes and grade of rock which has the potential to be mined by the existing and planned mining operations<br />
(the Mineral Resource), the quantity of product expected to be produced as envisaged by the respective Business<br />
Plan (the Ore Reserve) and the work done to derive these.<br />
SRK has not independently re-calculated Mineral Resource and Ore Reserve estimates for <strong>Uralkali</strong>’s operations<br />
but has, rather, reviewed the quantity and quality of the underlying data and the methodologies used to derive<br />
and classify the estimates as reported by <strong>Uralkali</strong> and made an opinion on these estimates including the tonnes,<br />
grade and quality of the potash planned to be exploited in the current mine plan, based on this review. SRK has<br />
then used this knowledge to derive audited resource and reserve statements according to the guidelines and<br />
terminology proposed in the JORC Code.<br />
This report presents both the existing <strong>Uralkali</strong> resource estimates according to Russian standard reporting<br />
terminology and guidelines and SRK’s audited JORC Code statements. All of these estimates are dated as of<br />
1 January 2011. SRK has restricted its assessment to the resources and reserves at Mine 2, Mine 4 and Mine 5. Mine<br />
1 and Mine 3 have been excluded as these have no realistic potential to be re-opened in the foreseeable future.<br />
1. QUANTITY AND QUALITY OF DATA<br />
While a drilling programme was initiated during 2009 to improve confi dence in the resource estimates in<br />
the eastern portion of Mine 4, the resource and reserve estimates derived by <strong>Uralkali</strong> are primarily based on<br />
exploration drilling undertaken between 1972 and 1998. A specially laid out drilling programme was developed<br />
for each mine with the aim of enabling 10% of the contained resources to be assigned to the A category of resources<br />
as defi ned by the Russian <strong>Report</strong>ing Code, 20% to the B category and 70% to the C 1 category.<br />
The A category is the highest category in the Russian <strong>Report</strong>ing Code and only used where the stated tonnage<br />
and grade estimates are considered to be known to a very high degree of accuracy. The B, C 1 and C 2 categories<br />
are lower confi dence categories, with C 2 denoting the least level of confi dence in the three categories. In the case<br />
of <strong>Uralkali</strong>, blocks are assigned to the A category where the drillhole spacing is less than 1km, to the B category<br />
where the drillhole spacing is between 1 and 2km and to the C 1 category where the drillhole spacing is 2km. Areas<br />
drilled at a larger spacing than this, up to a 4km spacing, are assigned to the C 2 category, though only a very small<br />
proportion of <strong>Uralkali</strong>’s resources have been categorised as such. SRK considers that in this case all of these<br />
categories, apart from C 2, are acceptable for use in supporting mining plans and feasibility studies.<br />
As a result of the above process, each mine is drilled on a 2km by 2km grid or less before a decision is taken<br />
to develop the mine. This information is, however, then supplemented by underground drilling once the access<br />
development is in place. This typically creates a grid of intersections measuring 400m by 200m. <strong>Uralkali</strong> does<br />
not upgrade the categorisation of its resources based on this drilling but rather uses this to optimise the mining<br />
layouts.<br />
The drillholes, whether drilled from surface or underground, are sampled at intervals of at least 10cm. If a<br />
seam consists of several layers then each layer is sampled separately. The resulting samples are crushed and milled<br />
under the control of the geology department to produce an approximate 100g sample prior to submission to the<br />
laboratory.<br />
128 <strong>Uralkali</strong> | <strong>Annual</strong> <strong>Report</strong> <strong>2010</strong> Table of Contents
REVIEW OF THE MINERAL RESOURCES<br />
Assaying is carried out at in house laboratories located at each mine. No samples are sent to any independent<br />
laboratories but there is an internal system of check assaying and repeat assaying. Approximately 5% of samples<br />
are repeat assayed. The majority of the assaying is carried out using classical wet chemistry techniques. SRK<br />
considers that the exploration approach followed by <strong>Uralkali</strong> has been appropriate and specifi cally aimed at<br />
collecting the data appropriate to the estimation of potash resources and that suffi cient data of suffi cient quality<br />
has been collected to support the resource estimates as derived by <strong>Uralkali</strong> and as presented here.<br />
2. RESOURCE ESTIMATION<br />
INTRODUCTION<br />
The most up to date resource statements produced by <strong>Uralkali</strong> are those derived for the annual 5GR reports<br />
produced earlier this year which give the status as of 1 January 2011. The completion of 5GR reports is a statutory<br />
requirement. These estimates were produced using standard classical Russian techniques and are essentially<br />
based on calculations made in previous years adjusted for mining during <strong>2010</strong>. This section therefore comments<br />
primarily on these statements.<br />
URALKALI ESTIMATION METHODOLOGY<br />
Each seam and each mine is treated separately in the resource estimation procedure. In each case the horizons<br />
are fi rst divided into blocks such that each sub-divided block has reasonably consistent borehole spacing within<br />
it; that is more intensely drilled areas are subdivided from less intensely drilled areas. Each resulting “resource<br />
block” is then evaluated separately using the borehole intersections falling within that block only.<br />
Specifi cally, composite K 2O and MgO grades are derived for each borehole that intersected each block and<br />
mean grades are then derived for each block by simply calculating a length weighted average of all of these<br />
composited intersections. No top cuts are applied and all intersections are allocated the same weighting.<br />
A separate plan is produced for each seam showing the results of the above calculations, the lateral extent of<br />
each sub block, and any areas where the seams are not suffi ciently developed. The aerial coverage of each block<br />
is then used with the mean thickness of the contained intersections to derive a block volume. The tonnage for<br />
each block is then derived from this by applying a specifi c gravity factor calculated by averaging all of the specifi c<br />
gravity determinations made from samples within that block.<br />
The data for each resulting block is plotted on a Horizontal Longitudinal Projection (HLP). This shows the<br />
horizontal projection of the extent of each block as well as its grade and contained tonnage. The HLP also shows<br />
the block classifi cation, this being effectively a refl ection of the confi dence of the estimated tonnes and grade.<br />
URALKALI RESOURCE STATEMENTS<br />
Table 1 below summarises SRK’s understanding of the resource statements prepared by <strong>Uralkali</strong> to refl ect the<br />
status of its assets as of 1 January 2011. <strong>Uralkali</strong>’s statements are based on a minimum seam thickness of 2m and<br />
a minimum block grade which dependent on the mine varies between 13.6% and 13.9% K 2O.<br />
Table of Contents<br />
129
REVIEW OF THE MINERAL RESOURCES<br />
TABLE 1: URALKALI SYLVINITE MINERAL RESOURCE<br />
STATEMENT AT 1 JANUARY 2011<br />
Category<br />
Tonnage<br />
(Mt)<br />
Mine 2<br />
A 9.7 31.6 3.1<br />
B 39.4 22.7 8.9<br />
C 1 280.2 24.3 68.2<br />
A+B+C 1 329.3 24.4 80.2<br />
C 2 - - -<br />
Mine 4<br />
A 370.4 21.6 79.9<br />
B 437.6 22.6 98.8<br />
C 1 1,016.8 20.6 209.6<br />
A+B+C 1 1,824.8 21.3 388.3<br />
C 2 310.3 26.8 83.3<br />
Mine 5<br />
A 169.9 19.0 32.3<br />
B 311.0 19.8 61.7<br />
C 1 809.7 19.8 160.4<br />
A+B+C 1 1,290.6 19.7 254.4<br />
C 2 - - -<br />
All Mines<br />
A 550.0 21.0 115.3<br />
B 788.0 21.5 169.4<br />
C 1 2,106.7 20.8 438.2<br />
Grand Total A+B+C 1 3,444.8 21.0 723.0<br />
C 2 310.3 26.8 83.3<br />
SRK COMMENTS<br />
SRK has reviewed the estimation methodology used by <strong>Uralkali</strong> to derive the above estimates and the geological<br />
assumptions made and considers these to be reasonable given the information available. SRK has also undertaken<br />
various re-calculations both of individual blocks and seams as a whole and has in all cases found no material errors<br />
or omissions and has replicated the estimates derived by <strong>Uralkali</strong> to within 5%.<br />
Overall, SRK considers the resource estimates reported by <strong>Uralkali</strong> to be a reasonable refl ection of the total<br />
quantity and quality of material demonstrated to be present at the three assets as of 1 January 2011.<br />
130 <strong>Uralkali</strong> | <strong>Annual</strong> <strong>Report</strong> <strong>2010</strong><br />
K 2O<br />
(%)<br />
K 2O<br />
(Mt)<br />
Table of Contents
REVIEW OF THE MINERAL RESOURCES<br />
SRK AUDITED MINERAL RESOURCE STATEMENTS<br />
Table 2 below presents SRK’s audited resource statements. SRK has re-classifi ed the resource estimates using the<br />
terminology and guidelines proposed in the JORC Code. In doing this, SRK has reported those blocks classifi ed as<br />
A or B by <strong>Uralkali</strong> as Measured, those blocks classifi ed as C 1 as Indicated and those blocks classed as C 2 as Inferred.<br />
SRK’s audited Mineral Resource statements are reported inclusive of those Mineral Resources converted to Ore<br />
Reserves. The audited Ore Reserve is therefore a sub set of the Mineral Resource and should not therefore be<br />
considered as additional to this.<br />
SRK has not attempted to optimise <strong>Uralkali</strong>’s Business Plan. Consequently, SRK’s audited resource statements<br />
are confi ned to those seams that both have the potential to be mined economically and which are currently being<br />
considered for mining only.<br />
TABLE 2: SRK AUDITED SYLVINITE MINERAL RESOURCE<br />
STATEMENT AT 1 JANUARY 2011<br />
Category<br />
Tonnage<br />
(Mt)<br />
Mine 2<br />
Measured 49.1 24.5 12.0<br />
Indicated 280.2 24.3 68.2<br />
Measured + Indicated 329.3 24.4 80.2<br />
Inferred - - -<br />
Mine 4<br />
Measured 808.0 22.1 178.7<br />
Indicated 1,016.8 20.6 209.6<br />
Measured + Indicated 1,824.8 21.3 388.3<br />
Inferred 310.3 26.8 83.3<br />
Mine 5<br />
Measured 480.9 19.5 94.0<br />
Indicated 809.7 19.8 160.4<br />
Measured + Indicated 1,290.6 19.7 254.4<br />
Inferred - - -<br />
All Mines<br />
Measured 1,338.1 21.3 284.7<br />
Indicated 2,106.7 20.8 438.2<br />
Total Measured + Indicated 3,444.8 21.0 723.0<br />
Inferred 310.3 26.8 83.3<br />
Table of Contents<br />
K 2O<br />
(%)<br />
K 2O<br />
(Mt)<br />
131
REVIEW OF THE MINERAL RESOURCES<br />
SRK COMMENTS<br />
The audited Mineral Resource statement as at 1 January 2011 presented above is different to that presented<br />
as at 1 January <strong>2010</strong> as a function of mining activity during <strong>2010</strong>, some re-assessments completed during <strong>2010</strong> by<br />
<strong>Uralkali</strong> to refl ect updated mining limitations imposed by the appropriate regulatory bodies and the inclusion<br />
of Mixed Salts at Mine 2 that were not previously included by SRK when producing the Resource statement at<br />
1 January <strong>2010</strong>.<br />
3. ORE RESERVE ESTIMATION<br />
INTRODUCTION<br />
<strong>Uralkali</strong> does not report reserves as these are typically defi ned by reporting guidelines and terminology<br />
developed in Europe, North America and Australia; that is, estimates of the tonnage and grade of total material<br />
that is planned to be delivered to the various processing plants over the life of the mine. SRK has therefore derived<br />
estimates of such using historical information gained during its site visits regarding the mining losses and dilution<br />
experienced during mining to date. SRK has also restricted the resulting estimates to those areas planned to<br />
be mined by <strong>Uralkali</strong>’s Business Plan during the next 20 years from 2011 to 2030 inclusive. This Business Plan<br />
assumes that <strong>Uralkali</strong> will successfully re-negotiate its Mining Licences in 2013 and the Ore Reserve Statements<br />
therefore also assume this will be the case.<br />
MODIFYING FACTORS<br />
The Modifying Factors applicable to the derivation of reserves comprise estimates for ore losses and planned<br />
and unplanned dilution associated with the separation of the ore and waste. This is normally a function of the<br />
orebody characteristics and mining methods selected.<br />
The Modifying Factors considered by SRK to be appropriate for the sylvinite being mined at each of the assets<br />
are shown in Table 3 below. The Tonnage Conversion Factor takes into account both the percentage of material left<br />
behind in pillars and the amount of dilution included when mining the ore and is applied to the in situ resource<br />
tonnage to derive the tonnage of material expected to be delivered to the plants. The K 2O Grade Conversion Factor<br />
accounts for the difference in grade between the in situ resource and the above plant feed tonnage as a result of<br />
incorporation within the latter of waste extracted along with this and is therefore applied to the in situ grade to<br />
derive the grade of ore expected to be delivered to the plants.<br />
<strong>Uralkali</strong> undertakes an annual reconciliation to compare the ore tonnes mined each year with the resource<br />
that has been sterilized by this mining and it is these fi gures for the last three years that SRK has reviewed to<br />
derive Tonnage Conversion Factor. Similarly <strong>Uralkali</strong> keeps a record of the in situ grade of the material sterilized<br />
by mining each year and SRK has compared these with the grade of material reported to have been fed to<br />
the plants over the last three years to derive the Grade Conversion Factor. Given this, SRK is confi dent that the<br />
Modifying Factors used refl ect the geometry of the orebodies being mined and the mining methods currently<br />
being used.<br />
132 <strong>Uralkali</strong> | <strong>Annual</strong> <strong>Report</strong> <strong>2010</strong><br />
Table of Contents
REVIEW OF THE MINERAL RESOURCES<br />
TABLE 3: SRK MODIFYING FACTORS<br />
Description Units Mine 2 Mine 4<br />
Tonnage Conversion Factor (%) 37.0 46.0<br />
K 2O Grade Conversion Factor (%) 81.0 84.0<br />
SRK AUDITED ORE RESERVE<br />
STATEMENTS<br />
As with its audited Mineral Resource statements,<br />
SRK’s Ore Reserve statements have been re-classifi ed<br />
using the terminology and guidelines proposed in<br />
the JORC Code.<br />
SRK has not attempted to optimise the <strong>Uralkali</strong><br />
Business Plan. Consequently, SRK’s audited Ore<br />
Reserve statements are confined to those seams<br />
that are currently being considered for mining<br />
only and therefore the minimum mining width of<br />
2m and K 2O block cut-off grades of 13% as used<br />
by <strong>Uralkali</strong>. Specifi cally, for the operating mines,<br />
SRK has classed that material reported in the tables<br />
above as a Measured Mineral Resource, and which<br />
is planned to be exploited within the fi rst ten years<br />
of the Business Plan, as a Proved Ore Reserve; and<br />
that material reported in the tables above as either a<br />
Measured and/or Indicated Mineral Resource, and<br />
which is planned to be exploited during the following<br />
ten years of the Business Plan, as a Probable Ore<br />
Reserve.<br />
In the case of Mine 5, SRK has not transferred<br />
any of the reported Measured or Indicated Mineral<br />
Resource to Ore Reserve status, given that technical<br />
work, inclusive of feasibility studies are ongoing to<br />
confi rm the potential economics of developing this<br />
as a separate mine. In addition no Inferred Mineral<br />
Resources have been converted to Ore Reserve.<br />
SRK can confi rm that the Ore Reserve defi ned in<br />
Table 4 below has been derived from the resource<br />
blocks provided to SRK and incorporates suffi cient<br />
Table of Contents<br />
estimates for ore losses and dilution based on actual<br />
historical data.<br />
The large difference between SRK’s audited<br />
Mineral Resource statement and its audited Ore<br />
Reserve statement is partly a function of the relatively<br />
low mining recovery inherent in the Room and Pillar<br />
mining method employed and partly a function<br />
of the fact that SRK has limited the Ore Reserve<br />
statement to that portion of the Mineral Resource<br />
on which an appropriate level of technical work<br />
has been completed. In this case this relates to the<br />
period covered by <strong>Uralkali</strong>’s 20 year Business Plan.<br />
Mine 2 Ore Reserves are fully depleted within the<br />
20 year period of the Business Plan, however, Mine<br />
4 Ore Reserves have the potential to extend beyond<br />
the current 20 year period and, at an assumed<br />
production rate of 20Mtpa, could extend the mine<br />
life up to a further 15 to 20 years.<br />
133
REVIEW OF THE MINERAL RESOURCES<br />
TABLE 4: SRK AUDITED SYLVINITE ORE RESERVE<br />
STATEMENT AT 1 JANUARY 2011<br />
Category<br />
Tonnage<br />
(Mt)<br />
Mine 2<br />
Proved 18.2 19.8 3.6<br />
Probable 102.3 19.8 20.2<br />
Total 120.5 19.8 23.8<br />
Mine 4<br />
Proved 187.3 18.6 34.9<br />
Probable 199.1 18.5 36.8<br />
Total 386.4 18.5 71.7<br />
All Mines<br />
Proved 205.5 18.7 38.5<br />
Probable 301.4 18.9 57.0<br />
Grand Total 506.9 18.8 95.5<br />
SRK COMMENTS<br />
The audited Ore Reserve statement as at 1 January 2011 presented above is different to that presented as at<br />
1 January <strong>2010</strong> as a result of mining during <strong>2010</strong>, the inclusion of Mixed Salts at Mine 2 which had not been<br />
included previously and modifi cations to the <strong>Uralkali</strong> Business Plan to 2030 resulting in less ore projected to be<br />
mined from Mine 4 compared to the Business Plan in place previously.<br />
4. CONCLUDING REMARKS<br />
In SRK’s opinion the Mineral Resource and Ore Reserve statements as included herein are materially compliant<br />
with the JORC Code and are valid as at 1 January 2011. SRK considers that should the Ore Reserves as presented<br />
herein be re-stated in accordance with the reporting requirements of the United States Securities and Exchange<br />
Commission (the “SEC”), specifi cally Securities Act Industry Guide 7 (“Industry Guide 7”), such Ore Reserves<br />
would not be materially different. SRK however notes that certain terms as used in this letter, such as “resources”<br />
are prohibited when reporting in accordance with Industry Guide 7.<br />
Yours faithfully<br />
Dr Mike Armitage<br />
Chairman SRK Consulting (UK) Ltd<br />
134 <strong>Uralkali</strong> | <strong>Annual</strong> <strong>Report</strong> <strong>2010</strong><br />
Nick Fox<br />
Senior Resource Geologist<br />
K 2O<br />
(%)<br />
K 2O<br />
(Mt)<br />
Table of Contents
GLOSSARY<br />
TERMS AND ABBREVIATIONS<br />
Acron Producer of compound fertilisers, Russia<br />
Agrifert S.A. Principal trading agent of Silvinit in export<br />
markets<br />
Agrium Agrium Inc., Canada<br />
APC Arab Potash Company Ltd, Jordan<br />
Canpotex Сanpotex Limited, Canadian potash exporting<br />
marketing fi rm wholly owned by its 3 producers<br />
Potash Corp, Mosaic, Agrium<br />
EuroChem Mineral-Chemical Company EuroChem, Russia<br />
ICL Israel Chemicals Ltd., Israel<br />
IPC International Potash Company, Russia<br />
K+S K+S Group, Germany<br />
Mosaic The Mosaic Company, USA<br />
PhosAgro Producer of phosphate-based fertilisers, Russia<br />
Potash Corp. Potash Corporation of Saskatchewan, Canada<br />
Yara Yara International, Norway<br />
SQM Mineral fertilisers producing company<br />
(Sociedad Quimica y Minera de Chile), Chili<br />
CFR “Cost and Freight”, title transfers when goods<br />
pass the rail of the ship in the port of shipment<br />
FCA “Free Carrier”, title transfers when goods are<br />
loaded on the fi rst carrier (railway carriages)<br />
FOB “Free On Board”, title to goods transfers as soon<br />
as goods are loaded on the ship<br />
GMOP Granular muriate of potash<br />
K Chemical element Potash<br />
K2O Potassium oxide<br />
KCl Potassium chloride (1KCI=1.61 K O) 2<br />
MOP Muriate of potash<br />
N Chemical element Nitrogen<br />
NaCl Sodium chloride<br />
NPK Nitrogen-phosphorus-potassium fertiliser<br />
P Chemical element Phosphorus<br />
PMOP Pink muriate of potash<br />
WMOP White muriate of potash<br />
Carnallite A hydrated potassium magnesium chloride with<br />
formula: KMgCl ·6(H O)<br />
3 2<br />
BBT Baltic Bulk Terminal, St. Petersburg, Russia<br />
Berezniki-1, 2, 3, 4<br />
(Mine 1, 2, 3, 4;<br />
BKPRU-1, 2, 3, 4)<br />
Potash production mining department<br />
of Berezniki<br />
BPC Belarusian Potash Company, marketing joint<br />
venture organisation of <strong>Uralkali</strong> and Belaruskali<br />
Ust-Yayva Mine 5<br />
Table of Contents<br />
BRIC Brazil, Russia, India, China<br />
CIS Commonwealth of Independent States<br />
FSU Former Soviet Union<br />
SEA Southeast Asia<br />
FAPRI Food and Agriculture Policy Research Institute,<br />
USA<br />
Fertecon Fertiliser Economic Market Analysis and<br />
Consultancy, UK<br />
FMB Fertiliser Market Bulletin, FMB Limited, UK<br />
IFA International Fertiliser Association, France<br />
IMF International Monetary Fund, USA<br />
IPNI International Plant Nutrition Institute, USA<br />
USGS US Geological Survey, USA<br />
JORC standarts Joint Ore Reserves Committee standarts for<br />
public reporting on mineral resources and<br />
mineral (ore) reserves, Australia<br />
CUSIP Committee on Uniform Security Identifi cation<br />
Procedures<br />
GDP Gross Domestic Product<br />
GDR Global Depositary Receipt<br />
ISIN International Securities Identifi cation Number<br />
LSE London Stock Exchange<br />
MICEX Moscow Interbank Currency Exchange Trading<br />
Board<br />
RTS Russian Trading System<br />
CAGR Compound <strong>Annual</strong> Growth Rate<br />
CAPEX Capital Expenditures<br />
COGS Cash Cost of Goods Sold<br />
EBITDA Earnings Before Interest, Taxes, Depreciation<br />
and Amortisation<br />
Throughout the report EBITDA means adjusted<br />
EBITDA – calculated as Operating Profi t plus<br />
depreciation and amortisation and does not<br />
include mine fl ooding costs<br />
SG&A Sales General and Administrative expenses<br />
bln billion<br />
mln million<br />
RUR Russian rouble, RR<br />
ths. thousand<br />
US$ US dollar<br />
135
CEO<br />
V. A. Baumgertner<br />
Chief accountant<br />
S.G. Zotova<br />
This <strong>Uralkali</strong> annual report has been approved by the <strong>Uralkali</strong> Board of Directors on 27 April 2011 (Minutes of Board of<br />
Directors No. 251 from 27 Apri 2011).<br />
The <strong>Uralkali</strong> Audit commission has confi rmed the accuracy of the data included in this annual report.
WWW.URALKALI.COM