Comprehensive Annual Financial Report, 2012 - DC Water
Comprehensive Annual Financial Report, 2012 - DC Water
Comprehensive Annual Financial Report, 2012 - DC Water
- No tags were found...

Create successful ePaper yourself
Turn your PDF publications into a flip-book with our unique Google optimized e-Paper software.
COMPREHENSIVE ANNUAL FINANCIAL REPORTLEADERSHIP VALUE INNOVATIONdistrict of columbia water and sewer authority (A component unit of the Government of the District of Columbia)Fiscal Year Ended September 30, <strong>2012</strong>Allen Y. Lew, Chairman of the BoardGeorge S. Hawkins, General ManagerMark T. Kim, Chief <strong>Financial</strong> Officer“The value of clean water is so obvious thatit hardly needs elaboration. We rely on cleanwater to live, and investing in clean wateris—or should be—an uncontroversial position.”– George S. Hawkins
<strong>2012</strong>District of Columbia <strong>Water</strong> and Sewer Authority(A component unit of the Government of the District of Columbia)<strong>Comprehensive</strong> <strong>Annual</strong><strong>Financial</strong> <strong>Report</strong>Fiscal YearOctober 1, 2011 to September 30, <strong>2012</strong>Prepared by:Department of Finance, Accounting and BudgetMark T. Kim, Chief <strong>Financial</strong> Officer
this page intentionally left blank
TABLE OF CONTENTSINTRODUCTORY SECTION .................... 1Certificate of Achievement ................................ 3Board of Directors .............................................. 5Principal Staff Members ..................................... 5Acknowledgements ............................................ 6Letter of Transmittal ........................................... 7<strong>Report</strong> Sections .................................................. 8<strong>DC</strong> <strong>Water</strong> Profile ................................................. 8<strong>Report</strong>ing Entity ................................................. 8History of <strong>DC</strong> <strong>Water</strong> ............................................ 9Legislative History and Relationship with theDistrict of Columbia ........................................... 9Governance and Organization Structure ......... 10Agreements with Other Jurisdictions andEntities ................................................................. 11Wholesale Wastewater Treatment– Intermunicipal Agreements ........................... 11Other Wholesale Wastewater TreatmentAgreements ....................................................... 11<strong>Water</strong> Supply Agreements ................................ 11Authority Facilities ............................................. 12The Wastewater System .................................... 12History and Service Area .................................. 12Sewage Collection ............................................ 12Biosolids Disposal ............................................. 13The <strong>Water</strong> System............................................... 13History and Service Area .................................. 13<strong>Water</strong> Treatment and Distribution System ........ 14Highlights and Major Initiatives ........................ 17Combined Sewer Overflow Long TermControl Plan – <strong>DC</strong> Clean Rivers Project ........... 17Blue Plains Enhanced NitrogenRemoval Program ............................................. 18Digester Project ................................................ 19Customer Service Initiatives ............................. 19Technology Initiatives ....................................... 20External Affairs and Community Service .......... 22Employee Relations .......................................... 23Capital Improvement Program .......................... 24Capital Financing and Debt Administration .... 25Accounting and Budget Processes .................. 26Basis of Accounting .......................................... 26Internal Control ................................................. 26Independent Audit ............................................. 26Budgetary Control ............................................. 26<strong>Annual</strong> Budget Process .................................... 27Ten-Year <strong>Financial</strong> Plan .................................... 27<strong>Financial</strong> Policies ............................................... 27Financing Policies ............................................. 27Rate Setting Policies ......................................... 28Debt Policy and Guidelines ............................... 28Economic Condition and Outlook .................... 29Awards ................................................................ 29Acknowledgements ........................................... 30FINANCIAL SECTION ........................... 31Independent Auditors’ <strong>Report</strong> .......................... 33Management’s Discussion & Analysis ............ 35Recent Accomplishments.................................. 16<strong>Financial</strong> Accomplishments .............................. 16Other Accomplishments .................................... 16i
TABLE OF CONTENTSAudited <strong>Financial</strong> Statements forFY <strong>2012</strong> and FY 2011 .................................. 47Statements of Net Assets.................................. 47Statements of Revenue, Expenses, andChange in Net Assets ....................................... 48Statements of Cash Flows ................................ 49Notes to <strong>Financial</strong> Statements .......................... 51STATISTICAL SECTION ........................ 79<strong>Financial</strong> Trends ................................................. 81Exhibit 1: Summary of Net Assetsfor FY 2003-<strong>2012</strong> ...................................... 82Exhibit 2: Change in Net Assetsfor FY 2003 – <strong>2012</strong> ................................... 83Exhibit 3: Change in Net Assetsfor FY 2003 – <strong>2012</strong> ................................... 84Exhibit 4: Capital Disbursementsfor FY 2003 – <strong>2012</strong> ................................... 85Revenue Capacity ............................................... 87Exhibit 5: Summary of Revenuesand Rate Increases for FY 2003 - <strong>2012</strong>.... 88Exhibit 6: Number and Type of CustomerAccounts for FY 2003 - <strong>2012</strong> .................... 89Exhibit 7: Five Largest Commercial CustomerAccounts by Revenues FY 2003 - <strong>2012</strong> ... 90Exhibit 8: Ten Largest Commercial CustomerAccounts by Revenues for FY <strong>2012</strong> ......... 91Exhibit 9: Five Largest Government CustomerAccounts by Revenues FY 2003–<strong>2012</strong>. .. 92Exhibit 10: Ten Largest Government CustomerAccounts by Revenues for FY <strong>2012</strong> ......... 93Exhibit 11: History of Retail <strong>Water</strong> and SewerRates for FY 1980 – <strong>2012</strong> ........................ 95Exhibit 12: Residential <strong>Water</strong> and WastewaterBill Comparisons as a Percentageof Median Household Income .................. 95Exhibit 13: Residential <strong>Water</strong> and WastewaterBill Comparisons to Local andRegional Utilities ...................................... 96Debt Capacity ..................................................... 97Exhibit 14: Total Outstanding Debtfor FY 2003 - <strong>2012</strong> .................................. 98Exhibit 15: Debt Service Coverage andDebt Ratios for FY 2003 - <strong>2012</strong> ................ 99Exhibit 16: Calculation of Debt ServiceCoverage for FY <strong>2012</strong> .............................. 100Demographic and Economic Information ....... 101Exhibit 17: Population of Service AreaJurisdictions for FY 2003 - <strong>2012</strong> ............... 102Exhibit 18: Personal Income of ServiceArea Jurisdictions FY 2003 - <strong>2012</strong> .......... 103Exhibit 19: Per Capita Personal Income ofService Area JurisdictionsFY 2003 - <strong>2012</strong> ......................................... 104Exhibit 20: Unemployment Ratesfor FY 2003 - <strong>2012</strong> ................................... 105Exhibit 21: Employment by Sector................... 106Operating Information ....................................... 107Exhibit 22: <strong>Water</strong> Delivered (Pumped) andBilled (Sold) for FY 2003 – <strong>2012</strong> .............. 108Exhibit 23: <strong>Water</strong> Demandfor FY 2003 – <strong>2012</strong> ................................... 109Exhibit 24: Miscellaneous Statistics AboutAuthority Operations for FY 2003-<strong>2012</strong> ... 110Exhibit 25: Schedule of Insuranceas of September 30, <strong>2012</strong> ........................ 113Exhibit 26: Summary of Major Permits andAdministrative Orders for FY <strong>2012</strong> ........... 114Exhibit 27: Budgetary ComparisonSchedule for FY <strong>2012</strong> .............................. 115ii
1Introductory Section
2this page intentionally left blank
4this page intentionally left blank
BOARD OF DIRECTORSAS OF JANUARY 25, 2013PRINCIPAL STAFF MEMBERSAS OF FEBRUARY 21, 2014PRINCIPAL MEMBERSALLEN LEW, CHAIR, DISTRICT OF COLUMBIAALAN J. ROTH, DISTRICT OF COLUMBIAALETHIA N. NANCOO, DISTRICT OF COLUMBIARACHNA BUTANI, DISTRICT OF COLUMBIAVACANT, DISTRICT OF COLUMBIAVACANT, DISTRICT OF COLUMBIABRADFORD SEAMON, PRINCE GEORGE’S COUNTY, M<strong>DC</strong>ARLA REID, PRINCE GEORGE’S COUNTY, MDTIMOTHY L. FIRESTINE, MONTGOMERY COUNTY, MDROBERT HOYT, MONTGOMERY COUNTY, MDEDWARD L. LONG, JR., FAIRFAX COUNTY, VAALTERNATE MEMBERSHOWARD GIBBS, DISTRICT OF COLUMBIAJOSEPH COTRUVO, DISTRICT OF COLUMBIABRENDA L. RICHARDSON, DISTRICT OF COLUMBIAHOWARD CROFT, DISTRICT OF COLUMBIATERRY BELLAMY, DISTRICT OF COLUMBIAVACANT, DISTRICT OF COLUMBIADAWN HAWKINS-NIXON, PRINCE GEORGE’S COUNTY, MDADAM ORTIZ, PRINCE GEORGE’S COUNTY, MDKATHLEEN BOUCHER, MONTGOMERY COUNTY, MDGENERAL MANAGER'S STAFFGEORGE S. HAWKINS, GENERAL MANAGERKATRINA WIGGINS, CHIEF OF STAFFRANDY E. HAYMAN, GENERAL COUNSELJOHN LISLE, CHIEF OF EXTERNAL AFFAIRSTHOMAS KUCZYNSKI, CHIEF INFORMATION OFFICERCHIEF FINANCIAL OFFICER'S STAFFMARK T. KIM, CHIEF FINANCIAL OFFICERJOHN MADRID, CONTROLLERGAIL ALEXANDER-REEVES, BUDGET DIRECTORROBERT HUNT, TREASURY & DEBT MANAGERSYED KHALIL, REVENUE AND FINANCIAL PLANNINGMANAGEROPERATIONS AND SUPPORT SERVICESLEONARD BENSON, DEPUTY GENERAL MANAGER AND CHIEFENGINEERCHARLES W. KIELY, ASSISTANT GENERAL MANAGERCONSUMER SERVICESWALTER M. BAILEY, ASSISTANT GENERAL MANAGERWASTEWATER TREATMENTROSALIND INGE, ACTING ASSISTANT GENERAL MANAGER,SUPPORT SERVICESDAVID W. LAKE, MONTGOMERY COUNTY, MDJAMES PATTESON, FAIRFAX COUNTY, VA5
ACKNOWLEDGEMENTSJohn MadridJaved AwanTemi AbosedeVal BlinkoffYvonne ReidSyed KhalilRobert HuntQuang PhamHoa TruongMichelle HunterGail Alexander-ReevesJessica BelleDeborah ColeRodea HinesPade ZuokemefaLola OyeyemiStacey JohnsonAnnie Fulton-GeorgeSylvia RileyAnil BansalMichael GoddardReginald LipscombSuzette StonaNgozi UgwuEasmon KanehThe Office of the Chief <strong>Financial</strong> Officer wishes to extend its appreciation to all the departmentalstaff members whose hard work and dedication helped make this document possible.6
February 21, 2014Board of DirectorsDistrict of Columbia <strong>Water</strong> and Sewer Authority5000 Overlook Avenue, S.W.Washington, D.C. 20032Dear Directors:On January 25, 2013, the District of Columbia <strong>Water</strong> and Sewer Authority (“<strong>DC</strong> <strong>Water</strong>” or the“Authority”) issued its <strong>Comprehensive</strong> <strong>Annual</strong> <strong>Financial</strong> <strong>Report</strong> (“CAFR”) for the fiscal year endedSeptember 30, <strong>2012</strong>. Subsequent to its issuance, the Authority revised its financial statements andreclassified several line items and made an immaterial adjustment related to recognition of interestincome on Federal appropriations for Combined Sewer Overflow. The reclassifications andadjustment did not have a material impact on total net assets. For details see Note 2j to the restatedSeptember 30, <strong>2012</strong> financial statements included in this revised CAFR.The financial statements for fiscal year <strong>2012</strong> were prepared in accordance with generally acceptedaccounting principles as promulgated by the Governmental Accounting Standards Board (“GASB”)and audited by a firm of independent certified public accountants retained by <strong>DC</strong> <strong>Water</strong>.Responsibility for both the accuracy of the data and the completeness and fairness of thepresentation, including all disclosures, rests with <strong>DC</strong> <strong>Water</strong>’s management. To the best of myknowledge and belief, the enclosed financial statements and schedules are accurate, in all materialrespects, and are reported in a manner designed to present fairly the financial position and resultsof operations of <strong>DC</strong> <strong>Water</strong>. All disclosures necessary for the reader to gain an understanding of <strong>DC</strong><strong>Water</strong>’s financial activity have been included.<strong>DC</strong> <strong>Water</strong>, in its sixteenth year has persevered in its commitment to provide world-class, costeffectivewater and wastewater services to both retail and wholesale customers and to lead theindustry as an environmental steward.In accordance with the Authority’s enabling legislation, <strong>DC</strong> <strong>Water</strong> is required to perform an annualaudit of its books and accounts and submit it to the Mayor, Chief <strong>Financial</strong> Officer, and Council ofthe District of Columbia. <strong>DC</strong> <strong>Water</strong>’s management is responsible for establishing and maintainingan internal control structure designed to ensure that <strong>DC</strong> <strong>Water</strong>’s assets are adequately safeguardedagainst loss, theft, or misuse and to maintain accurate and reliable financial records for thepreparation of financial statements and the representations made by management. The internal7
control structure is designed to provide reasonable, but not absolute, assurance that theseobjectives are met. The concept of reasonable assurance recognizes that: 1) the cost of internalcontrols should not exceed the benefits derived from the controls; and 2) the evaluation of costs andbenefits requires management’s exercise of judgment. We believe <strong>DC</strong> <strong>Water</strong>’s internal accountingcontrols adequately safeguard its assets and provide reasonable assurance of the proper recordingof financial transactions.REPORT SECTIONSThe CAFR describes <strong>DC</strong> <strong>Water</strong>’s financial activities, condition and services. As such, the reportcovers information about <strong>DC</strong> <strong>Water</strong>’s history, its organizational structure, and its financial data. Thisreport is divided into three sections: Introductory, <strong>Financial</strong>, and Statistical.• The Introductory Section, which is not audited, includes <strong>DC</strong> <strong>Water</strong>’s organizationalstructure, a list of Board members and senior management, the history of governance andoperations, a description of facilities, a summary of the budget process, internal controlsand accounting standards, <strong>DC</strong> <strong>Water</strong>’s recent accomplishments and major initiatives, and adiscussion of economic conditions of the metropolitan Washington, D.C. area.• The <strong>Financial</strong> Section includes the independent auditor’s report, Management’sDiscussion and Analysis (“MD&A”), <strong>DC</strong> <strong>Water</strong>’s fiscal years <strong>2012</strong> and 2011 financialstatements and notes to the financial statements.• The Statistical Section, which is not audited, presents selected financial and operatingindicators of <strong>DC</strong> <strong>Water</strong> and statistics about the economic condition of the metropolitanWashington, D.C. area.This letter of transmittal is designed to supplement the MD&A and should be read in conjunctionwith it. <strong>DC</strong> <strong>Water</strong>’s MD&A is located immediately following the auditor’s report.<strong>DC</strong> WATER PROFILE<strong>Report</strong>ing Entity<strong>DC</strong> <strong>Water</strong> is an independent, multi-jurisdictional regional utility that provides retail drinking waterdistribution and wastewater conveyance and treatment services to approximately 625,000residential, commercial and governmental customers in the District of Columbia, and wholesalewastewater conveyance and treatment to approximately 1.6 million users in Montgomery andPrince George’s Counties in Maryland and Fairfax and Loudoun Counties in Northern Virginia andapproximately 17.9 million annual visitors.<strong>DC</strong> <strong>Water</strong> continues to weather an unprecedented recession well. <strong>DC</strong> <strong>Water</strong> serves a diverse clientbase supported by a core base of Federal employees but not concentrated in any one customer8
type. Approximately 32% of revenues are derived from highly rated customers, including theFederal Government, Fairfax County, Washington Suburban Sanitary Commission, and LoudounCounty Sanitary Commission. Federal and wholesale customers pay for services on a quarterlybasis in advance based on estimates provided by the Authority. The District’s unemployment rate isamong the lowest for America’s large metropolitan areas.The operations of <strong>DC</strong> <strong>Water</strong> are accounted for as a component unit of the Government of theDistrict of Columbia and are included in its <strong>Comprehensive</strong> <strong>Annual</strong> <strong>Financial</strong> <strong>Report</strong>. This<strong>Comprehensive</strong> <strong>Annual</strong> <strong>Financial</strong> <strong>Report</strong> is issued separately to provide the Board of Directors, <strong>DC</strong><strong>Water</strong> customers, local and federal government officials, employees, investors, suppliers and otherinterested parties with comprehensive financial reporting of <strong>DC</strong> <strong>Water</strong>’s operations and financialposition for fiscal years <strong>2012</strong> and 2011.History of <strong>DC</strong> <strong>Water</strong>Legislative History and Relationship with the District of ColumbiaIn 1996, the regional participants in <strong>DC</strong> <strong>Water</strong>’s service area, including the District of Columbia,Montgomery and Prince George’s Counties in Maryland, Fairfax and Loudoun Counties in Virginia,and the United States Congress, agreed to create an independent, multi-jurisdictional water andwastewater authority from its predecessor agency. In April 1996, the Council of the District ofColumbia passed the “<strong>Water</strong> and Sewer Authority Establishment and Department of Public WorksReorganization Act of 1996 (as amended)” (the “Act”), a statute that provided the groundwork for<strong>DC</strong> <strong>Water</strong> to become operationally independent on October 1, 1996.In accordance with the Act, the District has authorized <strong>DC</strong> <strong>Water</strong> to use all of the property andassets related to its water distribution and wastewater treatment and conveyance services andtransferred to <strong>DC</strong> <strong>Water</strong> any liabilities that are directly attributable to those assets. The District hasretained full legal title to these assets. The assets will remain under the control of <strong>DC</strong> <strong>Water</strong> for aslong as any revenue bonds remain outstanding.9
The Act also requires <strong>DC</strong> <strong>Water</strong> to establish rates, fees and other charges for all services providedby <strong>DC</strong> <strong>Water</strong>. These rates and charges, in addition to certain wholesale wastewater treatmentcontracts, should generate revenues adequate to pay all of the costs of operating <strong>DC</strong> <strong>Water</strong>. <strong>DC</strong><strong>Water</strong>’s rate setting powers are not subject to the oversight of, or regulation by, the District or anyother agency or authority.Governance and Organization Structure<strong>DC</strong> <strong>Water</strong> is governed by a Board of Directors consisting of eleven principal and eleven alternatemembers who represent the District of Columbia, Montgomery and Prince George’s Counties inMaryland, and Fairfax County in Virginia. The Mayor of the District of Columbia appoints, and the<strong>DC</strong> Council confirms, all District Board members, including the Chairperson. In addition, theMayor appoints the five principals and five alternate members who represent the surroundingjurisdictions based on submissions from those jurisdictions. <strong>DC</strong> <strong>Water</strong> may only take action onpolicy matters after it receives a favorable vote of no less than six members of the Board ofDirectors. All Board members participate in decisions directly affecting the general managementof the joint-use facilities. Only the District of Columbia Board members participate in matters thataffect District’s ratepayers.10
Agreements with Other Jurisdictions and EntitiesWholesale Wastewater Treatment – Intermunicipal AgreementsIn 1985, the District signed the Blue Plains Intermunicipal Agreement (the “IMA”) with FairfaxCounty in Virginia, and Montgomery and Prince George’s Counties in Maryland. The IMA outlinesterms relating to facility location, sizing, capacity allocations and funding and long-termmanagement of the wastewater treatment and disposal process. It also established a uniformpayment basis for facilities and future improvements. IMA signatories share the cost ofoperations, maintenance, and the capital program of the Blue Plains facility; the three surroundingcounties comprise approximately 60 percent of the Blue Plains capacity.Since the IMA's signing in 1985, several significant changes have occurred in the region that thesignatories could not foresee at that time - primarily the creation of <strong>DC</strong> <strong>Water</strong> as a quasiindependentinstrumentality of the District Government. Federal requirements and technologicaladvances have also changed the treatment process, greatly reducing the amount of nutrients <strong>DC</strong><strong>Water</strong> can discharge into the Potomac River and Chesapeake Bay. The Chief AdministrativeOfficers of the four jurisdictions recognized this concern and recommended that the Blue PlainsIMA committees review the agreement and suggest a process and format through which it couldbe updated. The committees, working in conjunction with the Metropolitan Washington Council ofGovernments, defined key updates and produced an annotated version of the IMA to identify theareas that need to be updated or renegotiated. The participating jurisdictions have completed anew IMA agreement in <strong>2012</strong>, and ratification is expected in 2013.Other Wholesale Wastewater Treatment AgreementsBeginning in October 1963, <strong>DC</strong> <strong>Water</strong> entered into separate agreements with other entities that didnot participate in the IMA and that were tributary to the Potomac Interceptor sewer: LoudounCounty Sanitation Authority (“LCSA”); Washington-Dulles International Airport; the Department ofthe Navy; the National Park Service; and the Town of Vienna, Virginia. The agreements provide forthe pro-rata recovery of <strong>DC</strong> <strong>Water</strong>’s costs of constructing, operating, and maintaining the PotomacInterceptor and certain other sewers and the Blue Plains facility. Under these agreements, <strong>DC</strong><strong>Water</strong> recovers its capital and operating and maintenance costs quarterly from each user based ona per million gallons rate as applied to each user’s metered sewage quantity. In November 1998,<strong>DC</strong> <strong>Water</strong> executed a new agreement with LCSA that increased its share of treatment capacity atBlue Plains to 13.8 million gallons per day (mgd). LCSA now pays its share of capital and operatingcosts on the same basis as the other IMA entities.<strong>Water</strong> Supply Agreements<strong>DC</strong> <strong>Water</strong> purchases water from the Washington Aqueduct, which is owned by the federalgovernment and operated by the United States Army Corps of Engineers under the direction of11
the Secretary of the Army. All water treated by the Washington Aqueduct is purchased by <strong>DC</strong><strong>Water</strong> and the Aqueduct’s two other customers, Arlington County and the City of Falls Church,Virginia. In July 1997, <strong>DC</strong> <strong>Water</strong> executed a new operating agreement with the U.S. Army Corpsof Engineers that provides for the continued ownership and operation of the Aqueduct by the U.S.Army Corps of Engineers, but gives <strong>DC</strong> <strong>Water</strong> and other Aqueduct customers greaterparticipation in budget preparation and oversight of operations. The agreement also outlines eachcustomer’s pro rata share of operating and capital costs based on water purchased; <strong>DC</strong> <strong>Water</strong>’spro rata share of Aqueduct expenses currently is approximately 73 percent.In 1982, the District entered into the <strong>Water</strong> Supply Coordination Agreement with the WashingtonSuburban Sanitary Commission and the Fairfax County <strong>Water</strong> Authority. This agreement formalizescommitments to cooperatively manage the region’s water supply system. <strong>DC</strong> <strong>Water</strong> has providedfor backup and peak day water supply through participation in the Little Seneca Lake andBloomington Reservoir (now called Jennings Randolph Lake) projects. The Little Seneca projectwas constructed and is operated by the Washington Suburban Sanitary Commission. <strong>DC</strong> <strong>Water</strong>funds 40 percent of its capital and operating costs. The Bloomington Reservoir project wasconstructed by the Federal government and is operated by the U.S. Army Corps of Engineers and<strong>DC</strong> <strong>Water</strong> funds 30 percent of its applicable capital and operating costs.AUTHORITY FACILITIESThe Wastewater SystemHistory and Service AreaThe first wastewater treatment facilities for the Washington metropolitan area became operational in1938 at the site of the present Blue Plains Wastewater Treatment Plant. These facilities treated upto 130 mgd for a population of over 650,000, and provided primary treatment only. Since that time,there have been several expansions and upgrades. In 1949, Blue Plains was expanded to 175 mgdand again to 240 mgd in 1959. Chlorination facilities and secondary (biological) treatment were alsoadded. When the Federal Clean <strong>Water</strong> Act was enacted in 1972 requiring all municipal sewagetreatment systems to incorporate secondary or advanced levels of treatment, Blue Plains was onceagain expanded and upgraded to comply with federal regulations. Work on these tertiary treatmentprojects and expansion was completed in 1983. Work was completed in fiscal year 1997 to expandthe Blue Plains tertiary treatment capacity to 370 mgd. Finally, full plant nitrogen removal wasadded in 2000.Sewage CollectionThe sewage collection system consists of approximately 1,800 miles of sanitary and combinedsewers, twenty-two flow-metering stations, nine off-site wastewater-pumping stations, and sixteenstorm water pumping stations. The sewers range from eight inches in diameter to 27-foot arch12
sewers. The sewers are generally constructed of vitrified clay, brick, and concrete. Approximatelytwo-thirds of the District is served by separate sanitary and storm sewers; however, combinedsanitary and storm sewer systems are prevalent in the downtown area and older portions of theservice area.<strong>DC</strong> <strong>Water</strong> has commenced <strong>DC</strong> Clean Rivers Project, formerly named Long-Term Control Plan(“LTCP”) for Combined Sewer Overflow (“CSO”) to provide for wet weather excess flow treatment.This program which was commenced by a federal consent decree and entered into court in 2005, isa twenty-year program estimated to cost $2.8 billion. For additional information, see <strong>DC</strong> CleanRivers Project under Highlights and Major Initiatives.Biosolids DisposalIn 1984, officials from all the jurisdictions served by Blue Plains established procedures forsoliciting and entering into contracts for hauling and disposing of biosolids from Blue Plains. Thishigh quality material consistently meets all applicable requirements of federal regulations. Most ofthe 1,300 tons per day of biosolids produced by the facility is directly land applied at various sitesin Maryland and Virginia. Montgomery and Prince George’s Counties retain contractualresponsibility for the disposal of their share of biosolids generated at Blue Plains, and theycurrently use land application or landfill methods to meet their obligations.The Biosolids Management Program (“BMP”), developed by <strong>DC</strong> <strong>Water</strong> through a stakeholdersgroup that included neighboring jurisdictions, and adopted by the Board of Directors in 1999, callsfor full biosolids digestion as our primary long-term solution and continuing land application aslong as it is financially advantageous. In 2006, the project was temporarily deferred afterunacceptably high bids for construction of egg-shaped digesters were received. After furtherstudy, a new method was selected that will be more efficient, use less energy and lower the costof processing the effluent. Engineering and design work is underway and includes construction offour Cambi thermal hydrolysis trains, four digesters, new dewatering equipment and a combinedheat and power plant. The project is expected to be completed in 2014.The <strong>Water</strong> SystemHistory and Service AreaPrior to the establishment of the Washington Aqueduct Division of the United States Army Corpsof Engineers (the “Aqueduct”) in 1858, residents of the District obtained their drinking water fromsprings and wells. The distribution system consisted primarily of bored logs and some cast ironpipes. <strong>Water</strong> from the Potomac River was tapped into the system in 1863. By 1905, theWashington City Tunnel, McMillan Reservoir and Filtration Plant, and the Bryant Street PumpingStation were completed. The Dalecarlia Filtration Plant and Pumping Station and all other majorcomponents of the present water supply and distribution system were in operation by 1928.13
<strong>Water</strong> Treatment and Distribution SystemAlthough <strong>DC</strong> <strong>Water</strong> is responsible for management of the treated water distribution systemserving the District and certain Department of Defense and other small customers outside theDistrict, the water itself is treated by the Aqueduct. <strong>DC</strong> <strong>Water</strong> purchases its water from theAqueduct and transmits and distributes the water through four pumping stations, six distributionreservoirs and two elevated tanks. The Aqueduct’s water treatment and transmission systemconsists of the Great Falls Intake on the Potomac River; two parallel nine-mile long raw waterconduits from Great Falls to the Dalecarlia Reservoir; the Little Falls Intake and Pumping Stationon the Potomac River; the Dalecarlia and McMillan Reservoirs and <strong>Water</strong> Treatment Plants; theDalecarlia Pumping Station; the Georgetown conduit and reservoir; the Washington City Tunnel;the East Shaft Pumping Station; several treated water transmission lines; and three groundstorage reservoirs.<strong>DC</strong> <strong>Water</strong>’s Department of <strong>Water</strong> Services oversees the entire water distribution system serving theDistrict. <strong>DC</strong> <strong>Water</strong>’s water distribution system includes 1,300 miles of pipes and mains ranging from4 to 78 inches in diameter. The system includes cast iron, ductile iron, reinforced and pre-stressedconcrete, and steel pipe, and contains more than 36,000 valves and hydrants. <strong>DC</strong> <strong>Water</strong> alsooperates and maintains four pumping stations: Bryant Street, Fort Reno, 16th and Alaska, andAnacostia. All four pumping stations have adequate pumping capacity to meet peak demands.14
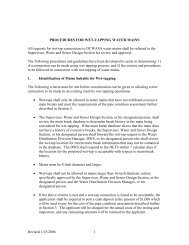
<strong>DC</strong> <strong>Water</strong>’s service area below covers the District of Columbia, most of Montgomery and PrinceGeorge’s Counties, and parts of Fairfax and Loudoun Counties.15
RECENT ACCOMPLISHMENTSFiscal year <strong>2012</strong> marked <strong>DC</strong> <strong>Water</strong>’s sixteenth year in operation as an independent agency of theGovernment of the District of Columbia. <strong>DC</strong> <strong>Water</strong> and its management continued to build on thesuccesses of its previous fifteen years of operations. In <strong>2012</strong>, the Board of Directors developed aStrategic Plan Framework, and Executive Management developed a strategic planning impactsanalysis process with established organizational initiatives to achieve the objectives established bythe Board. Major accomplishments in fiscal year <strong>2012</strong> were:<strong>Financial</strong> Accomplishments• In March <strong>2012</strong>, the Authority successfully issued $440.6 million of subordinate lien publicutility revenue bonds. The bonds, including original issue premiums, were used to fundapproximately $302.0 million in new capital projects and to advance-refund $176.2 ofoutstanding 2003 subordinate lien revenue bonds.• In recognition of the Authority’s strong credit position and financial stability, Standard andPoor’s upgraded <strong>DC</strong> <strong>Water</strong>’s credit rating to AA+ for senior lien revenue bonds and AAfor subordinate lien revenue bonds.• The Authority received $15.0 million in an additional appropriation from the U.S.Government to be used, with matching funds, for capital projects aimed at reducingCombined Sewer Overflows (“CSO”). The cumulative federal appropriations received bythe Authority as of September 30, <strong>2012</strong> was $168.6 million.• The Authority contributed $11.3 million to the rate stabilization fund at the end of fiscalyear <strong>2012</strong>, raising the balance to $28.0 million. The rate stabilization fund will be used inthe future to smooth out peak rate increases at the Authority’s discretion and inaccordance with the Board’s policy of reliable and predictable rate increases.• For the first time, <strong>DC</strong> <strong>Water</strong> approved a one-time retail customer rebate totaling $4.2million which will provide a credit of approximately nine dollars to the average customerbill in January 2013.Other Accomplishments• On July 18, <strong>2012</strong>, <strong>DC</strong> <strong>Water</strong> celebrated 75 years of providing the region with the highestlevels of water treatment and bringing the world innovative research that influencestreatment solutions around the globe.• On March 6, <strong>2012</strong>, <strong>DC</strong> <strong>Water</strong> selected Pepco Energy Services to design, build andoperate a Combined Heat and Power (“CHP”) plant at <strong>DC</strong> <strong>Water</strong>’s Blue Plains AdvancedWastewater Treatment Plant (“AWTP”). This will be the first plant in North America to usebiogas from an AWTP facility. The CHP project will produce at least 14MW of electric16
power that will supply the Blue Plains facility with nearly 30 percent of the AWTP’saverage power demand. The new CHP plant will be an integral part of <strong>DC</strong> <strong>Water</strong>’s newthermal hydrolysis and anaerobic digestion project, which will be the largest in the worldand will reaffirm <strong>DC</strong> <strong>Water</strong> as an innovative environmental steward combining alternativesolid waste handling, energy conservation, and greenhouse gas emission reduction.• On February 14, <strong>2012</strong>, the National Association of Clean <strong>Water</strong> Agencies (“NACWA”)recognized the contributions of <strong>DC</strong> <strong>Water</strong>’s research program with its Research andTechnology Award for a process design project. This process design, external carbonbased suspended growth denitrification, enables facility and process upgrades to furtherreduce nitrogen levels in effluent. This process design will be instrumental for continuedcompliance with one of the most stringent nutrient removal requirements in the world.HIGHLIGHTS AND MAJOR INITIATIVESCombined Sewer Overflow Long Term Control Plan (<strong>DC</strong> Clean Rivers Project)Approximately one-third of the District of Columbia is served by a combined sewer system, in whichboth sanitary waste and storm water flow through the same pipes. When the collection systemand/or the Blue Plains treatment plant reach capacity, typically during periods of heavy rainfall, thesystem is designed to overflow the excess water. These events are referred to as combined seweroverflows. Combined sewers are common in older wastewater collection systems.The Combined Sewer Overflow Long Term Control Plan (“CSO LTCP”) is being implemented on aschedule included in a Consent Decree between the United States, the Government of the Districtof Columbia and <strong>DC</strong> <strong>Water</strong>. The Consent Decree was entered by the Court on March 23, 2005, andcalls for <strong>DC</strong> <strong>Water</strong> to complete the CSO LTCP over a twenty-year period that ends in 2025. CSOLTCP projects at the top of the list are those that will serve to reduce overflows to the AnacostiaRiver.The benefits of our twenty-year plan will be significant when fully implemented. Combined seweroverflows will be reduced by a projected 96 percent (98 percent on the Anacostia River), resulting inimproved water quality and a significant reduction in locally generated debris from the combinedsewer system in our local waterways. In addition, our clean-up efforts on the Anacostia River are acornerstone of the District’s redevelopment initiatives including commercial, residential and otherdevelopment projects.This $2.8 billion plan includes a variety of improvements throughout the District:• Three large storage tunnels which will allow the storage of flows from storm eventsuntil they can be conveyed to Blue Plains for treatment• Pumping station improvements17
• Replacement of the inflatable dams• Targeted separation of combined sewers in several sections of the District thatinclude areas in Anacostia• Consolidation and elimination of 14 of 59 outfalls, including 4 outfalls on theAnacostia River• Funds for Low Impact Development (“LID”) at <strong>DC</strong> <strong>Water</strong>’s facilities and toencourage LID across the District• <strong>DC</strong> <strong>Water</strong> has proposed to conduct a pilot program to demonstrate theeffectiveness of green infrastructure on a large scale. The program would coverapproximately 50 acres of the Potomac and Rock Creek sewersheds at a cost of$10-30 million. Green infrastructure technologies capture, infiltrate, treat and reusepolluted runoff before it enters the sewer system. These practices include raingardens, porous pavements, green roofs, infiltration planters, trees and tree boxes,and rainwater harvesting for non-potable uses, such as toilet flushing andlandscape irrigation. A modification to the Consent Decree would be necessary toallow time to evaluate the merit of additional investments in the program.<strong>DC</strong> <strong>Water</strong> has met all the schedule deadlines in the Consent Decree. In fiscal year 2010, theNational Pollutant Discharge Elimination System (“NPDES”) Permit was revised and reissued to <strong>DC</strong><strong>Water</strong> by the U.S. Environmental Protection Agency (“EPA”). The NPDES Permit became effectiveon September 30, 2010 and expires on September 30, 2015. <strong>DC</strong> <strong>Water</strong> is currently meeting thevery stringent removal goals of the expired NPDES Permit and was the first agency to meet thevoluntary nutrient reduction goals of the 1987 Chesapeake Bay Agreement.Blue Plains Enhanced Nitrogen Removal ProgramIn June 2007, the EPA issued a modification to the permit, reducing the total nitrogen effluent limitto 4.7 million pounds per year (equivalent to 4.2 milligrams per liter at 370 million gallons per dayaverage annual flow). The Blue Plains Enhanced Nitrogen Removal (“ENR”) Program providesfor new facilities and upgrades to existing facilities that are needed at Blue Plains to meet the newtotal nitrogen discharge limit that has been included in <strong>DC</strong> <strong>Water</strong>’s NPDES permit. Projectsincluded in this program were identified through a strategic planning process that resulted indevelopment of <strong>DC</strong> <strong>Water</strong>’s proposed Total Nitrogen-Wet Weather (“TN/WW”) Plan, whichaddresses the requirements of the CSO LTCP, as well as the Chesapeake Bay TributaryStrategies for reducing nitrogen discharged into the Chesapeake Bay. The recommendedalternative in the TN/WW Plan removes additional nitrogen from the wastewater prior todischarge and improves the quality of discharge to the Potomac and Anacostia Rivers during wetweather events. Some projects in this program are in the planning or design phase, whileconstruction has started on others. The lifetime budget for this program is $967 million.18
Digester ProjectWe are continuing implementation of our Biosolids Management Plan (“BMP”), originally adoptedby the Board in 1999. This plan, which included input from our neighbors, environmental groups,and other stakeholders, evaluated a number of options for long-term biosolids processing anddisposal, and identified full biosolids digestion as a common element of all long-term approachesand recommended continuing land application as long as it is financially advantageous. <strong>DC</strong><strong>Water</strong> has performed an extensive analysis of alternatives to identify a cost-effective, long-termand sustainable biosolids management project for the Blue Plains Advanced WastewaterTreatment Plant than can produce a diverse Class A biosolids product, significantly reduce limeuse and enhance land application.The updated BMP includes construction of four Cambi thermal hydrolysis trains, four digesters,new dewatering equipment, and a combined heat and power plant. The BMP has the potential tosignificantly manage biosolids operating costs when it is placed in operation, as it producespower from digester gas to meet over one third of <strong>DC</strong> <strong>Water</strong>’s electric demand at Blue Plains.The digestion process will eliminate nearly one half of the biosolids, which will result in lowerreuse costs.In fiscal year 2006, the Board decided to reject the single bid received on the first phase digesterconstruction contract and deferred the project until 2010. An update to the Biosolids ManagementPlan was started in fiscal year 2007 to review biosolids technologies that are now available to <strong>DC</strong><strong>Water</strong> and to evaluate less expensive digester vessels. In fiscal year 2010, the Board approvedthe new digester project with construction starting in fiscal year 2011 and ending in fiscal year2014.Customer Service InitiativesIn fiscal year <strong>2012</strong>, <strong>DC</strong> <strong>Water</strong> continued to make investments in its employees, processimprovements and technology, all to ensure better service delivery to our customers. Theseimprovements included the following:• The Automated Meter Reading Program continued its efforts to upgrade our technologyto the latest available versions of data collection and transmission equipment andsoftware.• We continued our commitment to help improve the quality of life for those of ourcustomers who are least able to pay, by providing relief through our Customer AssistanceProgram (“CAP”). Since 2001, we have provided eligible customers a discount of 4 Ccfsper month on their water bills. In fiscal year <strong>2012</strong>, a total of 5,648 customers received adiscount on their bills for a total of $1.33 million. We further assisted our customersthrough our Serving People by Lending a Helping Hand Program (“SPLASH”).Contributions to this program have grown due to the convenience of the bill round-up19
feature which enables customers to make donations with their payments to assist othercustomers in paying their water and sewer bills. In fiscal year <strong>2012</strong>, we receivedcontributions totaling approximately $100 thousand and assisted 354 customers. TheGreater Washington Urban League administers this program for <strong>DC</strong> <strong>Water</strong>.• In the first full year of our large meter test/revenue assurance plan, we conducted 752meter tests or equipment repairs on meters serving large properties. As a result of thework to make our meter calibration conform to the American <strong>Water</strong> Works Association(“AWWA”) certified standards, we were able to identify meters with slow registrations andbilled or secured more than $600 thousand in revenues that would otherwise be lost dueto inaccurate registration.• We upgraded technologies deployed in the office and in the field, including a mobileservice order scheduling (SOS Mobile) for our meter technicians, allowing advancescheduling of service orders, and providing the customer a more precise window of timeto meet technicians for appointments and avoid the need for customers to take anextended amount of time to meet technicians. The system also allows us to dispatchservice orders electronically to a mobile terminal directly in our trucks, and complete therecord keeping in the truck on a real-time basis. The project provides real-time statusupdates of each service order in the field, permits monitoring of work performance of fieldtechnicians, and faster communication of results to customers. This project has clearlydemonstrated that employees in the trucks can use better technology tools for planningtheir work. By moving to electronic record keeping, SOS Mobile also saves more than500 pieces of paper a day, and reduces labor costs for paper processing.Technology InitiativesFiscal year <strong>2012</strong> was a year of transition both in terms of a change in leadership and in theAuthority’s fundamental technology direction. The Information Technology (“IT”) department hasmade improvements in operational efficiencies, organizational accountability, and continuousimprovements in delivery of services to our customers. Achievements include the following:• Completion of an infrastructure core upgrade. This upgrade provides the Authority withthe next generation in technology which allows us to better take advantage of virtualmachines which minimize down time for the user, provides redundancy, as well asadditional bandwidth. The additional bandwidth will allow better performance of enduser applications. Introduction of this upgrade served to achieve reduced cost ofsupport, reduced cost of hardware, and reduced cost of energy.• <strong>DC</strong> <strong>Water</strong>’s Customer Outreach Initiative achieved stronger relationships with ourcustomers. We provided additional kiosks and plasma screens in order to increase thecommunication avenues with employees. In addition, the IT Customer Support Officeoffered various training classes such as “Writing Effective Emails”, “Computer Basics”,20
“VPN Connections for Alternate Work Schedules”, and “Navigating <strong>DC</strong> <strong>Water</strong>’sNetwork”. Lastly, we attended some of the “All Hands Meetings” of other departments tospeak with employees to better understand their IT needs.• TEAMS-Maximo and Geographic Information Systems have been integrated anddeployed at <strong>DC</strong> <strong>Water</strong> to manage the maintenance and repair of the Authority’s plantequipment, buildings and grounds and water/sewer infrastructure. Maximo wasconfigured to provide better facilities management through the use of a custom screen,performance tracking dashboards and reports, and the deployment of a new applicationto simplify the submission of service requests by <strong>DC</strong> <strong>Water</strong> personnel. Maximo wasconfigured to support Department of <strong>Water</strong> Services’ (“DWS”) investigations of waterdistribution system issues by deploying laptops with a custom screen to field crews toallow them to electronically receive and process their service orders. This streamlinesthe process and allows for capture of information on a more timely and accurate basis.Additionally, Maximo was configured to support DWS in the areas of the District ofColumbia’s Department of Transportation permit and public space restoration tracking tostreamline the process and reduce violations and fines. Maximo was also configured tosupport the Lead Service Demand Replacement Program, which is transitioning from aconsultant-managed program to a <strong>DC</strong> <strong>Water</strong>-managed program.• We analyzed the work of contractors and replaced, where feasible, with <strong>DC</strong> <strong>Water</strong> staffand put into place a system to gather information on the work performed by staff andcontractors. These actions have reduced costs and increased accountability.• A major upgrade to the enterprise Call Recording system for the Customer ServiceDepartment was completed, which provided a full capture capability through anintegrated recording and monitoring system. This solution is far advanced compared tothe previous technology available to the Customer Service Department for recordingcalls. The new tool offers web-based supervisor generalized user interface (“GUI”) forsystem-wide views, web-based agent GUI for individual agent view, record and playbackfrom any location, real-time and off-site silent monitoring.• The Automated Meter Reading (“AMR”) system upgrade provided the second generationData Collector Units (“<strong>DC</strong>U”) that are capable of transmitting every 15 minutes to the <strong>DC</strong><strong>Water</strong> meter reading database. The upgrade provides a new User Interface thatcontains reading, consumption, and transmission features that are not available in ourlegacy version of the AMR System. As part of the upgrade, we are using new <strong>DC</strong>Upropagation analysis that will enable <strong>DC</strong> <strong>Water</strong> to come up with the appropriate numberof Data Collector Units needed to optimally provide maximum coverage.• For the fourth consecutive year, <strong>DC</strong> <strong>Water</strong> worked in tight collaboration with the Districtof Columbia Fire and EMS Departments to perform fire hydrant condition21
assessments. The current system was enhanced to accommodate the business needfor 2 inspections per year. The Geographical Information System (“GIS”) was effectivelyused to map out the operations of each group. System enhancements wereimplemented to provide the ability to view Maximo data directly from the viewer, alongwith the location of the hydrant crew vehicles.• <strong>DC</strong> <strong>Water</strong>’s Livelink Enterprise Document Management System was deployed toimprove the availability and management of critical documents. We continued to expandstaff use significantly with more than double the number of users and four times thedocument retrievals from the previous fiscal year. Initiatives included the addition ofDepartment of Engineering and Technical Services’ Master Documents to simplify themanagement and dissemination of the latest Guideline Specifications used in preparingconstruction contract bid documents, as well as the implementation of Design Contractsand various other system enhancements.External Affairs and Community ServiceThe General Manager and representatives from every <strong>DC</strong> <strong>Water</strong> department staged communitytown hall meetings in every ward of the District of Columbia. The purpose of these meetings wasto introduce the upcoming budget and the associated rate proposals, and take questions fromcustomers on any topic. Several meetings were standing-room-only.The Authority embarked on an aggressive tap water campaign with two primary goals to 1)improve public perceptions of local tap water as clean, affordable and reliable and 2) increasepublic access to tap water throughout the District. These efforts include engaging public-privatepartnerships and identifying innovative technologies for providing tap water. In an effort to remindthe public that tap water is a safe, inexpensive alternative to bottled water, the Office of ExternalAffairs placed paid advertising on buses, added tap water campaign decals to <strong>DC</strong> <strong>Water</strong> fleet andlaunched the TapIt program. TapIt is a network of more than 180 District cafés and restaurantsthat partner with <strong>DC</strong> <strong>Water</strong> to provide free water bottle refills to the public. <strong>DC</strong> <strong>Water</strong> also offersportable water refill stations and free reusable water bottles for large public events.As construction projects are an integral part of <strong>DC</strong> <strong>Water</strong>’s activity and visibility throughout theDistrict, the Office of External Affairs has created a survey in order to assess customer feedbackfollowing both construction and restoration phases of Capital Improvement projects. A separatesurvey has also been created to gauge customer satisfaction with <strong>DC</strong> <strong>Water</strong>’s work zone alertsfor both scheduled and emergency repairs.<strong>DC</strong> <strong>Water</strong> has an ongoing commitment to community service and volunteerism. Throughout theyear, employees participate in numerous community and charitable events to support an array ofworthy causes. Joint Utility Discount Day, Bread for the Soul, <strong>DC</strong> Public Schools, Aids WalkWashington, Capital Pride Parade and Festival, Susan G. Komen Breast Cancer Walk, Bike to22
Work Day and the District’s Second <strong>Annual</strong> Nation’s Triathlon were among some of the projectssupported during the past fiscal year.Other noteworthy accomplishments in the area of community service include implementation ofan aggressive youth outreach campaign, whereby <strong>DC</strong> <strong>Water</strong> is educating and engaging studentsin schools across the city on water conservation, water quality, wastewater treatment and othersignificant environmental factors affecting our local waterways.<strong>DC</strong> <strong>Water</strong>’s Office of External Affairs also interacted with local legislative bodies and the UnitedStates Congress to monitor legislative and regulatory policies and funding opportunities thataffect the Authority. In fiscal year <strong>2012</strong>, the General Manager testified before the United StatesSenate Committee on Environment and Public Works on nutrient issues, and the Authorityreceived a $15 million federal payment for the Clean Rivers Project.Employee RelationsOur employees are our most valuable asset and are essential to accomplishing our mission and theBoard’s strategic goals. <strong>DC</strong> <strong>Water</strong> continued to invest in its employees by funding training anddevelopment efforts that provide skills training in the areas of safety, technology, governmentregulations, and professional and career development to ensure a skilled, safe and competentworkforce that is fully capable of supporting our customers’ needs. Other major highlights for theyear are:• Projects in the areas of safety and asset management were expanded as priorities wereformed based on skills, knowledge, and leadership qualities to identify and implementimprovements.• <strong>DC</strong> <strong>Water</strong> continued its focus on management training and development with the criteriafor the <strong>DC</strong> <strong>Water</strong> Leadership Academy, which will provide opportunity for our leaders toreceive vital training that is directly tied to predetermined performance competencies.• <strong>DC</strong> <strong>Water</strong> continued its focus on safety, learning and development collaborated with theTeam Blue Safety to perform a gap analysis, identifying the safety training requirementsfor every position in every department. The gap analysis results showed the costs tobring every <strong>DC</strong> <strong>Water</strong> employee in compliance with Occupational Safety and HealthAdministration (“OSHA”) regulations.• Management identified efficiencies to improve benefits administration with respect to theHealthcare Flexible Spending Account with a software module related to <strong>DC</strong> <strong>Water</strong>’scurrent provider of Human Resource and Payroll services. Implementation is anticipatedin 2013.23
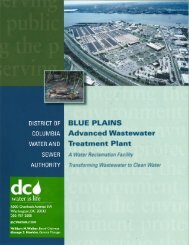
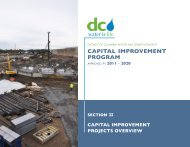
• <strong>DC</strong> <strong>Water</strong>, in conjunction with AON Consulting, conducted a dependent verification auditto validate dependents covered under <strong>DC</strong> <strong>Water</strong>’s medical plans. Of the one-thousandtwo-hundred seventy-nine (1,279) covered dependents audited, approximately threehundred(300) were identified as being ineligible and subsequently removed from medicalcoverage.• To ensure that <strong>DC</strong> <strong>Water</strong>’s non-union wage and salary program is equitable withsurrounding jurisdictions, so that we maintain the ability to hire, motivate and retain ouremployees, management conducted a detailed market analysis of all non-union positions.• Management partnered with information technology to add virtual interviewing to thetalent management process. Cutting costs, improving efficiencies and standardizingprocesses are a few of the benefits of this technology enhancement.Capital Improvement Program<strong>DC</strong> <strong>Water</strong>’s ultimate success in achieving its operational goals, customer service goals, andcontinuing success in regulatory compliance depends in large part on the implementation of its10-year capital improvement program proposed at $3.8 billion. Approximately 44% of the capitalimprovement program is either federally mandated or required by a court-ordered decree,including the Enhanced Nitrogen Removal Facilities (“ENRF”) and the CSO LTCP (Clean RiverProject).The ENRF includes capital projects that are required for nitrogen removal and wet weather flowtreatment, thus enabling the Blue Plains Advance Wastewater Treatment Plant to comply with theU.S. EPA’s modification to the NPDES permit, reducing the total nitrogen effluent limit to 4.7million pounds per year.<strong>DC</strong> <strong>Water</strong> also made significant progress on CSO LTCP projects over the past few years.Projects include rehabilitation of four major pumping stations to increase their capacity: three ofthese stations (Potomac, Main & O Street and East Side) are near completion, and additionalwork at Poplar Point is underway. A green infrastructure demonstration project is planned tounderstand the practicability and efficacy of green infrastructure deployment for CSO control.An asset management program is planned to fully leverage technology to operate and maintaininfrastructure assets to optimize efficiencies and infrastructure life cycle value.The approved fiscal year <strong>2012</strong> – 2021 capital improvement program is broken into seven serviceareas, as shown in the following graph.24
<strong>Water</strong>$589,21915%FY <strong>2012</strong> – FY 2021 Capital Improvement ProgramUses of Funds($ in 000’s)WashingtonAqueduct$107,1443%Capital Equipment$96,0223%Sanitary Sewer$383,77010%Blue PlainsWastewaterTreatment$1,368,48035%Stormwater$15,9841%CSO/Long TermControl Plan$1,288,55933%Capital Financing and Debt Administration<strong>DC</strong> <strong>Water</strong> plans to finance its $3.8 billion capital improvement program from a variety of sources,including the issuance of revenue bonds/commercial paper, grants from the U.S. EPA and otheragencies, capital contributions from wholesale customers and pay-as-you-go financing. Interimfinancing through issuance of commercial paper notes will be periodically converted to long-termfinancing through the issuance of bonds. As shown on the following chart, approximately 60percent of capital financing will come from debt issuance.FY <strong>2012</strong>– 2021 Capital Improvement ProgramSources of Funds($ in 000’s)EPA and OtherGrants$283,1847%Pay-As-You-GoFinancing$318,2948%Interest Income$13,4781%WholesaleCustomer CapitalContributions$936,33124%Revenue Bondsand CommercialPaper$2,299,74860%25
ACCOUNTING AND BUDGET PROCESSESBasis of Accounting<strong>DC</strong> <strong>Water</strong> prepares its financial statements in accordance with accounting principles generallyaccepted in the United States as a single enterprise fund and maintains accounting records on theaccrual basis of accounting. Under this basis of accounting, revenues are recorded when earned,and expenses are recorded when goods and services are received. <strong>DC</strong> <strong>Water</strong> follows theGovernmental Accounting Standards Board (“GASB”) pronouncements; and <strong>Financial</strong> AccountingStandards Board (“FASB”) pronouncements issued on or before November 30, 1989, unless thosepronouncements conflict or contradict GASB pronouncements.Internal ControlDuring fiscal year 2009, the Board of Directors approved the reorganization of the Internal Auditfunction to use an outsourced model and selected an outside independent accounting firm, Stout,Causey & Horning (“SC&H”), to provide <strong>DC</strong> <strong>Water</strong> with a broader range and depth of resources.SC&H completed a comprehensive enterprise-wide risk assessment and presented an annualinternal audit plan to the Audit Committee of the Board, which prioritized audit areas according thehigher risk levels. Each year the audit plans have been approved by the Board of Directors.SC&H has conducted numerous audits in accordance with its risk-based plans. Notable audit areasreviewed during fiscal year <strong>2012</strong> were: Maintenance Services, Capital Projects, BiosolidsManagement, Permit Operations, IT Governance, and IT Help Desk and Computer Operations. Atotal of twelve scheduled projects were completed by the Internal Auditors. Additionally, theController’s Department continues to monitor internal control activities through its Internal Controland Assessment Monitoring Program that provides reviews of compliance with controls throughoutthe organization.Independent Audit<strong>DC</strong> <strong>Water</strong>’s fiscal year is from October 1 st to September 30 th , and its financial statements aresubject to an annual audit by independent certified public accountants. Bazilio Cobb Associates,(“BCA”) audited <strong>DC</strong> <strong>Water</strong>’s financial statements for fiscal year <strong>2012</strong>. BCA’s opinion, dated January27, 2014, is included in the <strong>Financial</strong> Section.Budgetary ControlBudgetary control begins with the preparation of the annual operating and capital budgets, whichare developed on an expenditure basis. After four months of extensive review by the Board’sFinance and Budget, Environmental Quality and Sewerage Services, <strong>DC</strong> Retail Services, and <strong>DC</strong>Retail <strong>Water</strong> and Sewer Rates Committees, the budgets are approved by the Board of Directors.The budgets are loaded into <strong>DC</strong> <strong>Water</strong>’s financial management system, which preventsoverspending without appropriate approvals. The Department of Finance and Budget prepares26
monthly management reports for each operating unit. They also prepare monthly reports for theBoard of Directors and its various committees. The reports are reviewed and acted upon eachmonth to ensure <strong>DC</strong> <strong>Water</strong> complies with its authorized budget levels.<strong>Annual</strong> Budget ProcessAfter approval by the Board of Directors, <strong>DC</strong> <strong>Water</strong> is required to submit its annual operating andcapital budgets for inclusion in the Mayor’s annual budget; the budget is in turn forwarded by theMayor to the Council of the District of Columbia for review and comment; however, neither hasthe authority to change the annual budgets of <strong>DC</strong> <strong>Water</strong>. The District then includes <strong>DC</strong> <strong>Water</strong>’sbudgets as an enterprise fund in the budget that is sent to the United States Congress forapproval.TEN-YEAR FINANCIAL PLAN<strong>DC</strong> <strong>Water</strong>’s ten-year financial plan was first developed in fiscal year 1997, and serves as its roadmap to ensure strong and predictable long-term financial performance. This plan is updated andadopted annually by the Board of Directors. <strong>DC</strong> <strong>Water</strong>’s ten-year financial plan and overallemphasis on long and short-term planning are regularly cited by the rating agencies as criticalfactors in <strong>DC</strong> <strong>Water</strong>’s bond ratings. The objectives of the ten-year financial plan are:• To proactively address all known regulatory requirements and other major infrastructureand operating issues, including the Internal Improvement Plan, over the ten-year planningperiod.• To project rates that are needed to meet its long-term operating, capital and financialpolicy requirements.Since its inception, <strong>DC</strong> <strong>Water</strong> has maintained or enhanced the financial goals set out by Boardpolicy and the ten-year financial plan. <strong>DC</strong> <strong>Water</strong> has achieved or exceeded the Board’s and otherlegal financing goals and requirements in every year of its existence.FINANCIAL POLICIESDuring fiscal year 1998, <strong>DC</strong> <strong>Water</strong> adopted stringent policies for financing, rate setting and cashmanagement, which were updated in 2009. The rate setting policy was replaced in 2011. Thesepolicies have served as the key parameters used to successfully develop <strong>DC</strong> <strong>Water</strong>’s ten-yearfinancial plan, capital improvement program and operating budgets. The policies will continue toguide the development and implementation of <strong>DC</strong> <strong>Water</strong>’s long term plans in the future. A summaryof these policies follows.Financing PoliciesThe primary objective of the financing policies is to ensure that <strong>DC</strong> <strong>Water</strong>’s financial practicesresult in high quality investment-grade bond ratings to achieve the lowest reasonable cost of debt27
necessary to finance <strong>DC</strong> <strong>Water</strong>’s long-term capital program. <strong>DC</strong> <strong>Water</strong> is committed to 140percent debt service coverage on senior lien debt service and maintaining an operating cashreserve equivalent to 120 days of operating and maintenance expenses. In addition, <strong>DC</strong> <strong>Water</strong>uses any excess operating reserve amounts for capital financing or repayment of higher-cost debtand that, whenever possible, the least costly capital financing be used for capital projects.Rate Setting PoliciesIn January 2011, <strong>DC</strong> <strong>Water</strong>’s rate setting policy was replaced with a new policy that strives toachieve the following tenets: Rates that, together with other revenues, cover current costs andmeet or exceed all bond and other financial requirements, as well as goals set by the Board.• Rates that yield reliable and predictable stream of revenues, taking into account trends incosts and in units of service.• Rates based on annually updated forecasts of operating and capital budgets.• Rate structures that are legally defensible, based on objective criteria, and transparentlydesigned.• Rate structures that customers can understand and <strong>DC</strong> <strong>Water</strong> can implement efficientlyand efficaciously.• Rate increases, if required, that are implemented transparently and predictably.To the extent annual revenues exceed costs, the Board’s policy will continue to utilize allavailable options to mitigate future customer impact and annual rate increases, includingtransferring some or all of such excess funds to the Rate Stabilization Fund. At September 30,<strong>2012</strong>, the rate stabilization fund balance was $28.0 million.Debt Policy and GuidelinesDuring fiscal year <strong>2012</strong>, <strong>DC</strong> <strong>Water</strong> drafted a comprehensive debt policy and guidelines documentfor consideration by the Board of Directors (adopted by the Board on December 8, <strong>2012</strong>). TheDebt Policy will allow <strong>DC</strong> <strong>Water</strong> to:• Demonstrate its commitment to long term financial planning objectives• Enhance the positive assessment of credit quality with the bond rating agencies tomaintain and improve <strong>DC</strong> <strong>Water</strong>’s high credit rating• Integrate the debt policy with the budget development of the capital improvementprogram, multi-year financial plan and other policies28
ECONOMIC CONDITION AND OUTLOOKThe District of Columbia is not only known for being the nation's capital, but it is also aninternational city with a vibrant tourist industry and business climate. It is also the nucleus of the fifthlargest metropolitan area in the United States. The U.S. Census Bureau estimated that there were617,996 residents in Washington, <strong>DC</strong>, as of July 1, 2011, an increase of 2.7% from the same periodof the prior year. The <strong>2012</strong> population estimate for the District is not yet available.The District’s economic base is driven by the federal and local governments and the relateddiplomatic embassies and international organizations. The federal civilian workforce in the Districtaveraged 210,239 employees, while thousands more are estimated to work elsewhere in themetropolitan area. The District is host to more than 187 foreign embassies and other recognizeddiplomatic missions. A number of international organizations, such as the International MonetaryFund, the World Bank, the Inter-American Development Bank, and the Organization of AmericanStates are headquartered in the District. An estimated 16.0 million people visited the WashingtonMetropolitan Area during <strong>2012</strong>, not only to do business with federal government and regionalenterprises, but also to visit the national monuments, historic sites, museums and other majorcultural attractions.Income has grown considerably in the District in recent years. From 2007 to <strong>2012</strong>, personal incomegrew approximately 17.2%, in the District as compared to 8.5% nationally. The unemployment ratein the District was 8.2% in <strong>2012</strong>, down from 10.2% a year earlier. The District’s economy grewconsistently faster than the national economy for much of this decade and is expected to continueto grow in 2013. The District’s economy is more information and service dependent than moststates, accounting for the region’s insulation from the national housing and credit centric recession.AWARDSThe GFOA awarded a Certificate of Achievement for Excellence in <strong>Financial</strong> <strong>Report</strong>ing to <strong>DC</strong> <strong>Water</strong>for its comprehensive annual financial report for the fiscal year ended September 30, 2011 (seepage 3). The Certificate of Achievement is a prestigious national award, recognizing conformancewith the highest standards for preparation of financial reports. <strong>DC</strong> <strong>Water</strong> believes its current reportcontinues to conform to the Certificate of Achievement program requirements, and plans to submit itto GFOA. <strong>DC</strong> <strong>Water</strong> has thus far received the GFOA Award for every year of its existence.<strong>DC</strong> <strong>Water</strong> received the GFOA’s Distinguished Budget Presentation Award for its fiscal year <strong>2012</strong>Operating and Capital budgets for the twelfth consecutive time. In order to qualify for thedistinguished Budget Presentation Award, <strong>DC</strong> <strong>Water</strong>’s budget document was judged to be proficientin several categories, including presentation as a policy document, financial plan, operations guideand a communication device.29
31<strong>Financial</strong>Section
32This page intentionally left blank
34This page intentionally left blank
DISTRICT OF COLUMBIA WATER AND SEWER AUTHORITYManagement’s Discussion and Analysis (unaudited)This section of the District of Columbia <strong>Water</strong> and Sewer Authority’s (“<strong>DC</strong> <strong>Water</strong>” or the “Authority”) annualfinancial report presents the analysis of the Authority’s financial performance during the fiscal years thatended on September 30, <strong>2012</strong> and 2011. The Management’s Discussion and Analysis (“MD&A”) should beread in conjunction with the Authority’s basic financial statements, which immediately follow this section.HIGHLIGHTS<strong>Financial</strong> Highlights – <strong>2012</strong>• The Authority’s net assets increased by $85.3 million to $1.1 billion, or 8.0 percent, as a result of fiscalyear <strong>2012</strong> operations and capital contributions.• Operating expenses increased by $1.8 million to $343.0 million, or 0.5 percent due to increased:personnel services, water purchases, and depreciation and amortization expense, partially offset byreductions in contractual services and utilities.• Operating revenues increased by $32.3 million to $440.6 million or 7.9 percent, primarily due to increasedrevenues from residential and commercial customers, Federal government and wholesale wastewatercharges.• Current assets increased by $27.4 million to $421.5 million, or 6.9 percent, primarily due to an increase incash and investments, retail customer receivables and receivables from the Federal government, partiallyoffset by a decrease in receivables from other jurisdictions.• Restricted assets increased by $98.3 million to $379.5 million, or 35.0 percent, primarily due to proceedsfrom issuance of the <strong>2012</strong> revenue bonds.• Net utility plant (capital assets) increased by $418.9 million to $3.7 billion, or 12.7 percent, due to aplanned increase in capital expenditures in line with the Authority’s approved $3.8 billion, 10-year capitalimprovement program.• The Authority’s long-term debt, including current maturities, increased $284.8 million to $1.8 billion, or18.4 percent, primarily due to the $440.6 million bond issuance in March <strong>2012</strong>.<strong>Financial</strong> Highlights – 2011• The Authority’s net assets increased by $44.8 million to $1.1 billion, or 4.4 percent, as a result of fiscalyear 2011 operations and capital contributions.• Operating expenses increased by $12.1 million to $341.3 million, or 3.7 percent, due to increased:personnel services, contractual services, and depreciation and amortization expense, partially offset byreductions in chemicals and water purchases.• Operating revenues increased by $44.5 million to $408.3 million or 12.2 percent, primarily due toincreased revenues from residential and commercial customers, Federal government and wholesalewastewater charges.• Current assets increased by $31.7 million to $394.1 million, or 8.8 percent, primarily due to an increased:cash and investments, and receivables from other jurisdictions, partially offset by a decrease inreceivables from the Federal government.35 |
DISTRICT OF COLUMBIA WATER AND SEWER AUTHORITYManagement’s Discussion and Analysis (unaudited)• Restricted assets increased by $124.4 million to $281.2 million, or 79.3 percent, primarily due to proceedsfrom issuance of the 2011 revenue bonds.• Net utility plant (capital assets) increased by $298.5 million to $3.3 billion, or 9.9 percent due to a plannedincrease in capital expenditures in line with the Authority’s approved $3.8 billion, 10-year capitalimprovement program.• The Authority’s long-term debt, including current maturities, increased $280.7 million to $1.5 billion, or22.1 percent, primarily due to the $300.0 million bond issuance in October 2010.Authority Highlights - <strong>2012</strong>Bond Issuance – On March 14, <strong>2012</strong>, <strong>DC</strong> <strong>Water</strong> issued subordinate lien public utility revenue bonds (Series<strong>2012</strong>A-C) with a face value of $440.6 million which are due between 2033 and 2044. The interest rate onseries A and C is fixed and ranges from 2.0% to 5.0% over the life of the bonds. The interest rate on series Bis variable. There was $53.3 million of original issue premium and approximately $2.8 million for cost ofissuance and underwriter’s discount costs associated with this issuance.Debt Refunding – On March 14, <strong>2012</strong>, <strong>DC</strong> <strong>Water</strong> advance refunded $176.2 million of its 2003 public utilityrevenue bonds using proceeds from Series C of the <strong>2012</strong> issuance.Rate Stabilization Fund – The Authority increased its rate stabilization fund to $28.0 million at the end of fiscalyear <strong>2012</strong>, with an allocation of $11.3 million. The Board’s rate setting policy and the Authority’s indentureallow for contributions to this account annually as cash reserves and debt service coverage permit. Thebalance in this account will be used in future years to smooth out peak rate increases at the Authority’sdiscretion.Rate Increase – Effective October 1, 2011, the Board approved an increase of the Authority’s retail water andsewer rates by 4.5 percent. This increase was in line with the Board’s rate setting policy which strives to setrates so that each customer is charged for those costs necessary to provide each service, and rate increasesare predictable and gradual.Authority Highlights - 2011Bond Issuance – On October 20, 2010, <strong>DC</strong> <strong>Water</strong> completed a successful launch of its $300.0 million BuildAmerica taxable bonds. These bonds were issued at total net interest rate of approximately 3.6 percent. Thisis the lowest rate ever issued in the Authority’s history for long-term bonds and will save our rate payersapproximately $2.7 million annually compared to issuing traditional tax exempt bonds.Senior Service Debt Coverage – <strong>DC</strong> <strong>Water</strong>’s policy requires that senior debt service coverage be maintainedat a minimum of 140 percent, 20 percent higher than indenture requirements. <strong>DC</strong> <strong>Water</strong>’s senior debt servicecoverage in 2011 was 321.0 percent. Combined debt service coverage was at 144.0 percent.Rate Increase – Effective October 1, 2010, the Board approved an increase of the Authority’s retail water andsewer rates by 12.5 percent. This increase was in line with the Board’s rate setting policy which strives to setrates so that each customer is charged for those costs necessary to provide each service, and rate increasesare predictable and gradual.Accounts Receivable – In fiscal year 2011, retail accounts receivable over 90 days were aggressivelymanaged to maintain a low level at $5.5 million, $0.6 million above the all-time low level, despite a difficulteconomic environment and the retail water and sewer rate increase of 12.5 percent in fiscal year 2011.36 |
DISTRICT OF COLUMBIA WATER AND SEWER AUTHORITYManagement’s Discussion and Analysis (unaudited)USING THIS ANNUAL REPORTThis annual report consists of three sections: Management’s Discussion and Analysis; the <strong>Financial</strong>Statements; and Notes to the <strong>Financial</strong> Statements that explain in more detail some of the information in the<strong>Financial</strong> Statements.Required <strong>Financial</strong> Statements• The Statements of Net Assets includes the Authority’s assets and liabilities and provides informationabout the nature and amounts of investments in resources (assets) and nature and extent ofobligations (liabilities) with the difference between them being reported as net assets. It also providesthe basis for computing the rates of return, evaluating the capital structure of the Authority, andassessing the liquidity and financial flexibility of the Authority.• The Statements of Revenues, Expenses, and Changes in Net Assets presents the changes in netassets from one reporting period to another by accounting for revenues and expenses and measuringthe financial results of operations. This statement measures the profitability (i.e. change in net assets)of the Authority’s operations over the past year and can be used to determine whether the Authorityhas successfully recovered all of its costs through its user fees and other charges.• The Statements of Cash Flows provides information about the Authority’s cash receipts, cashpayments, and net changes in cash and cash equivalents resulting from operations, investing, andcapital and non-capital financing activities. It also provides information regarding sources of cash,uses of cash, and changes in cash balances during the reporting period.• Notes to the audited financial statements include information essential to understanding them, suchas the Authority’s significant accounting policies and information about certain financial statementaccount balances.37 |
DISTRICT OF COLUMBIA WATER AND SEWER AUTHORITYManagement’s Discussion and Analysis (unaudited)FINANCIAL ANALYSIS OF THE AUTHORITY AS A WHOLEThe Statement of Net Assets and the Statement of Revenues, Expenses and Changes in Net Assets reportinformation about the Authority’s financial condition. The Authority’s net assets, i.e., the difference betweenassets and liabilities, are a measure of financial health and or financial position. Over time, increases ordecreases in the Authority’s net assets are one indicator of whether its financial health is improving ordeteriorating. However, other non-financial factors such as changes in economic conditions, populationgrowth, and new or changed legislation also need to be considered in assessing the Authority’s financialcondition.Table 1Condensed Statements of Net Assets($ in 000’s)FY <strong>2012</strong> FY 2011 FY 2010Utility plant, net $ 3,718,243 $ 3,299,346 $ 3,000,812Current and other assets 696,893 571,379 427,903Total assets 4,415,136 3,870,725 3,428,715Current liabilities 314,219 269,956 212,100Long-term debt outstanding 1,813,967 1,530,174 1,250,441Other long-term liabilities 1,141,461 1,010,446 950,796Total liabilities 3,269,647 2,810,576 2,413,337Net assetsInvested in utility plant, net of related debt 975,933 891,786 833,717Restricted 27,297 26,825 17,257Unrestricted 142,259 141,538 164,404Total net assets $ 1,145,489 $ 1,060,149 $ 1,015,378Analysis of Net AssetsThe Authority’s total assets exceeded liabilities by $1.1 billion for the fiscal years ended September 30, <strong>2012</strong>and 2011, respectively. The Authority’s net assets include its investment of $975.9 million and $891.8 millionin utility plant (e.g., infrastructure, buildings, equipment and fleet) for the fiscal years ended September 30,<strong>2012</strong> and 2011 respectively, less any related outstanding debt used to acquire those assets. The Authorityuses its capital assets to provide services to its customers. Although the Authority’s investment in its utilityplant is reported net of related debt, it should be noted that the resources needed to repay this debt must beprovided from other sources, since the capital assets themselves cannot be liquidated for these liabilities. Anadditional portion of the Authority’s net assets, $27.3 million and $26.8 million represents resources that aresubject to external restrictions (primarily related to the Authority’s bond indentures) on how they may be used.The remaining balance of $142.3 million and $141.5 million for the fiscal years ended September 30, <strong>2012</strong>and 2011, respectively, are unrestricted.38 |
DISTRICT OF COLUMBIA WATER AND SEWER AUTHORITYManagement’s Discussion and Analysis (unaudited)Table 2Statements of Revenues,Expenses and Changes in Net Assets($ in 000’s)FY <strong>2012</strong> FY 2011 FY 2010RevenuesOperating revenues:<strong>Water</strong> and w astew ater user charges:Residential, commercial and multi-family customers $ 256,846 $ 241,475 $ 209,796Federal government 48,381 43,033 37,845District government and D.C. Housing Authority 24,713 25,123 21,947Charges for w holesale w astew ater treatment 94,549 90,414 87,505Other 16,077 8,210 6,655Total operating revenues 440,566 408,255 363,748Non-operating revenues:Interest income 749 2,036 1,342Total revenues 441,315 410,291 365,090ExpensesOperating expenses:Personnel services 97,784 93,240 88,210Contractual services 64,939 71,055 69,497Chemicals, supplies and small equipment 28,815 28,188 29,003Utilities and rent 26,786 29,429 29,929Depreciation and amortization 74,342 70,209 64,425<strong>Water</strong> purchases 28,389 27,170 27,587Payment in lieu of taxes and right of w ay fee 21,982 21,982 20,474Total operating expenses 343,037 341,273 329,125Non-operating expenses:Interest expense and fiscal charges 71,895 71,621 58,369Total expenses 414,932 412,894 387,494Income (loss) before Federal grants and contributions 26,383 (2,603) (22,404)Federal grants and contributions 58,957 47,374 30,403Change in net assets 85,340 44,771 7,999Net assets, beginning of year 1,060,149 1,015,378 1,007,379Net assets, end of year $ 1,145,489 $ 1,060,149 $ 1,015,37839 |
DISTRICT OF COLUMBIA WATER AND SEWER AUTHORITYManagement’s Discussion and Analysis (unaudited)Analysis of Change in Net AssetsThe Authority’s financial performance remained stable in fiscal year <strong>2012</strong>, with net assets exceeding $1.1billion, an increase of $85.3 million over fiscal year 2011, including Federal grants and contributions.Excluding non-operating revenues (expenses) and Federal grants and contributions, which can varysignificantly from year to year based on capital spending and other factors, operating income was $97.5million, an increase of $30.5 million compared to fiscal year 2011.Total RevenuesTotal revenues (including federal grants and interest income) were $500.3 million in fiscal year <strong>2012</strong>, anincrease of $42.6 million, or 9.3 percent over fiscal year 2011. This is primarily due to increases of $15.4million from retail customers, $5.3 million from the Federal government, $4.1 million from wholesalewastewater charges, $7.9 million from other revenue sources and $11.6 million from Federal grants andcontributions.Total Revenues($ in 000’s)Federal grantsand contributions$58,957Wholesale12%wastewatertreatment charges$94,54919%Interest income$7490%Other$16,0773%Districtgovernment and<strong>DC</strong> HousingAuthority$24,7135%Federalgovernment$48,38110%Residential,commercial andmulti-family$256,84651%A detailed analysis of operating and non-operating revenue variances follows:• <strong>Water</strong> and wastewater user charges from residential, commercial and multi-family customersincreased by $15.4 million to $256.8 million, or 6.4 percent over fiscal year 2011, primarily due to arate increase in fiscal year <strong>2012</strong>.• <strong>Water</strong> and wastewater user charges from Federal government customers were $48.4 million in fiscalyear <strong>2012</strong>, an increase of $5.3 million or 12.4 percent, primarily due to a rate increase in fiscal year<strong>2012</strong>.• <strong>Water</strong> and wastewater user charges from the District government and the District of ColumbiaHousing Authority were $24.7 million, a decrease of $0.4 million, or 1.6 percent, primarily due to arate increase in fiscal year <strong>2012</strong> offset by a decrease in consumption.40 |
DISTRICT OF COLUMBIA WATER AND SEWER AUTHORITYManagement’s Discussion and Analysis (unaudited)• Wholesale wastewater treatment charges were $94.5 million, an increase of $4.1 million, or 4.6percent over fiscal year 2011, primarily due to increased revenues from IMA participants. Accordingto the Blue Plains Intermunicipal Agreement (“IMA”) (see Note 1), wholesale customers pay a shareof both the operating and capital costs of the plant. The payments for capital costs are amortized andrecognized as income over the depreciable life of assets purchased (i.e., 60 years).• Federal grants and contributions were $59.0 million, an increase of $11.6 million, or 24.5 percentcompared to last year, primarily due to increased capital construction spending in fiscal year <strong>2012</strong> ongrant-eligible projects.Diversity and Stability of Operating RevenuesThe Authority’s operating revenue base is very diverse, including established customers such as the Federalgovernment, the District government, surrounding jurisdictions in Maryland and Virginia, and commercial andresidential customers within the District. As shown on the chart below, no one category accounts for morethan 26 percent of total revenues.Operating Revenues by Source($ in 000’s)D.C. HousingAuthority$6,5002%D.C. Government$18,2134%WSSC(Montgomery &Prince George'sCounties)$66,43915%Fairfax County$18,3684%Residential$74,84517%Other (a)$25,8196%Federal$48,38111%Multi-Family$67,34115%Commercial$114,66026%(a)Other revenues include $7.3 million from Loudoun County and $2.4 million from Potomac interceptor.A description of each revenue source as well as a discussion of recent trends in each category follows:• Revenues from commercial and multi-family customers in the District comprise approximately 41.0percent of the Authority’s total operating revenues. Commercial revenues are reliable due to thepresence of many national associations, government consulting firms, and colleges and universities inthe District. The commercial customer category also includes multi-family dwellings.• The Authority provides wastewater conveyance and treatment services to Montgomery and PrinceGeorge’s Counties in Maryland through the Washington Suburban Sanitary Commission (“WSSC”)and Fairfax and Loudoun Counties in Northern Virginia. Operating revenues from WSSC and Fairfax41 |
DISTRICT OF COLUMBIA WATER AND SEWER AUTHORITYManagement’s Discussion and Analysis (unaudited)County account for 19.0 percent of the Authority’s revenues and are based primarily on their share ofoperating costs at Blue Plains. Loudoun County and Potomac Interceptor customers account for anadditional 2.0 percent of the Authority’s revenues and are included in other revenues. Operating costsare allocated to each user based on its sewer flows and purchased capacity at Blue Plains.• Residential customers in the District account for 17.0 percent of total revenues.• Payments from the Federal government comprise 11.0 percent of the Authority’s total operatingrevenues and include customers such as the U.S. Congress, the Smithsonian Institution, and a rangeof federal departments and agencies.• Revenues from the Government of the District of Columbia and the District of Columbia HousingAuthority make up 6.0 percent of total operating revenues.ExpensesOperating expenses increased by $1.8 million, or 0.5 percent, primarily due to a $4.5 million increase inpersonnel services, a $4.1 million increase in depreciation and amortization expense, and a $1.2 millionincrease in water purchases. These increases were offset by a $6.1 million decrease in contractual servicesand a $2.6 million decrease in utilities and rent.Total Expenses($ in 000’s)Interest expenseand fiscal charges$71,89517%PILOT/ROW$21,9825%PersonnelServices$97,78424%<strong>Water</strong> Purchases$28,3897%Depreciation &Amortization$74,34218%Utilities & Rent$26,7866%A detailed analysis of the operating expenses follows:Chemicals,Supplies & SmallEquipment$28,8157%ContractualServices$64,93916%• Personnel services were $97.8 million, an increase of $4.5 million, or 4.9 percent over the prior year,primarily due to increases in wages in addition to increased number of personnel.• Contractual services were $64.9 million, a decrease of $6.1 million, or 8.6 percent over the prior year,primarily due to lower litigation incurrence during the current year.42 |
DISTRICT OF COLUMBIA WATER AND SEWER AUTHORITYManagement’s Discussion and Analysis (unaudited)• Utilities and rent expenses were $26.8 million, a decrease of $2.6 million, or 9.0 percent compared tothe prior year, primarily due to savings in electricity costs attributable to the adopted block purchasingstrategy and a decline in influent flows into the treatment facilities.• Depreciation and amortization expenses were $74.3 million, an increase of $4.1 million, or 5.9 percentover the prior year, which is in line with the increase in capital assets due to the capital improvementprogram.• <strong>Water</strong> purchases were $28.4 million, an increase of $1.2 million, or 4.5 percent compared to the prioryear, primarily due to a 5.0 percent rate increase from the Washington Aqueduct.UTILITY PLANT AND DEBT ADMINISTRATIONUtility PlantAt the end of fiscal year <strong>2012</strong>, the Authority had $3.7 billion invested in a broad range of capital assets (utilityplant), including its wastewater collection, wastewater treatment and water distribution systems. This amountrepresents a net increase of nearly $418.9 million, or 12.7 percent over the prior year due to continued capitalspending in accordance with the capital improvement program.Table 3 summarizes the Authority’s utility plant, net of accumulated depreciation, at September 30, <strong>2012</strong>,2011 and 2010. The changes are presented in detail in Note 4 to the financial statements.Table 3 – Utility PlantNet of Accumulated Depreciation($ in 000’s)FY <strong>2012</strong> FY 2011 FY 2010Wastewater treatment plant $ 1,924,985 $ 1,839,010 $ 1,822,320Wastewater collection facilities 716,651 689,575 598,404<strong>Water</strong> distribution system 897,077 863,474 800,861Purchased capacity 319,840 307,593 279,278Capital equipment 167,641 155,770 144,307Construction-in-progress 807,430 485,497 327,738Less accumulated depreciation (1,115,381) (1,041,573) (972,096)Net utility plant $ 3,718,243 $ 3,299,346 $ 3,000,81243 |
DISTRICT OF COLUMBIA WATER AND SEWER AUTHORITYManagement’s Discussion and Analysis (unaudited)Debt AdministrationAt the end of fiscal year <strong>2012</strong>, the Authority had a total of $1.8 billion in long-term debt outstanding (excludingunamortized bond premiums, discounts, and amount deferred on refunding), an increase of $245.7 million, or16.1 percent, over fiscal year 2011 (see Note 10 for more information on long-term debt).Table 4 – Long-Term Debt OutstandingAs of September 30, <strong>2012</strong>($ in 000’s)SENIOR DEBTINTERESTRATESYEAR OFFINALMATURITYAMOUNTOUTSTANDING1998 public utility revenue bonds 5.50 - 6.00% 2028 $ 218,8152009 public utility revenue bonds series A 3.00 - 6.00% 2039 296,205SUBTOTAL SENIOR DEBT 515,020SUBORDINATE DEBT<strong>2012</strong> public utility revenue bonds series A 2.00 - 5.00% 2037 177,430<strong>2012</strong> public utility revenue bonds series B-1 2.26% 2044 52,690<strong>2012</strong> public utility revenue bonds series B-2 2.26% 2040 47,310<strong>2012</strong> public utility revenue bonds series C 4.00 - 5.00% 2033 163,2152010 public utility revenue bonds series A 4.07 - 5.52% 2044 300,0002008 public utility revenue bonds series A 4.00 - 5.00% 2034 279,9552007 public utility revenue bonds series A 4.75 - 5.50% 2041 218,715Notes payable to the federal government for Jennings Randolph Reservoir 3.25% 2041 14,273Notes payable to WSSC for Little Seneca Reservoir 5.98 - 6.60% 2014 63TOTAL SUBORDINATE DEBT 1,253,651TOTAL DEBT OUTSTANDING 1,768,671CURRENT PORTION OF DEBT OUTSTANDING (19,692)DEBT OUTSTANDING, LESS CURRENT PORTION $ 1,748,979Long-term debt outstanding as presented on the accompanying statements of net assets includes netunamortized bond premiums, discounts and amount deferred on refunding of $65.0 million as of September30, <strong>2012</strong>.44 |
DISTRICT OF COLUMBIA WATER AND SEWER AUTHORITYManagement’s Discussion and Analysis (unaudited)Table 5<strong>DC</strong> <strong>Water</strong> Bond RatingsMoody's Investors' Service Aa2 Stable OutlookStandard & Poor's Corporation AA+ Stable OutlookFitch Ratings AA Stable OutlookIn May 2010, the Authority closed on its $225.0 million commercial paper program. This program providesinterim financing for a portion of the Authority’s approved $3.8 billion capital improvement program. Otherfinancing sources include long-term revenue bonds, United States Environmental Protection Agency grants,wholesale customer contributions, and pay-as-you-go financing. Under the commercial paper program, theAuthority issues fixed-rate, short-term (no greater than 270 days) notes. The Authority’s commercial paperprogram is backed by an irrevocable letter of credit with J.P Morgan Chase Bank National Association forSeries A ($100.0 million tax-exempt) and Series B ($50.0 million tax-exempt), and with U.S. Bank NationalAssociation for Series C ($75.0 million taxable). The notes are rated based on the respective rating of J.P.Morgan Chase and U.S. Bank. The letter of credit serves as an additional source of security for the notesthereby enhancing their appeal and marketability. There was $41.2 million in outstanding taxable and taxexemptcommercial paper at the end of fiscal year <strong>2012</strong>.Table 6<strong>DC</strong> <strong>Water</strong> Commercial Paper RatingsMoody's Investors' ServiceStandard & Poor's CorporationP1SP-1+Fitch Ratings F1+RATESEffective October 1, 2011, the Authority raised its retail water and wastewater rates by 4.5 percent, TheAuthority’s approved ten-year financial plan includes projected rate increases of 4.0 percent to 6.5 percentand also includes projected revisions to its metering and right-of-way / payment in lieu of taxes pass-throughfees.CONTACTING THE AUTHORITY’S FINANCIAL MANAGEMENTThis financial report is designed to provide our customers and creditors with a general overview of theAuthority’s finances and to demonstrate the Authority’s accountability for the money it receives. If you havequestions about this report or need additional financial information, contact the Office of the Chief <strong>Financial</strong>Officer at 5000 Overlook Avenue, S.W. Washington D.C. 20032 or call 202-787-2000. A copy of this report isalso available on <strong>DC</strong> <strong>Water</strong>’s web site at www.dcwater.com.45 |
46this page intentionally left blank
DISTRICT OF COLUMBIA WATER AND SEWER AUTHORITYStatements of Net AssetsSeptember 30, <strong>2012</strong> and 2011(In $ thousands)Assets <strong>2012</strong> 2011Current assets:Cash and cash equivalents (note 3) $ 94,472 $ 112,944Investments (note 3) 100,489 69,764Restricted cash and cash equivalents (note 3) 136,151 —Restricted investments (note 3) — 127,980Customer receivables, net of allowance for doubtful accountsof $15,271 in <strong>2012</strong> and $14,350 in 2011 (note 7) 50,233 39,252Due from Federal government (note 6) 23,491 20,505Due from other jurisdictions (note 8) 7,975 16,202Inventory 6,674 7,264Due from District government (note 13) 1,491 —Prepaid assets 519 204Total current assets 421,495 394,115Noncurrent assets:Restricted assets (note 3):Cash and cash equivalents 39,416 98,054Investments 203,940 55,141Total restricted cash equivalents and investments 243,356 153,195Utility plant (note 4):In-service 4,026,194 3,855,422Less accumulated depreciation (1,115,381) (1,041,573)Net utility plant in-service 2,910,813 2,813,849Construction-in-progress 807,430 485,497Net utility plant 3,718,243 3,299,346Other noncurrent assets:Unamortized bond issuance costs 19,536 17,430Due from other jurisdictions (note 8) 12,506 6,639Total other noncurrent assets 32,042 24,069Total noncurrent assets 3,993,641 3,476,610Total assets 4,415,136 3,870,725LiabilitiesCurrent liabilities:Accounts payable and accrued expenses 143,375 119,850Deferred revenue 42,875 33,568Accrued interest 43,841 39,945Commercial paper notes payable (note 11) 41,200 35,200Current maturities of long-term debt (note 10) 19,692 18,721Other liabilities (note 12) 7,748 5,591Compensation payable 7,843 6,601Due to jurisdictions 7,645 8,500Due to District government (note 13) — 1,980Total current liabilities 314,219 269,956Noncurrent liabilities:Long-term debt, excluding current maturities (note 10) 1,813,967 1,530,174Deferred revenue 1,071,616 918,787Deferred revenue - combined sewer overflow 40,041 55,383Other liabilities (note 12) 19,345 26,129Compensated absences payable (note 9) 10,459 10,147Total noncurrent liabilities 2,955,428 2,540,620Total liabilities 3,269,647 2,810,576Net AssetsInvested in utility plant, net of related debt 975,933 891,786Restricted for:Debt service 27,297 26,825Unrestricted 142,259 141,538Total net assets $ 1,145,489 $ 1,060,149The notes to the basic financial statements are an integral part of these financial statements.47 |
DISTRICT OF COLUMBIA WATER AND SEWER AUTHORITYStatements of Revenues, Expenses and Changes in Net AssetsYears Ended September 30, <strong>2012</strong> and 2011(In $ thousands)<strong>2012</strong> 2011Operating revenues:<strong>Water</strong> and wastewater user charges:Residential, commercial and multi-family customers $ 256,846 $ 241,475Federal government 48,381 43,033District government and D.C. Housing Authority (note 13) 24,713 25,123Charges for wholesale wastewater treatment 94,549 90,414Other 16,077 8,210Total operating revenues 440,566 408,255Operating expenses:Personnel services 97,784 93,240Contractual services 64,939 71,055Chemicals, supplies and small equipment 28,815 28,188Utilities and rent 26,786 29,429Depreciation and amortization 74,342 70,209<strong>Water</strong> purchases 28,389 27,170Payment in lieu of taxes and right of way fee (note 13) 21,982 21,982Total operating expenses 343,037 341,273Operating income 97,529 66,982Non-operating revenues (expenses):Interest income 749 2,036Interest expense and fiscal charges (71,895) (71,621)Total non-operating revenues (expenses) (71,146) (69,585)Change in net assets before Federal grants and contributions 26,383 (2,603)Federal grants and contributions 58,957 47,374Change in net assets 85,340 44,771Net assets, beginning of year 1,060,149 1,015,378Net assets, ending of year $ 1,145,489 $ 1,060,149The notes to the basic financial statements are an integral part of these financial statements.48 |
DISTRICT OF COLUMBIA WATER AND SEWER AUTHORITYStatements of Cash FlowsYears Ended September 30, <strong>2012</strong> and 2011(In $ thousands)<strong>2012</strong> 2011Cash flows from operating activities:Cash received from customers $ 425,174 $ 401,510Cash paid to suppliers for goods and services (149,123) (154,385)Cash paid to employees for services (96,230) (91,535)Cash paid to District for PILOT and ROW (17,514) (20,618)Net cash provided by operating activities 162,307 134,972Cash flows from capital and related financing activities:Proceeds from issuance of revenue bonds 491,102 297,580Proceeds from other jurisdictions 174,259 82,856Repayments of bond principal and notes payable to Federal and District governments (194,941) (17,792)Acquisition of utility plant and purchased capacity (472,377) (302,536)Payments of interest and fiscal charges (96,393) (74,715)Contributions of capital from Federal government 39,560 27,485Proceeds from issuance of commercial paper 194,000 152,000Repayments of commercial paper (188,000) (146,000)Net cash (used in) provided by capital and related financing activities (52,790) 18,878Cash flows from investing activities:Cash received for interest 1,068 1,894Investment purchases (730,705) (564,757)Investment maturities 679,161 422,156Net cash used in investing activities (50,476) (140,707)Net increase in cash and cash equivalents 59,041 13,143Cash and cash equivalents (including restricted) at beginning of year 210,998 197,855Cash and cash equivalents (including restricted) at end of year $ 270,039 $ 210,998Operating income $ 97,529 $ 66,982Adjustments to reconcile operating income to net cash provided byoperating activities:Depreciation and amortization 74,342 70,209Change in operating assets and liabilities:(Increase) decrease in customer and other receivables (3,127) 183Decrease in inventory 275 241Increase in payables and accrued liabilities 2,718 7,093Decrease in deferred revenue (9,430) (9,736)Net cash provided by operating activities $ 162,307 $ 134,972Noncash Capital and financing Activities:Capital asset additions included in accounts payable $ 99,527 $ 85,504The notes to the basic financial statements are an integral part of these financial statements.49 |
50this page intentionally left blank
DISTRICT OF COLUMBIA WATER AND SEWER AUTHORITYNotes to the <strong>Financial</strong> StatementsSeptember 30, <strong>2012</strong> and 2011(In $ thousands)(1) <strong>Report</strong>ing EntityThe District of Columbia <strong>Water</strong> and Sewer Enterprise Fund (the “Fund”) was established in 1979 andwas operated by the <strong>Water</strong> and Sewer Utility Administration, a division of the Government of the Districtof Columbia (the “District”) Department of Public Works. The District of Columbia <strong>Water</strong> and SewerAuthority (“<strong>DC</strong> <strong>Water</strong>” or the “Authority”), an independent authority of the District, was created in April1996 and began operating on October 1, 1996 under and pursuant to an act of the Council of theDistrict entitled the "<strong>Water</strong> and Sewer Authority and Department of Public Works Reorganization Act of1996 (as amended)”, and an Act of the United States Congress entitled the "District of Columbia <strong>Water</strong>and Sewer Authority Act of 1996". The Authority is considered a component unit of the District forfinancial reporting purposes.The Authority provides water and wastewater services to District residents, businesses, federal andmunicipal customers, and certain facilities of the Federal government in Virginia and Maryland. <strong>DC</strong><strong>Water</strong> also operates a regional advanced wastewater treatment plant (Blue Plains) and an interceptortrunk line that carries wastewater primarily from Loudoun and Fairfax Counties and Dulles Airport to theBlue Plains wastewater treatment facility.The Authority’s wastewater service territory includes over 2.1 million people in Montgomery and PrinceGeorge’s Counties in Maryland, Fairfax and Loudoun Counties in Virginia, and the District. The BluePlains Intermunicipal Agreement (“IMA”) was executed in September 1985 among the District; FairfaxCounty, Virginia; and the Washington Suburban Sanitary Commission (“WSSC”), which comprisesMontgomery and Prince George’s Counties in Maryland (collectively referred to as the Participants).The IMA provided for the expansion of the Plant’s processing capacity to 370 million gallons per day.The IMA also provided for the allocation of capital, operating, and maintenance costs among theParticipants. Capital costs of the Plant are allocated among the Participants in proportion to theirrespective wastewater treatment capacity allocation as defined in the IMA. Operating costs areallocated based on wastewater flows from each participant.The Loudoun County Sanitation Authority and the Potomac Interceptor Group also purchasewastewater services from the Authority. The Potomac Interceptor Group consists of the Town ofVienna, Virginia; the U.S. Park Service; the Department of the Navy; and the Metropolitan WashingtonAirports Authority (Dulles Airport).The Authority purchases water from the Washington Aqueduct (the “Aqueduct”), which is owned by theU.S. Government and operated by the U.S. Army Corps of Engineers under the direction of theSecretary of the Army. The Aqueduct operates two water purification plants for the exclusive benefit ofthe Authority, Arlington County, Virginia and the City of Falls Church, Virginia. The Authority purchasesapproximately 75 percent of the water produced by the Aqueduct, which is reported as waterpurchases.51
DISTRICT OF COLUMBIA WATER AND SEWER AUTHORITYNotes to the <strong>Financial</strong> StatementsSeptember 30, <strong>2012</strong> and 2011(In $ thousands)(2) Summary of Significant Accounting PoliciesThe financial statements of the Authority have been prepared in conformity with accounting principlesgenerally accepted in the United States of America (“GAAP”) as applied to governmental units. TheGovernmental Accounting Standards Board (“GASB”) is the accepted primary standard-setting body forestablishing governmental accounting and financial reporting standards. The Authority’s significantaccounting policies are described below.(a)Measurement Focus and Basis of AccountingThe term “measurement focus” is used to denote what is being measured and reported in theAuthority’s financial statements. The Authority is accounted for on the “flow of economicresources” measurement focus. The flow of economic resources refers to the reporting of all thenet assets available to the Authority for the purposes of providing related water and sewerservices. The accounting objectives of this measurement focus are the determination of operatingincome, changes in net assets (or cost recovery), financial position and cash flows. All assets andliabilities (whether current or noncurrent) and associated activities are reported and equity isreported as net assets. The term “basis of accounting” is used to determine when a transaction orevent is recognized in the Authority’s financial statements. The Authority uses the full accrualbasis of accounting, with revenues recorded when earned and expenses recorded when incurred,even though actual payment or receipt may not occur until after the period ends.The Authority elected GASB Statement No. 20, Accounting and <strong>Financial</strong> <strong>Report</strong>ing forProprietary Funds and Other Governmental Entities That Use Proprietary Fund Accounting, not tofollow <strong>Financial</strong> Accounting Standards Board (“FASB”) pronouncements issued subsequent toNovember 30, 1989. Therefore, the Authority follows all GASB pronouncements and FASBpronouncements issued on or before November 30, 1989, unless those pronouncements conflictor contradict GASB pronouncements.As allowed by GASB 20, the Authority accounts for its regulatory assets and liabilities inaccordance with FASB Accounting Standards Codification (“ASC”) 980-10, RegulatedOperations: In general, FASB ASC 980-10 covers the type of regulation that permits rates to beset at levels intended to recover the estimated costs of providing regulated services, including thecost of capital. There are times in which the revenues intended to cover certain costs areprovided either before or after the costs have been incurred. If the costs will be recovered in thefuture, a regulatory asset is capitalized and reduced as the related revenues are provided. If thecurrent recovery is for costs that will be incurred in future periods, regulatory liabilities areaccrued and reduced as those costs are incurred. As of September 30, <strong>2012</strong> and 2011, noregulatory assets or liabilities were required to be reported in accordance with FASB ASC 980-10.The Authority follows the provisions of GASB Statement No. 34, Basic <strong>Financial</strong> Statements –and Management’s Discussion and Analysis – for State and Local Governments. GASBStatement No. 34 established standards for external financial reporting for all states and localgovernmental entities, which includes a statement of net assets, a statement of revenues,expenses and change in net assets, and a statement of cash flows.52
DISTRICT OF COLUMBIA WATER AND SEWER AUTHORITYNotes to the <strong>Financial</strong> StatementsSeptember 30, <strong>2012</strong> and 2011(In $ thousands)(2) Summary of Significant Accounting Policies (Continued)GASB Statement No. 34 requires the classification of net assets into three components asdescribed below:• Invested in capital assets, net of related debt – This component of net assets consists ofcapital assets, including restricted capital assets, net of accumulated depreciation and isreduced by the outstanding balances of any bonds or other borrowings that areattributable to the acquisition, construction, or improvement of those assets.• Restricted – This component of net assets consists of restrictions placed on net assets asa result of external constraints imposed by creditors (such as through debt covenants),grantors, contributors, or laws or regulations of other governments or constraints imposedby law through constitutional provisions or enabling legislation.• Unrestricted – This component of net assets consist of net assets that do not meet thedefinition of “restricted” or “invested in capital assets, net of related debt.”The Authority follows the provisions of GASB Statement No. 40, Deposit and Investment RiskDisclosures to amend GASB Statement No. 3. GASB Statement No. 40 updates the custodialcredit risk disclosure requirements of GASB Statement No. 3 and establishes morecomprehensive disclosure requirements. It also addresses other common risks of deposits andinvestments of state and local governments.(b)Revenues and ExpensesRevenues and expenses are distinguished between operating and non-operating items.Operating revenues generally result from providing services in connection with the Authority’sprincipal ongoing operations. The principal operating revenues of the Authority are water andwastewater user charges, and charges for wholesale wastewater treatment. Revenues from usercharges and sales of services are recognized as the related services are provided. Refunds tocustomers are charged to income in the period in which those refunds are paid.Operating expenses include the costs associated with the conveyance of water and wastewater,treatment of wastewater, administrative expenses, and depreciation of capital assets. Allrevenues and expenses not meeting these definitions are reported as non-operating revenuesand expenses.<strong>Water</strong> and Wastewater User ChargesRetail water and wastewater rates are approved by the Authority’s Board of Directors. Charges tothe District and the Federal government are the same as those charged to retail customers.Charges for services provided but unbilled at the end of the year are recorded as revenue on anestimated basis, which considers historical usage patterns and current rates. Allowances forcustomer receivables that ultimately may be uncollectible are estimated and charged to expense.53
DISTRICT OF COLUMBIA WATER AND SEWER AUTHORITYNotes to the <strong>Financial</strong> StatementsSeptember 30, <strong>2012</strong> and 2011(In $ thousands)(2) Summary of Significant Accounting Policies (Continued)Charges for Wholesale Wastewater Treatment and Deferred RevenueThe cost of operating and maintaining the wastewater treatment plant and related collectionfacilities applicable to non-District users is billed to participating jurisdictions based upon theirshare of flows. The charges for operating and maintenance costs and for overhead costs incurredon capital projects are recorded as charges for wholesale wastewater treatment revenue in theyear the costs are incurred.The costs of capital projects required for the joint use facilities are allocated to the participatingjurisdictions based on their applicable capacity allocation. The reimbursements for capital relatedcosts are recorded as deferred revenue and are amortized into charges for wholesale wastewatertreatment over the estimated useful lives of the related assets.(c)Cash and Cash Equivalents<strong>DC</strong> <strong>Water</strong> maintains its own cash accounts for the collection of all revenues and payment of allexpenses. <strong>DC</strong> <strong>Water</strong> invests all unrestricted cash balances, in excess of the requiredcompensating balances, in interest-bearing accounts. The Authority’s cash equivalents consist ofunrestricted and restricted investments such as money market funds, commercial paper, andfederal agency discount notes, which have an original maturity of 90 days or less, and are readilyconvertible to known amounts of cash. For purposes of the accompanying statements of cashflows, cash and cash equivalents also include <strong>DC</strong> <strong>Water</strong>’s restricted cash balances. See note3(d).(d)InvestmentsThe Authority’s investments consist of unrestricted and restricted federal government agencynotes, certificate of deposits and commercial paper which have an original maturity in excess of90 days. Investments are recorded at amortized cost, and certain non-participating contracts arerecorded at cost. Recorded amounts approximate fair value.(e)Restricted AssetsRestricted assets consist of appropriations from the U.S. Congress for combined sewer overflowprojects, unexpended commercial paper and revenue bond proceeds, debt service reserves,workers’ compensation reserves, and funds for the current payment of revenue bond debtservice.These assets, which cannot be used for routine operations, are classified as restricted assetssince some of their use is limited by applicable bond covenants and external restrictions.54
DISTRICT OF COLUMBIA WATER AND SEWER AUTHORITYNotes to the <strong>Financial</strong> StatementsSeptember 30, <strong>2012</strong> and 2011(In $ thousands)(2) Summary of Significant Accounting Policies (Continued)(f)Utility PlantUtility plant is stated at original construction cost, which includes personnel services and interestcosts incurred during construction. Normal recurring maintenance and repair costs are charged tooperations, whereas major repairs, improvements and replacements, which materially extend theuseful lives of the assets, are capitalized. Construction-in-progress is reclassified to utility plantin-service upon substantial completion or when placed in service, with related depreciationcommencing at that time. Capitalization thresholds are: $500 for buildings, improvements andinfrastructure; and $5 for equipment. The cost of normal maintenance and repairs that do not addto the value of the asset or materially extend asset lives are not capitalized.Utility plant is depreciated using the straight-line method over the following estimated useful lives:Asset ClassInfrastructure and storm drainsHeavy and hydraulic equipmentBuilding improvementsEquipmentFleetEstimated Useful Lives60 years20 years20 years3-5 years5-10 years(g)Purchased CapacityHistorically, the District issued long-term debt to finance most of the Aqueduct’s capital facilities,and the Authority recorded this debt and related capital costs in its financial statements. OnApril 1, 1997, Authority and the Northern Virginia customers entered into an agreement with theFederal government, which provides for the funding of a significant portion of the Aqueduct’scapital improvement program directly by the Federal government through borrowing, with theremaining amounts to be funded directly by each customer.The Authority is responsible for funding only its portion of this debt, of which none is currentlyoutstanding, other related capital projects, and operating costs calculated, as its pro rata share ofwater purchased.Additionally, the Authority’s participation in the Little Seneca Lake and Jennings RandolphReservoir (Bloomington Dam) projects is included in purchased capacity. The two projectsprovide backup and peak-day water supply for the Authority and the other two Aqueductcustomers as well as other area jurisdictions. The Jennings Randolph Reservoir was constructedby the Federal government and is operated by the U.S. Army Corps of Engineers, BaltimoreDistrict. The Authority funds 30 percent of all operating and capital costs. The Little Seneca Lakewas constructed and is operated by the Washington Suburban Sanitary Commission. TheAuthority funds 40 percent of all capital and operating costs. Purchased capacity is generallyamortized over the estimated useful lives of the facilities of 60 years.55
DISTRICT OF COLUMBIA WATER AND SEWER AUTHORITYNotes to the <strong>Financial</strong> StatementsSeptember 30, <strong>2012</strong> and 2011(In $ thousands)(2) Summary of Significant Accounting Policies (Continued)(h)InventoryInventory is recorded at the lower of weighted average cost or market value and consistsprimarily of operating and maintenance materials.(i)Debt Financing CostsBond discount, premium and costs incurred to issue debt are capitalized and amortized asinterest expense over the related bond issue period using the effective interest method.(j)Reclassifications and Immaterial AdjustmentCertain prior year amounts have been reclassified to conform to the current year presentation.Subsequent to the issuance of its September 30, <strong>2012</strong> and 2011 comparative financialstatements, the Authority revised its financial statements for reclassifications and an immaterialadjustment. These reclassifications did not impact total net assets.The Authority also corrected the reporting of accumulated interest on Federal appropriations todefer recognition of the interest revenue until such funds are used in accordance with therequirements of the underlying appropriations act. This resulted in a reduction to net assets aspreviously reported as of September 30, <strong>2012</strong>, 2011 and 2010 of approximately $12.3 million,$12.1 million, and $12.1 million, respectively.(k)Use of Estimates and AssumptionsThe preparation of financial statements in conformity with accounting principles generallyaccepted in the United States of America requires management to make certain estimates andassumptions that affect the reported amounts of assets and liabilities and disclosure of contingentassets and liabilities at the date of the financial statements and the reported amounts of revenuesand expenses during the reporting period. Actual results could differ from those estimates.(l)Vacation and Sick LeaveEmployees earn vacation and sick leave based on a prescribed formula, which allows employeesto accumulate sick leave and vacation leave up to the maximum shown in the table below.Vacation leave earned but unused by employees vests and is accrued as a liability. Sick paydoes not vest, and accordingly, it is recorded when used. See Note 14d for additional disclosureon sick leave for non-union employees.Employees Length of servcice Union Employees Non-union Employees1 - 3 years 240 hours 240 hours4 - 14 years 240 hours 320 hoursOver 15 years 240 hours 360 hours56
DISTRICT OF COLUMBIA WATER AND SEWER AUTHORITYNotes to the <strong>Financial</strong> StatementsSeptember 30, <strong>2012</strong> and 2011(In $ thousands)(3) Cash Deposits and Investments(a)Cash DepositsAt September 30, <strong>2012</strong> and 2011, the carrying amounts of the Authority’s unrestricted andrestricted bank deposits were $88,863 and $111,896, respectively. These bank deposits areentirely insured or collateralized with securities held by the Authority’s agent in its name.(b)Cash Equivalents and InvestmentsAs of September 30, <strong>2012</strong> and 2011, the Authority had the following cash equivalents andinvestments:Cash equivalents and investments <strong>2012</strong>Weighted AverageMaturity (Years) 2011Weighted AverageMaturity (Years)Money market funds $181,176 0.083 $ 99,102 0.083Government agencies 244,470 1.080 232,899 1.390Commercial paper 49,959 0.310 19,986 0.286Certificate of deposits 10,000 1.520 -Total cash equivalents and investments $485,605 0.638 $351,987 0.961The Authority’s investments are categorized in accordance with GASB Statement No. 40, Depositand Investment Risk Disclosures. Disclosures are limited to:• Deposits that are not covered by depository insurance and are (a) uncollateralized, (b)collateralized with securities held by the pledging financial institution, or (c) collateralizedwith securities held by the pledging financial institution's trust department or agent but notin the depositor-government's name.• Investment securities that are uninsured, are not registered in the name of thegovernment, and are held by either (a) the counterparty or (b) the counterparty's trustdepartment or agent but not in the government's name.In <strong>2012</strong>, the Authority began participating in the Certificate of Deposit Account Registry Services(“CDARS”). The service allows the Authority to allocate funds into certificates of deposit inincrements, which ensure the funds are eligible for full FDIC insurance.During fiscal year <strong>2012</strong>, the Authority purchased a total of $10 million through CDARS whichmatures at various dates through March 2014 and were interest bearing at rates ranging from0.5% to 0.9%.The Authority’s investments are not subject to foreign currency risk. The Authority’s investmentsare subject to interest rate, credit and custodial risks as described below:Interest Rate Risk - As a means of limiting exposure to fair value losses arising from risinginterest rates, the Authority’s investment policy limits maximum maturity of non-debt-relatedpermissible deposits and investments to no longer than 36 months.57
DISTRICT OF COLUMBIA WATER AND SEWER AUTHORITYNotes to the <strong>Financial</strong> StatementsSeptember 30, <strong>2012</strong> and 2011(In $ thousands)(3) Cash Deposits and Investments (Continued)Credit Risk – The Authority’s Board of Directors has approved a cash management andinvestment policy, and the Authority has adopted investment practices based on guidelinesestablished by the Government Finance Officers Association. Allowable investments includeobligations of the U.S. Treasury and U.S. agencies. The Authority may also invest in highly ratedbankers’ acceptances, repurchase agreements, commercial paper, corporate notes and bonds,certificates of deposit and money market funds. The Authority’s money market funds are AAArated.Custodial Risk - For an investment, custodial risk is the risk that in the event of the failure of thecounterparty, the Authority will not be able to recover the value of its investments or collateralsecurities that are in the possession of the outside party. The Authority’s investment policyrequires that, at the time funds are invested, collateral for repurchase agreements be held in theAuthority’s name by a custodial agent for the term of the agreement and investments inobligations of the United States or its agencies be held by the Federal Reserve in a custodialaccount. Investment grade means investments with a rating of AA or A-1/P-1 or better.Investments are restricted as to the amount in each type of investment to ensure appropriatediversification.(c)Cash and Investment ScheduleA schedule of cash equivalents and investments as of September 30, <strong>2012</strong> and 2011 follows:<strong>2012</strong> 2011Description Unrestricted Restricted Total Unrestricted Restricted TotalCash and cash equivalentsDemand deposits $ 83,836 $ 5,027 $ 88,863 $ 104,845 $ 7,051 $111,896Money market funds 10,636 170,540 181,176 8,099 91,003 99,102Total cash and cash equivalents 94,472 175,567 270,039 112,944 98,054 210,998InvestmentsGovernment agencies 50,527 193,943 244,470 59,773 173,126 232,899Commercial paper 39,962 9,997 49,959 9,991 9,995 19,986Certificate of deposit 10,000 - 10,000 - - -Total Investments 100,489 203,940 304,429 69,764 183,121 252,885Total cash, cash equivalents &investments$ 194,961 $379,507 $574,468 $ 182,708 $281,175 $463,883Included in unrestricted demand deposits and agency discount notes are $27,951 for the RateStabilization Fund. The Authority established the Rate Stabilization Fund in fiscal year 2001. Thebalance in this account will be used in the future at the Authority’s discretion.58
DISTRICT OF COLUMBIA WATER AND SEWER AUTHORITYNotes to the <strong>Financial</strong> StatementsSeptember 30, <strong>2012</strong> and 2011(In $ thousands)(3) Cash Deposits and Investments (Continued)(d)Restricted Cash and Investment ScheduleA schedule of restricted cash equivalents and investments as of September 30, <strong>2012</strong> and 2011follows:Description <strong>2012</strong> 2011Restricted cash and cash equivalents (current and noncurrent)Revenue bonds 2010 digesters $ 41,011 $ 17,224Revenue bonds <strong>2012</strong> B-2 27,067 -Revenue bonds <strong>2012</strong> B-1 12,295 -Principal payment account 1998 revenue bonds 11,081 10,501Combined sew er overflow (CSO) federal appropriations 10,055 15,165Revenue bonds <strong>2012</strong> A 9,619 -Debt service interest payment account, <strong>2012</strong> A,C revenue bonds 8,726 -Debt service reserve account, 1998 revenue bonds 8,712 4,038Debt service interest payment account, 2010 revenue bonds 8,477 8,616Debt service interest payment account, 2009 revenue bonds 8,034 8,063Debt service interest payment account, 2008 revenue bonds 7,001 7,126Debt service interest payment account, 1998 revenue bonds 6,146 10,880Principal payment account 2008 revenue bonds 5,746 5,585Debt service interest payment account, 2007 revenue bonds 5,677 5,676Principal payment account 2009 revenue bonds 2,486 2,020Debt service interest payment account, <strong>2012</strong> B-1,2 revenue bonds 2,258 -Commercial paper 1,176 1,124Workers' compensation reserve account - 1,036District Department of Transportation 11th street bridge - 1,000Total restricted cash and cash equivalents 175,567 98,054Restricted investmentsRevenue bonds <strong>2012</strong> A 109,338 -Combined sew er overflow (CSO) federal appropriation 29,985 40,219Revenue bonds <strong>2012</strong> B-1 24,993 -Revenue bonds <strong>2012</strong> B-2 19,994 -Debt service reserve account, 1998 revenue bonds 15,335 20,009Revenue bonds 2010 cap interest 4,295 7,142Revenue bonds 2010 - 115,751Total restricted investments 203,940 183,121Total restricted cash, cash equivalents & investments $ 379,507 $ 281,17559
DISTRICT OF COLUMBIA WATER AND SEWER AUTHORITYNotes to the <strong>Financial</strong> StatementsSeptember 30, <strong>2012</strong> and 2011(In $ thousands)(4) Utility PlantThe following tables present the activity in utility plant for the years ended September 30, <strong>2012</strong> and2011.BalanceBalance9/30/2011 Additions Disposals Transfers 9/30/<strong>2012</strong>Utility PlantWastewater treatment plant $ 1,839,010 $ - $ (629) $ 86,604 $ 1,924,985Wastewater collection facilities 689,575 - - 27,076 716,651<strong>Water</strong> distribution system 863,474 - - 33,603 897,077Purchased capacity 307,593 12,247 - - 319,840Capital equipment 155,770 - (523) 12,394 167,641Total utility plant in-service 3,855,422 12,247 (1,152) 159,677 4,026,194Less accumulated depreciation:Wastewater treatment plant (454,216) (30,742) 11 - (484,947)Wastewater collection facilities (205,642) (11,467) - - (217,109)<strong>Water</strong> distribution system (192,845) (15,455) - - (208,300)Purchased capacity (60,543) (5,290) - - (65,833)Capital equipment (128,327) (11,388) 523 - (139,192)Total accumulated depreciation (1,041,573) (74,342) 534 - (1,115,381)Net utility plant in-service 2,813,849 (62,095) (618) 159,677 2,910,813Construction-in-progress 485,497 481,610 - (159,677) 807,430Net utility plant $ 3,299,346 $ 419,515 $ (618) $ - $ 3,718,243BalanceBalance9/30/2010 Additions Disposals Transfers 9/30/2011Utility PlantWastewater treatment plant $ 1,822,320 $ 16,690 $ - $ - $ 1,839,010Wastewater collection facilities 598,404 91,171 - - 689,575<strong>Water</strong> distribution system 800,861 62,613 - - 863,474Purchased capacity 279,278 28,315 - - 307,593Capital equipment 144,307 12,196 (733) - 155,770Total utility plant in-service 3,645,170 210,985 (733) - 3,855,422Less accumulated depreciation:Wastewater treatment plant (424,522) (29,694) - - (454,216)Wastewater collection facilities (195,138) (10,504) - - (205,642)<strong>Water</strong> distribution system (178,501) (14,344) - - (192,845)Purchased capacity (55,591) (4,952) - - (60,543)Capital equipment (118,344) (10,716) 733 - (128,327)Total accumulated depreciation (972,096) (70,210) 733 - (1,041,573)Net utility plant in-service 2,673,074 140,775 - - 2,813,849Construction-in-progress 327,738 340,429 - (182,670) 485,497Net utility plant $ 3,000,812 $ 481,204 $ - $ (182,670) $ 3,299,34660
DISTRICT OF COLUMBIA WATER AND SEWER AUTHORITYNotes to the <strong>Financial</strong> StatementsSeptember 30, <strong>2012</strong> and 2011(In $ thousands)(5) Purchased CapacityThe Washington Aqueduct, managed by the U.S. Army Corps of Engineers, provides wholesale watertreatment services to the Authority, Northern Virginia, Arlington County and Falls Church. In addition topaying for operating and maintenance costs for the Aqueduct, the Authority and the other jurisdictionsare also responsible for capital costs at the Aqueduct. The Authority’s share of capital costs is recordedin its books as purchased capacity.Purchased capacity activity for the year ended September 30, <strong>2012</strong> was as follows:BalanceBalance9/30/2011 Additions 9/30/<strong>2012</strong>Purchased CapacityWashington Aqueduct $ 275,403 $ 12,247 $ 287,650Jennings Randolph Reservoir 19,863 - 19,863Little Seneca Lake 12,327 - 12,327Total in-service 307,593 12,247 319,840Less accumulated depreciation:Washington Aqueduct (47,634) (4,692) (52,326)Jennings Randolph Reservoir (7,465) (393) (7,858)Little Seneca Lake (5,444) (205) (5,649)Total accumulated depreciation (60,543) (5,290) (65,833)Purchased capacity, net $ 247,050 $ 6,957 $ 254,007Purchased capacity activity for the year ended September 30, 2011 was as follows:BalanceBalance9/30/2010 Additions 9/30/2011Purchased CapacityWashington Aqueduct $ 247,088 $ 28,315 $ 275,403Jennings Randolph Reservoir 19,863 - 19,863Little Seneca Lake 12,327 - 12,327Total in-service 279,278 28,315 307,593Less accumulated depreciation:Washington Aqueduct (43,280) (4,354) (47,634)Jennings Randolph Reservoir (7,072) (393) (7,465)Little Seneca Lake (5,239) (205) (5,444)Total accumulated depreciation (55,591) (4,952) (60,543)Purchased capacity, net $ 223,687 $ 23,363 $ 247,05061
DISTRICT OF COLUMBIA WATER AND SEWER AUTHORITYNotes to the <strong>Financial</strong> StatementsSeptember 30, <strong>2012</strong> and 2011(In $ thousands)(6) Due from Federal GovernmentThe amount due from the Federal government consists of the following at September 30:Description <strong>2012</strong> 2011Washington Aqueduct advances $ 17,434 $ 18,396Federal grants receivable 6,057 2,109Total $ 23,491 $ 20,505The Washington Aqueduct advances consist of unexpended pay-go advances for capital projects and$4,675 annually for operating escrow as required by the <strong>Water</strong> Sales Agreement.(7) Customer ReceivablesCustomer receivables include unbilled revenues of $15,587 and $12,986 at September 30, <strong>2012</strong> and2011, respectively.(8) Due from Other JurisdictionsThe amount due from other jurisdictions consists of the following at September 30:Description <strong>2012</strong> 2011Current:Washington Suburban Sanitary Commission $ 6,025 $ 11,380Fairfax 914 2,661Loudoun County Sanitation Authority 414 1,080Northern Virginia (a) 94 101Potomac Interceptor 528 980Total current 7,975 16,202Noncurrent:Washington Suburban Sanitary Commission 7,129 2,417Northern Virginia (a) 3,350 3,444Fairfax 1,389 524Loudoun County Sanitation Authority 638 254Total noncurrent 12,506 6,639Total due from jurisdictions $ 20,481 $ 22,841(a)Northern VirginiaThe amount due from Northern Virginia represents the Arlington County and the City of FallsChurch, Virginia portions of the debt incurred by the Authority for the purpose of funding capitalexpenditures of the Washington Aqueduct prior to April 1, 1997.62
DISTRICT OF COLUMBIA WATER AND SEWER AUTHORITYNotes to the <strong>Financial</strong> StatementsSeptember 30, <strong>2012</strong> and 2011(In $ thousands)(9) Compensated Absences PayableThe following table reflects the activity associated with accrued compensated absences for the yearsended September 30, <strong>2012</strong> and 2011, respectively:<strong>2012</strong> 2011Description Vacation Sick Total Vacation Sick TotalBeginning of year $ 6,659 $ 4,570 $ 11,229 $ 6,195 $ 3,914 $ 10,109Increased 987 721 1,708 1,282 787 2,069Decreased (790) (413) (1,203) (818) (131) (949)End of year 6,856 4,878 11,734 6,659 4,570 11,229Less: current portion 902 373 1,275 829 253 1,082Noncurrent portion $ 5,954 $ 4,505 $ 10,459 $ 5,830 $ 4,317 $ 10,147The current portion of compensated absences is included in compensation payable in theaccompanying statements of net assets.63
DISTRICT OF COLUMBIA WATER AND SEWER AUTHORITYNotes to the <strong>Financial</strong> StatementsSeptember 30, <strong>2012</strong> and 2011(In $ thousands)(10) Long-Term DebtThe Authority derives part of its funding for future capital projects from the issuance of revenue bonds,District general obligation bonds, notes payable to the Federal government and various other non-debtsources of financing.A schedule of long-term debt activity for the year ended September 30, <strong>2012</strong> is shown below:Balance New Debt Debt Balance Due WithinDescription 9/30/2011 Issued Retired 9/30/<strong>2012</strong> One Year<strong>2012</strong> public utility revenue bonds:Series A interest at 2.0 % to 5.0%, maturing in 2037 $ - $ 177,430 $ - $ 177,430 $ -Series B-1 interest at 2.26%, maturing in 2044 - 52,690 - 52,690 -Series B-2 interest at 2.26%, maturing in 2040 - 47,310 - 47,310 -Series C interest at 4.0% to 5.0%, maturing in 2033 163,215 - 163,215 -2010 series a public utility revenue bonds; interest at4.07% to 5.5%, maturing in 2044 300,000 - - 300,000 -2009 series a public utility revenue bonds; interest at3.0% to 6.0%, maturing in 2039 298,225 - (2,020) 296,205 2,4852008 series a public utility revenue bonds; interest at4.0% to 5.0%, maturing in 2034 285,540 - (5,585) 279,955 5,7452007 series a public utility revenue bonds; interest at4.75% to 5.50%, maturing in 2041 218,715 - - 218,715 -2003 public utility revenue bonds; interest rangesfrom 5.0% to 5.25%, maturing in 2033 176,220 - (176,220) - -1998 public utility revenue bonds; interest rangesfrom 5.50% to 6.00%, maturing in 2028 229,315 - (10,500) 218,815 11,080Notes payable to the federal government for JenningsRandolph Reservoir (Bloomington Dam); interest at3.25%, maturing in 2041 14,603 - (330) 14,273 341Notes payable to WSSC for Little Seneca Lake;interest ranges from 5.98% to 6.60% maturing in2014 104 - (41) 63 41District of Columbia general obligation bonds:1993; interest ranges from 5.40% to 6.0%maturing in <strong>2012</strong> 245 - (245) - -Total bonds and notes $ 1,522,967 $ 440,645 $ (194,941) $ 1,768,671 $ 19,692Long-term debt outstanding, as presented on the accompanying statements of net assets, includes netunamortized bond premiums, discounts and amount deferred on refunding of $64,988.64
DISTRICT OF COLUMBIA WATER AND SEWER AUTHORITYNotes to the <strong>Financial</strong> StatementsSeptember 30, <strong>2012</strong> and 2011(In $ thousands)(10) Long-Term Debt (Continued)A schedule of long-term debt activity for the year ended September 30, 2011 is shown below:Balance New Debt Debt Balance Due WithinDescription 9/30/2010 Issued Retired 9/30/2011 One Year2010 series a public utility revenue bonds (buildamerica bonds); interest at 4.07% to 5.5%,maturing in 2044 $ - $ 300,000 $ - $ 300,000 $ -2009 series a public utility revenue bonds;interest at 3.0% to 6.0%, maturing in 2039 300,000 - (1,775) 298,225 2,0202008 series a public utility revenue bonds;interest at 4.0% to 5.0%, maturing in 2034 290,000 - (4,460) 285,540 5,5852007 series a public utility revenue bonds;interest at 4.75% to 5.50%, maturing in 2042 218,715 - - 218,715 -2003 public utility revenue bonds; interestranges from 5.0% to 5.25%, maturing in 2033 176,220 - - 176,220 -1998 public utility revenue bonds; interestranges from 5.50% to 6.00%, maturing in 2028 239,270 - (9,955) 229,315 10,500Notes payable to the federal government forJennings Randolph Reservoir (BloomingtonDam); interest at 3.25%, maturing in 2041 14,923 - (320) 14,603 330Notes payable to WSSC for Little Seneca Lake;interest ranges from 5.98% to 6.60% maturingin 2014 142 - (38) 104 41District of Columbia general obligation bonds:1993; interest ranges from 5.40% to 6.0%maturing in <strong>2012</strong> 495 - (250) 245 2451994; interest ranges from 5.05% to 6.50%maturing in 2011 995 - (995) - -Total bonds and notes $ 1,240,760 $ 300,000 $ (17,793) $ 1,522,967 $ 18,721Long-term debt outstanding, as presented on the accompanying statements of net assets, includes netunamortized bond premiums and discounts of $25,928.(a)Senior DebtPayment of the principal and interest on Authority’s senior debt is secured by a pledge ofAuthority’s gross revenues (excluding any capital contributions or grants) after provisions forpayment of operating expenses. The 2009 and 1998 public utility revenue bonds are consideredsenior debt under the related Master Indenture of Trust (Master Indenture).65
DISTRICT OF COLUMBIA WATER AND SEWER AUTHORITYNotes to the <strong>Financial</strong> StatementsSeptember 30, <strong>2012</strong> and 2011(In $ thousands)(10) Long-Term Debt (Continued)In February 2009, the Authority issued senior lien public utility revenue bonds (Series 2009ABonds) with a face value of $300,000, consisting of $38,355 Serial Bonds and $261,645 TermBonds. The Serial Bonds have maturity dates and interest rates ranging from 2010-2030 and 3.0percent to 5.4 percent, respectively. The Term Bonds have maturity dates and interest ratesranging from 2024-2039 and 4.8 percent to 6.0 percent, respectively. There was $1,426 oforiginal issue premium and approximately $2,392 for the cost of issuance, bond insurance andunderwriter’s discount costs associated with this issuance. Debt proceeds were used to refinance$14,800 of the taxable Series A Commercial Paper Notes and $50,000 of the tax exempt SeriesB Commercial Paper Notes with the remainder used to finance the ongoing capital improvementprogram.In April 1998, the Authority issued $266,120 of senior lien public utility revenue bonds (Series1998 Bonds). As required by the Master Indenture, the Authority has agreed to fix, charge, andcollect rates and fees at levels sufficient to cover annual senior principal and interestrequirements by 120 percent (see “Bond Covenants” below). Gross proceeds from the Series1998 Bonds totaled $285,200, including $18,800 of the original issue premium. Approximately$77,200 was used to fund various capital projects; $181,000 was used to repay the outstandingbalances of a revolving line of credit and certain notes payable to the Federal government and toadvance-refund approximately $152,200 of District general obligation bonds. The remainder ofthe gross proceeds, approximately $27,000, was used to fund the debt service reserve fund andto pay the cost of issuance. The payment of principal and interest on the Series 1998 bonds isinsured by <strong>Financial</strong> Security Assurance, Inc.The Authority completed the advance-refunding portion of the April 1998 bond issuance torestructure its front-loaded debt service schedule. Approximately $160,000 of bond proceeds wasused to purchase securities that were placed in an irrevocable trust, which provides resources forall future debt service payments on the refunded debt. The refunded debt is considered defeased,and the respective liabilities have been removed from the financial statements. The advancerefundingin 1998 resulted in an economic cost (difference between the present values of the oldand new debt service payments) of $241 and an increase in aggregate debt service payments of$119,000. The difference between the refunded debt and the new debt is amortized as acomponent of interest expense over the remaining life of the refunded debt.(b)Subordinate DebtPayments of the Authority’s subordinate debt are made after payments of senior debt and aftercertain reserves have been funded (see “Bond Covenants” below).In March <strong>2012</strong>, the Authority issued subordinate lien revenue bonds with a face value of$440,645. The bonds were structured in three Series: Series <strong>2012</strong>A consisted of $177,430 withinterest rates ranging from 2.0% to 5.0% maturing in 2037. Series <strong>2012</strong>B consisting of $100,000with interest rate at 2.26% maturing in 2040 and 2044.66
DISTRICT OF COLUMBIA WATER AND SEWER AUTHORITYNotes to the <strong>Financial</strong> StatementsSeptember 30, <strong>2012</strong> and 2011(In $ thousands)(10) Long-Term Debt (Continued)Series <strong>2012</strong>C consisting of $163,215 with interest rates ranging from 4.0 % to 5.0% maturing in2033. Gross proceeds from the <strong>2012</strong> Bonds totaled $493,934, including $53.289 of the originalissue premium. Approximately $302,413 was used to fund various capital projects; $188,688 wasused to advance-refund series 2003 bonds, and $2,833 was used to pay the underwriter’sdiscount and cost of issuance.The Authority completed its advance-refunding of the series 2003 bonds by using $188,688 ofbond proceeds from Series <strong>2012</strong>C to purchase securities that were placed in an irrevocable trustwith an escrow agent to provide for all future debt service payments on the bonds. As a result, thebonds are considered to be defeased and the liability for those bonds has been removed from thefinancial statements. This refunding decreases total debt service payments by approximately$25,478 resulting in an economic gain (difference between the present values of the debt servicepayments on the old and new debt) of $17,843.In October 2010, the Authority issued public utility subordinate lien revenue bonds, (Series 2010ABonds). The Build America Bonds federally taxable issuer subsidy in the amount of 35% yieldedall-in true interest costs of 3.6%.The $300,000 par amount consisted of $18,550 in serial bonds maturing in 2033 and grossinterest rates ranging from 4.1% to 4.6%, $30,950 in term bonds maturing in 2028 and a grossinterest rate of 5.4%, and $250,500 in index term bonds maturing in 2044 and a gross interestrate of 5.5%. Approximately $214,640 was issued to fund costs of certain capital improvements,including $2,420 for the cost of issuance and underwriter’s discount. In addition, approximately$75,000 was issued to fund the Digester Project and $10,360 for capitalized interest.In April 2008, the Authority refunded the 2004 and 2007 Series B subordinated public utilityrevenue bonds for $295,000 and $59,000, respectively. Simultaneously, the Authority issuedsubordinated lien public utility revenue bonds (Series 2008A) with a face value of $290,375 whichare due in 2034.The interest rate on these securities is fixed and will have an effective average rate of 4.7% overthe life of the bonds. There was $11,678 of original issue premium and approximately $5,888 forthe cost of issuance, bond insurance and underwriter’s discount costs associated with thisissuance. As required by the Master Indenture, the Authority has agreed to fix, charge, andcollect rates and fees at levels sufficient to cover 100 percent of annual principal and interestpayments (see “Bond Covenants” below). The scheduled payments of principal and interest onthe Series 2008A bonds are guaranteed by a municipal bond insurance policy issued by theAssured Guaranty Program.The refunded debt of Series 2004 and 2007B Series is considered defeased, and the respectiveliabilities have been removed from financial statements. The current refunding in 2008 resulted inan economic cost (difference between the present value of the old and new debt servicepayments) of $12,320 and an increase in aggregate debt service payments of $22,597.67
DISTRICT OF COLUMBIA WATER AND SEWER AUTHORITYNotes to the <strong>Financial</strong> StatementsSeptember 30, <strong>2012</strong> and 2011(In $ thousands)(10) Long-Term Debt (Continued)In June 2007, the Authority issued $218,715 of tax-exempt subordinated lien public utility revenuebonds (Series 2007A bonds) and $59,000 of taxable subordinated lien public utility revenuebonds (Series 2007B bonds). As required by the Master Indenture, the Authority has agreed tofix, charge, and collect rates and fees at levels sufficient to cover 100 percent of annual principaland interest payments (see “Bond Covenants” on the next page). Gross proceeds from the Series2007A bonds totaled $234,923, including $15,661 of original issue premium. Approximately$30,000 was used to repay outstanding commercial paper, and $2,824 was used to pay theunderwriter’s discount, insurance and the cost of issuance. The scheduled payments of principaland interest on Series 2007A bonds are guaranteed by a municipal bond insurance policy issuedby the <strong>Financial</strong> Guaranty Insurance Company (“FGIC”). Gross proceeds from the Series 2007Bbonds totaled $59,000. Proceeds from the Series 2007B bonds were used entirely to fund theAuthority’s share of capital improvements to the Washington Aqueduct. The scheduled paymentsof principal and interest on Series 2007B bonds are guaranteed by a municipal bond insurancepolicy issued by CIFG Assurance North America, Inc. The Series 2007B bonds were refunded inApril 2008.In August 2003, the Authority issued $176,220 of subordinated lien public utility revenue bonds(Series 2003 Bonds). As required by the Master Indenture, the Authority has agreed to fix,charge, and collect rates and fees at levels sufficient to cover 100 percent of annual principal andinterest payments (see “Bond Covenants” on the next page). Gross proceeds from the Series2003 bonds totaled $176,220, including $3,449 of original issue discount and $2,771 for the costof issuance. Approximately $70,000 was used to fund various capital projects and $100,000 wasused to repay outstanding commercial paper. The scheduled payments of principal and intereston the Series 2003 bonds are guaranteed by a municipal bond insurance policy issued by FGIC.The Authority also purchased a surety bond policy from FGIC to meet the debt reserve fundrequirement for the Series 2003 bonds.During fiscal year 2008, FGIC was downgraded below investment grade. As a result, theAuthority obtained a direct pay letter of credit from TD Bank N.A. to supplement the Series 2003Subordinated Debt Service Reserve fund surety provided by FGIC.Notes payable to the Federal government for the Jennings Randolph Reservoir are consideredsubordinate debt under the Master Indenture and contain no pledge of property, sinking fundprovisions, or restrictive covenants. The proceeds of the notes were used to make improvementsto the Jennings Randolph Reservoir for back-up and peak-day water supply.Notes payable to WSSC for the Little Seneca Lake are considered subordinate debt under theMaster Indenture and contain no pledge of property, sinking fund provisions, or restrictivecovenants. The proceeds of the notes were used by WSSC to construct the Little Seneca Damand Lake for back-up and peak-day water supply for the Authority.68
DISTRICT OF COLUMBIA WATER AND SEWER AUTHORITYNotes to the <strong>Financial</strong> StatementsSeptember 30, <strong>2012</strong> and 2011(In $ thousands)(10) Long-Term Debt (Continued)(c)Bond CovenantsThe Master Indenture sets forth the establishment of accounts, the application of revenues, andcertain other covenants to ensure proper operation and maintenance of the water and wastewatersystem and payment of debt service. Management believes the Authority was in compliance withall bond covenants as of and for the years ended September 30, <strong>2012</strong> and 2011. The primaryrequirements of the Master Indenture are summarized below:Rate Covenant — The Authority has covenanted to establish and maintain rates and charges toproduce revenues sufficient to pay operating expenses and annual debt service on senior andsubordinate debt, to fund certain required reserves, to fund any payment in lieu of taxes, and toproduce net revenues sufficient at least equal to the sum of: (1) 120 percent of annual debtservice on senior debt and (2) 100 percent of annual debt service on subordinate debt.Net revenues are defined generally as all Authority revenues (excluding capital contributions fromwholesale customers, Federal grants, or any proceeds derived from the sale of capital assets),less operating and maintenance expenses (excluding any payment in lieu of taxes, depreciationand amortization charges and certain extraordinary, nonrecurring expenses).Debt Service Reserve Fund — The Authority has established debt service reserve accounts forcertain series of bonds, which are only to be used to pay debt service in the event of insufficientfunds. The Series 1998 bonds debt service reserve account balance as of September 30, <strong>2012</strong>and 2011 was $24,047, respectively, and is required to be maintained at 125 percent of currentand future average annual Series 1998 debt service.(d)Debt Service to MaturityThe future debt service obligations at September 30, <strong>2012</strong> are as follows:Fiscal Year Principal Interest Total2013 $ 19,692 $ 73,696 $ 93,3882014 25,189 81,559 106,7482015 26,473 80,229 106,7022016 27,870 78,785 106,6552017 29,317 77,340 106,6572018 - 2022 178,210 361,332 539,5422023 - 2027 239,470 311,004 550,4742028 - 2032 303,669 245,479 549,1482033 - 2037 390,602 158,211 548,8132038 - 2042 446,282 50,758 497,0402043 - 2045 81,897 3,361 85,258Total $ 1,768,671 $ 1,521,754 $ 3,290,42569
DISTRICT OF COLUMBIA WATER AND SEWER AUTHORITYNotes to the <strong>Financial</strong> StatementsSeptember 30, <strong>2012</strong> and 2011(In $ thousands)(11) Commercial PaperCommercial Paper Notes — The Authority has established a commercial paper (“CP”) program toprovide interim financing for Costs of the System. Three series of notes have been issued under thecommercial paper program: the tax-exempt Series A CP Notes in an aggregate principal amount not toexceed $100,000, the tax-exempt Series B CP Notes in an aggregate principal amount not to exceed$50,000, and the taxable Series C CP Notes in an aggregate principal amount not to exceed $75,000(collectively, the “Commercial Paper Notes”), each as subordinate debt. To provide liquidity and creditsupport for the Commercial Paper Notes, the Authority obtained irrevocable, direct-pay letters of credit(the “Letters of Credit”) issued by J.P. Morgan Chase Bank and U.S. Bank National Association(collectively, the “Banks”) which expired on May 31, 2013. In connection with the Banks’ issuance of theLetters of Credit, the Authority and each Bank entered into a Reimbursement Agreement.The Agreements (collectively, the “Reimbursement Agreements”), dated as of June 1, 2010, obligatethe Authority to pay Bank Obligations and Reimbursement Obligations (both as defined in the EleventhSupplemental Indenture relating to the Commercial Paper Notes) and Fee Obligations (as defined ineach Reimbursement Agreement) to the applicable Bank. The Bank Obligations, the ReimbursementObligations and Fee Obligations are subordinate debt under the Indenture.Schedules of commercial paper activity for years ended September 30, <strong>2012</strong> and 2011 are shownbelow:Balance<strong>2012</strong>BalanceDescription 9/30/2011 Maturities Re-Issuance 9/30/<strong>2012</strong>Series C, interest from 0.15% to 0.28%,maturities ranged from 31 to 97 days $ 29,200 $ (146,000) $ 146,000 $ 29,200Series B, interest from 0.08% to 0.19%,maturities ranged from 7 to 88 days 6,000 (42,000) 48,000 12,000$ 35,200 $ (188,000) $ 194,000 $ 41,200Balance2011BalanceDescription 9/30/2010 Maturities Re-Issuance 9/30/2011Series C, interest from 0.20% to 0.30%,maturities ranged from 58 to 91 days $ 29,200 $ (146,000) $ 146,000 $ 29,200Series B, interest at 0.17%, matures in37 days - - 6,000 6,000$ 29,200 $ (146,000) $ 152,000 $ 35,20070
DISTRICT OF COLUMBIA WATER AND SEWER AUTHORITYNotes to the <strong>Financial</strong> StatementsSeptember 30, <strong>2012</strong> and 2011(In $ thousands)(12) Commitments and Contingencies – Other LiabilitiesA schedule of other liabilities as of September 30, <strong>2012</strong> and 2011 is shown below:Description <strong>2012</strong> 2011Risk management contingency $ 12,453 $ 12,260Rolling owner controlled insurance program 10,332 9,504Litigation contingency 2,450 8,291Federal grants disallowance 1,858 1,665Total other liabilities 27,093 31,720Less: current portion 7,748 5,591Noncurrent portion $ 19,345 $ 26,129(a)Federal GrantsThe Authority’s capital and operating grants are subject to financial and compliance audits by theUnited States Environmental Protection Agency, the grantor, or its representatives. TheAuthority’s management does not expect that the results of these audits will have a materialadverse effect on the accompanying financial statements.(b)LitigationThe Authority is a party in various legal actions and claims brought by or against it. In the opinionof the Authority’s management and legal counsel, the ultimate resolution of these actions andclaims will not materially affect the financial position or results of operations of the Authority.Changes in the balances of litigation contingencies during the years ended September 30, <strong>2012</strong>and 2011 were as follows:Description <strong>2012</strong> 2011Balance, beginning of year $ 8,291 $ 6,081Current year claims and changes in estimates (946) 2,585Claim payments (4,895) (375)Balance, end of year $ 2,450 $ 8,29171
DISTRICT OF COLUMBIA WATER AND SEWER AUTHORITYNotes to the <strong>Financial</strong> StatementsSeptember 30, <strong>2012</strong> and 2011(In $ thousands)(12) Commitments and Contingencies – Other Liabilities (Continued)(c)Rolling Owner Controlled Insurance Program (ROCIP)The Authority procures insurance for the majority of its construction contractors through ROCIP.Coverage includes general liability, umbrella and workers’ compensation insurance for almostevery construction project undertaken by <strong>DC</strong> <strong>Water</strong>. The result is substantially higher and broadercoverage, enhanced safety and loss control, increased minority participation and potential costsavings.The Authority completed its final year of the first ROCIP (ROCIP 1) in April of <strong>2012</strong> and began thethird year of ROCIP II. ROCIP II continues for two more years (the ROCIP structure is typicallythree years to enroll projects and five years to complete) – therefore the need to run programssomewhat simultaneously. At the end of fiscal year <strong>2012</strong>, 65 projects and 393 contractors wereenrolled in ROCIP I and 48 projects and 472 contractors were enrolled in ROCIP II. ROCIP II willsupport an estimated $1.15 billion of planned construction projects. In October <strong>2012</strong>, ROCIP IIIwas incepted and will run for five years. We anticipate 65 projects will be enrolled and anestimate of $970 million in planned construction.Changes in the Authority’s estimated ROCIP liabilities related to workers’ compensation andgeneral liability claims during the years ended September 30, <strong>2012</strong>, 2011 and 2010 were asfollows:Description <strong>2012</strong> 2011 2010Balance, beginning of year $ 9,504 $ 631 $ 2,285Current year increase in ROCIP liability 3,821 11,195 3,117ROCIP administration and claim payments (2,993) (2,322) (4,771)Balance, end of year $ 10,332 $ 9,504 $ 631(d)Risk ManagementThe Authority is exposed to various risks of loss related to torts; theft of, damage to, anddestruction of assets; errors and omissions; injuries to employees; and natural disasters. EffectiveApril 7, 1998, the Authority purchased certain commercial insurance coverage. Prior to that date,the Authority was either self-insured or covered under District programs. For each of the five mostrecent years, settlement of claims has not exceeded insurance coverage.The Authority has purchased $1,000,000 property coverage (Property Policy) to protect its ownedor leased facilities, buildings and contents. Except for catastrophic on-site protection provided onthe Property Policy, the Authority self-insures its fleet of vehicles.The deductible for each claim for buildings and contents is $1,000. Off-site watercraft andspecified equipment are insured under an Inland Marine Policy. Deductibles range from $10 to$25 on this policy for each occurrence.72
DISTRICT OF COLUMBIA WATER AND SEWER AUTHORITYNotes to the <strong>Financial</strong> StatementsSeptember 30, <strong>2012</strong> and 2011(In $ thousands)(12) Commitments and Contingencies – Other Liabilities (Continued)The Authority has purchased liability insurance coverage to protect it from claims allegingdamages and injuries caused by automobile accidents, damaged utilities, construction, and otheractivities. Limits of $100,000 have been secured in excess of a deductible of $1,000 for eachoccurrence.Public Officials’ liability insurance has been secured with limits of $20,000 in excess of adeductible of $250 to $500 per claim.The Authority self-insures the first $1,000 of workers’ compensation claims costs. In order tomitigate the potential self-insured costs of medical expenses, rehabilitation and lost wages, theAuthority purchased an Excess Workers’ Compensation Policy with unlimited coverage. TheAuthority contracts with a third-party administrator to support the workers’ compensation claimsmanagement program.Liabilities are recognized when it is probable that losses have occurred and the amounts of thelosses can be reasonably estimated. Liabilities include an amount for claims that have beenincurred but not reported to date.Because actual claims liabilities depend on such complex factors as inflation, changes ingoverning laws and standards, and court awards, the process used in computing claims liabilitiesis reevaluated periodically to take into consideration the history, frequency and severity of recentclaims and other economic and social factors.These liabilities are computed using a combination of actual claims experience and statisticallyestimated amounts.Changes in the Authority’s estimated risk management liabilities related to workers’compensation and general liability claims during the years ended September 30, <strong>2012</strong>, 2011 and2010 were as follows:Description <strong>2012</strong> 2011 2010Balance, beginning of year $ 12,260 $ 12,384 $ 12,243Current year claims and changes in estimates 2,333 2,318 3,181Claim payments (2,140) (2,442) (3,040)Balance, end of year $ 12,453 $ 12,260 $ 12,38473
DISTRICT OF COLUMBIA WATER AND SEWER AUTHORITYNotes to the <strong>Financial</strong> StatementsSeptember 30, <strong>2012</strong> and 2011(In $ thousands)(12) Commitments and Contingencies – Other Liabilities (Continued)(e)Construction CommitmentsContractual commitments for utility plant construction and capital equipment for the years endedSeptember 30, <strong>2012</strong> and 2011 were $1,041,086 and $1,042,732, respectively. Constructioncommitments are not recorded in the financial statements.Description <strong>2012</strong> 2011Total contractual commitments $ 1,042,732 $ 365,084Additional commitments (less) workperformed and retainage (1,646) 677,648Outstanding contract commitments $ 1,041,086 $ 1,042,732(f)Lease CommitmentsThe Authority conducts a portion of its operations from leased facilities. Most of the leasescontain renewal options. Virtually all of the leases for equipment and facilities are operatingleases, and the rental payments under these leases are charged to operations as incurred.The Authority’s rental expenses for the years ended September 30, <strong>2012</strong> and 2011 were asfollows:Description <strong>2012</strong> 2011Facilities leases $ 1,553 $ 1,364Automobile equipment leases 20 2Machinery leases 68 413Total $ 1,641 $ 1,779Future minimum noncancelable lease payments on existing operating leases at September 30,<strong>2012</strong>, which have an initial term of one year or more, are as follows.Future Minimum Lease Payments2013 $ 1,0182014 1,0852015 1,0812016 1,1132017 1,170Thereafter 1,051Total $ 6,51874
DISTRICT OF COLUMBIA WATER AND SEWER AUTHORITYNotes to the <strong>Financial</strong> StatementsSeptember 30, <strong>2012</strong> and 2011(In $ thousands)(13) Related Party and Similar TransactionsThe enabling legislation, described in Note 1, established that the District would pay for water andwastewater services. The Authority recorded revenues of $18,213 and $17,827 from the Districtgovernment and $6,500 and $7,296 from the District of Columbia Housing Authority (“<strong>DC</strong>HA”) for fiscalyears <strong>2012</strong> and 2011, respectively. Both the District government and <strong>DC</strong>HA revenues are included inwater and wastewater user charges in the accompanying statements of revenues, expenses andchanges in net assets.The Authority recorded an expense of $16,882 for payments-in-lieu-of-taxes to the District for servicessuch as road repairs, fire protection, police protection, and other services for each of the years endedSeptember 30, <strong>2012</strong> and 2011. The Authority also recorded an expense of $5,100 for the District’sright-of-way fee, charged to all area utilities for infrastructure occupancy in public streets, for each of theyears ended September 30, <strong>2012</strong> and 2011.The amounts due from / (to) the District government as of September 30, <strong>2012</strong> and 2011 were $1,491and ($1,980), respectively. The amount due from the District at September 30, <strong>2012</strong> includesapproximately $2,800 billings to the District’s Department of Transportation (DDOT) for job inspectionsand approximately $1,190 in payables to DDOT for construction of <strong>DC</strong> <strong>Water</strong> infrastructure projects.The District of Columbia Council created the Storm <strong>Water</strong> Compliance Amendment Act of 2000 whichestablished the Authority as the Storm <strong>Water</strong> Administrator and a fund was established. Theadministration of the fund was transferred to the District Department of the Environment (“DDOE”) in2007. The Authority continues to bill and collect storm water fees as a separate item and transfers thefunds to the DDOE quarterly. The Authority incurred $757 and $821 of reimbursable expenses for yearsended September 30, <strong>2012</strong> and 2011, respectively.Additionally, the Authority had a net payable of $473 and $417 to the Storm <strong>Water</strong> Fund for yearsended September 30, <strong>2012</strong> and 2011, respectively. These amounts are netted to arrive at the amountsdue from (to) the District government on the Statements of Net Assets.(14) Employee Benefits(a)Defined Benefit PlansEmployees hired prior to October 1, 1987 participate in certain federal benefit plans administeredby the federal government’s Office of Personnel Management (“OPM”). The plans are costsharing multi-employer plans, which provide retirement and disability benefits, annual cost-oflivingadjustments, and death benefits to plan participants and beneficiaries. In fiscal year <strong>2012</strong>,there were 208 <strong>DC</strong> <strong>Water</strong> employees covered by these plans. The OPM issues a publicallyavailable financial report that includes financial statements and required supplementaryinformation, which may be obtained at www.opm.gov.75
DISTRICT OF COLUMBIA WATER AND SEWER AUTHORITYNotes to the <strong>Financial</strong> StatementsSeptember 30, <strong>2012</strong> and 2011(In $ thousands)(14) Employee Benefits (Continued)Employees and the Authority each contribute a percentage of the employees’ salaries to theFederal government, which administers the plans. During fiscal years <strong>2012</strong>, 2011 and 2010, theAuthority’s contributions to the plans were $1,061, $1,116 and $1,169, respectively. Theseamounts were 100 percent of the required contributions under the plans for each of the fiscalyears presented.The required percentage of salaries to be contributed by the employees was 7.00 percent foreach of the three fiscal years ended <strong>2012</strong>. The required percentage of salaries to be contributedby the Authority was also 7.0 percent for each of the three fiscal years ended <strong>2012</strong>.(b)Defined Contribution PlansDefined Contribution Plan - Employees who were hired after September 30, 1987, participate inthe U.S. Social Security system and a defined contribution plan sponsored by the Authority. TheDistrict of Columbia <strong>Water</strong> and Sewer Authority Defined Contribution Plan is a qualified trustunder Internal Revenue Code Section 401(a). During fiscal years <strong>2012</strong>, 2011 and 2010, theAuthority’s contribution was seven percent of base pay up to the social security wage base, plus5% of base pay in excess of the social security wage base for each eligible employee. Employeesdo not contribute to the plan. Employees become 100 percent vested in their account balanceafter three years of service.457(b) Plan - Starting in January 2000, employees who were hired after September 30, 1987,participate in the U.S. Social Security system and a 457(b) Deferred Compensation plansponsored by the Authority. The District of Columbia <strong>Water</strong> and Sewer Defined Contribution Planis a qualified trust under Internal Revenue Code Section 401.The Authority makes a matching contribution of 100 percent of the amount that the employeedefers to the 457(b) Deferred Compensation Plan; up to a maximum contribution of five percentof base pay for eligible employees.There is no waiting period before an employee can elect to become a participant of this plan andemployees are always 100 percent vested in their contributions. The Authority’s matchingcontribution is vested after three years of service.During fiscal years <strong>2012</strong>, 2011 and 2010, the Authority’s contributions to both defined contributionplans were $5,453, $5,225 and $4,182, respectively.(c)Post-Employment Insurance PlansThe Authority does not provide post employment health and life insurance benefits to any post-1987 employees. The federal government provides healthcare and life insurance benefits tocertain retired employees under the Federal Employees’ Health Benefits Program and theFederal Employee’s Group Life Insurance Program at no cost to the Authority.76
DISTRICT OF COLUMBIA WATER AND SEWER AUTHORITYNotes to the <strong>Financial</strong> StatementsSeptember 30, <strong>2012</strong> and 2011(In $ thousands)(14) Employee Benefits (Continued)(d)Retirement Health Savings PlanIn fiscal year 2007 the Authority implemented a Retirement Health Savings Plan for post-1987non-union employees. The Plan allows eligible employees to receive a benefit for their unusedsick leave upon separation of service. Funds are transferred to a third party to pay for postemploymentmedical expenses at the termination of employment.(15) Subsequent EventsIn July 2013, the Authority issued $300,000 of subordinated lien public utility revenue bonds withinterest rates ranging from 4.75% to 5.0%, maturing in 2049 to fund the Authority’s capital improvementprogram. Gross proceeds from the Series 2013A bonds totaled $298,921, including $1,014 of originalissue premium and $2,093 of underwriter’s discount and cost of issuance.77
78this page intentionally left blank
79 |StatisticalSection
This section contains statistical tables that reflect financial trends information, revenuecapacity information, debt capacity information, demographic and economic information,and operating information. These tables differ from the financial statements because theyusually cover more than two fiscal years and may present non accounting data.The statistical section is divided into five sections as follows:• <strong>Financial</strong> Trends• Revenue Capacity• Debt Capacity• Demographic and Economic Information• Operating Information80 |
1. <strong>Financial</strong> TrendsThese schedules contain trend information to better understand how the Authority’sfinancial performance and well-being have changed over time.81 |
EXHIBIT 1:SUMMARY OF NET ASSETSFY 2003 - <strong>2012</strong>($000)2003 2004 2005 2006 2007 2008 2009 2010 2011 <strong>2012</strong>Invested in utility plant, net ofrelated debt $ 584,639 $ 655,546 $ 718,899 $ 748,181 $ 775,964 $ 741,588 $ 782,316 $ 833,717 $ 891,786 $ 975,933Restricted - - 307 1,323 6,267 8,297 10,244 17,257 26,825 27,297Unrestricted 219,138 176,350 159,379 180,160 189,490 259,564 214,819 164,404 141,538 142,259Total net assets $ 803,777 $ 831,896 $ 878,585 $ 929,664 $ 971,721 $ 1,009,449 $ 1,007,379 $ 1,015,378 $ 1,060,149 $ 1,145,489Source: FY 2003 - <strong>2012</strong> Statements of Net Asset.82 |
EXHIBIT 2:CHANGE IN NET ASSETSFY 2003 - <strong>2012</strong>($000)Operating revenues2003 2004 2005 2006 2007 2008 2009 2010 2011 <strong>2012</strong>Residential, commercial and multi-family customers $ 147,870 $ 159,165 $ 166,045 $ 174,159 $ 182,327 $ 183,553 $ 191,543 $ 209,796 $ 241,475 $ 256,846Federal government 26,884 26,444 24,770 31,100 30,751 35,888 35,195 37,845 43,033 48,381District government and <strong>DC</strong> Housing Authority 16,072 15,464 15,436 16,463 17,266 16,193 16,804 21,947 25,123 24,713Charges for w holesale w astew ater treatment 61,682 60,834 62,126 67,966 73,378 82,854 85,519 87,505 90,414 94,549Other 3,287 2,427 4,366 3,845 2,735 3,846 3,337 6,655 8,210 16,077Total Operating Revenues 255,795 264,334 272,743 293,533 306,457 322,334 332,398 363,748 408,255 440,566Operating expensesPersonnel services 64,091 62,449 64,038 66,942 70,956 75,838 82,248 88,210 93,240 97,784Contractual services 63,065 65,446 57,835 54,188 56,568 58,730 64,513 69,497 71,055 64,939Chemicals, supplies and small equipment 14,768 17,384 22,062 23,482 24,510 28,816 29,074 29,003 28,188 28,815Utilities and rent 20,804 22,217 25,562 31,151 32,238 37,843 32,813 29,929 29,429 26,786Depreciation and amortization 39,524 40,500 41,069 44,149 49,355 54,418 59,291 64,425 70,209 74,342<strong>Water</strong> purchases 13,723 20,692 19,625 22,745 24,042 25,746 25,371 27,587 27,170 28,389Payment in lieu of taxes and right of w ay fee 15,513 15,778 16,307 16,923 17,514 17,525 19,183 20,474 21,982 21,982Total operating expenses 231,488 244,466 246,498 259,580 275,183 298,916 312,493 329,125 341,273 343,037Operating income 24,307 19,868 26,245 33,953 31,274 23,418 19,905 34,623 66,982 97,529Non-operating revenue (expenses)Interest income 2,894 2,856 11,281 13,080 16,224 11,444 1,704 1,343 2,036 749Interest expense and fiscal charges (17,816) (26,060) (25,415) (20,881) (30,524) (39,342) (51,431) (58,370) (71,621) (71,895)Total non-operating revenue (expenses) (14,922) (23,204) (14,134) (7,801) (14,300) (27,898) (49,727) (57,027) (69,585) (71,146)Change in net assets before Federal grantsand contributions 9,385 (3,336) 12,111 26,152 16,974 (4,480) (29,822) (22,404) (2,603) 26,383Contributions of capital from Federal government 39,626 31,455 34,578 24,927 25,083 42,208 27,752 30,403 47,374 58,957Change in net assets 49,011 28,119 46,689 51,079 42,057 37,728 (2,070) 7,999 44,771 85,340Net assets, beginning of year 754,766 803,777 831,896 878,585 929,664 971,721 1,009,449 1,007,379 1,015,378 1,060,149Net assets, end of year $ 803,777 $ 831,896 $ 878,585 $ 929,664 $ 971,721 $ 1,009,449 $ 1,007,379 $ 1,015,378 $ 1,060,149 $ 1,145,489Source: FY 2003 - <strong>2012</strong> Statements of Revenues, Expenses and Changes in Net Assets.83 |
EXHIBIT 3:CHANGE IN NET ASSETSFY 2003 - <strong>2012</strong>($000)$90,000$85,340$80,000$70,000$60,000$50,000$49,011$46,689$51,079$42,057$44,771$37,728$40,000$30,000$28,119$20,000$10,000$0($2,070)$7,999-$10,000FY 2003 FY 2004 FY 2005 FY 2006 FY 2007 FY 2008 FY 2009 FY 2010 FY 2011 FY <strong>2012</strong>Source:FY 2003 – <strong>2012</strong> Audited Statements of Revenue, Expenses and Changes in Net Assets.84 |
EXHIBIT 4:CAPITAL DISBURSEMENTSFY 2003 - <strong>2012</strong>($000)$500,000$472,377$450,000$400,000$350,000$300,000$250,000$205,469$244,442$304,754$256,652$270,526$302,536$206,721 $199,909$176,687$200,000$150,000$100,000$50,000$0FY 2003 FY 2004 FY 2005 FY 2006 FY 2007 FY 2008 FY 2009 FY 2010 FY 2011 FY <strong>2012</strong>Note:Source:These disbursements include <strong>DC</strong> <strong>Water</strong>’s share of Washington Aqueduct’s capital disbursements.FY 2003 – <strong>2012</strong> Audited Statements of Cash Flows.85 |
86 |this page intentionally left blank
2. Revenue CapacityThese schedules contain information regarding the Authority’s most significant revenuesources.87 |
EXHIBIT 5:SUMMARY OF REVENUES AND RATE INCREASESFY 2003 - <strong>2012</strong>($000)FY 2003 FY 2004 FY 2005 FY 2006 FY 2007 FY 2008 FY 2009 FY 2010 FY 2011 FY <strong>2012</strong>Operating Revenues:Retail CustomersResidential, Commercial and Multifamily $ 147,870 $ 159,165 $ 166,045 $ 174,159 $ 182,327 $ 183,553 $ 191,543 $ 209,796 $ 241,475 $ 256,846Federal Government 26,884 26,444 24,770 31,100 30,751 35,888 35,195 37,845 43,033 48,381<strong>DC</strong> Government 9,943 9,129 8,968 9,617 10,580 9,391 10,116 15,628 17,827 18,213<strong>DC</strong> Housing Authority 6,129 6,335 6,468 6,846 6,686 6,802 6,688 6,319 7,296 6,500Other Revenues 3,287 2,427 4,366 3,845 2,735 3,846 3,337 6,655 8,210 16,077Total Retail Customers 194,113 203,500 210,617 225,567 233,079 239,480 246,879 276,243 317,841 346,017Wholesale CustomersCharges for Wholesale Wastewater Treatment 61,682 60,834 62,126 67,966 73,378 82,854 85,519 87,505 90,414 94,549Total Operating Revenues 255,795 264,334 272,743 293,533 306,457 322,334 332,398 363,748 408,255 440,566Nonoperating Revenues:Interest Income 2,894 2,856 11,281 13,080 16,224 11,444 2,285 1,342 2,036 749Total Operating and Nonoperating Revenues: $ 258,689 $ 267,190 $ 284,024 $ 306,613 $ 322,681 $ 333,778 $ 334,683 $ 365,090 $ 410,291 $ 441,315Retail Rate Increases -5.25% 2.50% 5.00% 5.50% 5.00% 5.50% 7.50% 9.00% 12.50% 4.50%Source: FY 2003 - <strong>2012</strong> Audited Statements of Revenue, Expenses and Changes in Net Assets88 |
EXHIBIT 6:NUMBER AND TYPE OF CUSTOMER ACCOUNTSFY 2003 – <strong>2012</strong>TYPE OF ACCOUNTS FY 2003 FY 2004 FY 2005 FY 2006 FY 2007 FY 2008 FY 2009 FY 2010 FY 2011 FY <strong>2012</strong>Retail AccountsResidential 101,783 102,188 102,418 102,655 103,263 103,674 103,665 103,315 103,857 103,887Commercial (A) 18,111 18,283 18,337 18,489 18,513 18,528 19,060 19,049 19,165 19,242GovernmentalFederal 538 529 526 526 531 533 540 546 549 538District of Columbia 565 569 565 582 589 590 606 603 607 605<strong>DC</strong> Housing Authority 1,469 1,196 1,179 1,173 1,175 1,218 1,220 1,431 1,431 1,435Total Retail Accounts 122,466 122,765 123,025 123,425 124,071 124,543 125,091 124,944 125,609 125,707<strong>DC</strong> <strong>Water</strong> 29 29 29 29 30 30 30 35 35 36Washington Aqueduct 1 1 1 1 2 2 1 2 2Wholesale 7 7 7 7 7 7 7 7 7 7Total Number of Accounts 122,502 122,802 123,062 123,462 124,109 124,582 125,130 124,987 125,653 125,752(A)Included in commercial accounts are exempt accountsSource: D.C. <strong>Water</strong> Department of Customer Service89 |
EXHIBIT 7:FIVE LARGEST COMMERCIAL CUSTOMER ACCOUNTS BY REVENUESFY 2003 - <strong>2012</strong>CUSTOMER FY 2003 FY 2004 FY 2005 FY 2006 FY 2007 FY 2008 FY 2009 FY 2010 FY 2011 FY <strong>2012</strong>Howard University $ 1,788,134 $ 1,744,217 $ 1,612,565 $ 1,584,501 $ 1,751,425 $ 1,706,124 $ 1,640,815 $ 1,735,598 $ 1,862,880 $ 2,596,564George Washington University 1,036,396 1,382,116 1,601,369 1,519,286 1,570,881 2,020,849 1,777,659 1,618,618 2,122,176 2,530,632Georgetown University - 1,373,516 971,014 723,604 1,068,115 2,055,644 2,135,768 2,100,705 2,238,766 1,842,860William C Smith & Co - - - - - - - 1,505,145 1,709,334 1,787,150Georgetown University Hospital 770,637 583,335 - - 821,239 - - - 1,371,035 1,643,380Washington Hospital Center 530,154 741,166 800,082 782,404 - - - 1,113,672 - -American University - - 738,628 - - 948,708 1,524,262 - - -Marriott Wordman Park Hotel - - - - - - 1,037,663 - - -Children's Hospital - - - - - 841,774 - - - -Washington Hilton Hotel - - - 716,612 753,277 - - - - -Soldiers' Home 649,981 - - - - - - - - -Source: <strong>DC</strong> <strong>Water</strong> Department of Customer Service90 |
EXHIBIT 8:TEN LARGEST COMMERCIAL CUSTOMER ACCOUNTS BY REVENUESFY <strong>2012</strong>$3,000,000$2,596,564$2,530,632$2,500,000$2,000,000$1,842,860$1,787,150$1,643,380$1,500,000$1,163,586$1,000,000$937,430 $933,027$869,211 $839,884$500,000$-HowardUniversityGeorgeWashingtonUniversityGeorgetownUniversityWilliam CSmith & CoGeorgetownUniversityHospitalHorningBrothersAmtrakWashingtonHospitalCenterAmericanUniversityThe BaracCompanySource: <strong>DC</strong> <strong>Water</strong> Department of Customer Service91 |
EXHIBIT 9:FIVE LARGEST GOVERNMENT CUSTOMER ACCOUNTS BY REVENUESFY 2003 – <strong>2012</strong>CUSTOMER FY 2003 FY 2004 FY 2005 FY 2006 FY 2007 FY 2008 FY 2009 FY 2010 FY 2011 FY <strong>2012</strong>U.S. General Services Administration $ 7,595,917 $ 8,577,887 $ 8,092,600 $ 7,916,072 $ 7,324,115 $ 8,199,985 $ 6,773,195 $ 6,575,977 $ 6,877,787 $ 7,443,691D.C. Housing Authority 6,292,037 5,871,752 6,036,527 6,514,112 6,122,875 6,339,434 6,266,786 5,750,927 6,277,722 5,669,475U.S. Congress 2,592,498 3,014,968 2,655,930 3,320,538 - 4,096,695 4,028,564 3,559,903 4,214,640 5,225,952Department Defense VA - - - - - - - 2,759,264 - 3,527,613Bolling Air Force Base - - - - - - - - - 2,925,847Smithsonian Institution - 2,518,991 - 3,443,695 3,196,837 4,325,576 3,605,478 - 3,997,326 -Department of the Navy - - - - - - 3,504,547 2,851,611 3,832,568 -Department of Defense <strong>DC</strong> - - 2,184,982 - 3,907,312 3,292,402 - - - -D.C. Board of Education 2,453,574 2,728,892 2,669,214 2,934,220 3,344,959 - - - - -D.C. Department of Human Services 2,456,904 - - - - - - - - -Source: <strong>DC</strong> <strong>Water</strong> Department of Customer Service92 |
EXHIBIT 10: TEN LARGEST GOVERNMENT CUSTOMER ACCOUNTS BY REVENUESFY <strong>2012</strong>$8,000,000$7,443,691$7,000,000$6,000,000$5,669,475$5,225,952$5,000,000$4,000,000$3,527,613$2,925,847$3,000,000$2,834,355 $2,681,705$2,481,144$2,213,636$2,000,000$1,886,750$1,000,000$0U.S. GeneralServicesAdministrationD.C. HousingAuthorityU.S. Congress Department ofDefense VABolling AirForce BaseD.C.Department ofHumanServicesSmithsonianInstitutionNational ParkServiceD.C. Board ofEducationDepartment ofthe NavySource: <strong>DC</strong> <strong>Water</strong> Department of Customer Service93 |
EXHIBIT 11:HISTORY OF RETAIL WATER AND SEWER RATES (PER Ccf)FY 1980 – <strong>2012</strong>DISTRICTIMPERVIOUSPUBLIC SPACE WATER SEWER COMBINED SURFACE AVERAGEFISCAL METERING OCCUPANCY CONSUMPTION CONSUMPTION CONSUMPTION AREA MONTHLYYEARS FEE FEE AND PILOT RATE RATE RATE CHARGE 3 BILL 21980-1983 $ - $ - $ 0.460 $ 0.677 $ 1.137 $ - $ 7.6071984 - - 0.537 0.998 1.535 - 10.2691985 - - 0.698 1.297 1.995 - 13.3471986 - - 0.873 1.621 2.494 - 16.6851987-1996 - - 1.004 1.864 2.868 - 19.1871997 - - 1.380 2.710 4.090 - 27.3621998 - - 1.380 2.710 4.090 - 27.3621999 - - 1.380 2.710 4.090 - 27.3622000 - - 1.576 2.710 4.286 - 28.6732001-2002 - - 1.786 2.710 4.496 - 30.0782003 (1) 2.010 0.360 1.690 2.570 4.260 - 32.9182004 2.010 0.360 1.740 2.630 4.370 - 33.6542005 2.010 0.360 1.830 2.760 4.590 - 35.1262006 2.010 0.420 1.930 2.910 4.840 - 37.1992007 2.010 0.440 2.030 3.060 5.090 - 39.0062008 2.010 0.470 2.140 3.230 5.370 - 41.0802009 2.010 0.520 2.300 3.310 5.610 1.240 44.2602010 2.010 0.570 2.510 3.610 6.120 2.200 48.9662011 3.860 0.630 3.100 3.790 6.890 3.450 57.619<strong>2012</strong> 3.860 0.640 3.240 3.960 7.200 6.640 62.9501 All rates are for one hundred cubic feet (1 Ccf) consumption w ith the exception of the flat metering fee, w hich becameeffective on October 1, 2002.2Average residential customer consumption is 6.69 Ccf per month.3Per Equivalent Residential Unit (ERU).94 |
EXHIBIT 12: RESIDENTIAL WATER AND WASTEWATER BILL COMPARISONSAS A PERCENTAGE OF MEDIAN HOUSEHOLD INCOME (1)3.50%3.00%2.50%2.00%1.50%1.45%1.00%0.50%0.00%(1) This analysis is based on a single family residential monthly bill as a percentage of median household income for large nationalutilities based on rates in effect fall <strong>2012</strong>.Source: <strong>DC</strong> <strong>Water</strong> Department of Finance & Budget95 |
EXHIBIT 13: RESIDENTIAL WATER AND WASTEWATER BILL COMPARISONSTO LOCAL AND REGIONAL UTILITIES (1)$100$90$80$70$67.49$60$50$40$30$20$10$-(1) This analysis represents single family residential average monthly bill based on rates in effect fall 2011.Source: <strong>DC</strong> <strong>Water</strong> Department of Finance & Budget96 |
3. Debt CapacityThese schedules present information showing the Authority’s current levels of outstandingdebt and the Authority’s ability to issue additional debt in the future.97 |
EXHIBIT 14: TOTAL OUTSTANDING DEBTFY 2003 - <strong>2012</strong>($000, EXCEPT PER CAPITA)Senior DebtFY 2003 FY 2004 FY 2005 FY 2006 FY 2007 FY 2008 FY 2009 FY 2010 FY 2011 FY <strong>2012</strong>1998 Public Utility Revenue Bonds $ 266,120 $ 266,120 $ 266,120 $ 266,120 $ 266,120 $ 257,645 $ 248,705 $ 239,270 $ 229,315 $ 218,8152009 Series A Public Utility Revenue Bonds - - - - - - 300,000 300,000 298,225 296,205Notes Payable to the FederalGovernment for Washington Aqueduct 1,173 - - - - - - - - -Total Senior Debt 267,293 266,120 266,120 266,120 266,120 257,645 548,705 539,270 527,540 515,020Subordinate Debt<strong>2012</strong> Series A Public Utility Revenue Bonds - - - - - - - - - 177,430<strong>2012</strong> Series B-1 Public Utility Revenue Bonds - - - - - - - - - 52,690<strong>2012</strong> Series B-2 Public Utility Revenue Bonds - - - - - - - - - 47,310<strong>2012</strong> Series C Public Utility Revenue Bonds - - - - - - - - - 163,2152010 Series A Public Utility Revenue Bonds - - - - - - - - 300,000 300,0002008 Series A Public Utility Revenue Bonds - - - - - 290,375 290,375 290,000 285,540 279,9552007 Series A Public Utility Revenue Bonds - - - - 218,715 218,715 218,715 218,715 218,715 218,7152007 Series B Public Utility Revenue Bonds - - - - 59,000 - - - - -2004 Public Utility Revenue Bonds - 295,000 295,000 295,000 295,000 - - - - -2003 Public Utility Revenue Bonds 176,220 176,220 176,220 176,220 176,220 176,220 176,220 176,220 176,220 -Notes Payable to the FederalGovernment for Bloomington Dam 16,895 16,640 16,376 16,104 15,823 15,532 15,232 14,922 14,603 14,273<strong>DC</strong> General Obligation Bonds 65,645 51,215 35,385 22,299 15,060 9,905 5,180 1,490 245 -Notes Payable to WSSC for Little Seneca 360 357 317 285 251 216 179 142 104 63Total Subordinate Debt 259,120 539,432 523,298 509,908 780,069 710,963 705,901 701,489 995,427 1,253,651Total Debt $ 526,413 $ 805,552 $ 789,418 $ 776,028 $ 1,046,189 $ 968,608 $ 1,254,606 $ 1,240,759 $ 1,522,967 $ 1,768,671Debt per capita $ 926 $ 1,419 $ 1,392 $ 1,360 $ 1,821 $ 1,669 $ 2,118 $ 2,051 $ 2,464 N/AN/A: Population not availableSource: D.C. <strong>Water</strong> Department of Finance & Budget98 |
EXHIBIT 15: DEBT SERVICE COVERAGE AND DEBT RATIOSFY 2003 - <strong>2012</strong>FY 2003 FY 2004 FY 2005 FY 2006 FY 2007 FY 2008 FY 2009 FY 2010 FY 2011 FY <strong>2012</strong>Debt Service Coverage:Senior debt service coverage 5.07 4.60 5.62 6.24 3.43 4.68 2.97 2.75 3.21 3.60Subordinate debt service coverage 2.76 1.78 2.11 2.72 2.07 1.86 1.61 1.71 1.82 1.90Combined debt service coverage 2.05 1.52 1.76 2.13 1.58 1.57 1.34 1.36 1.45 1.52Debt service as percentage of totaloperating expenditures 27.0% 29.0% 33.0% 35.0% 36.0% 21.0% 22.9% 24.4% 26.9% 28.5%Debt service as percentage offixed assets 34.1% 46.2% 41.2% 37.6% 47.7% 43.0% 48.8% 44.7% 49.9% 51.1%Source: D.C. <strong>Water</strong> Department of Finance & Budget99 |
EXHIBIT 16: CALCULATION OF DEBT SERVICE COVERAGEFY <strong>2012</strong> ($000)Prepared in accordance with the Authority’s Master Trust Indenture, which corresponds closely tocash basis accounting.ANALYSIS OF CASH FLOWS AND RESERVE REQUIREMENTSRetail revenues 295,247Wholesale revenues 75,240Other non-operating revenues 47,136(Contributions to) / Transfers from Rate Stabilization Fund (11,250)TOTAL REVENUES 406,373OPERATING EXPENSES 248,622REVENUES LESS OPERATING EXPENSES 157,751SENIOR DEBT SERVICE 41,918SUBORDINATE DEBT SERVICE 57,354TOTAL DEBT SERVICE 99,272PAYMENT IN LIEU OF TAXES / RIGHT OF WAY FEE 17,514ANNUAL BALANCE FROM OPERATIONS 40,965BEGINNING CASH RESERVE BALANCE 150,035CASH RESERVE BALANCE BREAKDOWNBeginning Undesignated Reserve Balance 73,522Additions to / (Payments from) Undesignated Reserve<strong>Annual</strong> balance from operations 40,965Prior year federal billing reconciliation (1,000)(Refund to) / Payment from wholesale customers (5,661)Pay-as-you-go capital financing (39,621)Customer Rebate (4,468)(Additions to) / Transfers from 60-Day Operating Reserve 395Ending Undesignated Reserve Balance 64,132Beginning 60-Day Operating Reserve Balance 41,514Additions to / (Transfers from) 60-Day Operating Reserve (395)Ending 60-Day Operating Reserve Balance 41,119Beginning Renewal & Replacement Reserve Balance 35,000Additions to / (Transfers from) Renewal & Replacement Reserve -Ending Renewal & Replacement Reserve Balance 35,000ENDING CASH RESERVE BALANCE 140,251Cash Reserve Requirement Based on Board Policy 125,500Beginning Rate Stabilization Fund Balance 16,700Additions to / Transfers from Rate Stabilization Fund 11,250Ending Rate Stabilization Fund Balance 27,950ANALYSIS OF DEBT SERVICE COVERAGECALCULATION OF NET REVENUES AVAILABLE FOR SENIOR DEBT SERVICERevenues Less Operating Expenses 157,751Prior year federal billing reconciliation (1,000)(Refund to) / Payment from wholesale customers (5,661)NET REVENUES AVAILABLE FOR SENIOR DEBT SERVICE 151,091SENIOR DEBT SERVICE COVERAGE 3.60xCALCULATION OF SUBORDINATE DEBT SERVICE COVERAGENet revenues available for senior debt service 151,091Less senior debt service (41,918)NET REVENUES AVAILABLE FOR SUBORDINATE DEBT SERVICE 109,173SUBORDINATE DEBT SERVICE COVERAGE 1.90xCOMBINED DEBT SERVICE COVERAGE 1.52x100 |
4. Demographic and Economic InformationThese schedules offer demographic and economic data to help explain the environmentwithin which the Authority’s financial activities take place.101 |
EXHIBIT 17: POPULATION OF SERVICE AREA JURISDICTIONSFY 2003 - <strong>2012</strong>2003 2004 2005 2006 2007 2008 2009 2010 2011 <strong>2012</strong>District of Columbia 568,502 567,754 567,136 570,681 574,404 580,236 592,228 604,912 617,996 N/AMontgomery County 910,498 914,991 921,531 926,492 931,694 942,748 959,013 975,439 989,794 N/APrince George's County 837,648 845,950 853,271 852,097 849,916 850,167 856,161 865,219 871,233 N/AFairfax County 1,035,184 1,042,687 1,051,190 1,051,240 1,060,356 1,077,509 1,099,347 1,121,054 1,135,992 N/ALoudoun County 220,366 238,299 254,909 267,194 279,704 292,570 303,661 315,305 325,405 N/AN/A: Not AvailableSource: U.S. Department of Commerce, Bureau of Economic Analysis102 |
EXHIBIT 18: PERSONAL INCOME OF SERVICE AREA JURISDICTIONSFY 2003 – <strong>2012</strong>($000)2003 2004 2005 2006 2007 2008 2009 2010 2011 <strong>2012</strong>District of Columbia 27,544,363 29,728,668 31,964,976 34,786,968 37,525,123 41,014,705 40,326,374 43,082,099 45,597,835 N/AMontgomery County 48,650,108 52,238,928 55,846,295 60,372,289 62,643,745 65,845,731 62,962,957 65,904,393 69,050,166 N/APrince George's County 26,644,565 28,115,765 29,434,782 30,306,871 31,753,583 33,026,742 33,156,357 33,888,631 35,036,640 N/AFairfax County 56,954,646 60,930,780 65,598,555 69,554,932 73,256,103 75,302,775 71,954,372 75,161,493 78,392,046 N/ALoudoun County 8,361,268 9,384,197 10,854,613 12,394,528 13,875,373 15,147,096 15,340,608 16,971,112 18,626,729 N/AN/A: Not AvailableSource: U.S. Department of Commerce, Bureau of Economic Analysis103 |
EXHIBIT 19: PER CAPITA PERSONAL INCOME OF SERVICE AREA JURISDICTIONSFY 2003 – <strong>2012</strong>2003 2004 2005 2006 2007 2008 2009 2010 2011 <strong>2012</strong>District of Columbia 48,451 52,362 56,362 60,957 65,329 70,686 68,093 71,220 73,783 N/AMontgomery County 53,432 57,092 60,602 65,162 67,236 69,844 65,654 67,564 69,762 N/APrince George's County 31,809 33,236 34,496 35,567 37,361 38,847 38,727 39,168 40,215 N/AFairfax County 55,019 58,436 62,404 66,165 69,086 69,886 65,452 67,045 69,008 N/ALoudoun County 37,943 39,380 42,582 46,388 49,607 51,773 50,519 53,824 57,242 N/AN/A: Not AvailableSource: U.S. Department of Commerce, Bureau of Economic Analysis104 |
EXHIBIT 20: UNEMPLOYMENT RATESFY 2003 – <strong>2012</strong>2003 2004 2005 2006 2007 2008 2009 2010 2011 <strong>2012</strong>District of Columbia 7.0% 7.5% 6.5% 5.7% 5.5% 6.6% 9.7% 10.1% 10.2% 8.2%Montgomery County 3.3% 3.2% 3.1% 2.8% 2.6% 3.2% 5.6% 5.8% 5.2% 4.7%Prince George's County 4.7% 4.5% 4.5% 4.1% 3.6% 4.4% 7.3% 7.7% 7.0% 6.5%Fairfax County 3.1% 2.7% 2.5% 2.2% 2.2% 2.9% 4.9% 4.9% 4.3% 3.6%Loudoun County 3.2% 2.6% 2.4% 2.1% 2.1% 2.8% 4.8% 4.8% 4.2% 3.7%Source: U.S. Department of Labor, Bureau of Labor Statistics105 |
EXHIBIT 21: EMPLOYMENT BY SECTORDISTRICT OF MONTGOMERY PRINCE GEORGE'S FAIRFAX LOUDOUNCOLUMBIA COUNTY COUNTY COUNTY COUNTYAgriculture, Forestry, Mining, etc. 0.07% 0.27% 0.22% 0.13% 0.86%Construction 1.77% 5.36% 8.02% 4.75% 8.93%Manufacturing 0.18% 2.00% 2.11% 1.01% 2.74%Transportation & Public Utilities 0.96% 1.38% 3.51% 1.58% 6.25%Wholesale & Retail Trade 3.19% 9.88% 13.74% 8.03% 12.78%Finance, Insurance & Real Estate 5.66% 12.09% 7.52% 10.05% 8.77%Services 56.26% 54.46% 41.79% 61.12% 47.39%Government (Federal, State & Local) 29.69% 13.51% 21.22% 12.37% 11.74%Military 2.20% 1.06% 1.86% 0.95% 0.55%TOTAL 100.00% 100.00% 100.00% 100.00% 100.00%Source: U.S. Department of Commerce, Bureau of Economic AnalysisLatest available data is for 2011106 |
5. Operating InformationThese schedules contain information about the Authority’s operations and resources tohelp the reader understand how the Authority’s financial information relates to the activitiesit perform.107 |
EXHIBIT 22: WATER DELIVERED (PUMPED) AND BILLED (SOLD)FY 2003 – <strong>2012</strong>TREATEDFISCAL WATER WATER SOLD/PUMPEDYEAR DELIVERED (MG) BILLED (MG) RATIO2003 45,655 31,335 68.63%2004 46,725 31,634 67.70%2005 45,057 31,179 69.20%2006 41,541 31,717 76.35%2007 41,687 31,581 75.76%2008 40,755 30,603 75.09%2009 39,998 29,344 73.36%2010 38,589 29,004 75.16%2011 37,556 29,040 77.32%<strong>2012</strong> 36,930 27,988 75.79%Source:<strong>DC</strong> <strong>Water</strong> Department of Customer Service108 |
EXHIBIT 23: WATER DEMANDFY 2003 - <strong>2012</strong>FISCALYEARANNUALDELIVERIES TOSYSTEM (MG)AVERAGE DAY(MG)MAXIMUMMONTHAVERAGE(MGD)MAXIMUM DAY(MGD)TOTAL ANNUALWATER SOLD(MG)AVERAGE DAY(MGD)2003 45,655 125.1 141.2 164.9 31,335 85.82004 46,725 128.0 146.5 164.6 31,634 86.72005 45,057 123.4 133.7 149.6 31,179 85.42006 41,541 113.8 137.8 161.6 31,717 86.92007 41,687 114.2 133.7 156.5 31,581 86.52008 40,755 111.7 130.1 150.5 30,603 83.82009 39,998 109.6 123.2 150.4 29,344 80.42010 38,589 105.7 130.5 146.9 29,004 79.52011 37,556 102.9 121.6 143.7 29,040 79.6<strong>2012</strong> 36,930 100.9 125.3 142.9 27,988 76.5Source:<strong>DC</strong> <strong>Water</strong> Department of <strong>Water</strong> Services and Washington Aqueduct109 |
EXHIBIT 24: MISCELLANEOUS STATISTICS ABOUT AUTHORITY OPERATIONSFY 2003 - <strong>2012</strong>Utilities and supplies per day at blue plainsFY 2003 FY 2004 FY 2005 FY 2006 FY 2007 FY 2008 FY 2009 FY 2010 FY 2011 FY <strong>2012</strong>Electric power (kwh) 745,000 745,000 745,000 745,000 745,000 745,000 700,000 700,000 700,000 700,000Natural gas (cf) 20,000 20,000 20,000 20,000 20,000 20,000 20,000 20,000 20,000 20,000Sodium hypochlorite (gallons) 2,500 6,850 6,850 6,850 6,850 6,850 6,850 6,850 6,850 6,850Sodium bisulfite (pounds) 5,600 5,600 5,600 5,600 5,600 5,600 5,600 5,600 5,600 5,600<strong>Water</strong> (gallons) 525,000 525,000 525,000 525,000 525,000 525,000 525,000 525,000 525,000 525,000Lime (tons, pounds) 83,500 72,050 72,050 72,050 72,050 72,050 72,050 72,050 72,050 72,050Sodium hydroxide (pounds) 49,400 26,100 26,100 26,100 26,100 26,100 26,100 26,100 26,100 26,100Methanol (gallons) 15,000 10,000 10,000 10,000 10,000 10,000 10,000 10,000 10,000 10,000Ferric chloride (10% Iron) (gallons) 10,500 12,900 12,900 12,900 12,900 12,900 12,900 12,900 12,900 12,900Wastewater treatment capacityAverage day (mgd) 370 370 370 370 370 370 370 370 370 370Peak 4 hour flow, through complete process (mgd) 740 740 740 740 740 740 740 740 740 740Excess storm flow, primary treatment only (mgd) 336 336 336 336 336 336 336 336 336 336Peak flow (mgd) 1,076 1,076 1,076 1,076 1,076 1,076 1,076 1,076 1,076 1,076Number of <strong>DC</strong> <strong>Water</strong> employees 981 931 923 920 948 961 1,000 1,004 1,032 1,051110 |
EXHIBIT 24: MISCELLANEOUS STATISTICS ABOUT AUTHORITY OPERATIONSFY <strong>2012</strong> (Continued)Wastewater Plant Permit LimitationsParameter Monthly WeeklyBiochemical Oxygen Demand (carbonaceous) 5.0 mg/L (15,429 lbs/day) 7.5 mg/L (23,143 lbs/day)Total Suspended Solids (TSS) 7.0 mg/L (21,600 lbs./day) 10.5 mg/L (32,400 lbs/day)Ammonia NitrogenSummer (5/1 – 10/31) 4.2 mg/L (12,960 lbs/day) 6.1 mg/L (18,823 lbs/day)Winter 1 (11/1 – 2/14) 11.1 mg/L (34,253 lbs/day) 14.8 mg/L (45,670 lbs/day)Winter 2 (2/15 – 4/30) 12.8 mg/L (39,500 lbs/day) 17.0 mg/L (52,460 lbs/day)Total Phosphorus (annual average) 0.18 mg/L (555 lbs/day) 0.35 mg/L (1080 lbs/day)Dissolved OxygenMinimum daily averageNot less thanpHMinimumMaximumTotal Chlorine5.0 mg/L4.0 mg/L6.0 units8.5 unitsNon detectable at any timeFecal Coliform 200/100 ml 400/100 mlChesapeake Bay Voluntary AgreementTotal Nitrogen (<strong>Annual</strong> Average)7.5 mg/LWastewater Plant ProcessesPrimary TreatmentInfluent Pumping Capacity1,300 MGDNumber of bar screens 13Number of aerated grit chambers 16Total volume of aerated grit chambers2.3 MGNumber of primary clarifers 36Average detention time (clarifiers)Average hydraulic loading (clarifiers)Maximum hydraulic loading (clarifiers)2.5 hours1008 gallons/square foot/day2,929 gallons/square foot/day111 |
EXHIBIT 24: MISCELLANEOUS STATISTICS ABOUT AUTHORITY OPERATIONSFY <strong>2012</strong> (Continued)Secondary TreatmentNumber of reactors 6Effluent dissolved oxygen(Post - Aeration)6.8 – 7.2 mg/LTotal reactor volume27.7 MGNumber of clarifiers 24Average reactor detention time1.6 hoursDual purpose sedimentation tanks(in either secondary treatmentor nitrification) 8Average clarifier hydraulic loading763 gal/sq ft/dayTotal Dual Purpose Surface Area197,160 sq ftNumber of centrifugal blowers 6Total blower capacityAverage MLSSAverage SRTAverage SVIEffluent dissolved oxygen280,000 cuft/minute2,200 mg/L1.6 days80-100 ml/g2-3 mg/LFiltration & DisinfectionNumber of filters 40Total filter area83,200 sq ftAverage filtration rate3.4 gal/ minute/sq ftAverage filter run time55 hoursDepth of anthracite media24 inchesEffluent alkalinity 140 mg/L as CaC0 3NIitrification/DenitrificationNumber of reactors 12Total reactor volume55.2 MGAerobic Volume33.1-44.2MGDepth of sand media12 inchesDepth of Gravel Support Layer12 inchesNumber of chlorine contact tanks 4Average contact time42 minutesAnoxic Volume11.0-22.1MGNumber of clarifiers 28Average reactor detention timeAverage clarifier hydraulic loading3.3 hours755-gal/sq ft/dayNumber of centrifugal blowers 5Total blower capacity291,500 cuft/minuteNumber of turbine aerators 120Average MLSS1,800 mg/LAverage reactor pH 7.3Average SRTAverage SVI21 days80 – 110 ml/gEffluent alkalinity 110 mg/L as CaC0 3112 |
EXHIBIT 25: SCHEDULE OF INSURANCEAS OF SEPTEMBER 30, <strong>2012</strong>TYPE OF COVERAGE COMPANY POLICY PERIOD COVERAGE LIMITSBlanket Property andBoiler & MachineryAlliant Public EntityProperty InsuranceProgram (PEPIP)July 1, <strong>2012</strong> – July 1,2013$1,000,000,000 Blanket Buildings andContents – (Specified Locations) andMobile Equipment$100,000,000 Boiler and Machinery$25,000,000 Miscellaneous Locations$100,000,000 Earth Movement$100,000,000 Flood, except$25,000,000 Locations within 100 YearFlood Zone (e.g. Blue Plains)Terrorism: $550,000,000 peroccurrence, $850,000,000 annualaggregate ($100,000,000 of occurrenceand aggregate limit dedicated solely to <strong>DC</strong><strong>Water</strong>)$25,000,000 Transit Per ShipmentDeductibles:$1,000,000 Any Loss, except$10,000 EquipmentFidelity & Crime Insurance Travelers Insurance July 1, <strong>2012</strong> – July 1,2013$5,000,000 - Employee Dishonesty,Forgery, Funds TransferFraud, Money & SecuritiesDeductible:$50,000 Per OccurrenceCommercial General Liability Self-Funded $1,000,000 each occurrenceCommercial Automobile Self-Funded $1,000,000 any one accident100% Physical Damage - self-fundedWorker’s Compensation Self-Funded $1,000,000 each accidentStatutory WC BenefitsExcess Worker’s CompensationInsuranceSafety National July 1, <strong>2012</strong> – July 1,2013Employer’s Liability -$1,000,000 Each Accident;$1,000,000 Disease/ EmployeeUnlimited - WC Benefits;$3,000,000 - Employer’s Liability(Included - Terrorism)Retentions: $1,000,000/accident;$1,000,000 Disease/ Employee.Excess General Liability,Automobile Liability, andEmployers Liability InsuranceAlliant National MunicipalLiability Program (ANML)July 1, <strong>2012</strong> – July 1,2013$25,000,000 in excess of $1,000,000(Included - Terrorism)Excess LiabilityAlliant CatastropheLiability InsuranceProgram (CLIP)July 1, <strong>2012</strong> – July 1,2013$75,000,000 in excess of $25,000,000($25,000,000 - Terrorism sublimit)Public Official LiabilityRSUI Indemnity / HiscoxInsurance CompanyJuly 1, <strong>2012</strong> – July 1,2013$20,000,000 Each Loss / AggregateRetentions:$250,000 per wrongful actFiduciary Liability Travelers Insurance June 1, <strong>2012</strong> – July 1,2013$3,000,000 Each Loss / AggregateDeductible: $10,000 per claim113 |
EXHIBIT 26: SUMMARY OF MAJOR PERMITS AND ADMINISTRATIVE ORDERSFY <strong>2012</strong>WastewaterDescriptionExpirationDateCurrentStatusNational Pollutant Discharge Elimination SystemAuthorizes discharge of treated wastewater from BlueSeptember 30, 2015In CompliancePermit # <strong>DC</strong>0021199Plains into the Potomac River and from the combinedsewer system into Rock Creek, the Anacostia River, andthe Potomac River. Prescribes operating conditions for theplant and sewer system.National Pollutant Discharge Elimination SystemMunicipal Separate Strom Sewer (MS4)Permit # <strong>DC</strong>0000221Permit issued to Government of District of Columbia whichprescribes certain actions to <strong>DC</strong> <strong>Water</strong> including:Responding to sanitary sewer overflows (SSO)<strong>Report</strong>ing SSOs that overflow to MS4 system to publichealth agenciesOctober 7, 2016In ComplianceCleaning catch basins and removing trash fromwaterbodiesMaintaining storm sewer system infrastructureCollection of stormwater fees1995 Consent DecreeRequires certain actions including:N/AIn ComplianceCivil Action No.: 90-1643-JGP andReview procurement practices & maintenance proceduresUndertake Operational Capability ReviewAll items completed; awaitingaction to terminate decree84-2842-JGPConduct a pilot project for biological nitrogen reduction1996 Stipulated Agreement & OrderRequires certain actions including:N/AIn ComplianceCivil Action No.: 96-669-TFHRehabilitate and maintain certain facilities and capitalequipment in good operating conditionMaintain certain records and data for status reports andprepare monthly reports on status of complianceAll items completed; awaitingaction to terminate agreementand orderMaintain user fees in separate accounts and make timelypayment of invoices2003 Consent DecreeRequires certain actions including:N/AIn ComplianceCivil Action No.: 1:00CV00183TFHReplacement/repair of control structuresCleaning/inspection of catch basinsCivil Action No.: 02-2511 (TFH)Rehabilitation of pumping stationsRehabilitation of Blue Plains grit chambers and influentscreensInspection of certain sewers and siphonsPublic education/outreach activitiesPayment of civil penalty of $250,000Conduct/support of supplemental environmental projects2005 Consent Decree for CSS LTCPConsolidate Civil Action No; 1:00CV00183TFHRequires implementing various components of thecombined sewer system (CSS) long term control plan(LTCP)March 18, 2025In Compliance<strong>DC</strong> Department of EnvironmentPermit to construct the enhanced nitrogen removal facility N/A In Compliance<strong>DC</strong> Department of EnvironmentPermit to construct biosolids project – main processtrain/combined heat & power/final dewatering facilityN/AIn Compliance114 |
EXHIBIT 27: BUDGETARY COMPARISON SCHEDULEFOR FISCAL YEAR <strong>2012</strong>Expenses:Approved ActualBudget Expenditure VariancePersonnel services $ 113,354 $ 107,334 $ 6,020Contractual services 78,826 64,939 13,887<strong>Water</strong> purchases 33,000 28,389 4,611Chemicals and supplies 29,946 26,744 3,202Utilities and rent 37,447 26,786 10,661Small equipment 995 1,139 (144)Interest and fiscal charges (debt service) 105,387 99,272 6,115Payment in lieu of tax & right of way fee 23,401 21,982 1,419Total budget expenses $ 422,356 $ 376,585 $ 45,771Increase (decrease) to reconcile budgetary to GAAPPersonnel expense transferred to capital fund (9,550)Depreciation expense 74,342Long-term debt principal payments (18,721)Long-term debt - capitalized interest (15,150)Build america bonds subsidy 5,710Long-term debt - transfers to escrow (361)Inventory issuance 932Non-budgeted expenses 1,145Total GAAP expenses $ 414,932115 |
EXHIBIT 27: BUDGETARY COMPARISON SCHEDULEFOR FISCAL YEAR <strong>2012</strong> (Continued)BUDGETARY ACCOUNTING AND CONTROLBudget LawThe Authority prepares its annual operating budget under the provisions of its enablinglegislation. In accordance with those provisions, the following process is used to adopt theannual budget.• Development of the 10-year financial plan• Development of individual departmental operating budgets, based on the financialframework in the 10-year financial plan• Review and development of proposed budget by the General Manager• Presentation of proposed budget to the Board of Directors• Review and development of proposed budget by the Board of Directors• Adoption of proposed budget by the Board of Directors• Submission of proposed budget to the District of Columbia for inclusion in itsbudget• District of Columbia budget submission to U.S. Congress• Approval of proposed budget by U.S. Congress and PresidentBudget AccountingThe Authority is a single enterprise fund and maintains accounting records using theaccrual basis of accounting, in accordance with generally accepted accounting principles(GAAP) in the United States of America. Under this basis of accounting, revenues arerecorded when earned, and expenses are recorded when goods and services arereceived. The Authority’s expenditure budget is prepared on a comparable basis toGAAP, with the exception of debt service, which is budgeted in full when due, includingprincipal and interest. Depreciation is not budgeted; depreciation is recorded as anexpense for financial statement purposes.Budget RequirementsAfter the U.S. Congress approves the budget, the operating and capital budgets areloaded into the Authority’s financial management system, which prevents overspendingwithout appropriate approvals. The Department of Finance and Budget prepares monthlymanagement reports for each operating unit, management staff, the Board of Directors,and its various committees. The reports are consistently reviewed each month to ensurethe Authority complies with its authorized budget levels.116 |