Annual Reports - Indraprastha Gas Limited
Annual Reports - Indraprastha Gas Limited Annual Reports - Indraprastha Gas Limited
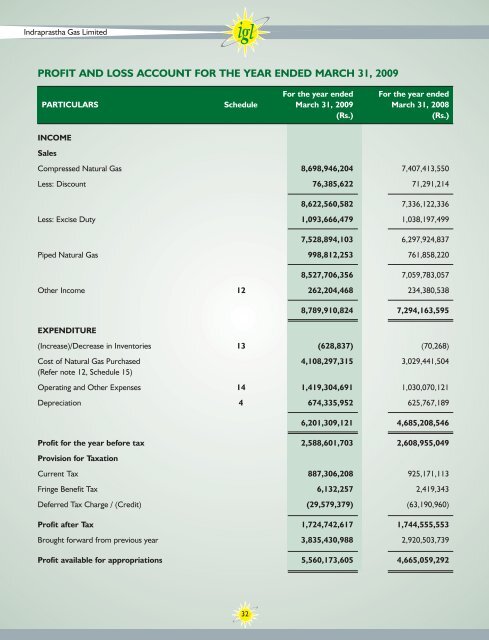
PROFIT AND LOSS ACCOUNT FOR THE YEAR ENDED MARCH 31, 2009 For the year ended For the year ended PARTICULARS Schedule March 31, 2009 March 31, 2008 (Rs.) (Rs.) INCOME Sales Compressed Natural Gas 8,698,946,204 7,407,413,550 Less: Discount 76,385,622 71,291,214 32 8,622,560,582 7,336,122,336 Less: Excise Duty 1,093,666,479 1,038,197,499 7,528,894,103 6,297,924,837 Piped Natural Gas 998,812,253 761,858,220 8,527,706,356 7,059,783,057 Other Income 12 262,204,468 234,380,538 EXPENDITURE 8,789,910,824 7,294,163,595 (Increase)/Decrease in Inventories 13 (628,837) (70,268) Cost of Natural Gas Purchased 4,108,297,315 3,029,441,504 (Refer note 12, Schedule 15) Operating and Other Expenses 14 1,419,304,691 1,030,070,121 Depreciation 4 674,335,952 625,767,189 6,201,309,121 4,685,208,546 Profit for the year before tax 2,588,601,703 2,608,955,049 Provision for Taxation Current Tax 887,306,208 925,171,113 Fringe Benefit Tax 6,132,257 2,419,343 Deferred Tax Charge / (Credit) (29,579,379) (63,190,960) Profit after Tax 1,724,742,617 1,744,555,553 Brought forward from previous year 3,835,430,988 2,920,503,739 Profit available for appropriations 5,560,173,605 4,665,059,292
PROFIT AND LOSS ACCOUNT FOR THE YEAR ENDED MARCH 31, 2009 For the year ended For the year ended PARTICULARS Schedule March 31, 2009 March 31, 2008 (Rs.) (Rs.) APPROPRIATIONS Proposed Dividend 560,000,640 560,000,640 Corporate Dividend Tax on Proposed Dividend 95,172,109 95,172,109 Transferred to General Reserve 172,474,262 174,455,555 Balance carried to the Balance Sheet 4,732,526,594 3,835,430,988 33 5,560,173,605 4,665,059,292 Basic/Diluted Earnings Per Share 12.32 12.46 (Refer to note 2.13 & 7 on Schedule 15) Notes to the Accounts 15 The Schedules referred to above form an integral part of the accounts As per our report of even date attached For Deloitte Haskins & Sells For and on behalf of the Board of Directors Chartered Accountants sd/- sd/- sd/- Jitendra Agarwal Rajesh Vedvyas Manmohan Singh Partner Managing Director Director (Commercial) Membership No.: 87104 Place: Mumbai Place: Mumbai Date: 27 May, 2009 Date: 27 May, 2009 sd/- sd/- S.K. Jain Rajesh Agrawal Company Secretary Chief General Manager (Finance)
- Page 3 and 4: BOARD OF DIRECTORS Shri B.C. Tripat
- Page 5 and 6: Shri Murli Deora, Hon’ble Union M
- Page 7 and 8: Smt Pratibha Devi Singh Patil, Hon
- Page 9 and 10: Companies (Disclosure of Particular
- Page 11 and 12: Dr. U.D. Choubey, Chairman & Managi
- Page 13 and 14: FORM-B EFFORTS MADE IN TECHNOLOGY A
- Page 15 and 16: REPORT ON CORPORATE GOVERNANCE I. C
- Page 17 and 18: CODE OF CONDUCT The Board of Direct
- Page 19 and 20: DETAILS OF SHAREHOLDERS’ COMPLAIN
- Page 21 and 22: AT NATIONAL STOCK EXCHANGE (NSE) MO
- Page 23 and 24: NON-MANDATORY REQUIREMENTS (1) CHAI
- Page 25 and 26: MANAGEMENT DISCUSSION AND ANALYSIS
- Page 27 and 28: Earnings per share Earnings per sha
- Page 29 and 30: ANNEXURE TO THE AUDITORS’ REPORT
- Page 31 and 32: 11. Based on our examination of the
- Page 33: BALANCE SHEET AS AT MARCH 31, 2009
- Page 37 and 38: CASH FLOW STATEMENT FOR THE YEAR EN
- Page 39 and 40: SCHEDULES FORMING PART OF THE ACCOU
- Page 41 and 42: SCHEDULES FORMING PART OF THE ACCOU
- Page 43 and 44: SCHEDULES FORMING PART OF THE ACCOU
- Page 45 and 46: SCHEDULES FORMING PART OF THE ACCOU
- Page 47 and 48: 2.4 Depreciation and amortization (
- Page 49 and 50: 4. Estimated amount of contracts re
- Page 51 and 52: c) Value of imported and indigenous
- Page 53 and 54: D. Balance Sheet Reconciliation 51
PROFIT AND LOSS ACCOUNT FOR THE YEAR ENDED MARCH 31, 2009<br />
For the year ended For the year ended<br />
PARTICULARS Schedule March 31, 2009 March 31, 2008<br />
(Rs.) (Rs.)<br />
INCOME<br />
Sales<br />
Compressed Natural <strong>Gas</strong> 8,698,946,204 7,407,413,550<br />
Less: Discount 76,385,622 71,291,214<br />
32<br />
8,622,560,582 7,336,122,336<br />
Less: Excise Duty 1,093,666,479 1,038,197,499<br />
7,528,894,103 6,297,924,837<br />
Piped Natural <strong>Gas</strong> 998,812,253 761,858,220<br />
8,527,706,356 7,059,783,057<br />
Other Income 12 262,204,468 234,380,538<br />
EXPENDITURE<br />
8,789,910,824 7,294,163,595<br />
(Increase)/Decrease in Inventories 13 (628,837) (70,268)<br />
Cost of Natural <strong>Gas</strong> Purchased 4,108,297,315 3,029,441,504<br />
(Refer note 12, Schedule 15)<br />
Operating and Other Expenses 14 1,419,304,691 1,030,070,121<br />
Depreciation 4 674,335,952 625,767,189<br />
6,201,309,121 4,685,208,546<br />
Profit for the year before tax 2,588,601,703 2,608,955,049<br />
Provision for Taxation<br />
Current Tax 887,306,208 925,171,113<br />
Fringe Benefit Tax 6,132,257 2,419,343<br />
Deferred Tax Charge / (Credit) (29,579,379) (63,190,960)<br />
Profit after Tax 1,724,742,617 1,744,555,553<br />
Brought forward from previous year 3,835,430,988 2,920,503,739<br />
Profit available for appropriations 5,560,173,605 4,665,059,292


