von Biela, V. R., C. E. Zimmerman, and L. L. Moulton. 2011. Long ...
von Biela, V. R., C. E. Zimmerman, and L. L. Moulton. 2011. Long ...
von Biela, V. R., C. E. Zimmerman, and L. L. Moulton. 2011. Long ...
- No tags were found...

Create successful ePaper yourself
Turn your PDF publications into a flip-book with our unique Google optimized e-Paper software.
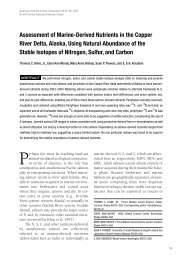
Journal of Fish Biology (2011) 78, 39–56doi:10.1111/j.1095-8649.2010.02832.x, available online at wileyonlinelibrary.com<strong>Long</strong>-term increases in young-of-the-year growth of Arcticcisco Coregonus autumnalis <strong>and</strong> environmental influencesV. R. <strong>von</strong> <strong>Biela</strong>*†, C. E. <strong>Zimmerman</strong>* <strong>and</strong> L. L. <strong>Moulton</strong>‡*U.S. Geological Survey, Alaska Science Center, 4210 University Drive,Anchorage, AK 99508, U.S.A. <strong>and</strong> ‡MJM Research, 1012 Shorel<strong>and</strong> Drive, Lopez Isl<strong>and</strong>,WA 98261, U.S.A.(Received 7 April 2010, Accepted 7 October 2010)Arctic cisco Coregonus autumnalis young-of-year (YOY) growth was used as a proxy toexamine the long-term response of a high-latitude fish population to changing climate from1978 to 2004. YOY growth increased over time (r 2 = 0·29) <strong>and</strong> was correlated with monthlyaverages of the Arctic oscillation index, air temperature, east wind speed, sea-ice concentration<strong>and</strong> river discharge with <strong>and</strong> without time lags. Overall, the most prevalent correlates to YOYgrowth were sea-ice concentration lagged 1 year (significant correlations in 7 months;r 2 = 0·14–0·31) <strong>and</strong> Mackenzie River discharge lagged 2 years (significant correlations in8 months; r 2 = 0·13–0·50). The results suggest that decreased sea-ice concentrations <strong>and</strong> increasedriver discharge fuel primary production <strong>and</strong> that life cycles of prey species linking increasedprimary production to fish growth are responsible for the time lag. Oceanographic studies alsosuggest that sea ice concentration <strong>and</strong> fluvial inputs from the Mackenzie River are key factorsinfluencing productivity in the Beaufort Sea. Future research should assess the possible mechanismrelating sea ice concentration <strong>and</strong> river discharge to productivity at upper trophiclevels.Journal of Fish Biology © 2010 The Fisheries Society of the British IslesNo claim to original US government worksKey words: Beaufort Sea; climate proxy; Colville River; Mackenzie River; otolith; sea ice.INTRODUCTIONClimate change effects on Arctic freshwater <strong>and</strong> nearshore ecosystems are expected toresult in changes to temperature, hydrology, ice regimes, biogeochemical processes,trophic structure <strong>and</strong> food-web interactions, primary <strong>and</strong> secondary productivity <strong>and</strong>the distribution of species (Wrona et al., 2006). How any single species or populationresponds to these changes will probably vary among locations <strong>and</strong> depend on thelife history <strong>and</strong> range of habitats used (Reist et al., 2006a). Diadromous species thatspawn in fresh waters <strong>and</strong> feed in marine waters integrate climate change effectsacross freshwater, estuarine <strong>and</strong> marine habitats <strong>and</strong>, thus, the total effect is expectedto be significant (Reist et al., 2006a).The current underst<strong>and</strong>ing of population-level change in Arctic species has beenhindered by a lack of long-term data <strong>and</strong> a poor underst<strong>and</strong>ing of Arctic ecologyin the spring <strong>and</strong> winter months (Reist et al., 2006a, b; Wrona et al., 2006). Fish†Author to whom correspondence should be addressed. Tel.: +1 907 786 7073; email: v<strong>von</strong>biela@usgs.gov39Journal of Fish Biology © 2010 The Fisheries Society of the British IslesNo claim to original US government works
40 V. R. VON BIELA ET AL.otoliths collected for ageing represent a potential source of long-term annual growthrate data that integrate year-round conditions. Growth rates of individuals have longbeen used across plant <strong>and</strong> animal taxa to monitor population health <strong>and</strong> underst<strong>and</strong>ecosystem change (Sebens, 1987) <strong>and</strong> are typically linked to demographic rates <strong>and</strong>changes in population abundance through increases in survival <strong>and</strong> reproduction oflarger individuals (Reiss, 1989; Roff, 1992). Otoliths collected from Arctic ciscoCoregonus autumnalis (Pallas) captured in the Colville River, Alaska, subsistencefishery from 1986 to 2007 were used to assess change in growth among years <strong>and</strong>environmental correlates of growth. The goal of this study was to test for long-termshifts in first-year growth of C. autumnalis based on otolith growth increments <strong>and</strong>conduct exploratory analyses to infer the potential underlying cause of changes infirst-year growth.In Alaska, C. autumnalis make long-distance movements from spawning to rearinglocations <strong>and</strong> smaller scale annual marine migrations between feeding <strong>and</strong> overwinteringhabitats. Coregonus autumnalis captured in Alaskan waters are the progeny offish that spawn in tributaries of the Mackenzie River, Canada (Craig, 1989; Fechhelm& Griffiths, 1990). Spawning <strong>and</strong> hatching success has not been extensively studiedin Canada, but hatching is thought to coincide with spring freshet <strong>and</strong> river break-upas it does with other coregonids (Næsje et al., 1986, 1995; Urpanen et al., 2005).After hatching, C. autumnalis migrate downstream <strong>and</strong> out of the Mackenzie Deltawhere they are swept west to the Colville Delta by nearshore wind-driven currents, amigration thought to last c. 35 days on average (Gallaway et al., 1983; Fechhelm &Griffiths, 1990; Dillinger et al., 1992; Colonell & Gallaway, 1997). Several studieshave supported the wind-driven migration model that requires average wind speeds of5kmh −1 during the open-water season for a successful recruitment to Alaska, withincreasing speeds resulting in stronger recruitment years (Fechhelm et al., 2007).YOY C. autumnalis are generally thought to migrate in a nearshore b<strong>and</strong> of brackishwater, but have been found in good condition as far as 15 km offshore (Jarvela& Thorsteinson, 1999). Each winter, the Colville River freezes as nearshore seaice forms <strong>and</strong> C. autumnalis enter deep-water river habitats to overwinter. A lackof deep-water habitats in other North Slope drainages, including the SagavanirktokRiver, is thought to limit overwintering habitat to the Colville <strong>and</strong> Mackenzie Rivers(Fechhelm et al., 2007). During summer (mid-June to early September), fish return tothe Beaufort Sea for summer feeding migrations. At age 6 to 9 years, C. autumnalismigrate back to Mackenzie River tributaries to spawn in mid-September to earlyOctober (Gallaway et al., 1983; <strong>Moulton</strong>, 1989). Migration of YOY fish to Alaska isperhaps the most well-understood life-history stage of C. autumnalis. The migrationhas been well studied because juvenile C. autumnalis returning to the Colville Riverin the autumn provide an important subsistence resource for the residents of theAlaskan Arctic Coastal Plain (Fechhelm et al., 2007). Recently, wide variation incatch rates of C. autumnalis has led to concern among subsistence users (Gallawayet al., 1983). Further, traditional knowledge, based on long-term observations, suggeststhat fish condition <strong>and</strong> abundance have decreased <strong>and</strong> subsistence users areconcerned about the productivity of C. autumnalis populations.Changes in climate could alter growth rates <strong>and</strong> fish size. Temperature has beenpositively correlated with growth in C. autumnalis through direct influences onmetabolism (Griffiths et al., 1992). Other environmental variables may indirectlyinfluence growth by altering regional productivity at lower trophic levels. On theJournal of Fish Biology © 2010 The Fisheries Society of the British Isles, Journal of Fish Biology 2011, 78, 39–56No claim to original US government works
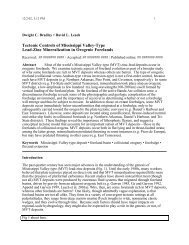
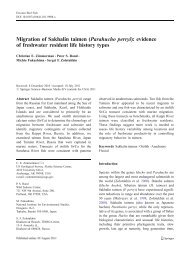
YOUNG-OF-THE-YEAR COREGONUS AUTUMNALIS GROWTH 41basis of the current underst<strong>and</strong>ing of oceanography in the nearshore Beaufort Sea,increased primary productivity is associated with stronger east (upwelling favourable)winds, reduced summer sea-ice concentrations <strong>and</strong> associated increases in light penetration,<strong>and</strong> increased terrestrial carbon inputs associated with the discharge ofthe Mackenzie River (Carmack & Macdonald, 2002; Dunton et al., 2006). Severalauthors have hypothesized that long-term increases in temperature <strong>and</strong> decreases insea ice will lead to a more productive Arctic but caution that species specificallyadapted to Arctic conditions could be negatively influenced (Reist et al., 2006a;Wrona et al., 2006; Pabi et al., 2008). To assess the long-term response of anArctic species to changing climate at an annual scale, a YOY growth chronologyof C. autumnalis captured between 1986 <strong>and</strong> 2007 was constructed. Otolith growthwas used as a proxy for fish growth. YOY growth was expected to be influencedby long-term climatic shifts in several environmental indicators. YOY growth wasselected over growth of other ages because fish typically respond most strongly toenvironmental variability during their early life history (Sogard, 1997). To assess thepossible underlying mechanisms responsible for anticipated changes in YOY growth,exploratory regression analyses were conducted using the Arctic oscillation index,temperature, east wind speed, sea-ice concentration <strong>and</strong> river discharge.MATERIALS AND METHODSOtoliths were collected from C. autumnalis captured in the subsistence gillnet fishery atNuiqsut on the Colville River (Fig. 1). Nets are typically 76 mm (stretched <strong>and</strong> measuredknot to knot) mesh multifilament gillnets <strong>and</strong> range in length from 18 to 30 m (Murphyet al., 2007). At least 30 otoliths per year were collected from fish captured in 17 of the21 years from 1986 to 2007 (otoliths were not collected in 1989, 2002, 2003 <strong>and</strong> 2004). Thetotal number of otoliths available for this study was 819 (Table I) <strong>and</strong> fork length (L F ) wasknown for 408 individuals. Otoliths were removed from fish, cleaned, dried <strong>and</strong> stored invials.Otoliths were embedded in Epothin epoxy (Buehler Ltd; www.buehler.com), sectioned ona transverse plane through the nucleus with a low-speed wafering saw <strong>and</strong> affixed to glassslides with cyanoacrylate glue. After drying, slides were ground using 1200 grit s<strong>and</strong>paper.Digital images of each otolith were captured at a magnification of ×40 on a black backgroundwith reflected light using a digital camera attached to a dissection microscope. Each individualwas assigned an age by counting the translucent zones. Otolith ageing has been indirectlyvalidated through the agreement with L F -frequency analyses of young C. autumnalis (age 0to 2 years; Fechhelm et al., 2007). The first annual increment, representing the growth duringage 0 years <strong>and</strong> referred to here as YOY growth, was measured using image analysis software.Each YOY growth increment was assigned a calendar year by subtracting the age from thecapture year. YOY growth was defined as the distance from the nucleus (which contains theprimordium) to the outer edge of the first translucent zone (appears as the narrow dark areawith reflected light) along the longest possible radius. The otolith radius was measured as thelongest possible distance between the nucleus <strong>and</strong> the ventral edge of the transverse section(Fig. 2).To confirm that otolith growth was correlated with somatic growth, fish of known L F werecompared to otolith radius using a simple linear regression without a defined intercept (Francis,1990). The relationship between otolith radius <strong>and</strong> L F was not used to backcalculate previousL F due to the extra assumptions associated with backcalculation (Francis, 1990). Capture-ageeffects were anticipated on the basis of Lee’s phenomenon (Lee, 1912) <strong>and</strong> corrected forby st<strong>and</strong>ardizing each YOY growth increment to the average width of YOY growth for allindividuals of a given capture age. To determine if this st<strong>and</strong>ardization technique successfullycontrolled for the effect of capture age, the effect of capture age on YOY growth, beforeJournal of Fish Biology © 2010 The Fisheries Society of the British Isles, Journal of Fish Biology 2011, 78, 39–56No claim to original US government works
2000 m1000 m100 m42 V. R. VON BIELA ET AL.NBeaufort SeaNuiqsutColville RiverInuvikNorthwest TerritoriesMackenzie RiverAlaskaYukon TerritoryFort Simpsonkm0 125 250 500 750 1000Fig. 1. MapofCoregonus autumnalis range in northern Alaska, U.S.A., <strong>and</strong> Canada, including the MackenzieRiver, Beaufort Sea <strong>and</strong> the collection location in Nuiqsut, Alaska, along the Colville River.<strong>and</strong> after st<strong>and</strong>ardizing, was tested using a one-way ANOVA. Finally, the st<strong>and</strong>ardized YOYgrowth was tested for autocorrelation using Durbin–Watson’s D. All subsequent analyseswere performed on st<strong>and</strong>ardized YOY growth. Change in YOY growth over time was assessedthrough linear regression (P 100individuals). The cumulative catch rates of a year class across several fishing years was usedas an index of density or the year-class CPUE (<strong>Moulton</strong> & Seavey, 2003).Environmental covariates included monthly Arctic oscillation index (AO) as a broad measureof environmental variation, as well as monthly mean air temperature, east wind speed,sea-ice concentration <strong>and</strong> river discharge as local environmental indicators. All environmentalcovariates were compared to YOY growth with <strong>and</strong> without time lags to test for direct influenceson growth or indirect influence. Lags of up to 2 years were used to account for long generationtimes in many potential prey species (Hirche & Bohrer, 1987; Prokopowicz & Fortier,2002). Months were arranged in water years, 1 October to 30 September, rather than calendaryears to follow the hydrological cycle. The winter AO is a non-seasonal pattern of sea-levelpressure in the Arctic, similar to the North Atlantic Oscillation, which may affect ecosystemsJournal of Fish Biology © 2010 The Fisheries Society of the British Isles, Journal of Fish Biology 2011, 78, 39–56No claim to original US government works
YOUNG-OF-THE-YEAR COREGONUS AUTUMNALIS GROWTH 43Table I. Number of otoliths collected from Coregonus autumnalis harvested in the Nuiqsut,Colville River, AK, U.S.A. subsistence fishery by yearYear YOY growth increments Samples collected1978 51979 261980 531981 51982 71983 151984 121985 571986 63 271987 74 491988 18 291989 271990 77 561991 20 1241992 30 321993 16 321994 39 281995 20 341996 8 261997 21 271998 43 271999 104 302000 30 252001 14 282002 72003 92004 192005 452006 742007 126Total 819 819YOY, young of year.through changes in ocean currents, temperatures, ice cover <strong>and</strong> precipitation (Thompson& Wallace, 1998). Water temperature was not available for this time series in the BeaufortSea, Mackenzie or Colville Rivers, so air temperature recorded at Inuvik, Northwest Territoriesat the mouth of the Mackenzie River was used as a proxy for water temperature (Station2202570, Environment Canada; www.climate.weatheroffice.gc.ca). Mean monthly east windspeed (wind direction 45–135 ◦ ) were calculated based on hourly wind data from Barrow,Alaska (Station 500546, National Climatic Data Center; www7.ncdc.noaa.gov/CDO/cdo).Easterly winds during the open water season (June to October) are favourable for upwelling,drawing deep nutrient water to the shelf <strong>and</strong> stimulating productivity (Carmack & Macdonald,2002). Mean monthly sea-ice concentrations were calculated from estimates of daily sea-iceconcentrations based on a 25 km resolution passive microwave satellite imagery for the BeaufortSea shelf from Amundsen Gulf, Northwest Territories, to Barrow, Alaska, excluding a25 km coastal buffer to avoid spurious ice estimates in pixels with l<strong>and</strong> (Cavalieri et al., 1996,1999). Mean monthly river discharge rate (m 3 s −1 ) was compared to growth. Mackenzie Riverdischarge may influence YOY C. autumnalis directly with little or no time lag (e.g. withinJournal of Fish Biology © 2010 The Fisheries Society of the British Isles, Journal of Fish Biology 2011, 78, 39–56No claim to original US government works
44 V. R. VON BIELA ET AL.Otolith radiusYOY growth250 μmFig. 2. Photomicrograph of transverse section of a Coregonus autumnalis otolith. The axis measure is the linegoing down the longitude of the otolith; young-of-year (YOY) growth <strong>and</strong> otolith radius are indicated ( ).season changes in salinity or water temperature) or indirectly with a time lag based on therelationship between fluvial inputs <strong>and</strong> nearshore productivity in the Arctic (Salen-Picardet al., 2002; Carmack et al., 2006; Dunton et al., 2006; Forest et al., 2008; Holmes et al.,2008). The oceanography of the Beaufort Sea is strongly influenced by the Mackenzie River,even throughout the winter since headwaters extend thous<strong>and</strong>s of kilometres south into thetemperate zone (McNamara et al., 1998; Walker & Hudson, 2003; Holmes et al., 2008). Riverdischarge was measured at Fort Simpson by the Water Survey of Canada (Station 10GC001).The Fort Simpson site was chosen over other Mackenzie River locations for this measurementbecause only one main channel is present at this point.Young-of-year growth was correlated to a given environmental variable using linear regressionweighted by sample size of individuals in each cohort. Given the lack of precisephenological information on the life history of the study species <strong>and</strong> the environment, changesin growth were correlated to an environmental variable in each month of the year. Thisexploratory analysis resulted in multiple independent linear regressions <strong>and</strong> increased thelikelihood of type I error or spurious correlations. Bonferroni corrections were not implementedbecause they can be over-conservative (increase type II error; Cabin & Mitchell,2000). P -values were reported to assess significance <strong>and</strong> results were interpreted based onthe expectation that important environmental variables <strong>and</strong> seasons would be significant inmore than one test (i.e. the same relation would be significant across many months or thesame month would be significant across multiple environmental variables).RESULTSMost individuals were between 310 <strong>and</strong> 350 mm at capture (Fig. 3) <strong>and</strong> 5 to8 years old (Fig. 4). There was a significant positive relation between otolith radius<strong>and</strong> L F for individuals of known length (slope = 3·67; r 2 = 0·84, P
YOUNG-OF-THE-YEAR COREGONUS AUTUMNALIS GROWTH 4512010080Count60402000 100 200L F (mm)300 400 500Fig. 3. The fork length (L F ) frequency distribution of Coregonus autumnalis captured in the Colville River,AK, U.S.A.little evidence of first-order autocorrelation in the time series of YOY growth (autocorrelation=−0·080; Durbin–Watson’s D = 2·066). St<strong>and</strong>ardized YOY growthincreased over time (Fig. 6; linear regression; slope = 0·00540; r 2 = 0·29, P0·05).250200150Count1005000 2 46 8 10Age (years)Fig. 4. The age-frequency distribution of Coregonus autumnalis captured in the Colville River, AK, U.S.A.Journal of Fish Biology © 2010 The Fisheries Society of the British Isles, Journal of Fish Biology 2011, 78, 39–56No claim to original US government works
46 V. R. VON BIELA ET AL.25002000Otolith radius (μm)150010005000 100 200L F (mm)300 400Fig. 5. Linear regression of fork length (L F ) <strong>and</strong> otolith radius for fish of known L F <strong>and</strong> captured in theColville River, AK, U.S.A. (1986–2007). The curve was fitted by: y = 3·666x + 360·400 (r 2 = 0·84).All environmental variables correlated with growth with <strong>and</strong> without time lags(Table II <strong>and</strong> Fig. 8). In general, correlations with growth across all variables weremore prevalent with time lags of 1 <strong>and</strong> 2 years. YOY growth was positively relatedto the AO in March with a lag of 2 years <strong>and</strong> during the current year’s winter.Similarly, the strongest relationship between temperature <strong>and</strong> YOY growth occurred0·2YOY growth st<strong>and</strong>ardized to capture age0·10·0–0·1–0·2–0·3–0·41980 1990Growth year2000 2010Fig. 6. Mean young-of-the-year (YOY) increment size for the entire available growth record (1978–2004)of Coregonus autumnalis captured in the Colville River, AK, U.S.A. The curve was fitted by: y =0·007x − 13·170 (r 2 = 0·29).Journal of Fish Biology © 2010 The Fisheries Society of the British Isles, Journal of Fish Biology 2011, 78, 39–56No claim to original US government works
YOUNG-OF-THE-YEAR COREGONUS AUTUMNALIS GROWTH 47YOY growth0·150·100·050·00–0·05–0·10–0·15–0·20–0·2519751980 1985 1990 1995Year504030201002000 2005 2010Year-class CPUEFig. 7. Graph of mean young-of-the-year growth (YOY growth, ) <strong>and</strong> year-class catch per unit effort (CPUE,) for fish captured in the Colville River subsistence fishery. There was no significant relationship(P >0·05).in March with a 2 year lag, along with other months throughout the previous <strong>and</strong>current years. The speed of east winds in Barrow was positively correlated withgrowth in the open-water months of July <strong>and</strong> August with a lag of 2 years. Growthwas negatively correlated with sea-ice concentration for several spring, summer <strong>and</strong>autumn months with a 1 year lag (April to May <strong>and</strong> July to October). MackenzieRiver discharge correlated positively with growth in eight with a 2 year lag (October<strong>and</strong> December to June). River discharge was also positively correlated to YOYgrowth during April of the current year.DISCUSSIONThe growth of YOY C. autumnalis increased from 1978 to 2004 (Fig. 6). Increasesin YOY growth over time could be due to changes in conditions that increase thedaily rate of growth, cause earlier hatching or both. Because hatching of coregonidsis typically associated with spring ice break-up, an event that has shifted less thana week over the last 100 years with an abrupt transition in the mid-1970s, prior tothe earliest records in this study (Næsje et al., 1986, 1995; Magnuson et al., 2000;Urpanen et al., 2005), the hatch date of Mackenzie River C. autumnalis was assumedto be similar across the YOY growth time series. Increases in growth correlatedstrongly with increased summer east wind speeds lagged by 2 years, decreases insea-ice concentration during the previous year <strong>and</strong> increases in the Mackenzie Riverdischarge with a 2 year lag. The changes in growth rates <strong>and</strong> environmental variablescorrespond to a regime shift in the Pacific Ocean <strong>and</strong> Beaufort Sea in the late 1980s(Hare & Mantua, 2000).Journal of Fish Biology © 2010 The Fisheries Society of the British Isles, Journal of Fish Biology 2011, 78, 39–56No claim to original US government works
48 V. R. VON BIELA ET AL.Table II. The coefficient of determination (r 2 ) <strong>and</strong> P -value for each correlate to young-ofthe-yeargrowth of Coregonus autumnalisEnvironmental covariate Lag Month r 2 PArctic oscillation 2 years March 0·22
YOUNG-OF-THE-YEAR COREGONUS AUTUMNALIS GROWTH 490·6(a)0·40·20·0–0·2–0·4OctAprOctAprOctAprOct0·6(b)0·40·20·0–0·2–0·4Oct Apr Oct AprOctAprOct0·6(c)0·4r 20·20·0–0·2–0·4Oct Apr Oct Apr0·6 (d)OctAprOct0·40·20·0–0·2–0·40·6Oct Apr Oct Apr Oct Apr Oct(e)0·40·20·0–0·2–0·4Oct Apr Oct AprOctAprOctMonthFig. 8. Coefficients of determination (r 2 ) for regression of young-of-the-year (YOY) growth for Coregonusautumnalis captured in the Colville River, AK, U.S.A. <strong>and</strong> monthly averages of: (a) the Arctic oscillation(AO), (b) air temperature, (c) east wind speed, (d) sea-ice concentration <strong>and</strong> (e) Mackenzie Riverdischarge. Broken vertical lines delineate years with the previous two years to the left <strong>and</strong> the currentyear on the right. ∗∗ P
50 V. R. VON BIELA ET AL.All significant AO correlations occurred during the autumn <strong>and</strong> winter months, themonths during which long-term climate signals are strongest in AO (Thompson &Wallace, 1998). In addition, the correlations did not occur in isolation; the laggedcorrelation in March was synchronous with correlations in temperature, east windspeed <strong>and</strong> discharge. Overall, the correlations between the monthly AO <strong>and</strong> YOYgrowth provided evidence that growth could be responding to climatic signals <strong>and</strong>suggest that stronger correlations can be uncovered when growth is compared toregional indicators of the Beaufort Sea.Warmer temperatures were associated with increases in YOY growth, with <strong>and</strong>without time lags [Fig. 8(b)]. Many of the correlations between YOY growth<strong>and</strong> temperature could be spurious, as predictive power <strong>and</strong> P -values were oftenlow <strong>and</strong> months with significant correlations did not group together [Fig. 8(b)]. Thebest supported correlation between temperature <strong>and</strong> YOY growth was in March witha 2 year lag as indicated by high predictive power, low P -value <strong>and</strong> synchronouscorrelations with other predictive variables. Given the strong relationship betweentemperature <strong>and</strong> growth documented in numerous studies (Neilson & Geen, 1985;Rogers & Ruggerone, 1993; LeBreton & Beamish, 2000) <strong>and</strong> previous studies showingthat C. autumnalis preferred <strong>and</strong> grew more rapidly in the upper limits of thenatural summer temperature range (11–16 ◦ C; Fechhelm et al., 1983, 1997; Griffithset al., 1992), stronger unlagged correlations between YOY growth <strong>and</strong> temperaturewere expected. Although Murphy et al. (2007) found strong correlations betweensummer air temperatures <strong>and</strong> sea-surface temperatures, the weak correlations betweenYOY growth <strong>and</strong> temperature could indicate that air temperature is a poor proxyfor water temperature experienced by YOY fish or that other factors influencingproductivity were more limiting to growth.Stronger east winds, reduced sea-ice concentration <strong>and</strong> Mackenzie River dischargewere each strongly related to increases in YOY growth with time lags of 1 or 2 years[Fig. 8(c)–(e)]. These lagged correlations suggest that the processes underlying thecorrelations are biologically mediated through lower trophic levels rather than theresult of more immediate temperature or salinity influences on C. autumnalis physiology.Stronger east winds during July <strong>and</strong> August with a 2 year lag were relatedto increased YOY growth [Fig. 8(c)]. East winds bring deeper nutrient-rich watersonto the Beaufort Sea shelf <strong>and</strong> probably enhance productivity at lower trophic levels(Carmack & Macdonald, 2002). East winds also promote mixing by driving freshwater from the Mackenzie River plume offshore <strong>and</strong> westward (Dunton et al., 2006).Several other correlations were present, but they did not persist <strong>and</strong> some correlationsoccurred in winter when wind cannot influence oceanography due to the presence ofsea ice.Reduced sea-ice concentration in the southern Beaufort Sea over the previousyear (April to May <strong>and</strong> July to October) consistently correlated with increased YOYgrowth [Fig. 8(d)]. Carmack & Macdonald (2002) predicted that reductions in sea iceassociated with climate warming would result in increased phytoplankton productionthrough the availability of nutrients <strong>and</strong> light <strong>and</strong> decreased ice algae production inthe Beaufort Sea. Across the circumpolar Arctic, reduced sea ice has been correlatedwith increased primary production (Arrigo et al., 2008). The negative correlationbetween sea-ice concentrations <strong>and</strong> YOY growth suggests that increased phytoplanktonproduction at the base of the pelagic food web increases prey availability orquality the following year. There is no evidence that reduced ice algae productionJournal of Fish Biology © 2010 The Fisheries Society of the British Isles, Journal of Fish Biology 2011, 78, 39–56No claim to original US government works
YOUNG-OF-THE-YEAR COREGONUS AUTUMNALIS GROWTH 51negatively influences C. autumnalis growth, but reduced ice algae production maybe more important in benthic communities.Mackenzie River discharge was the most consistent <strong>and</strong> predictive explanatoryvariable for YOY growth, with significant relationship in most months when laggedby 2 years [Fig. 8(e)]. The high predictive power <strong>and</strong> consistency of the correlationssuggest a relationship between river discharge <strong>and</strong> YOY growth. River discharge mayinfluence productivity in the Beaufort Sea more than other oceanographic features,such as upwelling, because nearshore upwelling is limited by freshwater stratification<strong>and</strong> fluvial inputs contain large concentrations of biologically available carbon necessaryfor phytoplankton blooms (Macdonald et al., 1987; Emmerton et al., 2008;Holmes et al., 2008).The Canadian Beaufort Sea shelf is described as an open estuary with the MackenzieRiver dominating the physical oceanography in terms of salinity, temperature<strong>and</strong> production (Carmack & Macdonald, 2002). Unlike other North American Arcticrivers, the headwaters of the Mackenzie River extend into the temperate zone <strong>and</strong> theriver continues to discharge fresh water on to the shelf through the winter, when otherArctic rivers cease to flow <strong>and</strong> marine waters intrude the delta. Due to the sea-icedam or stamukhi, the water reaching the Mackenzie Delta <strong>and</strong> nearshore throughoutthe winter months does not mix or disperse into the Beaufort Sea <strong>and</strong> formsa seasonal freshwater lake just outside the river mouth, called Lake Herlinveaux(Carmack & Macdonald, 2002). In spring, discharge increases to a flood <strong>and</strong> thelarge amount of relatively warm river water melts the sea ice <strong>and</strong> the fresh wateronce contained in Lake Herlinveaux <strong>and</strong> spring discharge water spread out over theshelf <strong>and</strong> stratify the water column, allowing the phytoplankton bloom to occur (Carmack& Macdonald, 2002; Dunton et al., 2006). If increases in the amount of freshwater stored in Lake Herlinveaux over the winter <strong>and</strong> the magnitude of the springflood could increase the amount of dissolved organic carbon (DOC) <strong>and</strong> other nutrients(Largier, 1993; Schell et al., 1998; Dunton et al., 2006; Holmes et al., 2008)or intensify the spring bloom by exp<strong>and</strong>ing water-column stratification (Carmack &Macdonald, 2002; Dunton et al., 2006), it could explain why river discharge correlatedwith YOY growth in so many months. River discharge has been shown toinfluence nearshore primary productivity <strong>and</strong> higher trophic levels with similar timelags in other regions (Kerr & Ryder, 1992; Largier, 1993; Salen-Picard et al., 2002;Wells et al., 2008).Environmental variables were more often correlated with growth in YOYC. autumnalis when lagged by at least 1 year. The influence of environmental variableson C. autumnalis growth appears to occur over time scales longer than a givenseason or within a year. The presence of time lags indicates a bottom-up <strong>and</strong> trophicallymediated mechanism <strong>and</strong> the length of the lags suggests that some component ofthe trophic pathway requires more than one growing season. Coregonus autumnalisjuveniles feed predominately on herbivorous zooplankton, particularly copepods <strong>and</strong>juvenile mysids (Knutzen et al., 1990). Zooplankton species adapted to Arctic growingconditions often take several years to develop <strong>and</strong> may be responsible for thelagged correlations between environmental variables <strong>and</strong> YOY growth.An ongoing diet study has found Pseudocalanus minutus <strong>and</strong> Calanus hyperboreusto be key prey items in YOY C. autumnalis, with the importance of C. hyperboreusincreasing <strong>and</strong> P. minutus decreasing with fish size during the first year (V. R.<strong>von</strong> <strong>Biela</strong>, C. E. <strong>Zimmerman</strong>, S. E. Burril, B. R. Cohn & J. M. Welker, unpubl.Journal of Fish Biology © 2010 The Fisheries Society of the British Isles, Journal of Fish Biology 2011, 78, 39–56No claim to original US government works
52 V. R. VON BIELA ET AL.data). Studies on zooplankton across the nearshore Beaufort Sea also identifiedP. minutus <strong>and</strong> C. hyperboreus as common species by biomass (Horner & Murphy,1985; Hopky et al., 1994a, b, c). Calanus hyperboreus has a life history of 2to 4 years, at similar latitudes, <strong>and</strong> P. minutus requires one full year for development(Hirche & Bohrer, 1987; Torke, 2001). It is possible that the abundanceof these prey resources could be responding to trends in primary production <strong>and</strong>account for the lags in the relationship between east wind speed, sea-ice concentrationor river discharge <strong>and</strong> YOY growth. Calanus hyperboreus could be a preferredprey resource due to their high lipid density (Hirche & Bohrer, 1987; Prokopowicz& Fortier, 2002). Unlike many of the other zooplankton species in more southernlatitudes, C. hyperboreus has specifically adapted to the short Arctic growing seasonby storing energy-dense lipid during the productive Arctic summer <strong>and</strong> enteringdiapause to conserve these fuels through much of the winter (Hirche & Bohrer,1987; Prokopowicz & Fortier, 2002). At the end of the summer, the lipid contentof C. hyperboreus can reach 74% of dry mass (Bradstreet & Cross, 1982). Dueto their high lipid content <strong>and</strong> abundance, C. hyperboreus plays a central role inthe Arctic food web as a major prey item of bowhead whales Balaena mysticetus<strong>and</strong> Arctic cod Boreogadus saida (Lepechin) (Lowry & Burns, 1980; Bradstreet& Cross, 1982).There was no evidence of density dependence influencing the YOY growth record.The relation between YOY growth <strong>and</strong> CPUE suggested a positive trend, if any,through the 1980s (Fig. 7). Such a trend would suggest that strong recruitmentyears, with more individuals, were associated with better growth <strong>and</strong> is oppositeof the expectation under density dependence. This study was not, however, designedto determine the influence of density dependence on growth in C. autumnalis populations;the analysis only indicates that it is unnecessary to st<strong>and</strong>ardize growth todensity before assessing the possible environmental covariates. Density dependencemay not have been detected because only individuals that successfully recruited tothe subsistence fishery were sampled <strong>and</strong> typically individuals influenced by densitydependence have increased mortality <strong>and</strong> reduced fishery recruitment.The long-term increase in YOY C. autumnalis growth rates suggests that evenexclusively Arctic species may benefit from increases in pelagic productivity. Anincrease in productivity could influence fish growth by increasing availability of aprey species that has always been exploited or switching to a new prey source or both.Future research should assess the possible mechanism relating sea-ice concentration<strong>and</strong> river discharge to productivity at upper trophic levels. Taking advantage ofincreases in productivity is probably easier for trophic generalists, as opposed tospecialists. A better underst<strong>and</strong>ing of trophic ecology <strong>and</strong> a population’s capacity toexploit changing prey species may prove useful for predicting the ultimate effect ofclimate change on some species.Sample collections for this report were made available to our laboratory by LGLLimited, ABR Inc. (J. Seigle), ConocoPhillips (Alaska), <strong>and</strong> Minerals Management Service(K. Wedemeyer). Funding was provided by the U.S. Geological Survey <strong>and</strong> Minerals ManagementService. D. C. Douglas provided sea-ice concentration data <strong>and</strong> useful comments.L. Thorsteinson <strong>and</strong> B. Wells provided useful comments that improved this manuscript. Wethank J. L. Nielsen for helpful discussions concerning C. autumnalis <strong>and</strong> this study. Any useof trade names or products is for descriptive purposes only <strong>and</strong> does not imply endorsementby the U.S. Government.Journal of Fish Biology © 2010 The Fisheries Society of the British Isles, Journal of Fish Biology 2011, 78, 39–56No claim to original US government works
YOUNG-OF-THE-YEAR COREGONUS AUTUMNALIS GROWTH 53ReferencesArrigo, K. R., van Dijken, G. & Pabi, S. (2008). Impact of a shrinking Arctic ice cover onmarine primary production. Geophysical Research Letters 35, L19603. doi: 10.1029/2008GL035028Bradstreet, M. S. W. & Cross, W. E. (1982). Trophic relationships at high arctic ice edges.Arctic 35, 1–12.Cabin, R. T. & Mitchell, R. J. (2000). To Bonferroni or not to Bonferroni: when <strong>and</strong> how arethe questions? Bulletin of the Ecological Society of America 81, 246–248.Carmack, E. C. & Macdonald, R. W. (2002). Oceanography of the Canadian Shelf of theBeaufort Sea: a setting for marine life. Arctic 55, 29–45.Carmack, E., Barber, D., Christensen, J., Macdonald, E., Rudels, B. & Sakshaug, E. (2006).Climate variability <strong>and</strong> physical forcing of the food webs <strong>and</strong> the carbon budget onpanarctic shelves. Progress in Oceanography 71, 145–181. doi: 10.1016/j.pocean.2006.10.005Cavalieri, D. J., Parkinson, C. L., Gloersen, P., Comiso, J. C. & Zwally, H. J. (1999). Derivinglong-term time series of sea ice cover from satellite passive-microwave multisensordata sets. Journal of Geophysical Research 104, 15803–15814. doi: 10.1029/1999JC900081Colonell, J. M. & Gallaway, B. J. (1997). Wind-driven transport <strong>and</strong> dispersion of age-0Arctic ciscoes along the Alaskan Beaufort Sea. American Fisheries Society Symposium19, 90–103.Craig, P. C. (1989). An introduction to amphidromous fishes in the Alaskan Arctic. BiologicalPapers of the University of Alaska 24, 27–54.Dillinger, R. E. Jr., Birt, T. P. & Green, J. M. (1992). Arctic cisco, Coregonus autumnalis,distribution, migration <strong>and</strong> spawning in the Mackenzie River. Canadian Field-Naturalist106, 175–180.Dunton, K. H., Weingartner, T. & Carmack, E. C. (2006). The nearshore western BeaufortSea ecosystem: circulation <strong>and</strong> importance of terrestrial carbon in Arctic coastal foodwebs. Progress in Oceanography 71, 362–378. doi: 10.1016/j.pocean.2006.09.011Emmerton, C. A. (2008). Nutrient <strong>and</strong> organic matter patterns across the Mackenzie River,estuary <strong>and</strong> shelf during the seasonal recession of sea-ice. Journal of Marine Systems74, 741–755. doi: 10.1016/j.jmarsys.2007.10.001Fechhelm, R. G. & Griffiths, W. B. (1990). Effect of wind recruitment of Canadian Arcticcisco (Coregonus autumnalis) into the central Alaska Beaufort Sea. Canadian Journalof Fisheries <strong>and</strong> Aquatic Sciences 47, 2164–2171. doi: 10.1139/f90-241Fechhelm, R. G., Neill, W. H. & Gallaway, B. J. (1983). Temperature preference of juvenileArctic cisco (Coregonus autumnalis) from the Alaskan Beaufort Sea. Biological Papersof the University of Alaska 21, 24–38.Fechhelm, R. G., Bryan, J. D., Griffiths, W. B. & Martin, L. R. (1997). Summer growth patternsof northern Dolly Varden (Salvelinus malma) smolts from the Prudhoe Bay regionof Alaska. Canadian Journal of Fisheries <strong>and</strong> Aquatic Sciences 54, 1103–1110. doi:10.1139/cjfas-54-5-1103Fechhelm, R. G., Streever, B. & Gallaway, B. J. (2007). The Arctic cisco (Coregonus autumnalis)subsistence <strong>and</strong> commercial fisheries, Colville River, Alaska: a conceptual model.Arctic 60, 421–429.Forest, A., Sampei, M., Makabe, R., Sasaki, H., Barber, D. G., Gratton, Y., Wassmann, P. &Fortier, L. (2008). The annual cycle of particulate organic carbon export in FranklinBay (Canadian Arctic): environmental control <strong>and</strong> food web implications. Journal ofGeophysical Research 113, C03S05. doi: 10.1029/2007JC004262Francis, R. I. C. C. (1990). Back-calculation of fish length: a critical review. Journal of FishBiology 36, 883–902. doi: 10.1111/j.1095-8649.1990.tb05636.xGallaway, B. J., Griffiths, W. B., Graig, P., Gazey, W. J. & Helmericks, J. (1983). An assessmentof the Alaskan stock of Arctic cisco (Coregonus autumnalis) – migrants fromCanada? Biological Papers of the University of Alaska 21, 4–23.Griffiths, W. B., Gallaway, B. J., Gazey, W. J. & Dillinger, R. E. Jr. (1992). Growth <strong>and</strong>condition of Arctic cisco <strong>and</strong> broad whitefish as indicators of causeway-induced effectsJournal of Fish Biology © 2010 The Fisheries Society of the British Isles, Journal of Fish Biology 2011, 78, 39–56No claim to original US government works
54 V. R. VON BIELA ET AL.in the Prudhoe Bay region, Alaska. Transactions of the American Fisheries Society 121,557–577. doi: 10.1577/1548-8659(1992)1212.3.CO;2Hare, S. R. & Mantua, N. J. (2000). Empirical evidence for North Pacific regime shifts in1977 <strong>and</strong> 1989. Progress in Oceanography 47, 103–147. doi: 10.1016/S0079-6611(00)00033-1Hirche, H. J. & Bohrer, R. N. (1987). Reproduction of the Arctic copepod Calanus glacialisin Fram Strait. Marine Biology 94, 11–17. doi: 10.1007/BF00392894Holmes, R. M., McClell<strong>and</strong>, J. W., Raymond, P. A., Frazer, B. B., Peterson, B. J. & Stieglitz,M. (2008). Lability of DOC transported by Alaskan rivers to the Arctic Ocean. GeophysicalResearch Letters 35, L03402. doi: 10.1029/2007GL032837Horner, R. A. & Murphy, D. (1985). Species composition <strong>and</strong> abundance of zooplankton inthe nearshore Beaufort Sea in winter-spring. Arctic 38, 201–209.Jarvela, L. E. & Thorsteinson, L. K. (1999). The epipelagic fish community of the BeaufortSea Coastal Waters, Alaska. Arctic 52, 80–94.Kerr, S. & Ryder, R. A. (1992). Effects of cultural eutrophication on coastal marine fisheries:a comparative approach. In Marine Coastal Eutrophication (Vollenweider, R. A.,Marchetti, R. & Vicviani, R., eds), pp. 599–614. Amsterdam: Elsevier.Knutzen, J. A., Brancato, M. S. & Jewett, S. C. (1990). Fish food habits (Stomachs). In 1986Final Report for the Endicott Environmental Monitoring Program (Envirosphere Companyeds), pp. 9–62. Anchorage, AK: US Army Corps of Engineers Report.Largier, J. L. (1993). Estuaries fronts: how important are they? Estuaries 16, 1–11. doi:10.2307/1352760LeBreton, G. T. O. & Beamish, W. H. (2000). Interannual growth variation in fish <strong>and</strong> treerings. Canadian Journal of Fisheries <strong>and</strong> Aquatic Sciences 57, 2345–2356. doi: 10.1139/cjfas-57-11-2345Lee, R. M. (1912). An investigation into the methods of growth determination in fishes.Conseil permanent international pour l’Explororation de la Mer Publication Circulaire63, 1–35.Lowry, L. F. & Burns, J. J. (1980). Foods utilized by bowhead whales near Barter Isl<strong>and</strong>,Alaska, Autumn 1979. Marine Fisheries Review 42, 88–91.Macdonald, R. W., Wong, C. S. & Erikson, P. (1987). The distribution of nutrients in thesoutheastern Beaufort Sea – implications for water circulation <strong>and</strong> primary production.Journal of Geophysical Research 92, 2939–2952. doi: 10.1029/JC092iC03p02939Magnuson, J. J., Robertson, D. M., Benson, B. J., Wynne, R. H., Livingstone, D. M., Arai,T.,Assel,R.A.,Barry,R.G.,Card,V.,Kuusisto,E.,Granin,N.G.,Prowse,T.D.,Stewart, K. M. & Vuglinski, V. S. (2000). Historical trends in lake <strong>and</strong> river ice coverin the northern hemisphere. Science 289, 1743–1746. doi: 10.1126/science.289.5485.1743McNamara, J. P., Kane, D. L. & Hinzman, L. D. (1998). An analysis of streamflow hydrologyin the Kuparuk River Basin, Arctic Alaska: a nested watershed approach. Journalof Hydrology 206, 39–57. doi: 10.1016/S0022-1694(98)00083-3<strong>Moulton</strong>, L. L. (1989). Recruitment of Arctic cisco (Coregonus autumnalis) into the ColvilleDelta, Alaska, in 1985. Biological Papers of the University of Alaska 24, 107–111.<strong>Moulton</strong>, L. L. & Seavey, B. T. (2003). Harvest Estimates <strong>and</strong> Associated Information forthe 2003 Colville River Fall Fishery. Anchorage, AK: ConocoPhillips Alaska, Inc.Murphy, S. M., Mueter, F. J., Braund, S. R., Lampe, L., Prichard, A. K., Anderson, B. A. &Seigle, J. C. (2007). Variation in the abundance of Arctic cisco in the Colville River:analysis of existing data <strong>and</strong> local knowledge. U.S. Department of the Interior, MineralsManagement Service. Technical Report No. MMS 2007-042.Næsje, T. F., Jonsson, B. & S<strong>and</strong>lund, O. T. (1986). Drift of cisco <strong>and</strong> whitefish larvae ina Norwegian River. Transactions of the American Fisheries Society 115, 89–93. doi:10.1577/1548-8659(1986)1152.0.CO;2Næsje, T. F., Jonsson, B. & Skurdal, J. (1995). Spring flood: a primary cue for hatching ofriver spawning Coregoninae. Canadian Journal of Fisheries <strong>and</strong> Aquatic Sciences 52,2190–2196.Neilson, J. D. & Geen, G. H. (1985). Effects of feeding regimes <strong>and</strong> diel temperature cycleson otolith increment formation in juvenile Chinook salmon, Oncorhynchus tshawytscha.Fishery Bulletin 83, 91–101.Journal of Fish Biology © 2010 The Fisheries Society of the British Isles, Journal of Fish Biology 2011, 78, 39–56No claim to original US government works
YOUNG-OF-THE-YEAR COREGONUS AUTUMNALIS GROWTH 55Pabi, S., van Dijken, G. L. & Arrigo, K. R. (2008). Primary production in the Arctic Ocean,1998-2006. Journal of Geophysical Research Oceans 113, C08005. doi: 10.1029/2007JC004578Prokopowicz, A. & Fortier, L. (2002). Population structure of three dominant Calanus speciesin Northern Water Polynya, Baffin Bay. Polish Polar Research 23, 241–252.Reiss, M. J. (1989). The Allometry of Growth <strong>and</strong> Reproduction. Cambridge: Cambridge UniversityPress.Reist, J. D., Wrona, F. J., Prowse, T. D., Power, M., Dempson, J. B., King, J. R. & Beamish,R. J. (2006a). An overview of effects of climate change on selected Arctic freshwater<strong>and</strong> diadromous fishes. Ambio 35, 381–387. doi: 10.1579/0044-7447(2006)35[381:AOOEOC]2.0.CO;2Reist, J. D., Wrona, F. J., Prowse, T. D., Power, M., Dempson, J. B., Beamish, R. J., King,J. R., Carmichale, T. J. & Sawatzky, C. D. (2006b). General effects of climate changeon Arctic fishes <strong>and</strong> fish populations. Ambio 35, 370–380. doi: 10.1579/0044-7447(2006)35[370:GEOCCO]2.0.CO;2Roff, D. A. (1992). The Evolution of Life Histories: Theory <strong>and</strong> Analysis. London: Chapman& Hall.Rogers, D. E. & Ruggerone, G. T. (1993). Factors affecting marine growth of Bristol Baysockeye salmon. Fisheries Research 18, 89–103. doi: 10.1016/0165-7836(93)90042-6Salen-Picard, C., Darnaude, A. M., Arlhac, D. & Harmelin-Vivien, M. L. (2002). Fluctuationsof macrobenthic populations: a link between climate-driven river run-off <strong>and</strong> solefishery yields in the Gulf of Lions. Oecologia 133, 380–388. doi: 10.1007/s00442-002-1032-3Schell, D. M., Barnett, B. A. & Vinette, K. A. (1998). Carbon <strong>and</strong> nitrogen isotope ratios inzooplankton of the Bering, Chukchi <strong>and</strong> Beaufort seas. Marine Ecological ProgressSeries 162, 11–23. doi: 10.3354/meps162011Sebens, K. P. (1987). The ecology of indeterminate growth in animals. Annual Review ofEcology <strong>and</strong> Systematics 18, 371–407. doi: 10.1146/annurev.es.18.110187.002103Sogard, S. M. (1997). Size-selective mortality in the juvenile state of teleost fishes: a review.Bulletin of Marine Science 60, 1129–1157.Thompson, D. W. J. & Wallace, J. M. (1998). The Arctic oscillation signature in the wintertimegeopotential height <strong>and</strong> temperature fields. Geophysical Research Letters 25,1297–1300. doi: 10.1029/98GL00950Torke, B. (2001). The distribution of calanoid copepods in the plankton of Wisconsin Lakes.Hydrobiology 453/454, 351–365. doi: 10.1023/A:1013185916287Urpanen, O., Huuskonen, H., Marjomäki, T. J. & Karjalainen, J. (2005). Growth <strong>and</strong> sizeselectivemortality of vendace (Coregonus albula (L.)) <strong>and</strong> whitefish (C. lavaretus L.)larvae. Boreal Environmental Research 10, 225–238.Walker, H. J. & Hudson, P. F. (2003). Hydrologic <strong>and</strong> geomorphic processes in the ColvilleRiver delta, Alaska. Geomorphology 56, 291–303. doi: 10.1016/S0169-555X(03)00157-0Wells, B. K., Grimes, C. B., Sneva, J. G., McPherson, S. & Waldvogel, J. B. (2008). Relationshipsbetween oceanic conditions <strong>and</strong> growth of Chinook salmon (Oncorhynchustshawytscha) from Alaska, Washington, <strong>and</strong> California, USA. Fisheries Oceanography17, 101–125. doi: 10.111/j.1365-2419.2008.00467.xWrona, F. J., Prowse, T. D., Reist, J. D., Hobbie, J. E., Levesque, L. M. J. & Vincent, W. F.(2006). Climate impacts on Arctic freshwater ecosystems <strong>and</strong> fisheries: background,rationale <strong>and</strong> approach of the Arctic Climate Impact Assessment (ACIA). Ambio 35,326–329. doi: 10.1579/0044-7447(2006)35[326:CIOAFE]2.0.CO;2Electronic ReferencesCavalieri, D., Parkinson, C., Gloersen, P. & Zwally, H. J. (1996). Sea Ice ConcentrationsFrom Nimbus-7 SMMR <strong>and</strong> DMSP SSM/I Passive Microwave Data, 1979–2007. Boulder,CO: National Snow <strong>and</strong> Ice Data Center. Available at http://nsidc.org/data/nsidc-0051.html/Journal of Fish Biology © 2010 The Fisheries Society of the British Isles, Journal of Fish Biology 2011, 78, 39–56No claim to original US government works
56 V. R. VON BIELA ET AL.Hopky, G. E., Lawrence, M. J. & Chiperzak, D. B. (1994a). NOGAP B2: zooplankton datafrom the Canadian Beaufort Sea Shelf, 1984 <strong>and</strong> 1985. Canadian Data Report of Fisheries<strong>and</strong> Aquatic Sciences No. 922. Available at http://www.dfo-mpo.gc.ca/librariesbibliotheques/data-stat-eng.htm/Hopky, G. E., Lawrence, M. J. & Chiperzak, D. B. (1994b). NOGAP B2: zooplankton datafrom the Canadian Beaufort Sea Shelf, 1986. Canadian Data Report of Fisheries <strong>and</strong>AquaticSciences No.923.Availableat http://www.dfo-mpo.gc.ca/libraries-bibliotheques/data-stat-eng.htm/Hopky, G. E., Lawrence, M. J. & Chiperzak, D. B. (1994c). NOGAP B2: zooplankton datafrom the Canadian Beaufort Sea Shelf, 1987 <strong>and</strong> 1988. Canadian Data Report of Fisheries<strong>and</strong> Aquatic Sciences No. 912. Available at http://www.dfo-mpo.gc.ca/librariesbibliotheques/data-stat-eng.htm/Journal of Fish Biology © 2010 The Fisheries Society of the British Isles, Journal of Fish Biology 2011, 78, 39–56No claim to original US government works