Guideline - Cauberg-Huygen Raadgevende Ingenieurs BV
Guideline - Cauberg-Huygen Raadgevende Ingenieurs BV
Guideline - Cauberg-Huygen Raadgevende Ingenieurs BV
- No tags were found...

Create successful ePaper yourself
Turn your PDF publications into a flip-book with our unique Google optimized e-Paper software.
1. IntroductionIn 1993, the Dutch started to build up experience with their own standard about theevaluation of vibrations in relation to nuisance. The committee that published thisstandard was very much aware of the complex relation between vibrations and nuisance.In the introduction of this publication the committee already mentioned the futurepossibility of changing the limiting values due to results of new studies. Nine years later,this vision has turned into reality. The limits have changed. But there are more changes.Changes which the committee did not forsee.2. HistoryUntil 1993 the evaluation of vibrations in relation to nuisance was done in the Netherlandsaccording to a German standard called DIN 4150 part 2 from 1972. This choice was madesimply because no Dutch standard was available. The use of the German standard was notideal. The standard referred to several German views which did not meet Dutch generalregulations regarding nuisance.In 1993 the Dutch Stichting Bouwresearch SBR (Foundation for Building Research)published three guidelines about the measuring and evaluation of vibrations in relation to:- damage (guideline 1);- nuisance (guideline 2);- equipment (guideline 3).<strong>Guideline</strong>s 1 and 3 will not be discussed in this paper.The publication of guideline 2 followed 6 months after a revision of the German standardDIN 4150 part 2 (December 1992). It is no surprise that, due to the historic use of theGerman standard, the Dutch guideline has a lot in common with its German neighbour,but it has some major differences as well. In the period between 1993 and 1995, guideline2 conquered the Netherlands and in 1996 it was generally accepted.In 1998 this clear world was disturbed by the publication of the Dutch “Handreikingindustrielawaai en vergunningverlening” (directions for industrial noise and legislation)by the ministry of VROM (ministry of Housing, Spatial Planning and Environment)Although the main subject of this publication was noise and its regulations, thepublication contains a chapter about vibrations. It gives limits to vibrations that could becontained in legislation. The limit however differs from guideline 2, but for the method ofmeasuring and evaluation the Handreiking is similar to the guideline.In 2002, guideline 2 is to be revised. Publication is expected in the summer of 2002. Thelimits in the guideline have changed compared to the publication of 1993, but they stilldiffer from the Handreiking.So, instead of no standard, the Dutch now have two, which are different in use and limits.3. Vibration parameterIn both <strong>Guideline</strong> and Handreiking the vibration parameter that has to be evaluated iscalled V max . Before this parameter is obtained, the vibration signal has to be manipulatedin 3 ways:- the frequency range is limited from 1 to 80 Hz;- the vibration signal is weighted;- from the weighted signal, the effective value (rms value) is calculated.-2-
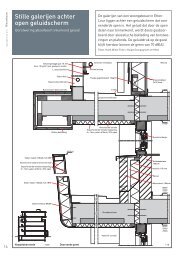
The weighting of the vibration signal depends on the type of signal: acceleration orvelocity. Both functions result in the same weighted vibration signal.For acceleration the weighting follows the function:H 1 1 1( f ) = • •av202π( f0) 1 ( f / f0)In case vibration velocity is measured, the weighting follows:H 1 1( f ) = •vv20 1 ( f0/ f )In these formulas is:- f frequency, in Hz;- f o 5.6 Hz;- v o 1 mm/s.Figures 1 and 2 present both functions as a graph. For frequencies over 16 Hz theweighted signal is almost equal to the unweighted velocity signal. By using the factor1 in the weighting functions, the weighted vibration signal has lost its unit. This is doneV 0to make clear that the vibration signal is weighted.Weighting function acceleration0.0300.025Ha(f)0.0200.0150.0100.0050.0000 5 10 15 20 25 30 35 40 45 50 55 60 65 70 75 80Frequency ---> [Hz]Figure 1: weighting function for acceleration.-3-
Weighting function velocity1.051.000.950.900.850.800.750.700.650.600.550.500.450.400.350.300.250.200.150.100.050.00Figure 2: weighting function for velocity.From the weighted signal the effective value (rms value) is calculated according to:t12veff( t)= ∫ g(ξ ) v ( t − ξ ) dξτg(ξ) = exp[- ξ/τ];τ = 0.125 s.0The value for τ (0.125 seconds) is the same as used in sound level meters with the timeweighting set to “FAST”. For harmonic and periodical vibrations with a frequency over10 Hz, the value of v eff (t) is almost constant and equal to v eff . For frequencies below 10Hz, the value of v eff (t) varies around the value of v eff . This variation increases for lowerfrequencies. Figure 3 gives an example.During the measurement, for every interval, i, of 30 seconds, the highest value of v eff (t) isdetermined. This value is called v eff , max,30,i . Finaly V max can be obtained: this is thehighest value of v eff , max,30,i . Although the determination of V max seems to be complicated,it is actually quite simple. Apart from weighting, every sound level meter with thepossibility of measuring the rms value using the “Fast”-integration time is suitable to dothe job. Of course its frequency range for the lower frequencies should be sufficient (1-80Hz).Hv(f)0 5 10 15 20 25 30 35 40 45 50 55 60 65 70 75 80frequency ---> [Hz]4. Evaluation of V maxBoth <strong>Guideline</strong> and Handreiking use the same principle of evaluating V max . It is done byusing three limiting values called A 1 , A 2 and A 3 . The evaluation is done in three steps:1. If V max < A 1 , then nuisance needs not be expected.2. If V max > A 2 , nuisance has to be expected.3. If A 1 < V max < A 2 a new parameter (V per ) has to be calculated and compared to A 3 . InV per the duration of the vibrations is considered.-4-
Note that the first two steps of the evaluation are based on the maximum value (V max ).One peak in the vibration signal can be enough to exceed the limits of A 1 and/or A 2 .The use of two limits (A 1 and A 2 ) to evaluate V max has a reason. By not exceeding A 1 it isalmost certain that nuisance will be prevented. By exceeding A 1 a little or not too often itis not sure that nuisance will occur. It depends on the level of the vibration and theduration. One high peak with a short duration can be acceptable. To limit the top level ofthe vibration A 2 is used. Exceeding A 2 means that nuisance has to be expected even if thevibration lasts for a few seconds.If the vibration level (V max ) exceeds A 1 but does not exceed A 2 , the duration of thevibration level combined with the level itself is used to calculate V per . To evaluate V per ,A 3 is used.The calculation of V per consists of two parts:- the calculation of an averaged vibration level based on the measured v eff , max,30,i ;- the calculation of a time correction factor in which the duration of the vibration isconsidered.The calculation of the averaged vibration level (v per,meet ) is done according to:v1n2per, meet= [ • ∑veff,max,30, i]n i=1In this formula, n is the number of 30 seconds intervals in the measurement period. Thevalue of v eff , max,30,i is the highest rms value of the weighted vibration signal for every 30seconds. To explain the calculation of v per,meet an example is given:During 5 minutes a vibrations measurement is performed giving a value for v eff , max,30,i forevery 30 seconds. This means a total of 10 values. The chosen measurement time is representativefor the duration of the vibration. The measured values are in the table, figure 3 showsthe vibration signal.Example0.180.160.140.12Veff(t) --->[-]0.10.080.060.040.02Veff(t)Veff,max,30,i00 30 60 90 120 150 180 210 240 270 300Time --->[sec]Figure 3: example of a weighted vibration signal.-5-
Interval i v eff , max,30,i1 0.152 0.163 0.144 0.165 0.176 0.057 0.158 0.159 0.1410 0.15In this example one value is measured which is smaller or equal to 0.1. Therefore, in thecalculation the value of zero is used instead of the measured value. This is done inconsideration of the experience that a vibration level of 0.1 or less will generally cause nonuisance. Therefore, this level is left out of the calculation. The measured intervalhowever should be considered in the number of intervals (n) used in the calculation.The calculation of v per,meet is done by:•10( 0.15) 2 2222222+ 0.16 + 0.14 + 0.16 + 0.17 + 0 + 0.15 + 0.15 + 0.14 + 0.15 = 0. 1451 2The time correction factor depends on the period of time that is considered. In Dutchnuisance regulations about sound and vibrations, every 24 hours is divided in 3 periods:- Day (07.00 – 19.00 hours or 12 hours);- Evening (19.00 – 23.00 hours or 4 hours);- Night (23.00 – 07.00 hours or 8 hours)These periods are used to determine the ratio between the duration of the vibrations andthe duration of the period. In formula:TbTime correction:T0T b represents the duration of the vibration and T 0 the duration of the period (12, 4 or 8hours).To finalise the calculation of V per , both time correction factor and the averaged vibrationlevel have to be multiplied:TbV per = vper , meet•T0-6-
If the duration of the vibration in the example is 1 hour during the day, evening and night,V per will be:Day: 0 .145 •1= 0. 04212Evening: 0 .145 •1= 0. 0734Night: 0 .145 •1= 0. 0518Now the significance of the period is clear. A duration of the vibration of 1 hour duringthe day is considered to be of less nuisance compared to one hour in the evening. For thelatter, the vibration lasts 25% of the evening period.Considering V per , it seems to be odd that for the night a lower value (due to the longerperiod) is calculated compared to the evening, while during the night nuisance occursmore easily.The value of V per is evaluated by A 3 . For the night, A 3 is half the value for day or evening(see chapter 6). This way the extra chance of nuisance in the night, is considered.This system of evaluation (V max and V per ) ensures that limiting values are not used in arigid way. For nuisance there are no definitive limits which are valid for all people. But,which vibration level causes nuisance?5. Vibrations and nuisanceThe main goal of both <strong>Guideline</strong> and Handreiking is to prevent or restrict nuisance causedby vibrations as much as possible. This goal is the starting point for the chosen limits.Based on publications and Dutch experience a weighted vibration level of 0.1 (mm/s) isgenerally chosen to be the guiding limit to prevent nuisance. If the vibration level V maxdoes not exceed the value of 0.1, nuisance needs not be expected. But is it possible to getused to vibrations like people get used to the noise of traffic? And which vibration levelshould be the top limit? Does the duration of the vibration contribute to the experience ofnuisance?In order to relate vibrations and nuisance, the commission that has published <strong>Guideline</strong> 2,has studied several publications published between 1993 and 1999 for example:a. K. Zeichert et al (Germany): several publications in 1993 and 1994 about the relationbetween nuisance and vibrations caused by trains.b. W. Passchier-Vermeer (the Netherlands): several publications between 1995 and 1998about the relation between nuisance and vibrations.c. NS 8176 (Norway): preliminary standard from 1999 about vibrations. In an appendixthe results of a Norwegian study of the relation between vibrations and nuisance isdescribed.The content and conclusions of these publications are shortly reviewed.-7-
A. Publications K. Zeichert et alThe purpose of these studies was to establish a relation between the subjective,perceived vibrations and the measured vibration level, the number of vibration causingevents (passing by of trains) and the measured sound levels. In almost 400 Germanhouses measurements were carried out and inhabitants interviewed. The Germanvibration commission has used the results of these studies in its publication of DIN4150 part A2 in 1997. Zeichert concluded that:- the correlation between the measured vibration levels and the perception of thevibrations is rather bad;- nuisance caused by vibrations already occurs when the vibration level is fairly low.If the vibration level rises, the nuisance doesn’t rise equally;- the number of events correlates badly with the nuisance.The Dutch committee did not use the results of these studies.B. Publications Passchier-VermeerIn 1995 a study was done about the way people in buildings respond to vibrations. Themain purpose of this study was to establish the parameter that could be linked tonuisance caused by vibrations for people in buildings.In this study, ISO 2631-2 (1989), BS 6472 (1992) and DIN 4150-2 (1992) wereconsidered. Furthermore data were collected about the relation between exposure tovibrations and nuisance. The study concluded:- none of the studied standards were based on sufficient scientific work. None of themeasuring or calculation procedures used could be selected as the best procedure;- only for rail traffic a correlation could be made between the rms-value of theacceleration and the eVDV (estimated Vibration Dose Value) used in the BritishStandard BS 6472 (1989).These results were not of any use for the <strong>Guideline</strong>, but there was more information.In 1997 a database of 36.000 interviewed persons was evaluated on items aboutvibrations. Although no vibration levels were included in the database, there wasenough information about nuisance caused by vibrations and the measured soundlevels. Therefore the relation between sound level and nuisance by vibration wasstudied. Furthermore the personal situation of the people interviewed in relation to theperception of sound and vibrations was considered. The conclusions of the study were:- a fairly good correlation can be obtained between nuisance by sound (based on theequivalent sound level L eq ) and nuisance by vibration;- no good relation was found between the personal situation and the perception ofsound and vibration;- a good correlation was established between the perception of nuisance by vibrationsand feelings of fear.Finally in 1997 Passchier-Vermeer made another analysis of the database of K.Zeichert. Again, the purpose of this study was to find the best parameter to describenuisance by vibrations. In this study were considered the vibration levels mentioned inthe standards already studied in 1995, the number of trains in 24 hours and theequivalent sound level over 24 hours combined with 6 specific questions included inthe database about vibrations. The conclusions of this study:- the best correlation between nuisance and parameter was found for the rms-value ofthe vibration velocity;-8-
- the number of events which caused vibrations that were sensed by the intervieweddid not correlate with the described nuisance. So the vibration level is a betterpredictor for nuisance than the number of events;- even this study completely based on rail traffic showed a fairly low correlationbetween vibration level and nuisance.This last study showed that the choise made in both DIN and <strong>Guideline</strong> to judge firstV max (vibration level) before V per (number of events) is right. Nevertheless the resultsof these studies were not used in the <strong>Guideline</strong>.C. NS 8176The preliminary publication of NS 8176 deals with the measurement of vibrations inbuildings caused by land based transport and guidance to evaluation of its effect onhuman beings. In contrast with other standards, the Norwegians do not use themaximum vibration level but the vibration level (velocity) that, with a chance of 95%will not be exceeded. This means that a statistical calculation is included. This makesit hard to relate the used vibration levels to the maximum level used in theNetherlands.However in an appendix of NS 8176, the results of a study about nuisance byvibrations (road and rail traffic) were summarised. The Norwegians have categorisedthe nuisance:Category 2: cumulation of moderate nuisance, general nuisance and seriousnuisance;Category 3: cumulation of general and serious nuisance;Category 4: just serious nuisance.The ratio between the categories is 4. So, when the number of people being annoyed isequal in all categories, the vibration level increases by 4 when the next category isreached. This factor is used in the Dutch guideline for the relation between A 1 en A 2 .Furthermore it is used in the <strong>Guideline</strong> to give an additional possibility to evaluatevibrations caused by road and train traffic.The Handreiking has not used the results of the discussed studies. The limits are basedon DIN 4150 part 2. It is now time to discuss the differences between <strong>Guideline</strong> andHandreiking.6. The Dutch DilemmaTo evaluate vibrations and nuisance in case of legislation, the Dutch have twodocuments available:1. <strong>Guideline</strong> 2 published by SBR.2. Handreiking published by VROM.When vibrations caused by traffic or building activities (piling) have to be evaluatedthere is only one possibility: <strong>Guideline</strong> 2.The State Council has approved the use of both documents in cases of legislation.Both documents however differ in applications and limits to the vibration. Table 2gives an overview of the differences between them.-9-
Table 2:Differences <strong>Guideline</strong> and Handreiking<strong>Guideline</strong>Suitable for all situations where vibrations inbuildings have to be evaluated in relation tonuisance.Measuring, calculation and evaluation anddescribedLimits based on function of building.Limits fairly low.HandreikingSuitable only when used for legislation.Only the evaluation is described; measuringand calculation according to <strong>Guideline</strong>.Limits based on location of building(country site, industrial site).Limits not as low.The main difference is that the limits are not based on the same point of view.In the <strong>Guideline</strong> the function of a building (this is linked to the activity of people inthis building) is the base for the limiting value. The way vibrations cause nuisance isaffected by the activity of a person. Someone sleeping or reading will be annoyedsooner compared to someone working in a factory. Five building categories are used:1. Healthcare.2. Living (including hotels and mobile homes).3. Office and education.4. Meeting places like cinemas, theatres and churches.5. Critical working areas like operation rooms, labs or reading rooms.For these categories the basic limits are given in table 3.Table 3:Basic limits <strong>Guideline</strong>Building categoriesDay and eveningNightA 1 A 2 A 3 A 1 A 2 A 3Healthcare 0.1 0.4 0.05 0.1 0.2 0.05Living 0.1 0.4 0.05 0.1 0.2 0.05Office and education 0.15 0.6 0.07 0.15 0.6 0.07Meeting places 0.15 0.6 0.07 0.15 0.6 0.07Critical working area 0.1 0.1 - 0.1 0.1 -The ratio of 4 between A 1 and A 2 is found for all categories in the day and eveningexcept for the critical working areas. In the night only for office and meeting placesthis ratio is maintained. For healthcare and living the ratio is decreased to 2 to preventnuisance as much as possible.In the Handreiking, the limits are based on the location of the buildings. Again, fivecategories are used.1. Houses in rural areas.2. Houses in rural areas with lots of agrarian activities.Houses in residential areas.Houses in city centres.3. Houses in areas with an equal ratio between industrial buildings and residentialbuildings.4. Houses in areas with industrial activities.5. Houses on industrial sites.-10-
Table 4:CategoryLimits HandreikingALimitsday and evening(07.00-23.00 uur)night(23.00-07.00 uur)A 2 A 3 A 1 A 2 A 31day evening1 0.1 2 1 0.05 0.1 0.15 0.052 0.15 2.5 1.5 0.07 0.1 0.2 0.053 0.2 4 2 0.1 0.15 0.3 0.074 0.3 5.5 3 0.15 0.2 0.4 0.15 0.4 6 4 0.2 0.3 0.5 0.15The choice for a category is not simple because the definitions of the categories arenot included in Dutch legislation. The categories are copied from the German standardDIN 4150 part 2. Discussion about the chosen category is possible. However inDecember 2001, the State Council concluded that the categories 1, 2 and 3 could beused because the limits are severe enough to prevent or restrict nuisance. The limits incategory 4 and 5 are not to be used without motivation that these limits will prevent orrestrict nuisance.In lots of cases category 2 can be selected. The corresponding limits are compared tothe limits in <strong>Guideline</strong> 2 for the category “living”. Table 5 contains all limits for both<strong>Guideline</strong> and Handreiking.Table 5:Comparison <strong>Guideline</strong> and HandreikingDocumentDay Evening NightA 1 A 2 A 3 A 1 A 2 A 3 A 1 A 2 A 3<strong>Guideline</strong> (Living) 0.1 0.4 0.05 0.1 0.4 0.05 0.1 0.2 0.05Handreiking (cat. 2) 0.15 2.5 0.07 0.15 1.5 0.07 0.1 0.2 0.05For the night there is no difference between <strong>Guideline</strong> and Handreiking. For the dayand evening there is. The value of A 1 and A 3 is the lowest in the <strong>Guideline</strong> althoughthe difference is not that big, about 30%.Striking is the difference for A 2 . According to the <strong>Guideline</strong> a vibration level over 0.4(day) causes possible nuisance. The Handreiking however permits a vibration level of2.5! Note that this level could damage the construction of a building. This level shouldonly happens one period of 30 seconds or V per will be over A 3 . A vibration level of 0.5exceeds A 2 in the <strong>Guideline</strong> but is possible for 14 minutes according to theHandreiking before V per exceeds A 3 .When a company needs a legislation and vibrations are an issue, the company shoulduse the Handreiking. It offers more possibilities, allows higher vibration levelscompared to the <strong>Guideline</strong>. The government has to protect her civilians, also fromnuisance by vibrations. The request for legislation has to be judged by the government.They have 2 documents available. The choice of the document can be crucial for theresult of the legislation. It is a dilemma.-11-
7. Summary and conclusionBefore 1993, no Dutch standard was available to evaluate vibrations in buildings inrelation to nuisance. In 2002, the Dutch have two documents (<strong>Guideline</strong> 2 publishedby SBR and the Handreiking published by VROM), both useful for legislation.However, in both documents the limits used to prevent or restrict nuisance differ.Since none of the documents has the status of law and the State Council has approvedboth documents to be used for legislations, the Dutch have to make a choice, whichdiffers from case to case. After 9 years of experience with Dutch rules aboutvibrations, it is clear that the relation between vibrations and nuisance is verycomplicated and results in very different point of views thus resulting in twodocuments for the evaluation of vibration levels in case of legislation. The committeethat revised <strong>Guideline</strong> 2 has studied the possibilities to bring <strong>Guideline</strong> andHandreiking closer together. This has resulted in a change. In the new <strong>Guideline</strong> it ispossible to allow higher limiting values for buildings situated on industrial sites.However, these higher levels have to be thoroughly motivated. But still the differencesin limits exist.A sour idea since the intention of the 1993 <strong>Guideline</strong> was to clear up the darkness overDutch vibration land. For the evaluation of vibrations caused by traffic of buildingactivities this is the case. <strong>Guideline</strong> 2 is the standard that has to be used. But whenlegislation is the issue, the Netherlands are still in the shadow of clearness. The futurewith the judgement of the State Council will determine which standard will clear theshadow.-12-