General Principles - Andrei Gorea
General Principles - Andrei Gorea
General Principles - Andrei Gorea
- No tags were found...

You also want an ePaper? Increase the reach of your titles
YUMPU automatically turns print PDFs into web optimized ePapers that Google loves.
• Barlow• Univariance, Population code, Normalization• Sparse coding• Non-linearities•• RFs• <strong>General</strong> neural architecture & neural interactions• Correlation• Perception & Action• Efferent copy• Figure-Ground• Signal, Noise & Decision• Inference & Bayes
Barlow’s (1972) single neuron doctrineBarlow, H.B. (1972). Single units and sensation: A neuron doctrine for perceptual psychology? Perception, 1, 371-394.
The relationship between the firing of single neurons in sensory pathways andsubjectively experienced sensations.Five dogmas:1. To understand nervous function one needs to look at interactions at a cellularlevel, rather than either a more macroscopic or microscopic level, becausebehaviour depends upon the organized pattern of these intercellular interactions.2. The sensory system is organized to achieve as complete a representation of thesensory stimulus as possible with the minimum number of active neurons [sparsecoding].3. Trigger features of sensory neurons are matched to redundant patterns ofstimulation by experience as well as by developmental processes.4. Perception corresponds to the activity of a small selection from the verynumerous high-level neurons, each of which corresponds to a pattern of externalevents of the order of complexity of the events symbolized by a word [grandmothercells].5. High impulse frequency in such neurons corresponds to high certainty that thetrigger feature is present.
Réponse d’un filtre (s/s ou autre)IntensitéTHE UNIVARIANCE PRINCIPLEIntensité ou « qualité » du StimulusR« Qualité » (l)VR RmaxnIn In RI = stimulus intensityR = responseR max = max resp.N = max slopeS = semi-saturation cst.R s = spontaneous RSUn « canal » ou« filtre » ou« champ récepteur »Un autre
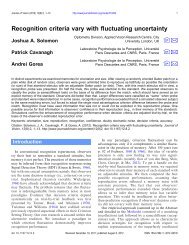
INTERPRETING POPULATION RESPONSEqqFigure 1. Computing the log likelihoodfunction in a feedforward network.At its input (bottom), a stimulus, elicitsn 1, n 2, ..., n Nspikes in the sensoryrepresentation. The response of eachneuron multiplied by the logarithm of itsown tuning curve, log[f i], gives thecontribution of that neuron to the loglikelihood function. Adding thecontribution of individual neurons(shown for two example stimulus valuesin orange and green) gives the overall loglikelihood function, log L(q) for all valuesof q that could have elicited this patternof responses. Here, the orange point atthe peak of the log likelihood functionindicates the most likely stimulus., q iJazayeri, M. & Movshon, J.A. (2006). Optimal representation of sensory information by neural populations. Nature Neuroscience 9, 690-696.
RESPONSE NORMALIZATIONNormalization works (here) byDivisiveinhibitiondividing each outputby the sum of all outputs.Heeger, D.J. (1992). Normalization of cell responses in cat striate cortex. Visual Neuroscience, 9, 181-197.
Ohshiro, Angelaki, & DeAngelis, (2011). A normalization model of multisensory integration. Nat Neurosci, 14, 775-782.
Sparse coding
Field, D.J. & Olshausen, B.A. (2004) Sparse coding of sensory inputs. Current Opinion inNeurobiology, 14, 481–487.Several theoretical, computational, and experimental studies suggest thatNeurons encode sensory information using a small number of active neurons at anygiven point in time.This strategy, referred to as ‘sparse coding’, could possibly confer several advantages.I. it allows for increased storage capacity in associative memories;II. it makes the structure in natural signals explicit;III. it represents complex data in a way that is easier to read out at subsequentlevels of processing;IV. it saves energy.Recent physiological recordings from sensory neurons have indicated that sparse codingcould be an ubiquitous strategy employed in several different modalities acrossdifferent organisms.
Trois types de cônes codent pour une infinité de couleursAbsorption normalisée des 4 « canaux » / filtres rétiniens (3types de cônes & les batonnets)
Learned receptive fieldsSparse representation inthe output of thenetwork.144 pixel valuescontained in the patch.Example image patchused in training.Set of receptive fields that are learnt bymaximizing sparseness in the output of aneural network. The network was trained onapproximately half a million image patches ofnatural scenes. The receptive fields thatemerge from training are spatially localized,oriented, and bandpass similar to corticalsimple cells.Example image patch and its encoding by the sparse coding network.The bar chart directly above the image patch shows the 144 pixel valuescontained in the patch. These input activities are transformed into amuch sparser representation in the output of the network, shown in thebar chart at the top.As the receptive fields are matched to the structures that typically occurin natural scenes, an image can usually be fully represented using asmall number of active units.Field, D.J. & Olshausen, B.A. (2004) Sparse coding of sensory inputs. Current Opinion in Neurobiology, 14, 481–487.
Need of Non-linearity
RESPONSENEED OF A NONLINEARITYCONTRASTE
RESPONSENEED OF A NONLINEARITYCONTRASTEABLequel des deux carrés est le plus contrasté ?
RESPONSENEED OF A NONLINEARITYSelon la réponse des unités ON, ceserait B parce qu’une réponse positiveet nécessairement plus grande qu’uneréponse négative.CONTRASTEABLequel des deux carrés est le plus contrasté ?
RESPONSENEED OF A NONLINEARITYPour les mêmes raisons, les cellulesOFF donneraient la « bonne » réponse,mais….CONTRASTEABLequel des deux carrés est le plus contrasté ?
RESPONSENEED OF A NONLINEARITY...se « tromperaient » pour lacomparaison C-D.CONTRASTECDLequel des deux carrés est le plus contrasté ?
RESPONSENEED OF A NONLINEARITY (Half-way rectification)Half-way rectificationHalf-way rectificationCONTRASTE
RESPONSENEED OF A NONLINEARITY (Full-way rectification)CONTRASTEFull-way rectificationc.-à-d.Réponse absolue
PART II
Receptive FieldsExcitationInhibition
RF as a filter
Dans un système linéaire, mesurerl’amplitude du signal de sortie du systèmepour une amplitude d’entrée constante(l’approche de l’ingénieur) est équivalent àmesurer l’amplitude entrante requise afind’obtenir un signal de sortie constant(l’approche du psychophysicien).
FILTRAGE MULTIECHELLEFace & SFFace, SF& Ori
The Convolution
CONVOLUTION1 1 1 1 2 3 4 5 5 5 51 1 1 1 2 3 4 5 5 5 5-1 3 -1Champ récepteur( ) Eh S XE(X x) h(x)dx1 1 0 2 3 4 6 5 5E(X) = Entrée (fct. de X)S(X) = Sortie (fct. de X)CR = h(x) = Réponse Implle (fct. de x)-1 3 -1Réponse impulsionnelle3 -1-1 3 -1-1 3 -1-1 3 -1-2 6 -2-3 9 -3-4 12 -4-5 15 -5-5 15 -5( ) Eh S XE(X) h(Xx) dx-5 15 -5-5 151 1 0 2 3 4 6 5 5
Receptive Fields & Retinotopy
The RF is equivalent to the system’s Impulse ResponsePHYSICAL SPACERECEPTIVEFIELDIncoming lightPhotoreceptorsDans un système linéairerétinotopique,AxonsNeuronsLa représentation d’unensemble de points (image)par un seul neuroneRETINOTOPICAL SPACERecording siteest strictement identique à lareprésentation d’un pointdans l’espace physiquePhotoreceptorsPHYSICAL SPACEIncoming lightpar l’ensemble desneurones qui le traitent.AxonsNeuronsIMPULSERESPONSERecording siteRETINOTOPICAL SPACE
Multiscaling
MULTIPLE SCALE REPRESENTATION AT EACH RETINAL LOCATIONFOVEAExcentricité
FILTRAGE MULTIECHELLEAude Oliva: http://cvcl.mit.edu/movies/movies.html
FILTRAGE MULTIECHELLEAude Oliva: http://cvcl.mit.edu/movies/movies.html
Receptive Field & Opponency
Le traitement du Contraste par les Champs Récepteurs est une forme de« opponency ».ExcitationInhibitionExcitationInhibition
Absorption normalisée des 4 « canaux » / filtres rétiniens (3types de cônes & les batonnets)
Spatial and spectral relationships among subunit groups in V1 of awake monkeys.Chen, Han, Poo & Dan (2007). Excitatory and suppressive receptive field subunits in awake monkey primary visual cortex (V1).PNAS, 104, 19120–19125.There were found up to nine subunits for each cell, including one or two dominant excitatory subunits asdescribed by the standard model, along with additional excitatory and suppressive subunits with weakercontributions.Compared with the dominant subunits, the nondominant excitatory subunits prefer similar orientations andspatial frequencies but have larger spatial envelopes. They contribute to response invariance to small changesin stimulus orientation, position, and spatial frequency.In contrast, the suppressive subunits are tuned to orientations 45°–90° different from the excitatory subunits,which may underlie crossorientation suppression.Together, the excitatory and suppressive subunits form a compact description of RFs in awake monkey V1,allowing prediction of the responses to arbitrary visual stimuli.
Spatial and spectral relationships among subunit groups in V1 of awake monkeys.Chen, Han, Poo & Dan (2007). Excitatory and suppressive receptive field subunits in awake monkey primary visual cortex (V1).PNAS, 104, 19120–19125.Dominant and nondominant excitatory (E d and E nd ) andsuppressive (S) subunits of a cell. (Scale: 0.5°).Pooled spatial envelope of each group of subunits. Red, E;green, S. In E&S (all groups superimposed), yellowindicates overlap between E and S.Spatial-frequency spectrum of each subunit in A.Pooled frequency spectrum of each group.(C) Pooled spatial envelopes (upper rows) andfrequency spectra (lower rows) of the threesubunit groups for five cells.
Receptive Fields as a <strong>General</strong> Concept
RF in MotionAdelson, E. H. & Bergen, J. R. (1985). Spatiotemporal energy models for the perception of motion. J. Opt. Soc. Am. A 2, 284-299.
‘Second-order RFs (need of a nonlinearity)
RF in TextureDouble-opponencyFigure 1. <strong>General</strong>ized double opponency. (a) Classical, ON-center, OFF-surround receptive field (RF) that is both nonoriented andachromatic. If one assumes independent ON and OFF systems, such a unit can be looked on as double opponent in the polaritydomain. This interpretation is made explicit on the left-hand side, where the response profile of this RF is shown. (b) Typical chromatic,double-opponent RF. A unit of this type responds positively to a red (R) light in its center and to a green (G) light in its surround andreverses polarity when the positions of the two lights are reversed. (c) Hypothetical double-opponent RF in the orientation domain thatresponds to either luminance or chromatic contrasts. In its center such a unit will respond positively to a vertical bar of a given polarity(eg., bright or R) and negatively to a 245° bar of the same polarity. Responses are reversed in its surround. Note that the linearsuperposition of the two groups of three RF's (in the center and the surround) results in many ON and OFF lobes of different strengthsthat are reminiscent of the RF of a complex cell.<strong>Gorea</strong> A. & Papathomas, T.V. (1993). Double opponency as a generalized concept in texture segregation illustrated with stimuli defined by color, luminance, andorientation. J. Opt. Soc. Am. A, 10, 1450-1462.
<strong>General</strong> neural architecture
Psychophysics
Polat, U. & Sagi, D. (1993) Lateral interactions between spatial channels: suppression and facilitation revealed by lateralmasking experiments. Vision Research, 33, 993-997.
Freeman, Sagi, Driver (2004), Perception, 33, 181-194,
Figure 1. The binocular fusion problem: in the simple case of the diagram shown on theleft, there is no ambiguity and stereo reconstruction is a simple matter. In the more usualcase shown on the right, any of the four points in the left picture may, a priori, match anyof the four points in the right one. Only four of these correspondences are correct, theother ones yielding the incorrect reconstructions shown as small grey discsFigure 2. Eliminating 'false matches' in the stereo correspondence problem. A randomdot stereogram at the top shows left and right eyes' images for crossed or uncrossedfusion (pair on the left or right respectively). Marr and Poggio's [10] proposal forestablishing correct correspondences between dots in the two eyes' images is illustratedbelow, using only the dots highlighted in red (and dots from the same region of the lefteye's image). The algorithm requires matches to be made between dots of the samecolour, which gives rise to possible correspondences at all the nodes in the networkmarked by an open circle. Neighbouring matches with the same disparity support oneanother in the network, illustrated schematically by the green arrows (in their paper, thesupport extended farther). At the same time, matches along any line of sight (dottedlines) inhibit each other (since a ray reaching the eye must have come from only onesurface). These constraints are sufficient to eliminate all but the correct matches, shownhere along the main diagonal.
Figure 3. Horizontal cross-section of a disparity space.The constraint of uniqueness is implemented byletting all cells, along the two lines of sight, inhibiteach other.Figure 4. Vertical cross-section of a disparity-space.The constraint of continuity is implemented by lettingall active cells excite the cells, in neighboring columns,that representing similar binocular disparity.
Liage (binding)etContexte
Physiology and flocks
McManusa, Li & Gilberta, Adaptive shape processing in primary visual cortex. PNAS 2011A depiction of the theoretical association field (AF), showing the optimal contextual interactions for the white line at the center of the figure. In the AFtheory, the saliency of smooth contours derives from a broad set of local interactions between line segments; any line segment can be perceptuallylinked with a range of other segments, and salient contours are characterized by local segments whose interactions sum up over the length of thecontour. Given the relative positions of any two line segments, the strength of the interaction, or linkage, between them is a function of their relativeorientations. Here, given the position and orientation of the white bar, we show the orientation of the line segment at each spatial position thatelicits the strongest interaction with the white bar; the color of each segment specifies the strength of that linkage (warm colors, strong connection;cold colors, weak connection). In the standard AF model, the optimal interactions are between “cocircular” segments, which lie tangentially along thesame circular arc. The strongest of these effects are between nearby segments that lie along a circle with an infinite radius (i.e., a straight line); as theradius of the circular arc connecting the two segments decreases, the linkage becomes weaker. Psychophysically, the strength of the interactionbetween line segments refers to the tendency of the visual system to bind them together into a perceptual whole. Physiologically, it refers to theconnection strength between the neurons that are activated by the line segments. (Gray scale bar: 0.5°.)
‘RF’ in swarmingCouzin & Franks (2003). Self-organized lane formation and optimized traffic flow in army ants. Proc Roy Soc B, 270, 139-146.
‘RF’ in swarmingCouzin & Franks (2003). Self-organized lane formation and optimized traffic flow in army ants. Proc Roy Soc B, 270, 139-146.
Cross-Correlation & Binding
Spatio-temporal correlation:MOTIONN = 43
Spatio-temporal correlation:MOTIONN p = 5/40 6/35 6/32 37/37 51= .125 .17 .19 1.00
Spatio-temporal correlation:STEREOI. Create a random dot image.II. Copy image side by side.The Random Dot Stereogram is ready.III. Select a region of one image.IV. Shift (horizontally) this regionand fill in the blank space leftbehind with the random dots tobe replaced ahead.To “reveal” the “hidden” squarethe brain presumably computesthe cross-correlation betweenthe 2 images.
Neural crosscorrelationTransition from voltage signal recordings tomeasures of association for three neural spiketrains. (a) Voltage trace containing thespike events of three different neuronsrecorded on the same electrode. Each coloredstar indicates a different neuron. (b)Application of a spikesorting algorithm thatidentifies the spike events, determines thenumber of neurons and assigns each spikeevent to a particular neuron. The dottedvertical lines show a spike triplet identified bya spike pattern classification method. (c–f)Measures of association between the spiketrains from Cell 1 and Cell 2 computed usingan unnormalized cross-correlogram (c), aJPSTH (d), a parametric model fit by maximumlikelihood (e) and a cross-coherence function(f, solid black line) and confidence bounds (f,thin black line). The horizontal line in c is theupper 95% confidence bound. Correlationsabove this line are significantly different fromzero.Brown, Kass & Mitra (2004). Multiple neuralspike train data analysis: state-of-theartand future challenges. Nat. Neurosci, 7,456–461.
Synchronization & Binding
Neural oscillationsEmerging due to• Network properties• Feedback loops• NeurotransmittersInvolved in• Attention,• Internal clock mechs• Information transfer• Motor coordinationGray CM, König P, Engel AK, Singer W (1989). Oscillatory responses in cat visual cortex exhibit inter-columnarsynchronization which reflects global stimulus properties. Nature 338: 334–337.Singer W (1993). Synchronization of cortical activity and its putative role in information processing and learning.Annu Rev Physiol 55: 349–374.
Synfire chainsA synfire chain. Each neuron is depicted as a circle (the cell body), with a dendriteprotruding to the left, and a branching axon to the right. Synapses are symbolized bysmall triangles. The bold- faced drawing at the top left depicts one neuron. Theneurons of each pool are drawn one under the other. The layout of the chain doesnot represent the anatomy, but rather the order of activation in time. The sameneuron can be part of more than one pool. For example the two red neurons shownin the figure may be physically the same neuron. Repeated participation of the sameneurons can occur up to the limit of the synfire chain’s memory capacity.Abeles M. (1982) Local Cortical Circuits: An Electrophysiological study. Springer, Berlin.
Rank Order Coding
RANK ORDER CODINGA novel coding scheme that uses theorder in which cells fire spikes, ratherthan firing rates to encode information.It turns out that using such a code mayallow us recognize objects when as fewas 1% of the neurons in the visualpathways have fired a spike.Thorpe, S. J. (1990). Spike arrival times: A highly efficient coding scheme for neural networks. In R. Eckmiller, G.Hartmann & G. Hauske (Eds.), Parallel processing in neural systems and computers (pp. 91-94): North-HollandElsevier.
RANK ORDER CODINGNeurones can act as analoguelatencyconverters, with morestrongly activated neurones firingfirst. One can also use the order offiring (B > A > H > C > G > D > F > E)as a code. With eight neurones,there are 8! i.e. 40320 differentpossible orderings.Van Rullen R, Gautrais J, Delorme A, Thorpe S.(1998). Face processing using one spike perneurone. Biosystems 48: 229-39.PIKENET. Units F and G receive excitatorysynapses from the input units with variableweights. Unit S receives fixed excitatorysynapses from all the inputs and generatesshunting inhibition that progressivelydesensitizes units F and G as more and more ofthe inputs has fired.Thorpe et al. (2003). SpikeNet: real-time visual processingwith one spike per neuron. Neurocomp., 58–60, 857–864.
PART III
Perception and Action
Seeing is a way of acting. It is a particular way of exploring the environment. Theexperience of seeing occurs when the organism masters what we call the governinglaws of sensorimotor contingency*.O’Regan, J. K. & Noë, A. (2001). A sensorimotor account of vision and visual consciousness. Beh. & Brain Sci., 24,939–1031.*See Gibson’s ecological approach to visual perception and his concept of affordance.Gibson, J. J. (1966) The senses considered as perceptual systems. Houghton Mifflin.Gibson, J. J. (1979/1986) The ecological approach to visual perception. Erlbaum.
Efferent copy & Proprioception
A. Open-loop control: the controller, C, issues command/motor, M, signals without the benefit of feedback. B.Closed-loop scheme: the controller, C, gets feedback (S, for sensor readings) from the controlled/target, T, systemthat can be used to modify the command sequence. C. Pseudo-closed-loop control: the controller, C, gets thebenefit of feedback (as with closed-loop control) but this feedback (S', for mock, or predicted, sensor readings)does not come from the target system, but rather from an emulator, E, of the target system. Because theemulator is given a copy of the same input as the target system, and because the emulator's input-output functionis (close to) identical, the emulator's output will be similar to the sensor output produced by the target system.Rick Grush; http://mind.ucsd.edu/papers/pisml/pismlhtml/pisml-text.html
Schematic representation of the primate eye movement system.Robinson, D. A. (1968). Eye Movement Control in Primates. Science, 161, 1219-1224.
CorticobulbarTractICTTLGNSCExtraocular MusclesTPTMRFCerebellumMLFVNPRFSemicircular canalsRobinson, D. A. (1968). Eye Movement Control in Primates. Science, 161, 1219-1224.
Perception is Figure-Ground discrimination
Figure-FondRubin, 1915
Figure-Fond
Figure-GroundFig. 1. (a) Because of how we organize the top sceneinto figures and background, the ground regionsbetween the figures do not have shape. Notice howthe regions of background isolated below are shapesthat we do not perceive in the scene above (if this isparsed as a group of human semaphore signals). Thisdemonstration is based on a similar one in Kanizsa(1979). (b) Two halves of a disk have different shapes,even though they share the same bounding contour.This demonstration is based on Attneave (1974). Thepositive and negative curvature of the contour hasbeen labelled to show that when polarity changesfrom A to B (because of a change of where the insideof the figure is) the perceived shape is different.Marco Bertamini M. & Croucher C.J (2003).The shape of holes. Cognition 87, 33–54
Signal, Noise & Decision
PhysicalWorldSensoryProcessesInference &DecisionProcessesResponseBehavior
SLois /ContraintesphysiquesBLACK BOXRendogèneexogènepré-motriceverbalemotriceverbaleInvariantsNiveaux de traitement : Bas / Moyen / ElevéMécanismes / Filtres / Processus / Algorithmes / RéseauxDécisions / Biais / Expérience / Inférences / Référentiels /Contexte
PROBABABILITÉRÉPONSETHE STANDARD MODEL:SIGNAL DETECTION THEORYp(N)Rp(S)p(‘yes’│N) = p(R N >c)STIMULUSCRBruit SignalMiss 1FAc 0HitsOui FA HitNon CR Omiss.0CONTINUUM SENSORIELS Rd' z(Hits) z(FA)B c .5 z(H) z(FA) ; c z FA ( )Rp(‘yes’│S) = p(R S >c)
Ratcliff & McKoon (2008).The Diffusion Decision Model: Theory and Data for Two-Choice Decision Tasks. Neural Comp., 20,873–922.
Perception as inference (Helmholtz, 1867)Helmholtz, H. von, (1867/1962) Treatise on Physiological Optics vol. 3 (New York: Dover, 1962); English translation by J P C Southall forthe Optical Society of America (1925) from the 3rd German edition of Handbuch der physiologiscien Optik (first published in 1867,Leipzig: Voss)
Amodal completion
Liage (binding)etContexte
Bayes theorem