1756-RM001B-EN-P, Using ControlLogix in SIL2 ... - Tuv-fs.com
1756-RM001B-EN-P, Using ControlLogix in SIL2 ... - Tuv-fs.com 1756-RM001B-EN-P, Using ControlLogix in SIL2 ... - Tuv-fs.com
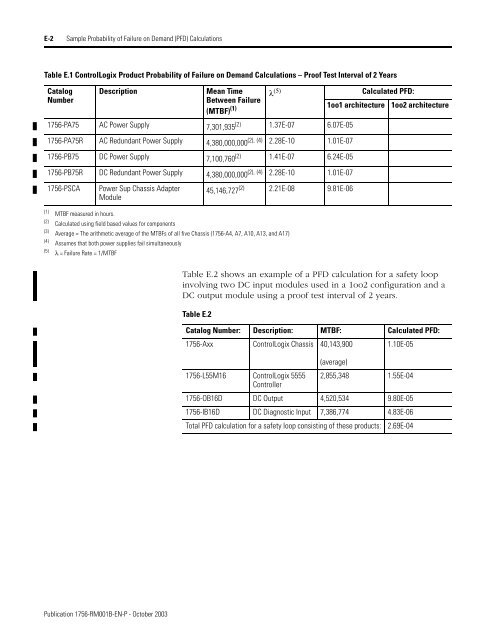
E-2 Sample Probability of Failure on Demand (PFD) CalculationsTable E.1 ControlLogix Product Probability of Failure on Demand Calculations – Proof Test Interval of 2 YearsCatalogNumberDescriptionMean Time λ (5) Calculated PFD:Between Failure(MTBF) (1) 1oo1 architecture 1oo2 architecture1756-PA75 AC Power Supply 7,301,935 (2) 1.37E-07 6.07E-051756-PA75R AC Redundant Power Supply 4,380,000,000 (2), (4) 2.28E-10 1.01E-071756-PB75 DC Power Supply 7,100,760 (2) 1.41E-07 6.24E-051756-PB75R DC Redundant Power Supply 4,380,000,000 (2), (4) 2.28E-10 1.01E-071756-PSCAPower Sup Chassis AdapterModule45,146,727 (2) 2.21E-08 9.81E-06(1) MTBF measured in hours.(2)Calculated using field based values for components(3)Average = The arithmetic average of the MTBFs of all five Chassis (1756-A4, A7, A10, A13, and A17)(4)Assumes that both power supplies fail simultaneously(5)λ = Failure Rate = 1/MTBFTable E.2 shows an example of a PFD calculation for a safety loopinvolving two DC input modules used in a 1oo2 configuration and aDC output module using a proof test interval of 2 years.Table E.2Catalog Number: Description: MTBF: Calculated PFD:1756-Axx ControlLogix Chassis 40,143,900 1.10E-05(average)1756-L55M16 ControlLogix 5555 2,855,348 1.55E-04Controller1756-OB16D DC Output 4,520,534 9.80E-051756-IB16D DC Diagnostic Input 7,386,774 4.83E-06Total PFD calculation for a safety loop consisting of these products: 2.69E-04Publication 1756-RM001B-EN-P - October 2003
Sample Probability of Failure on Demand (PFD) Calculations E-3Proof Test Interval = 4 YearsTable E.3 shows PFD calculations for a proof test interval of 4 years.Table E.3 ControlLogix Product Probability of Failure on Demand Calculations – Proof Test Interval of 2 YearsCatalogNumberDescription1756-Axx ControlLogix Chassis 40,143,919 (2)Mean Time λ (5) Calculated PFD:Between Failure(MTBF) (1) 1oo1 architecture 1oo2 architecture(average (3) )2.49E-082.19E-051756-CNB ControlNet Bridge 3,596,087 (2) 2.78E-07 2.45E-041756-CNBR Redundant ControlNet Bridge 3,385,813 (2) 2.95E-07 2.60E-041756-IA16I AC Isolated Input 4,144,192 2.41E-07 1.79E-051756-IA8D AC Diagnostic Input 3,856,320 2.59E-07 1.93E-051756-IB16D DC Diagnostic Input 7,386,774 1.35E-07 9.79E-061756-IB16I DC Isolated Input 3,562,624 2.81E-07 2.09E-051756-IF8 Analog Input 1,690,694 5.91E-07 4.71E-051756-IR6I RTD Input 3,456,960 2.89E-07 2.16E-051756-IT6I Thermocouple Input 4,784,000 2.09E-07 1.54E-051756-L55M16 ControlLogix 5555 Controller 2,855,348 (2) 3.50E-07 3.09E-041756-OA16I AC Isolated Output 1,994,720 5.01E-07 3.92E-051756-OA8D AC Diagnostic Output 3,839,680 2.60E-07 2.29E-041756-OB16D DC Diagnostic Output 4,520,534 2.21E-07 1.95E-041756-OB16I DC Isolated Output 1,703,520 5.87E-07 4.67E-051756-OB8EI DC Fused Output 1,239,680 8.07E-07 6.70E-051756-OF8 Analog Output 2,054,694 4.87E-07 3.79E-051756-OX8I Contact Output 6,639,360 1.51E-07 1.09E-051756-PA75 AC Power Supply 7,301,935 (2) 1.37E-07 1.21E-041756-PA75R AC Redundant Power Supply 4,380,000,000 (2), (4) 2.28E-10 2.01E-071756-PB75 DC Power Supply 7,100,760 (2) 1.41E-07 1.24E-041756-PB75R DC Redundant Power Supply 4,380,000,000 (2), (4) 2.28E-10 2.01E-071756-PSCAPower Sup Chassis AdapterModule45,146,727 (2) 2.21E-08 1.95E-05(1) MTBF measured in hours.(2) Calculated using field based values for components(3)(4)(5)Average = The arithmetic average of the MTBFs of all five Chassis (1756-A4, A7, A10, A13, and A17)Assumes that both power supplies fail simultaneouslyλ = Failure Rate = 1/MTBFPublication 1756-RM001B-EN-P - October 2003
- Page 56 and 57: 6-10 ControlLogix I/O ModulesWiring
- Page 58 and 59: 6-12 ControlLogix I/O ModulesApplic
- Page 60 and 61: 6-14 ControlLogix I/O Modules• Ch
- Page 62 and 63: 6-16 ControlLogix I/O ModulesWiring
- Page 64 and 65: 6-18 ControlLogix I/O ModulesWiring
- Page 66 and 67: 6-20 ControlLogix I/O ModulesUsing
- Page 68 and 69: 6-22 ControlLogix I/O ModulesFigure
- Page 70 and 71: 6-24 ControlLogix I/O ModulesWiring
- Page 72 and 73: 6-26 ControlLogix I/O ModulesCheckl
- Page 74 and 75: 7-2 Faults in the ControlLogix Syst
- Page 76 and 77: 7-4 Faults in the ControlLogix Syst
- Page 78 and 79: 8-2 General Requirements for Applic
- Page 80 and 81: 8-4 General Requirements for Applic
- Page 82 and 83: 8-6 General Requirements for Applic
- Page 84 and 85: 9-2 Technical SIL2 Requirements for
- Page 86 and 87: 9-4 Technical SIL2 Requirements for
- Page 88 and 89: 9-6 Technical SIL2 Requirements for
- Page 90 and 91: 9-8 Technical SIL2 Requirements for
- Page 92 and 93: 10-2 Use and Application of Human t
- Page 94 and 95: 10-4 Use and Application of Human t
- Page 96 and 97: A-2 Response Times in ControlLogixE
- Page 98 and 99: A-4 Response Times in ControlLogixR
- Page 100 and 101: B-2 System Self-Testing and User-Pr
- Page 102 and 103: C-2 Additional Information on Handl
- Page 104 and 105: D-2 Spurious Failure EstimatesNotes
- Page 108 and 109: E-4 Sample Probability of Failure o
- Page 110: 2 IndexMMean time between failures
E-2 Sample Probability of Failure on Demand (PFD) CalculationsTable E.1 <strong>ControlLogix</strong> Product Probability of Failure on Demand Calculations – Proof Test Interval of 2 YearsCatalogNumberDescriptionMean Time λ (5) Calculated PFD:Between Failure(MTBF) (1) 1oo1 architecture 1oo2 architecture<strong>1756</strong>-PA75 AC Power Supply 7,301,935 (2) 1.37E-07 6.07E-05<strong>1756</strong>-PA75R AC Redundant Power Supply 4,380,000,000 (2), (4) 2.28E-10 1.01E-07<strong>1756</strong>-PB75 DC Power Supply 7,100,760 (2) 1.41E-07 6.24E-05<strong>1756</strong>-PB75R DC Redundant Power Supply 4,380,000,000 (2), (4) 2.28E-10 1.01E-07<strong>1756</strong>-PSCAPower Sup Chassis AdapterModule45,146,727 (2) 2.21E-08 9.81E-06(1) MTBF measured <strong>in</strong> hours.(2)Calculated us<strong>in</strong>g field based values for <strong>com</strong>ponents(3)Average = The arithmetic average of the MTBFs of all five Chassis (<strong>1756</strong>-A4, A7, A10, A13, and A17)(4)Assumes that both power supplies fail simultaneously(5)λ = Failure Rate = 1/MTBFTable E.2 shows an example of a PFD calculation for a safety loop<strong>in</strong>volv<strong>in</strong>g two DC <strong>in</strong>put modules used <strong>in</strong> a 1oo2 configuration and aDC output module us<strong>in</strong>g a proof test <strong>in</strong>terval of 2 years.Table E.2Catalog Number: Description: MTBF: Calculated PFD:<strong>1756</strong>-Axx <strong>ControlLogix</strong> Chassis 40,143,900 1.10E-05(average)<strong>1756</strong>-L55M16 <strong>ControlLogix</strong> 5555 2,855,348 1.55E-04Controller<strong>1756</strong>-OB16D DC Output 4,520,534 9.80E-05<strong>1756</strong>-IB16D DC Diagnostic Input 7,386,774 4.83E-06Total PFD calculation for a safety loop consist<strong>in</strong>g of these products: 2.69E-04Publication <strong>1756</strong>-<strong>RM001B</strong>-<strong>EN</strong>-P - October 2003


