5184/05 mc 1 DG B III COUNCIL OF THE EUROPEAN ... - consilium
5184/05 mc 1 DG B III COUNCIL OF THE EUROPEAN ... - consilium
5184/05 mc 1 DG B III COUNCIL OF THE EUROPEAN ... - consilium

Create successful ePaper yourself
Turn your PDF publications into a flip-book with our unique Google optimized e-Paper software.
<strong>COUNCIL</strong> <strong>OF</strong><br />
<strong>THE</strong> <strong>EUROPEAN</strong> UNION<br />
Brussels, 10 January 20<strong>05</strong><br />
<strong>5184</strong>/<strong>05</strong><br />
PECHE 5<br />
COVER NOTE<br />
from: Secretary-General of the European Commission,<br />
signed by Ms Patricia BUGNOT, Director<br />
date of receipt: 15 December 2004<br />
to: Mr Javier SOLANA, Secretary-General/High Representative<br />
Subject: COMMISSION STAFF WORKING DOCUMENT<br />
Annex to the annual report from the Commission to the Council and the<br />
European Parliament on Member States' efforts during 2003 to achieve a<br />
sustainable balance between fishing capacity and fishing opportunities<br />
Delegations will find attached Commission document SEC(2004) 1559.<br />
Encl.: SEC(2004) 1559<br />
________________________<br />
<strong>5184</strong>/<strong>05</strong> <strong>mc</strong> 1<br />
<strong>DG</strong> B <strong>III</strong> EN
COMMISSION <strong>OF</strong> <strong>THE</strong> <strong>EUROPEAN</strong> COMMUNITIES<br />
Brussels, 14.12.2004<br />
SEC(2004) 1559<br />
COMMISSION STAFF WORKING DOCUMENT<br />
Annex to the<br />
ANNUAL REPORT FROM <strong>THE</strong> COMMISSION TO <strong>THE</strong> <strong>COUNCIL</strong> AND <strong>THE</strong><br />
<strong>EUROPEAN</strong> PARLIAMENT<br />
on Member States’ efforts during 2003 to achieve a sustainable balance between fishing<br />
capacity and fishing opportunities<br />
{COM(2004) 799 final}
TABLE <strong>OF</strong> CONTENTS<br />
I. MEMBER STATES’ ANNUAL REPORTS ....................................................................... 3<br />
BELGIUM.................................................................................................................................. 3<br />
GERMANY................................................................................................................................ 6<br />
DENMARK.............................................................................................................................. 13<br />
SPAIN (EXCLUDING <strong>THE</strong> CANARY ISLANDS) .......................................................................... 27<br />
FINLAND ................................................................................................................................ 28<br />
FRANCE (EXCLUDING <strong>THE</strong> FRENCH OVERSEAS DEPARTMENTS)......................................... 32<br />
UNITED KINGDOM............................................................................................................... 40<br />
GREECE .................................................................................................................................. 52<br />
IRELAND ................................................................................................................................ 57<br />
ITALY...................................................................................................................................... 62<br />
NE<strong>THE</strong>RLANDS..................................................................................................................... 79<br />
PORTUGAL (EXCLUDING <strong>THE</strong> AZORES AND MADEIRA) ....................................................... 83<br />
SWEDEN ................................................................................................................................. 87<br />
IIA SUMMARY <strong>OF</strong> <strong>THE</strong> COMMITTEE FOR FISHERIES AND AQUACULTURE, BRUSSELS,<br />
9 SEPTEMBER 2004 - “COMMISSION ANNUAL REPORT ON <strong>THE</strong> FLEETS <strong>OF</strong> <strong>THE</strong> MEMBER<br />
STATES FOR 2003” .................................................................................................................. 92<br />
IIB. SUMMARY <strong>OF</strong> <strong>THE</strong> COMMITTEE FOR FISHERIES AND AQUACULTURE, BRUSSELS,<br />
13 OCTOBER 2004 – OPINION <strong>OF</strong> <strong>THE</strong> COMMITTEE ON <strong>THE</strong> COMMISSION’S ANNUAL<br />
REPORT ON <strong>THE</strong> ENTRY/EXIT REGIME AND REFERENCE LEVELS FOR <strong>THE</strong> FLEET................. 95<br />
<strong>III</strong>. OPINION <strong>OF</strong> <strong>THE</strong> STECF ON ANNUAL REPORT FROM <strong>THE</strong> COMMISSION TO <strong>THE</strong><br />
<strong>COUNCIL</strong> AND <strong>THE</strong> <strong>EUROPEAN</strong> PARLIAMENT ON MEMBER STATES’ EFFORTS DURING 2003<br />
TO ACHIEVE A SUSTAINABLE BALANCE BETWEEN FISHING CAPACITY AND FISHING<br />
OPPORTUNITIES........................................................................................................................ 97<br />
2
BELGIUM<br />
Jaarverslag - periode 01/01/2003 tot en 31/12/2003 – BELGIË<br />
Artikel 12 en 13 van Verordening (EG) nr. 1438/2003 van de Commissie van 12 augustus<br />
2003 tot vaststelling van bepalingen ter uitvoering van het gemeenschappelijk vlootbeleid als<br />
omschreven in hoofdstuk <strong>III</strong> van Verordening (EG) nr. 2371/2002 van de Raad<br />
1. Beschrijving vissersvloot<br />
Op 1 januari 2003 telde de Belgische vissersvloot 130 eenheden. In de loop van het jaar<br />
werden 5 vaartuigen onttrokken aan de vloot zodanig dat de vloot op 31 december 2003 nog<br />
125 vaartuigen telde. Opgesplitst naar visserij-uitrusting waren 117 vaartuigen uitgerust voor<br />
de boomkorvisserij, 5 voor de visserij met de planken en 3 voor de warrelnetvisserij.<br />
In 2003 heeft de Belgische vloot een aanvoer van visserijproducten gerealiseerd van 23.637<br />
ton. 20.107 ton daarvan werd aangevoerd in de Belgische havens Zeebrugge, Oostende of<br />
Nieuwpoort. De rest, hetzij 3.530 ton werd aangevoerd in buitenlandse havens.<br />
De totale aanvoer vertegenwoordigde een waarde van 90.364.000 euro. De aanvoer van<br />
20.107 ton in het buitenland vertegenwoordigde 12.155.000 euro.<br />
2. Capaciteitsbewegingen binnen de vloot – entry - exit<br />
� Capaciteit van de vloot op 01 januari 2003: 67.774 kW en 24.267 GT<br />
� Toevoegingen van vaartuigen met of zonder overheidssteun in het jaar 2003: nihil<br />
GT100 = 0 en kW100= 0<br />
Vermindering van de referentieniveaus met 3 %: niet van toepassing.<br />
� Onttrekkingen van vaartuigen zonder overheidssteun: 1.529 kW en 482 GT<br />
o O.720 – Geoffrey William – 219 kW en 41 GT – Vlootregister: 13/03/2003<br />
o O.455 – Celtic – 184 kW en 28 GT – Vlootregister: 14/<strong>05</strong>/2003<br />
o O.306 – Cleaner – 221 kW en 101 GT – Vlootregister: 29/07/2003<br />
o Z.184 – Linquenda – 684 kW en 202 GT – Vlootregister <strong>05</strong>/08/2003<br />
o O.274 – Lucali – 221 kW en 110 GT – Vlootregister 23/10/2003<br />
� Toevoeging van motorvermogen zonder overheidssteun:<br />
Motorvermogen (kW) kan worden toegevoegd aan de vloot via het instrument van de<br />
samenvoeging (Koninklijk besluit van 21 juni 1994 zoals gewijzigd). Concreet betekent<br />
dit dat de onttrokken kW’s (1.529 kW) van deze 5 vaartuigen worden samengevoegd met<br />
het motorvermogen van andere bestaande vaartuigen van de vloot. De tonnage van deze 5<br />
vaartuigen (482 GT) kan niet worden samengevoegd en gaat verloren.<br />
� Toevoeging van capaciteit op basis van een administratieve beslissing: 221 kW en 0 GT.<br />
3
Het betreft 221 kW van het vaartuig ex. Z.548 – Flamingo - dat gezonken is op<br />
23/07/2002 (eigenaars van vissersvaartuigen behouden gedurende 3 jaar hun rechten op de<br />
visvergunning nadat het vaartuig van de visvergunning is geschrapt – cfr. Koninklijk<br />
Besluit 21 juni 1994, zoals gewijzigd).<br />
� In 2003 werden 624 kW samengevoegd naar andere bestaande vaartuigen, als volgt:<br />
o Z.45 – Stephanie – 75 kW – vlootregister 29/08/2003<br />
o Z.59 – Gudrun – 75 kW – vlootregister 13/08/2003<br />
o Z.196 – Zeeduivel – 114 kW – vlootregister 26/08/2003<br />
o O.396 – Sabrina – 13 kW – vlootregister 25/07/2003<br />
o Z.510 – Dennis – 75 kW – vlootregister 06/10/2003<br />
o Z.526 – Vaya Con Dios – 104 kW – vlootregister 18/12/2003<br />
o Z.548 – Flamingo – 84 kW – vlootregister 03/11/2003<br />
o Z.571 – Custos Deus – 51 kW – vlootregister 04/06/2003<br />
o O.700 – Bi-Si-Ti – 33 kW – vlootregister 11/12/2003<br />
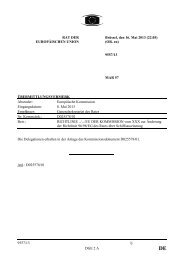
� Capaciteit van de vloot op 31 december 2003: 66.869 kW en 23.785 GT<br />
Toestand op 01/01/2003<br />
Onttrekkingen<br />
Toegevoegd via samenvoeging<br />
4<br />
Motorvermogen (kW) Tonnage (GT)<br />
67.774<br />
- 1.529<br />
+ 624<br />
24.267<br />
- 482<br />
0<br />
Toestand op 31/12/2003 66.869 23.785<br />
� Conclusie<br />
In de loop van 2003 is het motorvermogen van de Belgische vloot verminderd met 9<strong>05</strong><br />
kW en met 482 GT.<br />
3. Referentieniveaus<br />
De referentieniveaus die voor België werden vastgesteld bij Verordening (EG) nr. 1438/2003<br />
van de Commissie zijn 67.857 kW en 23.372 GT.<br />
Zowel in het begin als eind 2003 werd het referentieniveau uitgedrukt in kW<br />
gerespecteerd.<br />
Op 1 januari 2003 was het referentieniveau voor de tonnage, uitgedrukt in GT, overschreden<br />
met 895 GT. Op 31 december 2003 bedroeg de overschrijding nog 413 GT.<br />
In toepassing van artikel 16 van Verordening (EG) nr. 2371/2002 van de Raad van 20<br />
december 2002 inzake de instandhouding en de duurzame exploitatie van de visbestanden in<br />
het kader van het gemeenschappelijk visserijbeleid werd België op 27 november 2003<br />
gehoord door de Commissie.<br />
De gemeenschappelijke conclusie was dat België er alles aan doet om de capaciteit van de<br />
vloot te verlagen teneinde te kunnen voldoen aan de vastgestelde referentieniveaus en aldus<br />
het steunregime te kunnen reactiveren.
De vooruitzichten voor 2004 bestaan er in de referentieniveaus te onderschrijden. Daarvoor<br />
zal een beperkte sloopronde worden georganiseerd terwijl zal getracht worden de tonnage<br />
verder af te bouwen met het instrument van de samenvoeging.<br />
4. Verhoging van tonnage – artikel 11, lid 5 van Verordening (EG) nr. 2371/2002<br />
Niet van toepassing in 2003.<br />
5. Effect van de herstelplannen<br />
De ganse Belgische vloot vist in de Noordzee. Vanaf 1 februari 2003 was bijlage 17 van de<br />
quotaverordening nr. 2341/2002 van de raad van 20 december 2002 van toepassing. Met<br />
uitzondering van de garnalenvloot werden beperkingen opgelegd ingevolge bijlage 17. De<br />
boomkorvloot die vist met een maaswijdte van 80 mm kreeg 15 dagen per maand.<br />
Het Belgische systeem voorziet op jaarbasis een totaal aantal toegelaten vaartdagen per<br />
vaartuig, geldig voor alle gebieden. Terwijl enerzijds in 2001 dit totaal nog 285 vaartdagen<br />
bedroeg, werd het in 2003 verminderd tot 255 en moet anderzijds worden vastgesteld dat de<br />
beperking op de vaartdagen er niet heeft toe geleid dat de beschikbare quota niet konden<br />
worden opgevist.<br />
6. Beheer van de vloot<br />
De sterkte van het Belgische systeem is het bestaande stelsel van de visvergunningen zoals<br />
vastgelegd in het Koninklijk besluit van 21 juni 1994, zoals gewijzigd.<br />
Op een bestaande visvergunning kan ten allen tijde een ander (nieuwbouw met of zonder<br />
staatssteun of tweedehands) vaartuig worden geplaatst waarbij het ingebrachte vaartuig<br />
slechts een tonnenmaat mag hebben die gelijk is 0,3 maal het onttrokken motorvermogen.<br />
Het resultaat van dergelijke maatregel in de praktijk is dat geen enkel nieuwbouwvaartuig<br />
werd gerealiseerd in de loop van het communautaire structuurprogramma 2000-2006.<br />
Voorlopig is de zwakke schakel dat binnen de context van de Belgische vloot voor vaartuigen<br />
met een motorvermogen van 221 kW of minder het theoretisch zou mogelijk zijn dat<br />
ingevolge de 0,3 coëfficiënt de tonnage van een individueel vervangend vaartuig nog licht zou<br />
kunnen stijgen.<br />
In de loop van 2004 zijn er vooruitzichten om het Koninklijk besluit van 21 juni 1994, zoals<br />
gewijzigd, te herwerken zodanig dat de tonnage op het vlak van een individueel vaartuig<br />
herleid wordt tot hoogstens een entry -exit van 1 : 1.<br />
5
GERMANY<br />
Bundesministerium für Verbraucherschutz, Ernährung und Landwirtschaft<br />
- Dienstsitz Berlin - 11<strong>05</strong>5 Berlin<br />
Europäische Kommission<br />
Generaldirektion Fischerei<br />
Strukturpolitik<br />
Rue de la Loi 200<br />
B-1049 Brüssel<br />
6<br />
VA Heinz-Werner Anton<br />
Referat 621<br />
HAUSANSCHRIFT Wilhelmstraße 54, 10117 Berlin<br />
TEL +49 (0)1888 529 - 3598<br />
FAX +49 (0)1888 529 - 3276<br />
E-MAIL heinz.anton@bmvel.bund.de<br />
INTERNET www.verbraucherministerium.de<br />
AZ 621-1290-4/4<br />
DATUM 29. April 2004<br />
Jährlicher Bericht an die Europäische Kommission nach Artikel 12 und 13 der<br />
Verordnung (EG) Nr. 1438/2003 über die Maßnahmen zur Herstellung eines<br />
dauerhaften Gleichgewichts zwischen den Fangkapazitäten und den Fangmöglichkeiten<br />
der deutschen Fischereiflotte im Jahr 2003<br />
Der Bericht ist nach Artikel 12 Absatz 1 der o. g. Verordnung elektronisch zu<br />
übermitteln.<br />
1. Beschreibung der Fangflotten für die einzelnen Fischerei<br />
(Die Beschreibung erfolgt nach der für das MAP IV gültigen Segmentierung.)<br />
Die deutsche Fischereiflotte verringerte sich in 2003 um 35 Fischereifahrzeuge (-2%).<br />
Dies entspricht einer Reduzierung der Tonnage um 3.225 BRZ (-5%) und der<br />
Motorleistung um 3.614 kW (-2%). Die Veränderungen der Flotte sind in Anhang 1<br />
dargestellt.<br />
Die Anzahl befischter Bestände pro Fischereisegment bzw. welche Bestände von welchen<br />
Segmenten befischt wurden, ist in Anhang 2 dargestellt. Die aufgeführten Bestände sind<br />
die wichtigsten für die deutsche Fischerei. Die Bestandseinschätzungen (Anhang 3)<br />
beziehen sich auf die Angaben des ICES zum Ende 2002, da die Bewertung der Bestände<br />
für 2003 erst im Mai 2004 stattfindet.<br />
1.1 Segment 4C1<br />
Es schieden 31 Fahrzeuge (-2%) aus. Dies entspricht einer Verringerung der<br />
Tonnage um 83 BRZ (-2%) und der Motorleistung um 328 kW (-1%).<br />
Die Fahrzeuge befischten vier Bestände, von denen sich drei außerhalb sicherer<br />
biologischer Grenzen (SBG) befinden (Dorsch (Ostsee), Seezunge (Nordsee),<br />
Scholle (Nordsee) und einen Bestand, für den ein negativer Trend angenommen<br />
wird (Hering (Ostsee)). Der Kapazitätsabbau in diesem Segments folgte der<br />
Bestandsentwicklung.<br />
1.2 Segment 4C2<br />
Die Anzahl der Fahrzeuge verringerte sich nicht. Es erfolgte jedoch eine<br />
Kapazitätsreduzierung um 162 BRZ (-9%) und 74 kW (-1%).
Ein Teil der Fahrzeuge fischte in der Ostsee und in der Nordsee, ein anderer Teil in den<br />
Gewässern westlich der Britischen Inseln hauptsächlich mit Stellnetzen.<br />
In der Nordsee wurde der Kabeljau befischt, in der Ostsee der Dorsch sowie der<br />
Hering. Kabeljau und Dorsch befinden sich außerhalb sicherer biologischer<br />
Grenzen, für den Hering in der Ostsee wird ein negativer Trend angenommen.<br />
In den Gewässern westlich der Britischen Inseln zielte die Fischerei auf Haie und<br />
Taschenkrebse. Für diese Bestände gibt es keine Bestandsabschätzungen. Jedoch<br />
werden alle Hai-Bestände generell als gefährdet eingestuft. Der Kapazitätsabbau in<br />
diesem Segment trug dem Rechnung.<br />
1.3 Segment 4C3<br />
Die Anzahl verringerte sich um 8 Fahrzeuge (-7%). Während sich die Tonnage um<br />
26 BRZ leicht erhöhte, verringerte sich die Motorleistung um 1.<strong>05</strong>5 kW (-4%).<br />
Die Fahrzeuge in diesem Segment befischten in der Ostsee den Dorsch, den Hering<br />
und den Sprott. Der Dorschbestand befindet sich außerhalb sicherer biologischer<br />
Grenzen, für den Hering wird ein negativer Trend angenommen, während der<br />
Sprottbestand unverändert ist.<br />
In der Nordsee wurden Kabeljau und Seelachs befischt. Der Nordseekabeljau<br />
befindet sich außerhalb sicherer biologischer Grenzen, während sich der Seelachs<br />
in der Nordsee positiv entwickelt. Drei der befischten Bestände werden negativ<br />
eingestuft, zwei unverändert bzw. positiv. Der Kapazitätsrückgang in diesem<br />
Segment folgte der Bestandsentwicklung.<br />
1.4 Segment 4C4<br />
Aus dem Segment schied ein Fahrzeug aus. Dadurch verminderte sich die Tonnage<br />
um 249 BRZ. Bei der Motorleistung war eine Erhöhung um 150 kW (+2%) zu<br />
verzeichnen.<br />
Die Fahrzeuge befischten hauptsächlich die Plattfischbestände in der Nordsee. Für<br />
den Bestand der Rauhen Scharbe gibt es keine Bestandsabschätzung. Die Scholle<br />
befindet sich außerhalb sicherer biologischer Grenzen, die Seezunge ebenfalls aber<br />
mit positivem Trend. Trotz des leichten Anwachsens der Motorleistung ist die<br />
Kapazitätsentwicklung insgesamt jedoch vertretbar.<br />
1.5 Segment 4C5<br />
Zwei Fahrzeuge schieden aus dem Segment aus (-1%). Die Tonnage verringerte<br />
sich um 43 BRZ (knapp 0,5%); die Motorleistung stieg um 337 kW (+1%). Mit<br />
49.625 kW liegt die Gesamtmotorleistung aber deutlich unter der in der<br />
Verordnung (EG) Nr. 1922/1999 festgesetzten Obergrenze von 53.552 kW.<br />
In der Nordsee waren die Nordseekrabbe, Scholle und Kabeljau die meist<br />
befischten Arten. Für die Nordseekrabben gibt es auf Grund der Bestandslage<br />
bisher keine Veranlassung für eine Quotierung. Kabeljau und Scholle befinden sich<br />
außerhalb sicherer biologischer Grenzen. In der Ostsee wurde zeitweise der Dorsch<br />
befischt, der sich außerhalb sicherer biologischer Grenzen befindet.<br />
Die Kapazitätsentwicklung in dem Segment war in etwa im Gleichgewicht mit der<br />
Entwicklung der befischten Bestände.<br />
7
1.6 Segment 4C6<br />
In diesem Segment gab es keine Kapazitätsveränderungen.<br />
Von den drei Fahrzeugen wurden sieben pelagische Bestände befischt. Für den Stöcker in der<br />
Nordsee gibt es keine Bestandsabschätzung. Der Zustand des Atlanto-Skandischen Herings,<br />
des Nordseeherings und des Herings südwestlich<br />
Irlands wird nicht als kritisch angesehen. Der Makrelenbestand in der Nordsee ist<br />
zusammengebrochen. Die westliche Komponente des Makrelenbestandes und der<br />
Blaue Wittling werden außerhalb sicherer biologischer Grenzen bewirtschaftet, d.h.<br />
die fischereiliche Sterblichkeit ist zu hoch, jedoch ist die Laicherbiomasse über<br />
dem kritischen Wert.<br />
Der Zustand von drei befischten Bestände ist zwar kritisch, wird jedoch durch den<br />
Zustand von drei anderen Beständen relativiert, so dass der derzeitige<br />
Kapazitätsstand noch als vertretbar angesehen werden kann.<br />
1.7 Segment 4C7<br />
Durch das Ausscheiden eines Fahrzeugs sank die Kapazität um 3.071 BRZ (-16%)<br />
und 3.530 kW (-15%).<br />
Von den Fahrzeugen wurden vier demersale und zwei pelagische Bestände<br />
befischt. Davon wird der Arkto-Norwegische Kabeljau außerhalb sicherer<br />
biologischer Grenzen befischt, befindet sich aber oberhalb der kritischen Biomasse.<br />
Die Tendenz für den Bestand wird positiv beurteilt. Alle anderen befischten<br />
Bestände werden nicht als kritisch betrachtet.<br />
Hinsichtlich des Zustands der befischten Bestände ist ein Kapazitätsabbau nicht<br />
erforderlich.<br />
1.8 Segment 4CZ<br />
Das Segment beinhaltet die Muschelfahrzeuge und Fahrzeuge ausschließlich für<br />
den Fang unquotierter Arten. Während die Muschelfahrzeuge ganz überwiegend in<br />
den Muschelkulturen eingesetzt wurden, wurden die übrigen Fahrzeuge -<br />
ausschließlich Kleinfahrzeuge – für die Fischerei auf unquotierte Arten,<br />
insbesondere Süßwasserarten eingesetzt.<br />
2. Auswirkungen von Fischereiaufwandsbeschränkungen<br />
Aufgrund der geringen Größe der deutschen Fischereiflotte haben sich im Jahr 2003<br />
Fischereiaufwandsbeschränkungen auf die Fangkapazitäten nicht ausgewirkt.<br />
3. Angaben über die Einhaltung der Zu- und Abgangsregelungen und der Zielgröße<br />
Referenzgrößen Deutschland zum 1. Januar 2003: 84.262 BRZ<br />
175.927 kW<br />
(VO (EG) Nr. 1438/2003 Anhang I)<br />
Flottenstand zum 1. Januar 2004:<br />
66.002 BRZ 160.248 kW<br />
Zugänge im Jahr 2003:<br />
1.450 BRZ 5.319 kW<br />
Abgänge im Jahr 2003:<br />
4.783 BRZ 10.211 kW<br />
8
1. Im Jahr 2003 gab es keine Kapazitätszugänge nach Artikel 11 Absatz 5 der<br />
Verordnung (EG) Nr. 2371/2002.<br />
2. Im Jahr 2003 gab es keine Kapazitätszugänge nach Artikel 13 Absatz 1<br />
Buchstabe b der Verordnung (EG) Nr. 2371/2002 in Verbindung mit Artikel 9 Absatz<br />
1 Buchstabe b (Zugänge mit öffentlicher Förderung von Fahrzeugen >100 BRZ und
Anhang 1<br />
Übersicht über die Kapazitätsänderungen im Jahr 2003<br />
Stand der dt. Fischereiflotte am 31.12.2002<br />
Segment Anzahl der Fifa Summe BRZ Summe kW<br />
4C1 1.693 3.837 30.927<br />
4C2 25 1.790 5.235<br />
4C3 119 9.091 29.610<br />
4C4 7 1.800 6.303<br />
4C5 291 12.404 49.288<br />
4C6 3 18.1<strong>05</strong> 12.841<br />
4C7 9 19.716 22.832<br />
4CZ 100 2.484 6.826<br />
gesamt: 2.247 69.227 163.862<br />
Stand der dt. Fischereiflotte am 31.12.2003<br />
Segment Anzahl der Fifa Summe BRZ Summe kW<br />
4C1 1.662 3.754 30.599<br />
4C2 25 1.628 5.161<br />
4C3 111 9.117 28.555<br />
4C4 6 1.551 6.453<br />
4C5 289 12.361 49.625<br />
4C6 3 18.1<strong>05</strong> 12.841<br />
4C7 8 16.645 19.302<br />
4CZ 108 2.841 7.712<br />
gesamt: 2.212 66.002 160.248<br />
Absolute Änderung 2003 zum Vorjahr<br />
Segment Anzahl der Fifa Summe BRZ Summe kW<br />
4C1 -31 -83 -328<br />
4C2 0 -162 -74<br />
4C3 -8 26 -1.<strong>05</strong>5<br />
4C4 -1 -249 150<br />
4C5 -2 -43 337<br />
4C6 0 0 0<br />
4C7 -1 -3.071 -3.530<br />
4CZ 8 357 886<br />
gesamt: -35 -3.225 -3.614<br />
Relative Änderung 2003 zum Vorjahr<br />
Segment Anzahl der Fifa Summe BRZ Summe kW<br />
4C1 -2% -2% -1%<br />
4C2 0% -9% -1%<br />
4C3 -7% 0% -4%<br />
4C4 -14% -14% 2%<br />
4C5 -1% 0% 1%<br />
4C6 0% 0% 0%<br />
4C7 -11% -16% -15%<br />
4CZ 8% 14% 13%<br />
10
Anhang 2<br />
Segment<br />
Bestand 4C1 4C2 4C3 4C4 4C5 4C6 4C7 4CZ Anz. Segmente<br />
Atlanto-Skandischer Hering X 1<br />
Blauer Wittling Nordostatlantik X 1<br />
Dorsch Ostsee X X X X 4<br />
Haie südwestl. Irland X 1<br />
Hering Nordsee X X 2<br />
Hering Ostsee X X X 3<br />
Hering westl. Schottland X 1<br />
Kabeljau Nordsee X X X 3<br />
Kabeljau Norwegen X 1<br />
Makrele Nordsee X 1<br />
Makrele westl. Bestand X 1<br />
Miesmuscheln Nordsee X 1<br />
Nordseekrabben X 1<br />
Rotbarsch Irminger See X 1<br />
Scharbe Nordsee X 1<br />
Scholle Nordsee X X X 3<br />
Schwarzer Heilbutt Ostgrönland X 1<br />
Schwarzer Heilbutt Westgrönland X 1<br />
Seelachs Nordsee X 1<br />
Seezunge Nordsee X X 2<br />
Sprott Ostsee X 1<br />
Stöcker Nordsee X X 2<br />
Stöcker südwest. Irland X 1<br />
Taschenkrebse westl. GB X 1<br />
Anz. befischter Bestände 4 5 5 4 4 7 6 1<br />
11
Anhang 3<br />
Änder. Fahrzeuge Änderung BRZ Änderung kW Änder. Fahrzeuge % Änder. BRZ % Ander. kW % Bestand Bestandsentwicklung 2002 - 2003<br />
Flottensegment 2002 - 2003 2002 - 2003 2002 - 2003 2002 - 2003 2002 - 2003 2002 - 2003 Trend<br />
4C1 -31 -83 -328 -2% -2% -1% Dorsch Ostsee außerhalb SBG<br />
Hering Ostsee unsicheres Assessment, Trend negativ<br />
Seezunge Nordsee außerhalb SBG, Trend positiv<br />
Scholle Nordsee außerhalb SBG, Trend negativ<br />
4C2 0 -162 -74 0% -9% -1% Dorsch Ostsee außerhalb SBG<br />
Hering Ostsee unsicheres Assessment, Trend negativ<br />
Kabeljau Nordsee außerhalb SBG<br />
Taschenkrebse west. GB kein Assessment<br />
Haie südwestl. Irland kein Assessment<br />
4C3 -8 26 -1<strong>05</strong>5 -7% 0% -4% Dorsch Ostsee außerhalb SBG<br />
Hering Ostsee unsicheres Assessment, Trend negativ<br />
Sprott Ostsee status quo<br />
Kabeljau Nordsee außerhalb SBG<br />
Seelachs Nordsee positiv<br />
4C4 -1 -249 150 -14% -14% 2% Scholle Nordsee außerhalb SBG, Trend negativ<br />
Seezunge Nordsee außerhalb SBG, Trend positiv<br />
Scharbe Nordsee kein Assessment<br />
Stöcker Nordsee kein Assessment<br />
4C5 -2 -43 337 -1% 0% 1% Dorsch Ostsee außerhalb SBG<br />
Kabeljau Nordsee außerhalb SBG<br />
Scholle Nordsee außerhalb SBG, Trend negativ<br />
Nordseekrabben kein Assessment<br />
4C6 0 0 0 0% 0% 0% Atlanto-Skandischer Hering status quo<br />
Hering Nordsee status quo<br />
Stöcker Nordsee kein Assessment<br />
Stöcker südwest. Irland status quo<br />
Makrele Nordsee Betand zusammengebrochen<br />
Makrele westl. Komponente bewirtschaftet außerhalb SBG<br />
Blauer Wittling Nordostatlantik bewirtschaftet außerhalb SBG<br />
4C7 -1 -3071 -3530 -11% -16% -15% Kabeljau Norwegen bewirtschaftet außerhalb SBG<br />
Rotbarsch Irminger See status quo<br />
Schwarzer Heilbutt Ostgrönland status quo<br />
Schwarzer Heilbutt Westgrönland status quo<br />
Hering Nordsee status quo<br />
Hering westl. Schottland status quo<br />
4CZ 8 357 886 8% 14% 13% Miesmuscheln Nordsee kein Assessment<br />
gesamt: -35 -3225 -3614 -2% -5% -2%<br />
12
DENMARK<br />
Annual Report on fishing fleet capacity - Denmark<br />
Article 11 of Council Regulation 2371/2002 which states an obligation for Member States to<br />
put in place measures to adjust the fishing capacity of their fleets in order to achieve a stable<br />
and lasting balance between such fishing capacity and their fishing opportunities, constitutes a<br />
key element in the reformed common fisheries policy.<br />
Member States must send the Commission a report describing the results of their efforts in<br />
this respect in the preceding year, cf. article 14 in the above regulation 1 .<br />
The obligation to produce a yearly report on the state of the fleet is thus directly linked to<br />
Article 11. The yearly report may prove to be central instrument, contributing to transparency<br />
and increased focus on fleet policy and fishing capacity.<br />
The Commission statement on art. 14 2 emphasises that the report should describe the<br />
development of fleet capacity in nominal and real terms using inter alia data on actual and<br />
potential effort.<br />
Implementing rules are laid down in art. 12 and 13 in Commission Regulation (EEC) No.<br />
1438/2003 3 .<br />
Non-compliance with the new capacity regime leads to suspension of financial assistance<br />
under Council Regulation (EC) No 2792/1999 (FIFG) and the Member State has to<br />
compensate over-capacity by effort reduction.<br />
1 The deadline is 30 April each year. At a later stage the Commission shall present to the Council and the European Parliament in<br />
writing an overview, attaching the Member States reports and the opinions of the STECF and the Committee for Fisheries and<br />
Aquaculture.<br />
2 It reads: "The Commission intends to propose implementing rules according to which the annual reports to be drawn up by<br />
Member States and the summary to be presented by the Commission will have to show a true picture of the balance between<br />
fishing capacity and the fishing opportunities available. To achieve this at least the following elements shall be included in<br />
Member States' reports:<br />
(i) a fleet analysis in relation to stocks important to that Member State and in particular in relation to stocks outside safe<br />
biological limits;<br />
(ii) the development of fleet capacity in nominal and real terms using inter alia data on actual and potential effort;<br />
(iii) where appropriate analysis should be carried out for segments of the fleet."<br />
3 Article 13 reads ”Information to be contained in the Annual Reports<br />
1. The reports by the Member States as provided for in Article 12 shall contain at least the following<br />
information:<br />
(a) a description of the fishing fleets in relation to fisheries: development(s) during the previous year,<br />
including fisheries covered by multiannual management or recovery plans;<br />
(b) the impact on fishing capacity of fishing effort reduction schemes adopted under multiannual<br />
management or recovery plans or, if appropriate, under national schemes;<br />
(c) information on the compliance with the entry/exit scheme and with the level of reference;<br />
(d) a summary report on the weaknesses and strengths of the fleet management system together with a<br />
plan for improvements and information on the general level of compliance with fleet policy<br />
instruments;<br />
(e) any information on changes of the administrative procedures relevant to the management of the<br />
fleet.<br />
2. The reports by Member State shall not exceed 10 pages.”<br />
13
In order to assess the balance between capacity and fishing opportunities it is important to<br />
analyse optimal capacity of fishing fleets and to document the present and potential capacity<br />
utilisation. This subject is introduced in section 4 of the report and an economic model on the<br />
Danish fleet is presented. The results are preliminary but work is under way, and more<br />
definitive results will be produced.<br />
The format of the Danish capacity report concerning 2003 follows the break down of<br />
elements in article 13 of Commission Regulation (EEC) No. 1438/2003. Section 1 gives fleet<br />
data on MAGP segments for the sake of continuity. A new subdivision of the fleet will be<br />
considered for future reports.<br />
1. Development of the Danish fishing fleet in 2003 in tonnage and engine<br />
power.<br />
In 2003 the capacity of the Danish fishing fleet fell by 6 % in tonnage and engine power.<br />
Tonnage fell by 6,352 GT to 98,639 GT and engine power fell by 21,474 kW to 325,017 kW.<br />
Vessel number fell by 238. The reduction was due amongst other things to the<br />
decommissioning scheme begun in 2002. The granting of aid for decommissioning began in<br />
2002, but the physical destruction and removal of vessels was carried out in 2003.<br />
The tonnage is measured as defined in Reg. 2930/86. Almost all vessels are now measured in<br />
GT.<br />
The development follows on from the reduction implemented during the MAGP IV<br />
programme from 1997 to 2002.<br />
If figures are compared to the MAGP segmentation, it appears that the small netters have been<br />
reduced most. In absolute figures the trawler segment has been most reduced.<br />
The development of MAGP IV segments is shown in the table below:<br />
31 December GT kW n<br />
1997 2002 2003 1997 2002 2003 1997 2002 2003<br />
Netters
In 2003 a regulation of days at sea was introduced in the North Sea, see. Annex XVII of the<br />
TACs and quotas regulation. The effects are explained in section 2.<br />
In addition to this an extended ban on trawl fisheries was introduced in the Baltic see Reg.<br />
677/2003. This extended ban was in force from 15 April till 31 May 2003. During this period<br />
a laying up scheme was implemented aimed at vessels which normally targeted out this<br />
fishery.<br />
2. Impact of the cod recovery plan for the North Sea in 2003<br />
An overview of the data with respect to this section is given in Annex 1.<br />
When describing the effects on the Danish fishing fleet for vessels involved in fishing with<br />
gear covered by Annex XVII of Reg. 2341/2002, it must be borne in mind that there are great<br />
variations in effort within each segment. One example: In the beam trawl segment >=80 mm.<br />
there were 14 vessels in 2003, using a total of 1,460 days at sea, which adds up to an average<br />
of 104 days at sea per vessel. Of the 14 vessels 7 vessels used a total of 33 days, which is an<br />
average of 4.7 days at sea per vessel. The remaining 7 vessels used a total of 427 days at sea,<br />
i.e. an average of 204 days at sea per vessel. So there was a significant variation between<br />
vessels, not only in this segment but in all segments.<br />
The description is based on the logbook register kept by the Danish Directorate of Fisheries<br />
and covers Danish fishing vessels over 10 meters, which have been fishing with one of the<br />
gears covered by Council Regulation 2341/2002 Annex XVII, as well as in areas covered by<br />
Annex XVII.<br />
In 2002 924 vessels took part in fisheries using gears covered by the days at sea regulation in<br />
2003, as opposed to 774 vessels in 2003. That corresponds to a reduction of 16%. In 2003<br />
78,867 days at sea were used as opposed to 98,317 days at sea in 2002, which is a reduction<br />
of 20%. The reduction in terms of total kilowatt days used is 17%.<br />
In the fishery with bottom trawl >=100 mm. 8,204,484 kilowatt days were used in 2002<br />
compared to 4,.076,208 kilowatt days in 2003 – a 50% reduction. The number of vessels<br />
fishing in this category fell by 27% to 356 vessels. The reduction in kilowattdays per vessel<br />
was 32%.<br />
In the fishery with beam trawl>=80 mm. 1,622,617 kilowatt days were used in 2002 as<br />
opposed to 1,412,458 kilowatt days in 2003 – a 13% reduction. The number of vessels fishing<br />
in this category was unchanged: 14. The reduction in kilowatt days per vessel was 13%.<br />
15
In the segment netters 3,927,746 kilowatt days were used in 2002 as opposed to 2,656,371<br />
kilowatt days in 2003, which is a 32% reduction. The number of vessels fell by 19% to 239<br />
vessels. The reduction in kilowatt days per vessel was 16%.<br />
In the category long liners 87,445 kilowatt days were used in 2002 compared to 6,616 in<br />
2003 – a reduction of 92%. The number of vessels was reduced by 50% to 2. The reduction in<br />
kilowatt days per vessel was 85%.<br />
In the bottom trawl fishery between 70 mm and 99 mm 9,0<strong>05</strong>,654 kilowatt days were used<br />
in 2002 as opposed to 10,299,877 kilowatt days in 2003 – an increase of 14%. The number of<br />
vessels increased by 10% to 411 vessels. The increase in kilowatt days per vessel was 4%.<br />
It must be assumed that the increase is due to the fact that vessels to a certain extent<br />
transferred from fisheries with other mesh sizes – presumably larger than 100 mm, because<br />
the days at sea regulation in Annex XVII made that attractive.<br />
In the bottom trawl fishery between 16 mm and 31 mm 3,586,025 kilowatt days were used<br />
in 2002 compared to 3,499,798 kilowatt days in 2003 – a reduction of 2%. The number of<br />
vessels in this fishery fell by 13% to 170. The increase in kilowatt days per vessel was 13%.<br />
3. Status concerning reference levels and entry-exit scheme after 1st<br />
January 2003<br />
In this section the required variables in the formulae in Com Reg. (EF) nr. 1438/2003 are<br />
defined. Status is also given per 1st January 2004. An overview of the data with respect to this<br />
section is given in Annex 2.<br />
The relevant formulae are as follows:<br />
Reference levels– R(GT)t = R(GT)03 – Gta - 0,35 GT100 + GTs + ∆R(GT-GRT)<br />
R(kW)t = R(kW)03 – kWa - 0,35 kW100<br />
Entry and exit - GTt ≤ GT03 – Gta - 0,35 GT100 + GTs + ∆R(GT-GRT)<br />
kWt ≤ kW03 – kWa - 0,35 kW100<br />
Since no aid has been given to new vessels or new capacity in 2003, the account regarding<br />
fleet renewal can be disregarded, that is, the requirement to:<br />
R(GT)<strong>05</strong> ≤ 0,97 R(GT)03 + GTs + ∆R(GT-GRT)<br />
and<br />
R(kW)<strong>05</strong> ≤ 0,97 R(kW)03<br />
As a result of this GT100 and kW100 are set at 0 in the formulae for the reference level, R(GT)t<br />
and R(kW)t, and in the formulae for the entry and exit ceilings, GTt and kWt, since at the<br />
16
present moment there are no vessels over 100 GT which have entered the fleet with public<br />
aid.<br />
GTs is also set at 0 in the formulae, since it is not possible to separate increase in tonnage as a<br />
result of vessel modernisation over the main deck in order to improve safety etc. This will<br />
possibly be taken up later.<br />
All tonnage figures are in GT although for some vessels the GT has not been measured but is<br />
calculated, see Commission Decision of 20th March 1995 on implementation of the annex to<br />
Council Regulation (EEC) Nr. 2930/86 on the definition of fishing vessel characteristics.<br />
∆R(GT-GRT) and ∆(GT-GRT) would have to show the difference between the estimated and<br />
the actual tonnage when measured. For technical reason this figure cannot easily be<br />
established from the fleet register. However, it is expected to be close to zero. It seems it can<br />
be omitted at this stage without any significant effect.<br />
The figures given for GTa and kWa are estimates of tonnage and engine power of vessels<br />
which were granted decommissioning aid in 2003 and left the fleet. The estimates are:<br />
GTa=1,00GT<br />
kWa=7,00<br />
If decommissioned vessels which were granted aid in 2002 are included the totals are 3.759<br />
GT and 15,948 kW. The figures will later be adjusted.<br />
GT03 is calculated as 1<strong>05</strong>,504 and kW03 is calculated as 369,526. However these figures do<br />
not take into account adjustments as prescribed in Reg. 1483/03 Annex II. This will be done<br />
later.<br />
The results<br />
Reference levels<br />
The departure level is determined in Regulation 1438/2003:<br />
R(GT)03 = 132,706<br />
R(kW)03 = 459,526<br />
The levels per 1st January 2004 are:<br />
R(GT)t = 130,906 per 1st January 2004<br />
R(kW)t = 452,526 per 1st January 2004<br />
Fleet renewal<br />
The level is the same as the reference level, but without deducting capacity taken out with<br />
public aid. If public aid is given to new construction, 3% must be subtracted, but this has not<br />
been the case for Denmark.<br />
17
Entries and exits<br />
The ceiling is determined as the actual capacity per 1st January corrected for re-measurement<br />
and capacity withdrawn with public aid. The result is as follows:<br />
GTt (for t=04) ≤ 103,704 (where GT per 1st January 2004 is 98,741)<br />
kWt (for t=04) ≤ 362,526 (where kW per 1st January 2004 is 348,246)<br />
If we look at the results, we note that capacity in Denmark as on 1st January 2004 is<br />
considerably below the reference level in actual terms, even if corrected for possible aid for<br />
new construction until 1st January 20<strong>05</strong>. For entries and exits Denmark meets the targets as<br />
per 1st January 2004. Actual capacity is 5,065 GT and 14,376 kW below the ceiling.<br />
4. Effects of fleet management<br />
If one studies the formal results, fleet management meets fully the requirements with respect<br />
to observance of reference limits, ceilings with respect to entries and exits, as well as the<br />
special reference limit which is set when aid for new construction is introduced.<br />
This is however not synonymous with there being a balance between fleet capacity and actual<br />
available fishing possibilities. In actual fact it can be seen that in the short term there is overcapacity,<br />
and against that background it has been decided to carry out additional scrapping in<br />
2004.<br />
It is therefore important to carry out analysis to look at this question.<br />
4.1. Analysing the Balance between Fishing Fleets and Resource Availability<br />
The long-term objective of capacity adjustment policy has been to make the fishing<br />
sector economically viable, whilst contributing to a more selective and sustainable<br />
utilisation of available resources. Another important objective has been to secure sound<br />
economic and social conditions for the enterprises and the persons employed in the<br />
sector. In order to satisfy these objectives, MAGPs have sought to encourage a<br />
sustainable balance between the capacity of the EU fishing fleets and the available<br />
resources by removing excess capacity from the fishery. In this regard Denmark has<br />
fully complied with capacity reduction targets by means of vessel decommissioning. At<br />
the end of MAGP IV capacity levels were well below (20-25%) overall GT and kW<br />
targets set by the Commission, with all fleet segments in compliance.<br />
What nevertheless remains uncertain is whether this reduction has led to a balance between<br />
fleet capacity and available resources in Danish fisheries. And the same question is relevant<br />
to the fisheries in all Member States. The question is discussed in principle in the following,<br />
and some preliminary results are presented.<br />
Since MAGP targets have not been based on scientific advice regarding optimal capacity<br />
levels, but merely on ad hoc advice on desired reductions in fishing mortality, it is highly<br />
uncertain what a nominal fleet tonnage reduction of for example 20% over 10 years actually<br />
18
entails. The potential impact of technological progress on nominal capacity clouds the issue<br />
even further. Indeed, with continued declines in commercially important fish stocks, the need<br />
for emergency recovery plans, and continued economic hardship of fishermen, it can be<br />
argued that MAGPs have not had the desired effects. It thus seems pertinent that future<br />
capacity reduction initiatives, such as vessel decommissioning programmes, not only require<br />
a set of objectives based on some form of optimal capacity analysis, but also that a<br />
programme for monitoring and analysis is in place to ascertain the impact of capacity<br />
reduction on fisheries.<br />
Optimal capacity objectives can be based on various criteria of highly contrasting outcomes<br />
(e.g. biological, economic and/or social), and are often determined by the political agenda.<br />
What should also be mentioned is that objectives are dynamic in nature, and a differentiation<br />
between short and long-term conditions is therefore important. For example, if desired<br />
optimal capacity levels are estimated for current resource conditions, it should be anticipated<br />
that these levels would differ significantly if stock recovery plans result in an increase in<br />
resource availability in the future.<br />
The Food and Agriculture Organisation of the United Nations (FAO) and the International<br />
Plan of Action for the Management of Fishing Capacity programme have since 1998<br />
contributed to a better understanding among administrators of what constitutes fishing<br />
capacity, and how fishing capacity can be measured and managed on a global scale 4 . Capacity<br />
analysis tools are numerous and often apply a physical/technical approach, as economic data<br />
availability is often constrained. Such analysis options inter alia include:<br />
• Catch Per Unit of Effort<br />
• Variable Input Utilisation – Observed/potential days at sea calculations<br />
• Peak-to-Peak analysis - Changes in catch rate relative to average technology<br />
trends<br />
• Data Envelopment Analysis (DEA) – Capacity utilisation of vessels compared to ‘best<br />
practice’ input/output combination vessel (non-parametric)<br />
• Stochastic Frontier Production analysis – Capacity utilisation of vessels compared to ‘best<br />
practice’ input/output combination vessel incorporating stochastics (parametric)<br />
If economic cost/revenue data are available, a break-even revenue approach can be indicative<br />
of over-/under capacity in a pure economic sense, based on the extent to which short run gross<br />
cash flow is able to cover fixed costs. Since fishing is an economic activity, it is expected that<br />
an economic capacity analysis would provide more reliable insight into optimal capacity and<br />
predicted behaviour by fishermen.<br />
The aggregation level of data will determine which measurement tools are most appropriate,<br />
as outlined by FAO. When aggregated data are used, estimates will be crude and should be<br />
interpreted with caution, and all underlying assumptions need to be made explicit.<br />
Furthermore, results need to be compared for consistency. For the EU, it is advisable that a<br />
transparent and repeatable analytical tool is chosen: one that can be consistently applied to the<br />
4 See FAO (1999) “Report of the Technical Consultation on the Measurement of Fishing Capacity”, FAO<br />
Fisheries Report No. 615, FAO (1999) “Managing Fishing Capacity”, FAO Fisheries Technical Paper 386,<br />
FAO (2004) “Appraising Capacity in Fisheries”, FAO Fisheries Circular 994, forthcoming May 2004.<br />
19
fleet structure data outlined in the EU data collection programme 5 , ensuring that the same<br />
level of data aggregation is employed.<br />
The Danish authorities intend to analyse fishing capacity in relation to available resources, as<br />
discussed above. The work done so far has been carried out by independent fisheries<br />
economists at the Research Institute of Food Economics. The work programme incorporates<br />
the use of DEA and economic capacity measurement tools to gather information on short and<br />
long-term optimal capacity levels for the Danish fishing fleet. It is considered that if all EU<br />
member states apply a common analytical approach, useful information could be obtained and<br />
appraised for improved capacity management in EU fisheries. An example of current work in<br />
progress is described below.<br />
An Economic Management Model for Fisheries in Denmark (EMMFID) has been developed,<br />
which makes it possible to analyse the optimal capacity and profits with respect to long run<br />
stock effects. This can help analyse the notion that although the current situation is plagued by<br />
excess capacity, there may be a need for this excess capacity in the future following stock<br />
recovery and increased fishing opportunities. For example, an optimal short-term capacity<br />
reduction of 20% may not be a desired target in the longer term.<br />
EMMFID is set up in a static framework as a linear constrained optimisation model and<br />
includes spatial biological and economic information, as well as variables representing fleet<br />
size and fishing effort. The model seeks the combination of vessels and days at sea that<br />
maximises profits under different management scenarios (e.g. stock recovery, long run TACs,<br />
variable time paths), and may help determine the desired structure of decommissioning<br />
programmes or other management initiatives in order to reach an optimal capacity situation.<br />
An example is given as follows.<br />
Example: Optimising fleet capacity with long-term stock effects<br />
Scenarios:<br />
2002 - Actual situation in 2002 (no optimisation)<br />
#1 - 2002 TACs, 2002 quota-utilization, optimal allocation of effort<br />
#2 - Long run TACs, catch-stock relationship incorporated, optimal allocation of effort<br />
#3 - Long run TACs, catch-stock relationship not incorporated, optimal allocation of effort<br />
Only vessels that are commercially active 6 and are at least 12 metres in length are included in<br />
the analysis, comprising a total of 927 vessels in total. In relation to the official fleet figures<br />
5 Commission Regulation (EC) No 1639/2001 of 25 July 2001: Establishing the minimum and extended<br />
Community programmes for the collection of data in the fisheries sector and laying down the detailed<br />
rules for the application of Council Regulation (EC) No 1543/2000.<br />
20
for 2002 described in Section 1, this represents some 84% of Danish vessels of 12 metres or<br />
above.<br />
Optimisation results:<br />
The preliminary results indicate that the fleet GT and fishing effort need to increase in the<br />
long-term to take optimal advantage of increased fishing opportunities in an economic sense<br />
(profit maximisation). There is also a need for a substantial reduction in the number of smaller<br />
vessels in favour of the larger and more economically efficient vessels, hence a reduction in<br />
the number of vessels compared to the 2002 scenario.<br />
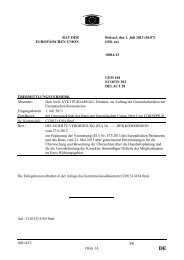
Scenario #1 with optimal effort allocation in 2002 also indicates that although HP and days at<br />
sea decline in an optimal fleet set-up, the total GT of the fleet increases (cf. Figure 1). This<br />
can be explained by smaller vessels being replaced by larger vessels in the optimal situation.<br />
However, this remains a hypothetical example since such a reallocation cannot be expected to<br />
occur in the short term, and is presented for comparative purposes.<br />
Table 1. Total number of vessels<br />
2002 #1 #2 #3<br />
Total number of vessels 927 641 704 717<br />
Figure 1. Total GT, hp and days Figure 2. Number of vessels<br />
at sea (Scenario 2002=100)<br />
130<br />
120<br />
110<br />
100<br />
90<br />
80<br />
70<br />
GT hp days at sea<br />
#1 #2 #3<br />
21<br />
300<br />
250<br />
200<br />
150<br />
100<br />
50<br />
0<br />
#1 #2 #3 2002<br />
6 Defined as having an annual revenue that exceeds 29,435 € (minimum amount subject to VAT).
5. Administrative procedures of relevance for fleet management<br />
The procedures governing entry and exit of vessels to and from the fleet have not been<br />
changed in 2003. The rules are found in Government Order no. 19 of 17th January 2001 on<br />
vessels used for commercial fishery. The rules ensure in principle that entry into the fleet is<br />
counterbalanced by corresponding exit. It is expected that the rules will be revised during<br />
2004. The aim is to ensure that the new EU rules for entry and exit are observed as well as to<br />
give greater flexibility for fishermen who want to introduce new capacity.<br />
22
Annex 1: Development in effort in relation to cod recovery plan in the North Sea (”annex XVI”)<br />
Danish Directorate for Fisheries (Statistical section TPA) 16:28 – Thursday 25th March 2004<br />
Table 1: Number of days at sea for Danish vessels 10 metres and over in regulated area 2002-2003, see RFO 671/2003 (rev. Annex 17).<br />
If given catch date in an ICES square which is exempted, deduction is made of 1 day per catch date.<br />
According to gear segments.<br />
2002 2003 Change in %<br />
Days at kW-days Vessels with Days/vessel Kwdays/vessel Days at kW-days Vessels with Days/vessel Kwdays/vessel Days/vessel Kwdays/vessel<br />
sea<br />
gear<br />
sea<br />
gear<br />
Trawl>=100 29.027 8.204.484 485 59,85 16.916,46 12.860 4.076.208 356 36,12 11.450,02 -39,65% -32,31%<br />
Beam trawl>=80 1.671 1.622.617 14 119,36 115.901,21 1.460 1.412.458 14 104,29 100.889,86 -12,63% -12,95%<br />
Net 25.722 3.927.746 296 86,9 13.269,41 18.165 2.656.371 239 76 11.114,52 -12,54% -16,24%<br />
Liners 292 87.445 4 73 21.861,25 25 6.616 2 12,5 3.308,00 -82,88% -84,87%<br />
Trawl 70-99 35.034 9.0<strong>05</strong>.654 372 94,18 24.208,75 39.735 10.299.877 411 96,68 25.060,53 2,65% 3,52%<br />
Trawl 16-31 6.571 3.586.025 196 33,52 18.296,<strong>05</strong> 6.622 3.499.798 170 38,95 20.587,<strong>05</strong> 16,20% 12,52%<br />
Total 98.317 26.433.971 924 106,4 28.608,19 78.867 21.951.328 774 101,9 28.360,89 -4,23% -0,86%<br />
Note: Given vessel information is the most recent known in 2002 and 2003.<br />
Note: Regulated areas are 2A (EEC), 3A, 4AC and 6A.<br />
Note: Net vessels are: Bottom nets (FPN), Net gears (GN), Bottom set gillnet (GNS) and Trammel nets (GTR).<br />
Note: Trawl is: Bottom trawl (OTB), Twin trawl (OTT), Bottom pair trawl(PTB), Beach seines (SB),<br />
Danish seine (SDN), Danish seine (SCC) and Other bottom trawl (TB).<br />
Note: Beam trawl is: Beam trawl (TBB).Long line is : Long line (LLS).<br />
Note: Vessel with gear is the number of vessels which have used the gear in question. The total is the actual number of vessels.<br />
Source: Vessel and log book register of the Danish Directorate of<br />
Fisheries.<br />
23
Annex 2<br />
Overview of fleet data<br />
Reference level<br />
R(GT)03 132,706 R(kW)03 459,526<br />
Gta 1,800 kWa 7,000<br />
0,35 GT100 0 0,35 kW100 0<br />
GTs Not available …<br />
∆R(GT-GRT) Not available …<br />
R(GT)04 130,906 R(kW)04 452,526<br />
GT04 98,639 kW04 348,150<br />
Requirement GT04
Notes:<br />
GTa and kWa is an estimate of vessels which were granted decommissioning aid in 2003 and left the fleet. If decommissioned vessels which<br />
were granted aid in 2002 are included the totals are 3,759 GT and 15,948 kW. The figures will later be adjusted.<br />
GT03 is the actual registered figure on 1 January 2003. No adjustment has yet been made as prescribed in Reg. 1483/03 Annex II<br />
It has not been possible to calculate the ∆ element. Since all tonnage figures are in GT this element will be close to zero.<br />
25
Management of entry/exit regime during 2003<br />
1 Capacity level for the application of the<br />
entry-exit regime<br />
2 Entries of vessels of more than 100 GT<br />
financed with public aid<br />
3 Increases in tonnage GT for reasons of<br />
safety<br />
4 ∆ GT-GRT (due to change from GRT to<br />
GT) 7<br />
26<br />
GT kW<br />
GT03 99.764 kW03 369.549<br />
GT100 0 kW100 0<br />
GTs 0 kWs 0<br />
∆ GT-GRT 3.293 - -<br />
5 Exits financed with public aid for 2003 GTa 1.172 kWa 6.666<br />
6 Capacity of the fleet on 31 December<br />
2003<br />
7 Fleet ceiling 31 December 2003 (1-<br />
35%2+3+4-5)<br />
Management of reference levels during 2003<br />
GTt 97.777 kWt 348.375<br />
101.885 362.883<br />
GT kW<br />
1 Reference level on 1-1-2003 GT03 132.706 kW03 459.526<br />
2 Entries of vessels of more than 100 GT<br />
financed with public aid<br />
3 Increases in tonnage GT for reasons of<br />
safety<br />
4 ∆ GT-GRT (due to change from GRT to<br />
GT) 1<br />
GT100 0 kW100 0<br />
GTs 0 kWs 0<br />
∆ GT-GRT 3.293 - -<br />
5 Exits financed with public aid GTa 1.172 kWa 6.666<br />
6 Capacity of the fleet on 31 December<br />
2003<br />
7 Reference level on 31 December 2003<br />
(1-35%2+3+4-5)<br />
GTt 97.777 kWt 348.375<br />
134.827 452.860<br />
7 10 vessels are per September 7th still not measured in GT, which is why they are excluded in delta BT-<br />
BRT.
SPAIN<br />
INFORME ANUAL SOBRE LABOR REALIZADA DURANTE EL AÑO 2003<br />
En cumplimiento de lo dispuesto en el Artículo 12 “Informe anual” del<br />
Reglamento (CE) nº 1438/2003 de la Comisión, de 12 de agosto, por el que se<br />
establecen las normas de aplicación de la política comunitaria de flotas pesqueras<br />
definida en el Capítulo <strong>III</strong> del Reglamento (CE) nº 2371/2002 del Consejo, pongo en<br />
su conocimiento lo siguiente:<br />
Con respecto a la reducción del número de barcos de la flota española a<br />
fecha 31 de diciembre de 2003, y en comparación con el año anterior, éste es cómo<br />
a continuación se señala:<br />
Nº Barcos<br />
Artesanales < 12 mts en aguas de U.E 343<br />
Arrastreros en aguas U.E 12<br />
Palangre de fondo y otros barcos de artes fijos en aguas U.E 18<br />
Cerqueros con jareta en aguas U.E 12<br />
Arrastreros y móviles en aguas Internacionales y Terceros Países 118<br />
Artes fijos en aguas Internacionales y de terceros Países 53<br />
Flota atunera 3<br />
Esta reducción supone un total de barcos de 559 que conlleva una<br />
disminución de 34.442 GT y 96.669 KW.<br />
Durante el año 2003, España ha continuado con sus criterios de renovación y<br />
modernización de la flota, gestionando de tal modo las entradas y salidas de la<br />
misma que ha permitido mantener una constante disminución de su capacidad.<br />
Para ello se ha seguido estrictamente la política de bajas, que se venia aplicando<br />
hasta la publicación de los Reglamentos Comunitarios sobre la reforma de la Política<br />
Pesquera Común, obligando a aportar en caso de nuevas construcciones, bajas<br />
equivalentes a la unidad que se va a construir, llevándose a cabo documentalmente<br />
los requisitos que deben cumplir éstas y comprometiéndose el aportante a<br />
desguazar el buque cuando la nueva construcción entre en servicio.<br />
Esta aportación obligatoria también se aplica en el caso de importación de<br />
buques pesqueros, en los casos de alta en la lista tercera de barcos procedentes de<br />
otras listas.<br />
En los casos de modernización y reconversión de buques si existe incremento de<br />
arqueo y/o potencia también se ha exigido este requisito de aportación de bajas.<br />
27
FINLAND<br />
Annual Report 2003 - Finnish fishing fleet<br />
(According to Articles 12 and 13 of Commission Regulation (EC) 1438/2003)<br />
Ministry of Agriculture and Forestry<br />
Department of Fisheries and Game<br />
Foreword<br />
In this report Finland will present its efforts during the year 2003 to achieve a sustainable<br />
balance between fishing capacity and fishing opportunities. The report will follow the format<br />
proposed by the Commission (e-mail of April 2004).<br />
1. Finnish fishing fleet in relation to fisheries<br />
The development of Finnish fishing fleet by the four segments is summed up in the table 1<br />
beneath. In segments 4L1 and 4L2 there has been some decrease in number of vessels,<br />
tonnage and power during the year 2003. In segments 4L3 and 4L4 the situation has not<br />
changed.<br />
Table 1. Changes in Finnish fishing fleet during the year 2003.<br />
4L1, small-scale Situation 31.12.2002 Situation 31.12.2003 Change % compared to the starting level<br />
coastal fisheries GT kW number GT kW number GT % kW % number %<br />
Subtotal 8 222,75 130 421,68 3 342 8 012,25 129 169,96 3 271 -210,50 -2,6 % -1 251,72 -1,0 % -71 -2,1 %<br />
4L2 Situation 31.12.2002 Situation 31.12.2003 Change % compared to the starting level<br />
pelagic trawlers GT kW number GT kW number GT % kW % number %<br />
Subtotal 9 281,40 46 816,06 169 9 154,19 45 755,13 163 -127,21 -1,4 % -1 060,93 -2,3 % -6 -3,6 %<br />
4L3 Situation 31.12.2002 Situation 31.12.2003 Change % compared to the starting level<br />
bottom trawlers GT kW number GT kW number GT % kW % number %<br />
Subtotal 449,00 1 287,12 3 449,00 1 287,12 3 0,00 0,0 % 0,00 0,0 % 0 0,0 %<br />
4L4, Situation 31.12.2002 Situation 31.12.2003 Change % compared to the starting level<br />
passive gear GT kW number GT kW number GT % kW % number %<br />
Subtotal 1 737,03 11 392,48 57 1 737,02 11 392,47 57 -0,01 0,0 % -0,01 0,0 % 0 0,0 %<br />
TOTAL 19 690,18 189 917,34 3 571 19 352,47 187 604,68 3 494 -337,71 -1,7 % -2 312,66 -1,2 % -77 -2,2 %<br />
The fishing in the 4L1 segment is concentrated especially on the unregulated an unquoted<br />
species and stocks. The pelagic trawlers in segment 4L2 fish mostly herring and sprat, while<br />
the activity of bottom trawlers (4L3) is directed in cod fisheries. The passive gear vessels are<br />
concentrated on salmon and cod fisheries. As it can be seen in table 2 (TACs/quotas and<br />
catches), the exploitation percentage of the quotas has been highest in herring, sprat and cod<br />
28
fisheries. To avoid exceeding the quotas and to guarantee the constant supply of fish to<br />
market and processing industry Ministry of Agriculture and Forestry gave five ministerial<br />
decrees to regulate (restrict) the herring and sprat fisheries and three ministerial decrees to<br />
regulate the cod fisheries in the year 2003.<br />
Table 2. Finnish TACs/quotas and catches in year 2003<br />
Nationality Quota Total Landed Landed Total catch/quota<br />
of a vessel code quota in Finland elsewhere catch (%)<br />
FIN HER/3BCD 6826 2518 960 3478 51<br />
FIN HER/3D-LIT * 500 0 0 0 -<br />
FIN HER/3D-LAT* 0<br />
FIN HER/3D-MU3 59611 57327 620 57947 97<br />
FIN SPR/3BCD 9715 5939 2913 8852 91<br />
FIN SPR/3D-LAT * 6000 0 32 0 -<br />
FIN SPR/3D-LIT * 3000 0 0 0 -<br />
FIN SAL/3BCD-C 116603 53557 17658 71215 61<br />
FIN SAL/3BCD-F 40700 5671 0 5671 14<br />
FIN SAL/3D-LAT ** 2993 357 824 1181 32<br />
FIN SAL/3D-LIT ** 1496 140 0 140 9<br />
FIN COD/3BCD 1155 0 1152 1152 100<br />
FIN COD/3D-LAT 0 0 0 0 0<br />
FIN COD/3D-LIT 0 0 0 0 0<br />
FIN<br />
FIN HER/ I ja IIA 192 0 0 0 0<br />
The high exploitation percentage in herring/sprat fisheries reflects the decreases in quotas<br />
during the recent years and the fishing capacity is relatively high compared to the fishing<br />
possibilities. In cod fisheries the high percentage is rather reflects more the bad shape of cod<br />
stocks than overcapacity. During the year 2003 also a ban for the use of driftnets in the Baltic<br />
Sea was under preparation in the EU. This driftnet ban would concern especially salmon<br />
fisheries in the segment 4L4.<br />
In the Baltic Sea area, the International Baltic Sea Fishery Commission (IBSFC) has accepted<br />
resolutions concerning the Long Term Management Strategies for Cod Stocks and Sprat stock<br />
and a Salmon Action Plan for natural spawning salmon. These resolutions are applied in the<br />
regulating of the fisheries by the IBSFC and Finland.<br />
2. Fishing effort reduction schemes<br />
Any fishing effort reduction schemes did not take place in Finland during the year 2003.<br />
Because of the overcapacity in herring and sprat fisheries and the driftnet ban in Baltic Sea,<br />
Finland will in 2004 take into consideration launching an effort reduction scheme for segment<br />
4L2 and salmon fisheries in segment 4L4.<br />
29
3. Compliance with the entry/exit scheme and with the levels of reference<br />
According to the Commission the results of the application of the entry-exit regime will be<br />
calculated on the basis of the data contained in the Community Fishing Fleet Register (CFR).<br />
However, Commission asked for the following further information which will not be<br />
available in the CFR until the new application is fully operational.<br />
a) The increases in tonnage granted under the provisions of Article 11(5) of R 2371/2002,<br />
GTS (“safety tonnage”)<br />
These "safety tonnage increases" did not take place in Finland during the year 2003.<br />
b) The entries into the fleet with public aid of vessels between 100 and 400 GT when the<br />
decisions were taken after 1-1-2003 (“GT100 and kW100”)<br />
These "100-400 GT entries" did not take place in Finland during the year 2003.<br />
c) the entries into the fleet that took place during the previous year (2003) and that are eligible<br />
under the provisions of Article 6 and Annex II of Regulation 1438/2003 (‘coups partis’).<br />
These "coups partis entries" did not take place in Finland during the year 2003.<br />
Levels of reference<br />
The following reference levels 1 January 2003 of Finnish fishing fleet has been confirmed in<br />
the annex 1 of the Commission Regulation 1438/2003:<br />
R(GT)03 = 23 203 GT<br />
R(kW)03 = 216 195 kW<br />
Finland had at the moment of 1 January 2003 met the goals of the MAGP IV. Because of the<br />
entry/exit regulations in the Council Regulation 2371/2002 article 13, actual reference levels<br />
of Finnish fleet are the following levels based on the situation of the 1 January 2003:<br />
GT1.1.2003 = 19 690 GT<br />
kW1.1.2003 = 189 917 kW<br />
As it can be seen in the table 1, Finland has complied with the reference levels of its fishing<br />
fleet during the year 2003.<br />
4. Summary report on the weaknesses and strengths of the fleet management system<br />
The Finnish fleet management system has no major weaknesses or special strengths. The<br />
human resources for fleet management in Finland are limited. Thus the changes in staff<br />
responsible for fishing fleet in October 2003 and the testing of the new central register (see<br />
item 5) have caused some minor delays in delivering required data. These delays are likely to<br />
disappear as experience and routine are being gained and the new central register is fully in<br />
operation.<br />
Finland has complied with the regulations of the fleet policy instruments.<br />
30
5. Information on changes of the administrative procedures<br />
During the year 2003 a new central fisheries register system in Finland (kalatalouden<br />
keskusrekisteri, KAKE) was under construction and it was tested along the year. It was<br />
introduced officially in 2004.<br />
31
FRANCE<br />
CONCERNANT<br />
RAPPORT ANNUEL DE LA FRANCE<br />
les efforts réalisés en 2003 pour obtenir un équilibre durable entre la capacité de pêche et les<br />
possibilités de pêche<br />
1 – DESCRIPTION GENERALE DE LA FLOTTE PAR PECHERIE<br />
1. 1 Evolution générale de la capacité de pêche<br />
La diminution globale de la capacité de pêche de la flotte française s’est poursuivie en 2003. En<br />
effet, au 31 décembre 2003, la capacité totale de pêche de la flotte française s’élevait à 1 109 131 kW<br />
et 226 133 GT, dont 900 280 kW et 211 008 GT pour la flotte des régions de métropole et de Corse et<br />
le restant pour les départements d’outre-mer (DOM). Cette situation est à comparer avec l’état au 31<br />
décembre 2002, lorsque la capacité totale s’élevait à 1 116 076 kW et 229 739 GT, dont 910 381 kW<br />
et 213 197 GT pour la flotte des régions de métropole et de Corse.<br />
Le tableau ci-dessous récapitule l’évolution globale de la capacité de pêche de la flotte<br />
française :<br />
Au 31 décembre 2002 Au 31 décembre 2003 Variation<br />
Puissance Tonnage Puissance Tonnage Puissance Tonnage<br />
(kW) (GT) (kW) (GT) (kW) (GT)<br />
Métropole 910 381 213 397 900 280 211 008 -1,11% -1,12%<br />
Total DOM 2<strong>05</strong> 695 16 540 208 851 16 127 1,53% -2,50%<br />
Martinique 61 758 2 965 64 871 3 <strong>05</strong>8 5,04% 3,14%<br />
Guadeloupe 97 418 2 493 97 365 2 282 -0,<strong>05</strong>% -8,46%<br />
Guyane 22 023 6 565 22 164 6 471 0,64% -1,43%<br />
Réunion 24 496 4 517 24 451 4 316 -0,18% -4,45%<br />
Total 1 116 076 229 937 1 109 131 227 135 -0,62% -1,22%<br />
* il s’agit de la situation apparente dans le fichier flotte, qui ne tient pas compte des « coups<br />
partis » notifiés par ailleurs à la Commission, correspondant à une capacité totale de pêche de 5 801<br />
kW et 2 170,45 GT.<br />
Cette évolution résulte, en métropole, de la politique de réduction globale de l’effort de pêche<br />
qui est mise en œuvre notamment au moyen des aides à l’arrêt définitif. Ces aides sont financées dans<br />
le cadre du DOCUP IFOP hors objectif 1 2000-2006, dont l’un des objectifs stratégiques est<br />
l’ajustement de l’effort de pêche.<br />
Dans ce contexte, les autorités françaises tiennent à souligner qu’elles ont rempli leur obligation de moyens et de<br />
résultat, dans la mesure où, comme cela est décrit dans ce chapitre, la capacité de pêche de la flotte a diminué<br />
régulièrement au cours de la période 2000-2003. Dans le cadre du POP IV, les objectifs globaux ont été respectés chaque<br />
année, ainsi que les objectifs concernant 19 segments sur 21 en puissance, et 15 segments sur 21 en jauge (avec toutefois<br />
une incertitude sur cet indicateur, compte-tenu de la période de transition en cours avec la modification de l’unité de jauge<br />
dans la Communauté).<br />
S’agissant de l’impact sur la gestion de la ressource de la politique structurelle financée par l’IFOP, celui-ci est<br />
difficile à établir, car il n’est pas possible de mettre en évidence un lien direct entre les aides à l’arrêt définitif ou à la<br />
construction et l’évolution de l’état de la ressource.<br />
32
Cette dernière est aussi dépendante des niveaux de prélèvement et d’effort de pêche autorisés au<br />
niveau communautaire ou national et par les contrôles pratiqués par les différents Etats membres, tant<br />
en mer qu’au débarquement, ainsi que de facteurs extérieurs à l’activité de pêche (pollution, autres<br />
usages du milieu maritime).<br />
Cependant, il faut souligner que les aides à l’arrêt définitif contribuent, de manière significative, à l’adaptation des<br />
capacités de pêche aux ressources disponibles et, ce faisant, à l’amélioration de la viabilité économique des entreprises,<br />
dans un contexte où l’accès aux pêcheries et où les niveaux de prélèvement sont encadrés et contrôlés. Dans le même<br />
temps, les aides à la construction et à la modernisation sont également un pilier essentiel de la gestion durable de la<br />
ressource : elles facilitent la modernisation des outils de production (introduction de chaluts sélectifs), la valorisation des<br />
captures (démarche qualité à bord des navires, sous l’égide des OP) et, ce faisant, aident à améliorer la situation<br />
économique des entreprises, ce qui contribue à la régulation de l’effort de pêche.<br />
1.2 – EVOLUTION DES PRINCIPALES PECHERIES<br />
Sur un plan général, l’activité de pêche des navires de la flotte française de métropole est<br />
soumis à plusieurs niveaux de régulation, afin d’assurer une gestion durable des ressources :<br />
- une limitation des captures ou des jours de mer respectivement au moyen des Totaux<br />
Admissibles de Captures (TAC) ou des mesures prises dans le cadre de plans de gestion pluriannuels<br />
ou de plans de restauration. Dans le cas de la France, les quotas des espèces soumises à ce type<br />
d’encadrement sont répartis entre les Organisations de Producteurs (OP) ;<br />
- au niveau national, l’accès aux pêcheries est encadré, conformément à la réglementation<br />
communautaire qui demande à chaque Etat membre de mettre en place un régime de gestion des<br />
entrées et des sorties des capacités de pêche (Cf. point 3).<br />
S’agissant de la répartition de la flotte entre les principales pêcheries, il convient tout d’abord de<br />
distinguer le cas des DOM, dont la flotte est soumise à un régime d’encadrement spécifique qui<br />
permet l’augmentation de capacité avec aides, dans les limites prévues par les objectifs du POP IV. Le<br />
régime dérogatoire des DOM est prévu par le règlement du Conseil R(CE) n°639/2004, qui lui-même<br />
fera l’objet d’un règlement d’application.<br />
En ce qui concerne les pêcheries des DOM, deux d’entre elles font l’objet d’une limitation de<br />
l’effort de pêche sous forme de licences (pêche de la crevette en Guyane) ou de limitation de capacité<br />
totale (pêche des thonidés dans l’Océan Indien, soumises aux résolutions de la CTOI). Les autres<br />
pêcheries concernent principalement des navires d’une longueur inférieure à 12 m pêchant les espèces<br />
démersales et pélagiques dans les zones côtières. La situation de ces pêcheries n’appelle pas<br />
d’observations particulières en 2003.<br />
S’agissant des pêcheries de métropole, il convient de distinguer les pêcheries par façade :<br />
- En Méditerranée, les pêcheries font l’objet d’un encadrement de l’effort de pêche, au moyen<br />
de l’attribution d’un nombre limité de licences par métiers (petits métiers, chalutiers, senneurs), et,<br />
dans le cas du thon rouge, également d’une limitation des captures (quota). La réforme de la PCP et la<br />
disparition de la segmentation au titre du POP IV n’ont pas entraîné de modification des modalités de<br />
l’encadrement par l’effort de pêche, qui se sont poursuivies.<br />
- En Atlantique-Manche-Mer du Nord, les principales pêcheries sont encadrées par<br />
l’intermédiaire des quotas fixés par la réglementation communautaire, qui concernent environ la<br />
moitié des captures réalisées par la flotte française, en tonnage. Ces quotas sont répartis annuellement<br />
entre les Organisations de Producteurs.<br />
La réforme de la PCP a supprimé le régime d’encadrement du POP IV et a introduit la<br />
possibilité d’instaurer des plans de gestion pluriannuels et des plans de restauration. Toutefois, en<br />
33
2003, et à l’exception des mesures prises dans le cas du cabillaud, dans le cadre du règlement relatifs<br />
aux TACs et aux quotas 2003 (Cf. point 2), aucun plan de gestion ou de restauration n’a concerné les<br />
pêcheries françaises.<br />
S’agissant des pêcheries des grands chalutiers pélagiques (chalutiers de plus de 50 m), la<br />
Commission a pris une décision rétroactive accordant l’augmentation des objectifs du POP IV pour le<br />
segment concerné 8 . La France est autorisée à exploiter cette possibilité moyennant l’engagement de<br />
mettre en place des mesures nationales de limitation de l’effort de pêche au niveau fixé par le POP IV,<br />
dès que la capacité de pêche est augmentée. La capacité des trois navires appartenant à l’ancien<br />
segment 4F6 du POP IV est demeurée identique et n’a donc nécessité aucune mesure supplémentaire.<br />
S’agissant des pêcheries de thonidés tropicaux pratiquées par les senneurs et les canneurs<br />
français dans l’Océan Atlantique et dans l’Océan Indien, aucun développement particulier n’est à<br />
signaler. Ces pêcheries sont soumises à une limitation de la capacité de pêche dans l’Océan Atlantique<br />
et à une limitation des captures pour une espèce (thon obèse).<br />
2 – IMPACT, LE CAS ECHEANT, DES REGIMES DE REDUCTION DE L’EFFORT<br />
DE PECHE<br />
Depuis le 1 er février 2003, une partie restreinte de la flotte française a été soumise au système<br />
temporaire de gestion de l’effort de pêche s’appliquant aux pêcheries susceptibles de capturer du<br />
cabillaud dans la Mer du Nord et dans l’Ouest Ecosse. Ces mesures, décrites dans l’annexe XVII du<br />
règlement (CE) n°2341/2002 du Conseil fixant les TAC et quotas pour l’année 2003, concernaient de<br />
façon concrète les flottilles des quartiers de Boulogne-sur-Mer et Dunkerque (chalutiers et fileyeurs<br />
artisanaux d’une part, chalutiers hauturiers de la pêcherie de lieu noir d’autre part) pour la Mer du<br />
Nord, et des navires hauturiers ciblant les espèces profondes dans la zone Ouest Ecosse.<br />
Le délai nécessaire à la mise en œuvre des mesures de limitation de l’effort de pêche, consistant<br />
en une réduction du nombre de jours de mer des navires dans les zones soumises à ces mesures, n’a<br />
pas permis, sur l’année 2003, d’observer une réduction significative et exclusivement liée à ces<br />
mesures de la capacité des flottilles concernées.<br />
D’autre part, la Commission s’étant prononcée défavorablement sur l’interprétation proposée<br />
par les autorités françaises pour le critère d’éligibilité prévu par le règlement R(CE) n°2370/2002<br />
(mesure d’urgence), les autorités françaises n’ont pas été en mesure d’avoir recours aux aides<br />
majorées à l’arrêt définitif pour les navires touchés par ces mesures.<br />
3 – INFORMATIONS SUR LE RESPECT DU REGIME ENTREE-SORTIE ET DES<br />
NIVEAUX DE REFERENCE<br />
A compter du 1 er janvier 2003, la réforme de la PCP a supprimé les segments de flotte au niveau communautaire, et<br />
imposé un objectif de réduction supplémentaire de 3 % de la flotte par rapport aux niveaux de référence de la flotte<br />
française au 31 décembre 2002 , à constater au 31 décembre 2004.<br />
L’obligation de réduction de 3 % implique que le niveau global de la flotte de pêche<br />
métropolitaine ne devra pas dépasser 893 340 kW et 223 349 GT le 31 décembre 2004.<br />
En vue de respecter cet objectif, les autorités françaises ont mis en œuvre les mesures<br />
suivantes :<br />
- un régime national de gestion des entrées et des sorties de flotte : dans le cas de la France,<br />
ce régime repose sur le décret n°93-33 relatif aux Permis de Mise en Exploitation des navires de pêche<br />
8 Décision de la Commission du 13 avril 2004 modifiant les décisions 98/119/CE, 98/121/CE et 98/125/CE portant<br />
approbation des programmes d’orientation pluriannuels des flottes de pêche de la France, des Pays-Bas et de<br />
l’Irlande. JOCE L 114 du 21 avril 2004, p 25 – 31.<br />
34
(PME), modifié en 2000 pour tenir compte du POP IV et de la nouvelle segmentation introduite à<br />
l’époque. Ce régime a été approuvé par la Commission le 10 avril 2001.<br />
Ce régime national n’a pas été modifié depuis car il définit un cadre suffisant pour répondre aux<br />
nouvelles obligations qui découlent du règlement R(CE) n° 2371/2002. Toutes les entrées en flotte de<br />
nouvelles capacités de pêche (construction, importation, modification du tonnage ou de puissance,<br />
entrée en activité) sont soumises à une autorisation administrative préalable au titre de ce décret. En<br />
particulier, les autorisations de construction et de modernisation avec augmentation de jauge ou de<br />
puissance sont strictement encadrées, et l’obligation de renouveler à capacité identique ou inférieure<br />
(ratio de 1,35 pour la construction avec aides de navires d’un tonnage supérieur à 100 GT) devant être<br />
respectée globalement ou individuellement est une condition préalable, exigée avant la délivrance de<br />
toute autorisation de construction ou de modernisation. De même, l’attribution d’une aide à la<br />
construction ou à la modernisation dépend de l’attribution préalable d’un PME et du respect du ratio<br />
de renouvellement par le promoteur.<br />
- un programme spécifique d’aide à l’arrêt définitif des navires de pêche : il a été mis en<br />
place depuis le 15 juillet 2003, pour la période 2003-2004. Le barème national des aides proposées aux<br />
pêcheurs a été substantiellement augmenté par rapport aux années antérieures et tous les détenteurs de<br />
navires actifs peuvent prétendre à une aide à l’arrêt définitif. Il s’adresse à l’ensemble des pêcheurs, et<br />
comprend une incitation supplémentaire pour les navires dont l’activité porte sur des espèces pour<br />
lesquelles les niveaux de captures doivent être réduits (cabillaud, sole, merlu, baudroie, langoustine).<br />
Ce plan est doté d’un budget de 30 millions d’Euros (15 millions au titre de l’Etat, 15 millions<br />
au titre de l’IFOP) sur la période 2003-2004 et devrait permettre de réaliser la sortie de capacités à<br />
hauteur de 6200 GT, ce qui correspond à une puissance totale de l’ordre de 25-27 000 kW (ce niveau<br />
dépend des caractéristiques des navires candidats à une aide à l’arrêt définitif, compte-tenu des<br />
caractéristiques du barème communautaire).<br />
Au 31 décembre 2003, et compte-tenu de la mise en place en juillet 2003 du plan (en l’absence<br />
de réponse avant cette date des services de la Commission concernant le barème relatif à la mesure<br />
d’urgence prévue par le R(CE) n°2370/02), le bilan effectué porte essentiellement sur les aides<br />
délivrées sur la base du plan 2000-2002, ainsi que sur les premiers dossiers approuvés en 2003, tels<br />
qu’ils apparaissent dans l’état d’avancement arrêté au 31 décembre 2003.<br />
Dossiers terminés (mesure 11 et 12) au 31<br />
décembre 2003 (depuis le 1 er Dossiers engagés et non soldés<br />
janvier 2000) au 31 décembre 2003 Total<br />
4F1 4F2 4F4 4F8 Total 4F1 4F2 4F4 Total<br />
Nombre de 65 100 4 3 172 4 17 5 26<br />
dossiers<br />
198<br />
Puissance 4287 17878 1079 621 23865 408 2835 912 4 155 28020<br />
Tonnage 473,8 2498,8 294 62 3328,68 29,9 329,19 163 522,09<br />
(TJB) 7 1<br />
3850,77<br />
Tonnage 391,2 2323,1 175 68 2957,41 21,09 401,84 167 589,93<br />
(GT) 5 6<br />
3547,34<br />
Le plan mis en place, pour la période 2003-2004, démontre la volonté des autorités françaises de<br />
se conformer au nouvel objectif de réduction global de 3 %, en mettant en place un barème majoré et<br />
modulé en fonction des espèces capturées, ceci afin de diminuer rapidement l’effort de pêche sur les<br />
espèces soumises à des plans de restauration.<br />
Dans ce contexte, et compte-tenu des dossiers d’arrêt définitif programmés au 30 avril 2004, les<br />
autorités françaises sont en mesure de confirmer à la Commission que la capacité totale de la flotte de<br />
métropole respectera ses niveaux de référence au 31 décembre 2004.<br />
En complément, les autorités françaises souhaitent indiquer à la Commission qu’à la date du 30<br />
avril 2004, le niveau global de la flotte de métropole, qui est communiqué mensuellement à la<br />
35
Commission par les autorités françaises dans le cadre des mises à jour du fichier flotte, respecte les<br />
niveaux de référence au 31 décembre 2004. La capacité totale de la flotte s’établit en effet à 892 311<br />
kW et 210 326 GT par rapport à un objectif de 893 340 kW et 223 349 GT.<br />
4 – RAPPORT DE SYN<strong>THE</strong>SE SUR LES FAIBLESSES ET LES AVANTAGES DU<br />
SYSTEME DE GESTION DE LA FLOTTE<br />
Les autorités françaises considèrent que le régime d’encadrement global de la flotte de pêche<br />
qui a été mis en œuvre depuis le 1 er janvier 2003 et qui s’accompagne de la possibilité de<br />
plans de gestion et de plans de restauration, représente une nette amélioration par rapport au<br />
POP IV.<br />
Des améliorations de ce système d’encadrement sont néanmoins à rechercher, notamment en ce<br />
qui concerne les conséquences de l’encadrement global sur le renchérissement du coût des navires et<br />
sur le renouvellement des navires. Ce renchérissement est observé sur le marché des navires<br />
d’occasion en France ; il freine d’autant le renouvellement que le propriétaire est incité à maintenir son<br />
navire en flotte le plus longtemps possible en spéculant sur cette augmentation, ce qui, par ailleurs<br />
contribue à maintenir en flotte des navires de plus en plus âgés et de moins en moins sûrs. Les<br />
autorités françaises considèrent qu’il est souhaitable de remédier à cette situation en clarifiant la notion<br />
de droit d’accès à chaque pêcherie, pour chaque navire ou armement, tout en s’opposant à la<br />
transférabilité des droits de pêche au moyen du marché.<br />
S’agissant du respect, en général, des dispositions sur la flotte, les autorités françaises ont<br />
communiqué en 2003, à la demande de la Commission et dans le cadre du rapport annuel sur les<br />
contrôles effectués, les informations demandées. Bien évidemment, les contrôles effectués sur la<br />
puissance et le tonnage sont à la base du respect du régime de gestion des entrées et des sorties de<br />
capacité. Toute modification de puissance ou de tonnage est en effet soumise à la délivrance d’un<br />
permis de mise en exploitation qui définit les caractéristiques du navire en activité, et en particulier la<br />
longueur, le tonnage et la puissance. Le non-respect de ces caractéristiques entraîne la caducité du<br />
PME.<br />
S’agissant de la jauge, avant toute construction d’un navire, l’armateur a l’obligation de faire<br />
parvenir au service des Douanes (ministère de l’économie, des finances et de l’industrie, direction<br />
générale des douanes et des droits indirects) une déclaration de mise en construction. Lorsque la<br />
construction est suffisamment avancée pour permettre un jaugeage effectif, les services des Douanes<br />
mesurent le navire et délivrent un certificat de jauge. La production de ce certificat par le propriétaire<br />
est obligatoire pour permettre la délivrance de l’acte de francisation par les Douanes.<br />
Lorsque le propriétaire du navire décide d’effectuer, par la suite une modification des<br />
caractéristiques de son navire, il saisit le service des Douanes en l’informant des transformations<br />
envisagées. Les services des Douanes, s’ils estiment que les travaux prévus sont susceptibles d’avoir<br />
une influence sur la jauge, procèdent alors à un rejaugeage du navire.<br />
Toute constatation d’une non concordance entre les mentions inscrites sur le certificat de jauge<br />
et la jauge effective du navire peut être sanctionnée conformément aux articles 222 et 410 du Code des<br />
douanes.<br />
S’agissant de la puissance des navires, et lorsqu’un navire est en construction dans un<br />
chantier, le constructeur du moteur doit produire un certificat attestant de la puissance développée par<br />
le moteur installé lors d’un passage au banc d’essai, conformément au règlement CE n°2930/86, qui<br />
fait référence notamment à la norme ISO 3046/1 deuxième édition, d’octobre 1981, Cette attestation<br />
est certifiée par une société de classification et éventuellement par un organisme de certification. Elle<br />
est conservée dans le dossier du navire par les services déconcentrés des affaires maritimes.<br />
Lors de la visite de mise en service du navire effectuée par le Centre de Sécurité des Navires<br />
(Direction régionale des affaires maritimes, ministère de l’équipement, du logement, du transport, et<br />
de la mer), les inspecteurs s’attachent en particulier à la vérification des caractéristiques du navire<br />
36
Par la suite, l’armateur est dans l’obligation de déclarer tout changement de moteur au service<br />
des affaires maritimes ou toute modification de sa puissance. Cette déclaration est, dans les faits,<br />
également effectuée par les chantiers de construction pour les plus gros navires.<br />
Chaque année, tout navire de pêche subit une visite de sécurité par le Centre de Sécurité des<br />
Navires (CSN), qui constitue également un service déconcentré des affaires maritimes en charge de la<br />
sécurité.<br />
Si, à cette occasion, il est constaté un changement de moteur ou de jauge par rapport à l’an<br />
passé, les inspecteurs du CSN en informent le service des affaires maritimes dont relève le navire, et<br />
qui en assure le suivi administratif. L’armement du navire est alors refusé jusqu’à la mise en<br />
conformité du navire avec le permis de mise en exploitation qui lui a été délivré.<br />
Par ailleurs les services des affaires maritimes, tant administratifs que ceux en charge de la<br />
sécurité s’assurent régulièrement de la cohérence entre les puissances et les jauges, lors de contrôles<br />
documentaires ou d’inspection à bord des navires de pêche.<br />
S’agissant du suivi de la flotte effectué par l’intermédiaire du fichier flotte communautaire, les<br />
autorités françaises veillent à effectuer les mises à jour du fichier dès que possible. Le bilan mensuel<br />
établi par les services de la Commission au 26 avril 2004 fait apparaître le bilan suivant, concernant<br />
les données manquantes :<br />
- 6 informations relatives aux navires ne sont pas fournies de manière exhaustive :<br />
- tonnage des navires : selon les informations dont disposent les autorités françaises, le<br />
bilan du remesurage est le suivant, au 31 décembre 2003 (Cf. annexe 1 pour un bilan détaillé<br />
provenant de l’administration des Douanes) :<br />
- navires de plus de 24 m : 100% en métropole et dans les DOM ;<br />
- navires de 15 à 24 m : 93 % (4 navires à rejauger, dont 2 navires en Méditerranée et 2<br />
navires à la Réunion).<br />
- navires de moins de 15 m : 98 % en métropole (59 navires à rejauger, dont 58 en<br />
Méditerranée) et 92 % dans les DOM (235 navires à rejauger).<br />
S’agissant du tonnage, les autorités françaises poursuivent les efforts entrepris pour terminer le<br />
remesurage exhaustif du tonnage de la flotte, en priorité en métropole.S’agissant des<br />
départements d’outre-mer, les autorités françaises entendent relancer de nouveau le remesurage<br />
du tonnage des navires de ces régions.<br />
- Engins de pêche : 17 navires en métropole et 265 navires dans les départements d’outremer<br />
sont recensés avec l’engin de pêche n°1 manquant.<br />
- Indications relatives au propriétaire, à l’armateur et au lieu de construction : absence pour<br />
4638 navires (57,44 % de la flotte). Les autorités françaises ont transmis le 30 avril<br />
l’ensemble des mises à jour nécessaires afin de remédier à ces lacunes, qui résultaient d’une<br />
programmation retardée de la mise à jour informatique du fichier.<br />
Concernant l’ensemble des informations manquantes, les autorités françaises entendent relancer<br />
les services concernés et les propriétaires de navires afin d’améliorer la qualité des données<br />
transmises.<br />
5 – INFORMATIONS SUR LES CHANGEMENTS DE PROECEDURES<br />
ADMINISTRATIVES CONCERNANT LA GESTION DE LA FLOTTE<br />
S’agissant des procédures administratives relatives à la gestion de la flotte, aucun changement<br />
particulier n’est à signaler en 2003.<br />
37
RESUME FACTUEL<br />
Tonnage<br />
ANNEXE 1<br />
RESPECT DES DISPOSITIONS EN MATIERE DE FLOTTE<br />
Référence METHODE APPLIQUEE<br />
Convention internationale sur le<br />
jaugeage des navires (Londres 1969)<br />
Règlement national sur le jaugeage<br />
(réglement particulier des douanes « le<br />
jaugeage des navires- Livre II): règles<br />
de l’ancienne convention<br />
internationale sur le jaugeage des<br />
navires (Oslo 1947)<br />
Bilan au 31 décembre 2003 par rapport<br />
aux objectifs communautaires et selon<br />
la méthode employée – France sans les<br />
DOM<br />
Navire d’une longueur hors-tout<br />
inférieure à 15 m<br />
Appliquée conformément à la<br />
réglementation communautaire :<br />
navires de plus de 24 m (LHT):<br />
obligatoire depuis 18 juillet 1994 ;<br />
navires de moins de 24 m (LPP) et de<br />
plus de 15 m : cf. décision 95/84/CE<br />
parue au JOCE du 25/03/1995<br />
navires de moins de 15 m (LPP): cf.<br />
décision 95/84/CE parue au JOCE du<br />
25/03/1995<br />
Encore utilisé en attendant le<br />
rejaugeage intégral de la flotte en GT.<br />
Estimation (formule simplifiée<br />
définitive)<br />
98 % estimé (objectif : 100 % au<br />
31/12/1999)<br />
38<br />
Remesurage effectif<br />
Navire d’une longueur entre 15<br />
93 % (objectif : 100 %<br />
m et 24 m<br />
au 31/12/2003)<br />
Navires d’une longueur<br />
100 % (depuis le<br />
supérieure à24 m<br />
31/12/2000) – conforme<br />
à l’objectif )<br />
Contrôle et inspection Le jaugeage de tous les navires est effectué par les Douanes,<br />
préalablement à l’entrée en flotte de toute nouvelle capacité.<br />
Un contrôle annuel (pouvant déboucher sur un nouveau jaugeage)<br />
est effectué lors de la visite annuelle de sécurité du Centre de<br />
Sécurité, service dépendant du ministère de l’équipement, du<br />
logement, des transports, et de la mer (direction régionale des<br />
affaires maritimes).
Puissance des navires<br />
Navires neufs<br />
Règlement CE<br />
n°2930/86, norme ISO<br />
3046/1<br />
Méthode de mesure Contrôle et inspection<br />
Conforme à la réglementation<br />
communautaire : un certificat du<br />
constructeur, après vérification au<br />
banc d’usine, est exigé<br />
systématiquement avant toute entrée<br />
en flotte et conservé par la direction<br />
des affaires maritimes dont dépend<br />
l’immatriculation du navire.<br />
Navires existants Un contrôle annuel est effectué lors de<br />
la visite annuelle de sécurité du Centre<br />
de Sécurité, service dépendant du<br />
ministère de l’équipement, du<br />
logement, des transports, et de la mer<br />
(direction régionale des affaires<br />
maritimes).<br />
Dans le cas d’un changement de<br />
moteur, la procédure prévue pour les<br />
navires neufs s’applique.<br />
39<br />
Ministère de l’agriculture, de<br />
l’alimentation, de la pêche et des<br />
affaires rurales, direction des<br />
pêches maritimes et de<br />
l’aquaculture<br />
Ministère de l’équipement, du<br />
logement, des transports, et de la<br />
mer (direction des affaires<br />
maritimes et des gens de mer,<br />
direction régionale des affaires<br />
maritimes)<br />
Ministère de l’agriculture, de<br />
l’alimentation, de la pêche et des<br />
affaires rurales, direction des<br />
pêches maritimes et de<br />
l’aquaculture<br />
Ministère de l’équipement, du<br />
logement, des transports, et de la<br />
mer (direction des affaires<br />
maritimes et des gens de mer,<br />
direction régionale des affaires<br />
maritimes)
UNITED KINGDOM<br />
UK FISHING FLEET - ANNUAL REPORT FOR 2003<br />
1. Articles 12 and 13 of Commission Regulation (EC) 1438/2003 places a<br />
requirement on Member States to produce an annual report on its efforts<br />
during the previous year to achieve a sustainable balance between fishing<br />
capacity and fishing opportunities. This report covers activity in the UK fishing<br />
fleet during 2003, including specific information on fleet capacity changes<br />
during the year (fleet entries and exits).<br />
General Description of the UK Fishing Fleet:<br />
2. The UK fishing fleet is very diverse in nature, reflecting the wide range of<br />
fishing opportunities that exist around the UK coast. This is illustrated by the<br />
fact that the UK has an interest in over 100 EU quota stocks as well as an<br />
interest in a wide range of non-quota species. UK fisheries can be<br />
categorised into, in broad terms, 4 basic areas of activity:<br />
• North Sea<br />
• West of Scotland<br />
• Irish Sea and the Rest of Area VII (including the Channel fisheries)<br />
• Deep Sea/Distant water fisheries.<br />
The charts below illustrate the relative importance of these four fisheries:<br />
Landings by UK Fleet 2002 (UK & Abroad)<br />
By area of capture<br />
Quantity landed<br />
IV<br />
40%<br />
Others<br />
5%<br />
VII<br />
23%<br />
VI<br />
32%<br />
40<br />
Landings by UK Fleet 2002 (UK & Abroad)<br />
By area of capture<br />
Value of landings<br />
IV<br />
41%<br />
Others<br />
6%<br />
3. In addition, the UK fleet is highly mobile around the UK coast. Commonly<br />
vessels move around between the different sea areas, reflecting the migratory<br />
and seasonal nature of fishing opportunities. For example:<br />
1. Pelagic vessels that follow fisheries that span both the North Sea<br />
and West of Scotland, and additionally that follow separate fisheries<br />
at certain times of the year (e.g. Blue Whiting or Channel Bass<br />
fisheries)<br />
VII<br />
26%<br />
VI<br />
27%
2. Beam trawl vessels that fish part of the time in the North Sea and<br />
part in the Channel fisheries.<br />
As such while UK fleets can broadly be categorised by general areas (e.g. North sea demersal<br />
fleet, West coast pelagic fleet etc.), there is no distinct demarcation of fleets and<br />
thus any measures put in place which impose restrictions in access to fisheries can have a<br />
significant level of impact across the UK fleet as a whole.<br />
4. The charts below illustrate the relative importance of the three basic types of<br />
fishing activity for the UK as a whole:<br />
Quantity landed ('000 tonnes liveweight)<br />
600<br />
500<br />
400<br />
300<br />
200<br />
100<br />
0<br />
Landings by UK vessels into the UK<br />
1998 1999 2000 2001 2002 2003<br />
Shellfish<br />
Pelagic<br />
Demersal/<br />
Whitefish<br />
Background Information on Fleet management in the UK<br />
41<br />
Value landed (£ million)<br />
600<br />
500<br />
400<br />
300<br />
200<br />
100<br />
0<br />
Landings by UK vessels into the UK<br />
1998 1999 2000 2001 2002 2003<br />
Shellfish<br />
Pelagic<br />
Demersal/<br />
Whitefish<br />
5. Fleet management measures in the UK are carried out primarily through the<br />
licensing regime administered by Fisheries Departments in the UK. This<br />
seeks to control both capacity of the UK fishing fleet and also access to the<br />
various fishing opportunities available to UK vessels. The prime mechanism<br />
for doing this is the UK fishing vessel licensing regime.<br />
6. Licensing of vessels first applied in 1977 and covered only fishing vessels<br />
over 40 feet (12.14 metres) in certain fisheries. Following the adoption of the<br />
European Union's Common Fisheries Policy, the UK designated a number of<br />
fish stocks as pressure stocks and introduced a restrictive licensing scheme<br />
for vessels fishing those stocks. The licensing regime initially only covered<br />
vessels over 10 metres registered length, but its coverage has been<br />
progressively extended over the years. In February 1990 the licensing regime<br />
was extended to vessels of over 10 metres overall length fishing for TAC<br />
stocks. Later the same year restrictive licensing was extended to cover all<br />
fishing by vessels over 10 metres overall length with the exception of those<br />
fishing for salmon and migratory trout which were covered by a separate<br />
regime. From May 1993 licensing was extended to vessels of 10 metres and<br />
under overall length.<br />
7. As part of the system, there is an overall limit to the capacity of the fleet<br />
through UK Fisheries Department having ring-fenced overall fleet capacity<br />
since the introduction of licensing was complete in 1993. The result of this is
that, since that time, if an owner wants to bring a new vessel in as an entry to<br />
the UK fishing fleet, this can only be done through the owner purchasing an<br />
existing licence. Each licence has a fleet capacity associated with it in terms<br />
of gross tonnage, engine power and Vessel Capacity Units (a measure of<br />
capacity derived from the physical dimensions combined with the engine<br />
power of the vessel).<br />
8. To enter the fleet, an owner must ensure that they acquire sufficient licence<br />
capacity to cover the requirements of the new vessel, and to cover any penalty<br />
payment, before they can fish. This can be either through a transfer of a<br />
single licence (e.g. if the new vessel coming in is a straight-forward<br />
replacement vessel and is within the dimensions of the replaced vessel) or, if<br />
the vessel is bigger, several existing licences will need to be aggregated<br />
together to ensure that the capacity of the new vessel is fully covered by<br />
existing licences. In most licence transactions penalties are applied to the<br />
capacities involved, with the level of penalty varying depending on the number<br />
of licences involved in the transaction.<br />
9. In some cases, e.g. the replacement of a vessel lost at sea, there can be<br />
some time between a vessel leaving the fleet and its replacement entering the<br />
fleet. Also, for entries where licence aggregations need to be carried out,<br />
there is a need to allow time for owners to find the appropriate licences or<br />
entitlements to put together as part of the aggregation. To allow for this, in the<br />
UK licensing regime allows a vessel owner to take the fishing licence off an<br />
active vessel and convert it to an entitlement to a fishing licence (N.B. when<br />
this is done the original vessel has to either leave the fleet or gain a licence<br />
from elsewhere). These “entitlements” have a fixed life span from the date of<br />
creation, and have the vessel capacity details linked to them in the same way<br />
as a licence. They can thus be used in the same way as an actual licence in<br />
transfers and aggregations.<br />
10. Through this regime, the UK fleet has effectively been ring-fenced in terms of<br />
its total capacity. In addition, the fact that the capacities involved in licence<br />
transactions are subject to penalties means that new entries to the fleet lead<br />
to a reduction in the overall licensed capacity of the UK fleet.<br />
11. In addition to this limitation and penalties at the overall level, there are similar<br />
restrictions for the various fleet sub-segments. For example, if a vessel is to<br />
enter the whitefish fleet, it has to acquire the appropriate category of licence<br />
for the type of activity to be pursued. Similar restrictions apply for the transfer<br />
of pelagic type licences and for other categories of licences for over 10m<br />
vessels where specific fishing authorities apply. Restrictions also prohibit the<br />
aggregation of licences between the under 10m and 10m and over fleets, and<br />
in the under 10m group, it is not permitted to aggregate licences from vessels<br />
under 8m to vessels between 8 and 10m in overall length. This was introduced<br />
to stop the aggregation of fleet capacity into vessels operating at just under<br />
10m.<br />
12. As well as capacity control and reductions through licensing arrangements,<br />
the UK has operated a substantial series of decommissioning exercises have<br />
been carried out by Fisheries Departments to reduce the capacity of the UK<br />
42
fleet and bring it more into line with available fishing opportunities. Each<br />
Fisheries Department in the UK carries out separate exercises as part of an<br />
overall UK programme of such measures. The most recent sets of exercises<br />
were in the period 2001-2002 and during 2003. The latter exercise was<br />
specifically targeted at the reduction of the whitefish fleet capacity and effort<br />
as part of the UK’s implementation of the Community’s cod recovery<br />
measures. The 2001-2002 scheme has been reported on in previous UK<br />
reports as part of the Multi-Annual Guidance Programme Phase IV. More<br />
information on the 2003 exercise is given in the tables below.<br />
Impact of Effort Control and Recovery Plans<br />
13. Key effort control systems affecting the UK fleet in 2003 were:<br />
• Western Waters effort regime (overall fleet effort ceilings (KW days))<br />
• Deep Water Species regime (fleet capacity pot)<br />
• Interim Cod recovery plans (days at sea limitations)<br />
14. Most active work carried out has been with regards to the impact of the interim<br />
Cod recovery plan in 2003 and its modification in 2004. Work has been<br />
carried out to assess the impact of the cod recovery regime during 2003, and<br />
the additional effects of the decommissioning and licence transaction penalties<br />
in the UK. Full details have been provided to the Commission on previous<br />
occasions, and so only a summary of the impact of the measures is included<br />
here for information. Further details can be provided if required.<br />
UK baseline effort data (a)<br />
14.1. Effort in 2001 on trips catching cod<br />
43<br />
Total effort by<br />
vessels over 10m<br />
using all types of<br />
gear<br />
Million KW days<br />
53.307<br />
Effort by vessels<br />
Demersal trawl<br />
etc. 100mm or<br />
greater<br />
Million Kw days<br />
33.456<br />
Of which:<br />
Decommissioning in 2001-02 5.962 4.619<br />
Transfer of whitefish licences to Pelagic Sector 0.695 0.257<br />
Decommissioning in 2003 6.984 5.722<br />
As percentage of baseline effort total:<br />
Decommissioning in 2001-02 11.2% 13.8%<br />
Transfer of whitefish licences to Pelagic Sector 1.3% 0.8%<br />
Decommissioning in 2003 13.1% 17.1%<br />
Total Reduction from decommissioning and<br />
other capacity removal<br />
25.6% 31.7%<br />
Effort by remaining fleet 39.666 22.858<br />
Notes:
(a) Effort data relates to days at sea in the Cod Recovery Zone (As defined in Council Regulation (EC)<br />
2341/2002, Annex XVI) in 2001 by UK over 10m vessels. All data is in Mn KW days effort from days at<br />
sea only for trips in Cod Recovery Zone using one of the 6 defined gear types where cod was caught<br />
15. The above analysis show how fishing effort in 2003 had been reduced by<br />
three identified factors compared to the base period of 2001:<br />
• Vessels that were active in 2001 but left the fleet in the decommissioning<br />
exercises carried out in 2001 and the early part of 2002.<br />
• Capacity of whitefish licences used in licence aggregations involving the<br />
replacement of pelagic vessels in the UK fishing fleet, thereby permanently<br />
removing whitefish capacity.<br />
• The impact of decommissioning vessels in the 2003 exercise.<br />
16. In addition to these factors, there was also the direct impact of the limitations<br />
on days at sea from the regime detailed in Annex XVII of Council Regulation<br />
(EC) 2341/2002. An additional factor was a transitional aid scheme introduced<br />
for the Scottish administered vessels. These payments were made for a<br />
limited period covering 1 st March to 31 st December 2003, with the aim of the<br />
payments being to provide short-term support to help fishermen deal with the<br />
effects of the cod recovery measures (Annex XVII of Council Regulation (EC)<br />
No 2341/2002) and to help manage the process of catching sector<br />
restructuring and rationalisation. Vessels were only eligible for the aid if<br />
owners demonstrated that they were particularly affected by the measures<br />
(i.e. had a demonstrated track-record of activity in the fishery with the key cod<br />
gear for a significant period with a clear economic dependency on the fishery).<br />
Those eligible vessels were required to tie-up in port after having been at sea<br />
for the limited number of days allowed under the Annex XVII regime, rather<br />
than taking advantage of the flexibilities that were allowed and continuing to<br />
fish with other methods or in other areas. Any of the vessels involved that<br />
subsequently went on to take up offers to decommission had their<br />
decommissioning payments reduced by the amount of transitional aid already<br />
paid to them.<br />
17. A transitional aid regime was also put in place for vessels based in Northern<br />
Ireland, which required vessels to tie-up altogether. This aid scheme was<br />
operated for part of 2003, and an additional scheme is being applied in 2004<br />
as well due to the extension of recovery plans into the Irish Sea in 2004.<br />
18. Overall, it is estimated that these additional factors, the effort reduction regime<br />
and the transitional aid schemes, contributed approximately an additional 35%<br />
reduction in the fishing effort exerted by the key fishing fleet that targets cod;<br />
those vessels using demersal trawl with a mesh size of 100mm or more. The<br />
reduction in cod fishing effort achieved during 2003 was therefore around the<br />
65% required compared to the level of fishing effort seen in 2001.<br />
44
Fleet Entry and Exit regime in 2003<br />
19. The Entry:Exit regime introduced by Commission Regulation (EC) No.<br />
1483/2003 mirrors the regime already in place for vessels to enter the UK<br />
licensed fishing fleet (see details above). The ability to take into account<br />
entries to the fleet linked to entitlements created through fleet exits that took<br />
place before 1 January 2003 (i.e. “coups partis”) has allowed the UK to cover<br />
the transition from the UK regime to the Regulation’s regime. The<br />
requirements of the Regulation have not necessitated a significant level of<br />
change to the system used in the UK.<br />
20. The table in Annex A summarises the fleet entries and exits during 2003 as a<br />
whole, with Annex B providing more details of the monthly changes to the fleet<br />
and Annex C providing the corresponding fleet reference levels. In each case<br />
the fleet situation at the end of the period is compared against the fleet<br />
reference ceiling allowed.<br />
21. The fleet reference ceilings for the UK in Annexes A and C have been<br />
adjusted from the 1 st January 2003 position for three factors:<br />
• Adjustments for fleet entries during 2003 linked to entitlements created<br />
between 1/1/2000 and 31/12/2002 – “coups partis”.<br />
• Decommissioning of UK vessels in 2003.<br />
• The final impact of the remeasurement of UK vessels 15m and over on a<br />
Gross Tonnage basis.<br />
Full details at the level of individual vessels and entitlements involved in the first two of<br />
these factors have been separately provided to the Commission, and so only summary<br />
details are presented in this report and in the associated annexes.<br />
22. With regards to fleet exits linked to decommissioning, there were three<br />
exercises carried out during 2003 by UK Fisheries Departments, where offers<br />
to decommission were accepted by the owners of a total of 106 UK vessels<br />
over 10m overall length. The capacity of these vessels was as follows:<br />
Details of the results of UK decommissioning exercises 2003:<br />
Country based in: No. of Total tonnage Total Engine power<br />
vessels (tonnes)<br />
(Kw)<br />
England 20 2,503 7,404<br />
Northern Ireland 19 1,952 5,900<br />
Scotland 67 12,276 31,659<br />
Total<br />
Of which:<br />
106 16,730 44,963<br />
- left UK Register during<br />
2003<br />
86<br />
13,981<br />
37,820<br />
23. There were some delays in starting the exercises in 2003 as various aspects<br />
of the schemes had to be revised and cleared with the Commission. This led<br />
to a consequent need to extend the final deadlines for applications before<br />
offers could be made. There was also a need to send out offers to additional<br />
45
sets of owners and vessels, after some of those to whom offers had initially<br />
been made decided not to accept them. Of the total number of vessels<br />
involved, as at the end of 2003 86 of the vessels involved had actually left the<br />
UK vessel register and been scrapped. However, all of the 106 vessels<br />
involved had surrendered their fishing licences as part of their acceptance of<br />
the decommissioning offers, and thus their fishing capacity and effort had<br />
been removed permanently from the UK fleet. The outstanding 20 vessels will<br />
be recorded as leaving the UK fleet register during 2004 and will thus be<br />
included as adjustments in subsequent fleet reports. Full details of the<br />
individual vessels involved have been provided separately to Commission staff<br />
and so only summary details are presented in this report.<br />
With regards to fleet entries links to entitlements to licences created by administrative<br />
decisions taken during 1 st January 2000 to 31 st January 2002, the issue was<br />
investigated in depth with Commission staff during the discussions to establish<br />
Commission Regulation (EC) 1438/2003. These discussions resulted in a final list of<br />
entitlements that were regarded as eligible for incorporation as adjustments to the<br />
fleet ceilings when fleet entries took place associated with them took place. The<br />
table below summarises the level of fleet entries associated with these entitlements<br />
that took place in 2003. Full details at the level of individual vessels and entitlements<br />
involved have been separately provided to the Commission, and so only summary<br />
details are presented in this report:<br />
Details of Fleet Entries in 2003 linked to Entitlements created in 2000-2002<br />
46<br />
Total tonnage<br />
(tonnes)<br />
Total Engine<br />
power<br />
(Kw)<br />
Total capacity linked to eligible entitlements 16,9<strong>05</strong> 55,362<br />
Capacity of fleet entries during 2003<br />
linked to these entitlements<br />
8,588 23,286<br />
Remaining capacity still left in entitlements 8,317 32,076<br />
24. There were no fleet entries linked to public aid as Fisheries Departments in<br />
the UK have a policy of not using public funds for such entries. Similarly there<br />
are no increases in vessel tonnages linked to safety factors.<br />
25. As the Table in Annex A illustrates, the UK fleet at the end of 2003 was 1.3%<br />
within the fleet tonnage ceiling and 1.6% within the fleet engine power ceiling,<br />
after adjusting for the impact of decommissioning with public aid and fleet<br />
entries linked to entitlements created in the period 1 st January 2000 to 31 st<br />
December 2003, and adjusting the fleet reference levels for the impact of<br />
remeasurement of vessels onto a Gross Tonnage basis. The UK was thus<br />
compliant with the measures set out in Commission Regulation (EC)<br />
1438/2003.
Strengths and weaknesses of UK Regime<br />
26. There are several particular strengths of the UK licensing system:<br />
• It effectively means that the Entry:Exit regime brought into existence by<br />
Commission Regulation (EC) 1438/2003 was already established in the UK.<br />
The system used is closely linked to the regime used to allocate fishing<br />
quotas each year to Producer Organisations in the UK for them to manage.<br />
It is thus an accepted mechanism for Fisheries Departments to control entry<br />
to the fleet as a whole and also to control access to particular fisheries, and<br />
compliance is strictly enforced by Fisheries Departments.<br />
• Regular exercises are carried out to ensure that only vessels licensed to fish<br />
are present on the UK vessel register, and that only licensed vessels are<br />
actually fishing.<br />
• Action is taken against any vessel found by enforcement officers to be fishing<br />
without having a valid UK licence.<br />
• A penalty regime in some form has been in place for several years and the<br />
industry has had to become used to it being a significant factor in their<br />
planning for fleet entries.<br />
• The effective ring fencing that the UK regime provides does establish<br />
constraints on fishermen, and offers some protection against unsustainable<br />
capacity or fishing effort increases. For example, there have been some<br />
concerns voiced over the potentially harmful impacts of any diversion of effort<br />
by the main whitefish fleet away from their traditional activities into other<br />
areas. The UK regime prevents this fishing capacity simply switching to, for<br />
example, pelagic fishing, which would be regarded as destabilising.<br />
• The mechanism has worked to help constrain and reduce the UK fleet<br />
capacity as well as capacity within individual segments.<br />
• The licensing system has also been used to control fishing opportunities – for<br />
example with separate categories of licences to control each vessel’s ability<br />
to fish for different types of fish.<br />
• The system has also been used as the mechanism to introduce other control<br />
measures, e.g. through variations of the licence conditions.<br />
27. The major limitation of the regime is one common to any Entry:Exit regime, in<br />
that the reductions in fleet capacity that can be achieved are limited. For<br />
example, reductions through the application of penalties on licence<br />
transactions are only seen if such transactions actually take place. However,<br />
only a relatively small proportion of the total fleet capacity will be involved in<br />
such transactions during any period. For example, experience over recent<br />
years has shown that on average around 5% of fleet capacity changes<br />
ownership each year, through either 1:1 transactions of through aggregations.<br />
With 5% of fleet capacity turning over each year, a 10% penalty regime on all<br />
transactions will only give you a 0.5% reduction in overall fleet capacity each<br />
year. Thus in most situations, the Entry:Exit regime cannot be a major<br />
contributor to any overall fleet capacity reduction.<br />
47
Changes to procedures in the UK<br />
28. On 16 March 2001 Fisheries Ministers announced their wish to move to a<br />
single capacity penalty which would cover both tonnage and engine power<br />
and invited fishing industry to be involved in a working group with officials to<br />
consider the future arrangements. It was envisaged that these arrangements<br />
would take effect from 1 April 2003 and that, in view of the notice that was<br />
being given of the changes, there would be no provision for pipeline cases.<br />
29. In the event, industry members of the Group asked in October 2001 for further<br />
time to consider the proposed changes. Ministers agreed and on 29 October<br />
2001 announced the postponement of the introduction of the new<br />
arrangements. In view of their desire to avoid pipeline cases they also<br />
undertook to give 18 months notice of the new regime.<br />
30. In its third Report to Ministers in November 2002 the Group recommended<br />
that a decision on the level of penalty should be postponed until the results of<br />
further developments in fleet control measures, notably those arising out of the<br />
2002 Review of the Common Fisheries Policy, were known. In the light of<br />
those developments, the Group was reconvened to consider the future level of<br />
UK capacity penalties.<br />
31. The Group met twice in May and July 2003, and has made several<br />
recommendations to Ministers, including the recommendation that licence<br />
transfer penalties should move away from the use of VCUs as mentioned<br />
above to be a straight system based on penalties applied in both tonnage and<br />
engine power terms. Fisheries ministers are currently reviewing the<br />
recommendations made before taking final decisions on the changes to be<br />
made to the system. These will be announced shortly.<br />
June 2004<br />
DEPARTMENT <strong>OF</strong> ENVIRONMENT, FOOD AND RURAL AFFAIRS<br />
SCOTTISH EXECUTIVE, ENVIRONMENT AND RURAL AFFAIRS DEPARTMENT<br />
DEPARTMENT <strong>OF</strong> AGRICULTURE AND RURAL DEVELOPMENT, NOR<strong>THE</strong>RN<br />
IRELAND<br />
Tables (in Excel file “Entries and exits 2003 EU tables.XLS”):<br />
48
Annex A<br />
ENTRY:EXIT SUMMARY – SUMMARY <strong>OF</strong> ENTRIES INTO AND EXITS<br />
FROM <strong>THE</strong> UK FISHING FLEET DURING 2003, ALONG WITH ADJUSTMENTS<br />
TO UK FLEET REFERENCE LEVELS<br />
•<br />
UK Fleet entries and Exits – 1 January 2003 to 1 January 2004<br />
As part of the revisions to the CFP agreed in December 2002, it was agreed that a fleet Entry:Exit Regime would be established by<br />
Member States. The basic principles of the regime are that:<br />
� Member States have to keep their total registered fleet tonnage and engine power below the levels seen at 1/1/2003<br />
� These levels will be adjusted up to take account of some fleet entries linked to entitlements created before 1/1/2003<br />
� These levels will be adjusted down to take account of any exits from the fleet due to decommissioning exercises after 31/12/2002<br />
The UK position with regards to the EU Entry:Exit regime has been calculated. These estimates include details for the fleets of the Isle of<br />
Man and Channel Islands<br />
UK Fleet entries and Exits during 1/1/2003 to 1 January 2004:<br />
Total GT Total KW<br />
� UK Fleet as at 1/1/2003 (MAGP report)<br />
Fleet entries from 1/1/2003 to 1/1/2004:<br />
240.898 947.965<br />
� Linked to entitlements created before 1/1/2003 eligible for inclusion 8.588 23.286<br />
� Other entries (e.g. using entitlements created in 2003) 20.683 58.395<br />
� Total Entries<br />
Fleet exits from 1/1/2003 to 1/1/2004<br />
29.271 81.681<br />
� Linked to decommissioning exercises using public aid: 13.981 37.820<br />
� Other exits 22.151 73.568<br />
� Total Exits 36.132 111.388<br />
UK Fleet position as at 1/1/2004 (�+�-�) 234.037 918.258<br />
� Impact of GT Remeasurement on 1/1/2003 position 1.556 0<br />
Revised UK Fleet ceiling (�+�+�-�) 237.061 933.431<br />
UK Position compared to revised fleet ceiling: -1,28% -1,63%<br />
NB UK fleet position as at 1/1/2003 is as per the UK MAGP report for the end of MAGP IV but with tonnages of vessels<br />
revalorised to take account of the impact of the completion of the remeasurement of >15m vessels to a GT basis<br />
49
Annex B<br />
EU REPORT ENTRY:EXIT – MONTHLY INFORMATION ON FLEET<br />
ENTRIES AND EXITS THROUGH 2003.<br />
•<br />
Entry/Exit regime - Summary Report of UK Fleet Changes During 2003<br />
GT Fleet Fleet changes during the month:<br />
Fleet Fleet ceiling/<br />
at start of Fleet entries Fleet Exits at end of Reference Compliant?<br />
month<br />
Entitlements<br />
month Level<br />
Country Months<br />
("coups partis") other entries With public Aid Other Exits<br />
GBR 1/01/2003 240.898 324 112 0 1.743 239.592 241.352 Compliant<br />
GBR 1/02/2003 239.592 742 253 0 2.334 238.252 242.223 Compliant<br />
GBR 1/03/2003 238.252 9 2.801 0 471 240.591 242.362 Compliant<br />
GBR 1/04/2003 240.591 88 398 0 2.046 239.031 242.580 Compliant<br />
GBR 1/<strong>05</strong>/2003 239.031 84 310 0 4.522 234.904 242.794 Compliant<br />
GBR 1/06/2003 234.904 737 493 0 2.990 233.143 243.660 Compliant<br />
GBR 1/07/2003 233.143 384 4.385 577 594 236.741 243.597 Compliant<br />
GBR 1/08/2003 236.741 1.266 278 640 1.606 236.038 244.352 Compliant<br />
GBR 1/09/2003 236.038 2.240 452 2.326 1.184 235.221 244.397 Compliant<br />
GBR 1/10/2003 235.221 2.424 557 4.310 2.349 231.544 242.641 Compliant<br />
GBR 1/11/2003 231.544 241 677 3.924 693 227.845 239.087 Compliant<br />
GBR 1/12/2003 227.845 49 9.969 2.2<strong>05</strong> 1.620 234.037 237.061 Compliant<br />
FOR YEAR 240.898 8.588 20.683 13.981 22.151 234.037 237.061 Compliant<br />
KW Fleet Fleet changes during the month:<br />
Fleet Fleet ceiling/<br />
at start of Fleet entries Fleet Exits at end of Reference Compliant?<br />
month<br />
Entitlements<br />
month Level<br />
Country Months<br />
("coups partis") other entries With public Aid Other Exits<br />
GBR 1/01/2003 947.965 824 567 0 3.983 945.373 948.789 Compliant<br />
GBR 1/02/2003 945.373 2.578 1.080 0 5.517 943.514 951.367 Compliant<br />
GBR 1/03/2003 943.514 297 8.565 0 1.937 950.439 951.664 Compliant<br />
GBR 1/04/2003 950.439 900 2.346 0 9.538 944.147 952.564 Compliant<br />
GBR 1/<strong>05</strong>/2003 944.147 567 7.279 0 8.534 943.459 953.131 Compliant<br />
GBR 1/06/2003 943.459 1.998 1.544 0 6.613 940.388 955.129 Compliant<br />
GBR 1/07/2003 940.388 909 13.353 1.346 2.413 950.891 954.692 Compliant<br />
GBR 1/08/2003 950.891 2.238 1.920 1.700 10.901 942.448 955.230 Compliant<br />
GBR 1/09/2003 942.448 5.315 3.541 6.310 4.534 940.460 954.235 Compliant<br />
GBR 1/10/2003 940.460 6.000 3.382 11.385 5.558 932.899 948.850 Compliant<br />
GBR 1/11/2003 932.899 895 2.796 10.755 4.169 921.666 938.990 Compliant<br />
GBR 1/12/2003 921.666 765 12.022 6.324 9.871 918.258 933.431 Compliant<br />
FOR YEAR 947.965 23.286 58.395 37.820 73.568 918.258 933.431 Compliant<br />
50
Annex C<br />
EU REPORT REFERENCE LEVELS – MONTHLY RECALCULATION <strong>OF</strong> UK<br />
FLEET REFERENCE LEVELS TAKING INTO ACCOUNT FLEET ENTRIES<br />
LINKED TO ENTITLEMENTS (“COUPS PARTIS”) AND FLEET EXITS WITH<br />
PUBLIC AID (DECOMMISSIONING).<br />
Reference levels - Revisions to Reference Levels for the UK Fishing Fleet During 2003<br />
GT Fleet at 1/1/2003 using 1/1/2003 GT 240.898<br />
Country Months<br />
Position<br />
at start of<br />
month<br />
Fleet at 1/1/2003 using 1/1/2004 GT 242.454<br />
Revalorisation over year 1.556<br />
Entitlements created<br />
between 1/1/200 and<br />
31/12/2002<br />
51<br />
Safety tonnage<br />
increases ∆R(GT-GRT)<br />
Reductions Fleet ceiling/<br />
Exits linked to<br />
public aid<br />
Revised<br />
Reference<br />
Level<br />
GBR 1/01/2003 240.898 324 0 130 0 241.352<br />
GBR 1/02/2003 241.352 742 0 130 0 242.223<br />
GBR 1/03/2003 242.223 9 0 130 0 242.362<br />
GBR 1/04/2003 242.362 88 0 130 0 242.580<br />
GBR 1/<strong>05</strong>/2003 242.580 84 0 130 0 242.794<br />
GBR 1/06/2003 242.794 737 0 130 0 243.660<br />
GBR 1/07/2003 243.660 384 0 130 577 243.597<br />
GBR 1/08/2003 243.597 1.266 0 130 640 244.352<br />
GBR 1/09/2003 244.352 2.240 0 130 2.326 244.397<br />
GBR 1/10/2003 244.397 2.424 0 130 4.310 242.641<br />
GBR 1/11/2003 242.641 241 0 130 3.924 239.087<br />
GBR 1/12/2003 239.087 49 0 130 2.2<strong>05</strong> 237.061<br />
GBR YEAR 240.898 8.588 0 1556 13.981 237.061<br />
KW<br />
Country Months<br />
Position<br />
at start of<br />
month<br />
Entitlements created<br />
between 1/1/200 and<br />
31/12/2002<br />
Additions:<br />
Additions:<br />
Safety tonnage<br />
increases<br />
Reductions Fleet ceiling/<br />
Exits linked to<br />
public aid<br />
Revised<br />
Reference<br />
Level<br />
GBR 1/01/2003 947.965 824 0 0 948.789<br />
GBR 1/02/2003 948.789 2.578 0 0 951.367<br />
GBR 1/03/2003 951.367 297 0 0 951.664<br />
GBR 1/04/2003 951.664 900 0 0 952.564<br />
GBR 1/<strong>05</strong>/2003 952.564 567 0 0 953.131<br />
GBR 1/06/2003 953.131 1.998 0 0 955.129<br />
GBR 1/07/2003 955.129 909 0 1.346 954.692<br />
GBR 1/08/2003 954.692 2.238 0 1.700 955.230<br />
GBR 1/09/2003 955.230 5.315 0 6.310 954.235<br />
GBR 1/10/2003 954.235 6.000 0 11.385 948.850<br />
GBR 1/11/2003 948.850 895 0 10.755 938.990<br />
GBR 1/12/2003 938.990 765 0 6.324 933.431<br />
GBR YEAR 947.965 23.286 0 37.820 933.431
GREECE<br />
ΕΛΛΗΝΙΚΗ ∆ΗΜΟΚΡΑΤΙΑ Αθήνα, 07 - <strong>05</strong> -2004<br />
ΥΠΟΥΡΓΕΙΟ ΑΓΡΟΤΙΚΗΣ ΑΝΑΠΤΥΞΗΣ Αρ. Πρωτ.: 173923<br />
ΚΑΙ ΤΡΟΦΙΜΩΝ<br />
ΓΕΝΙΚΗ ∆/ΝΣΗ ΑΛΙΕΙΑΣ<br />
∆/ΝΣΗ ΘΑΛ. ΑΛΙΕΙΑΣ ΠΡΟΣ: <strong>DG</strong> FISH-<br />
Gestion des Flottes<br />
ΤΜΗΜΑΤΑ : 1 ο – 2 ο – 3 ο<br />
Πληροφορίες: Χ. Χατζιδάκη- ∆.Μητρόπουλο-<br />
Α.Χατζησπύρου<br />
Τηλέφωνο : (210) 2125274- 2125278 - 2125318<br />
ΘΕΜΑ: “ Ετήσια έκθεση 2003 για το στόλο ”<br />
Στα πλαίσια του άρθρου 12 και 13 του Καν.1438/2003, σας διαβιβάζουµε την<br />
ετήσια έκθεση, σχετικά µε τις προσπάθειες που ασκήθηκαν κατά το έτος 2003<br />
στον αλιευτικό στόλο της χώρας µας, για την επίτευξη µιας βιώσιµης ισορροπίας<br />
µεταξύ της αλιευτικής ικανότητας και των αλιευτικών δυνατοτήτων.<br />
Γενική περιγραφή του αλιευτικού µας στόλου σε σχέση µε τους τύπους αλιείας-<br />
Μείωση της αλιευτικής ικανότητας .<br />
Κατά το έτος 2003 και στα πλαίσια του Επιχειρησιακού Προγράµµατος Αλιείας<br />
2000-2006 που έχει εγκριθεί για τη Χώρα µας µε την αριθµ. Ε.817/28-3-2001<br />
Απόφαση της Ε.Ε. για τον ελληνικό στόλο, εφαρµόστηκαν :<br />
- Μέτρα αναπροσαρµογής της αλιευτικής ικανότητας του στόλου, µε στόχο τη<br />
σταθερή και διαρκή ισορροπία µεταξύ της αλιευτικής ικανότητας και των<br />
αλιευτικών δυνατοτήτων. Έτσι κατά το 2003 αποσύρθηκε από τον ελληνικό<br />
στόλο , µε χορήγηση δηµόσιας ενίσχυσης, αλιευτική ικανότητα που αντιστοιχεί<br />
σε 4.965 GT και 26.161 KW.<br />
- Χορηγήθηκαν οικονοµικές ενισχύσεις για τον εκσυγχρονισµό και την<br />
ανανέωση των αλιευτικών σκαφών, σύµφωνα µε το νοµοθετικό πλαίσιο που<br />
απορρέει από τις Κοινοτικές ∆ιατάξεις για την εφαρµογή της Κ.Αλ.Π. και το<br />
εθνικό πλαίσιο εφαρµογής. Έτσι κατά το έτος 2003 χορηγήθηκαν οικονοµικές<br />
ενισχύσεις (∆ηµόσια δαπάνη ) ύψους 1.755.972 ευρώ για τον εκσυγχρονισµό<br />
αλιευτικών σκαφών και ύψους 399.<strong>05</strong>4 ευρώ για την ανανέωση αλιευτικών<br />
σκαφών.<br />
Κατά τη διάρκεια του έτους 2003 δεν εφαρµόστηκαν πολυετή σχέδια<br />
διαχείρισης και σχέδια αποκατάστασης λόγω µη θέσπισης τέτοιων σχεδίων για την<br />
αλιεία στη Μεσόγειο.<br />
52
Η αλιευτική ικανότητα του στόλου την 1/1/03 και την 31/12/03 , όπως αυτή<br />
εµφανίζεται από την εκτύπωση του ΚΑΜ την 30 η Απριλίου 2004 είναι από άποψη<br />
χωρητικότητας σε GT, 102.688 GT και 98.995 GT αντίστοιχα, ενώ από άποψη<br />
ισχύος σε KW , 596.878 KW και 571.506 KW αντίστοιχα .<br />
Ως εκ τούτου η κατάσταση του στόλου που αφορά την περίοδο από 1/1/2003<br />
έως 31/12/2003, παρουσιάζει µείωση της αλιευτικής ικανότητας του στόλου από<br />
άποψη χωρητικότητας(GT) και ισχύος µηχανών(KW). Επισηµαίνουµε ότι η<br />
αλιευτική ικανότητα από άποψη χωρητικότητας σε GT είναι η εκτιµώµενη<br />
δεδοµένου ότι λόγω ανωτέρας βίας δεν έχει ολοκληρωθεί η επανακαταµέτρηση 8<br />
αλιευτικών σκαφών σε πραγµατικό GT.<br />
Τήρηση του καθεστώτος εισόδων / εξόδων και των επιπέδων αναφοράς .<br />
- Το έτος 2003 η αλιευτική ικανότητα που εισήλθε στο στόλο συνοδευόταν από<br />
αφαίρεση ανάλογης αλιευτικής ικανότητας , πλην της περίπτωσης αλιευτικών<br />
σκαφών µικρής παράκτιας αλιείας, µε µήκος µεταξύ καθέτων µικρότερο των επτά<br />
(7) µ. και ισχύος µηχανών µικρότερης των 15 ΗΡ , για τα οποία έχει εγκριθεί η<br />
αντικατάστασή τους µε αύξηση της αλιευτικής τους ικανότητας µε διοικητικές<br />
Αποφάσεις έγκρισης µέχρι 31-12-2002 στα πλαίσια εφαρµογής της παραγρ.4,<br />
του άρθρου 7, του Καν.(ΕΚ) 2792/99 και της Εθνικής νοµοθεσίας Π.∆. 261/91.<br />
Το εθνικό καθεστώς εισόδων / εξόδων συµπεριλαµβανοµένης και της<br />
κατηγορίας σκαφών της µικρής παράκτιας αλιείας, είχε κοινοποιηθεί στην<br />
Ευρωπαϊκή Επιτροπή στα πλαίσια της Απόφασης 97/413/ΕΚ.<br />
Συνηµµένα παρατίθεται πίνακας µε τις διοικητικές αποφάσεις έγκρισης της<br />
εισόδου στο στόλο αλιευτικής ικανότητας , που έχουν εκδοθεί από 1/1/2000 έως<br />
και 31/12/2002 , καθώς και τα στοιχεία που αφορούν την υλοποίηση της<br />
αντικατάστασης των σκαφών και τη χορήγηση οικονοµικής ενίσχυσης εντός του<br />
έτους 2003.<br />
Επισηµαίνεται ότι η ολοκλήρωση της διαδικασίας εισόδου στο στόλο, βάσει<br />
των παραπάνω διοικητικών αποφάσεων έγκρισης, θα έχει ολοκληρωθεί το 20<strong>05</strong>,<br />
στα πλαίσια της τριετίας, από την έκδοση της εγκριτικής διοικητικής Απόφασης .<br />
- Το έτος 2003 :<br />
• δεν εισήχθησαν στο στόλο µε οικονοµική ενίσχυση σκάφη ολικής<br />
χωρητικότητας άνω των 100 GT, καθώς επίσης δε χορηγήθηκε δηµόσια<br />
ενίσχυση για αύξηση της χωρητικότητας για λόγους ασφαλείας (άρθρο 11,<br />
παρ.5 του Καν.Ε.Ε./2371/2002), στα πλαίσια του εκσυγχρονισµού του στόλου.<br />
• Η αλιευτική ικανότητα που εισήλθε στο στόλο, χωρίς κρατική ενίσχυση (άρθρο<br />
13 παρ.1 α του Καν.Ε.Ε.2371/2002) αντιστοιχεί σε 3.265 GT και 9.927 KW .<br />
• Η αλιευτική ικανότητα που εισήλθε στο στόλο, µε ∆ηµόσια ενίσχυση (άρθρο 13<br />
παρ.1β ι του Καν.Ε.Ε.2371/2002) αντιστοιχεί σε 33 GT και 261 KW .<br />
53
• Η αλιευτική ικανότητα των σκαφών που εξήλθαν από το στόλο, µε ∆ηµόσια<br />
ενίσχυση µετά την 31/12/2002 αντιστοιχεί σε 4.965 GT και 26.161 KW .<br />
• Η προσαρµογή των τελικών συνολικών στόχων [∆R(GT-GRT)]από άποψη<br />
χωρητικότητας του ΠΠΠ ΙV, λόγω συµπλήρωσης της επανακαταµέτρησης του<br />
στόλου σε µονάδες χωρητικότητας GT καθώς επίσης και το αποτέλεσµα της<br />
επανακαταµέτρησης του στόλου στις 31/12/2003[∆(GT-GR)], παραµένει<br />
ακόµη το εκτιµώµενο , δεδοµένου ότι υπάρχουν 8 σκάφη τα οποία για λόγους<br />
ανωτέρας βίας δεν έχουν ολοκληρώσει την επανακαταµέτρηση σε<br />
πραγµατικό GT και ως εκ τούτου οι αναφερόµενοι τύποι δεν λαµβάνονται<br />
υπόψη στους υπολογισµούς . Η εν λόγω επανακαταµέτρηση υπολογίζεται ότι<br />
θα πραγµατοποιηθεί το ταχύτερο δυνατόν.<br />
- Βάσει των παραπάνω στοιχείων και των άρθρων 4,6 και 7 του ΚΑΝ.1438/03 :<br />
1) Τα επίπεδα αναφοράς ,σε ότι αφορά τη χωρητικότητα στις 31/12/2003,βάσει<br />
του τύπου R(GT)t=R(GT)03-Gtα+GTs+∆R(GT-GRT), διαµορφώνονται ως εξής:<br />
R (GT) 31-12-2003, = 119.910 - 4.965 = 114.945 GT<br />
2) Τα επίπεδα αναφοράς ,σε ότι αφορά την ισχύ στις 31/12/2003 ,βάσει του<br />
τύπου R(KW)t=R(KW)03-Kwα, διαµορφώνονται ως εξής :<br />
R (KW) 31-12-2003, = 653.497 – 26.161 = 627.336 KW<br />
3) Η αλιευτική ικανότητα του στόλου (GTt και KW t)στις 31/12/2003,σύµφωνα µε τα<br />
στοιχεία του ΚΑΜ είναι GT31-12-2003,=98.995 GT,και KW31-12-2003,=571.506 KW<br />
από άποψη χωρητικότητας και ισχύος αντίστοιχα.<br />
GT03= 102.688 + 33 + 3.265 = 1<strong>05</strong>.986 και<br />
KW03 = 596.878 + 261 + 9.927 = 607.066<br />
- Έχοντας υπόψη τα παραπάνω και σε εφαρµογή των τύπων του άρθρου 7 του<br />
Καν 1438/03 :<br />
GTt
Ο µεγάλος αριθµός δεδοµένων σχετικά µε τα χαρακτηριστικά και τα γεγονότα,<br />
που αφορούν τα σκάφη και απαιτούνται στα πλαίσια εφαρµογής των Κοινοτικών<br />
Κανονισµών 2090/1998 και 839/2002 και του Καν.26/2004 που θα ισχύει από την<br />
1/9/2004 οδηγεί σε , αύξηση της γραφειοκρατικής διαδικασίας που σε συνδυασµό<br />
µε το µεγάλο όγκο των µεταβολών εξ εταιτίας και του µεγάλου αριθµού των<br />
σκαφών έχει σαν αποτέλεσµα να παρατηρούνται ελλείψεις και υστέρηση στην<br />
καταχώρηση και διαβίβαση στην Ε.Ε. των ενηµερωµένων δεδοµένων για τα<br />
σκάφη.<br />
Προσαρµογές διοικητικών διαδικασιών που αφορούν στη διαχείριση του στόλου.<br />
Στα πλαίσια εφαρµογής των απαιτήσεων της αναµορφωµένης Κ.Αλ.Π. και σε<br />
ότι αφορά τη διαχείριση του στόλου, η Χώρα µας :<br />
- Παρακολουθεί τη διαµόρφωση των επιπέδων αναφοράς του στόλου,<br />
σύµφωνα µε τα οριζόµενα στο άρθρο 11 του Καν.(ΕΚ) 2371/02.<br />
- ∆ιαχειρίζεται τις εισόδους / εξόδους αλιευτικής ικανότητας, σύµφωνα µε τα<br />
οριζόµενα στο άρθρο 13 του Καν.(ΕΚ) 2371/02.<br />
- Στα πλαίσια στήριξης της µικρής παράκτιας αλιείας διατηρεί τη δυνατότητα<br />
αύξησης της αλιευτικής ικανότητας στα σκάφη αυτής της κατηγορίας, µε<br />
διάθεση αλιευτικής ικανότητας που είναι δυνατόν να εξοικονοµείται από την<br />
απόσυρση από τον ελληνικό στόλο χωρίς οικονοµική ενίσχυση ανάλογης<br />
αλιευτικής ικανότητας .<br />
- Έχει επιλέξει να προβεί σε νέα ανάληψη υποχρέωσης για δηµόσια ενίσχυση,<br />
για ανανέωση του στόλου µέχρι 31/12/2004,και εποµένως επιτυγχάνει<br />
σταδιακά µείωση της συνολικής ικανότητας του στόλου κατά 3% για ολόκληρη<br />
την περίοδο σε σχέση µε τα ισχύοντα επίπεδα αναφοράς .<br />
- Κατέβαλε σηµαντική προσπάθεια για την ανακαταµέτρηση του στόλου,<br />
σύµφωνα µε τον Καν.(ΕΟΚ)2930/86 όπως αυτός έχει τροποποιηθεί από τον<br />
Καν.(ΕΚ) 3259/94.<br />
- Καθιέρωσε σύστηµα αξιολόγησης και παρακολούθησης της αύξησης της<br />
χωρητικότητας για τη βελτίωση της ασφάλειας επί του σκάφους, των<br />
συνθηκών εργασίας, της υγιεινής και της ποιότητας των προϊόντων, βάσει των<br />
άρθρων 8 και 9 του Καν.(ΕΚ) 1438/2003 της Επιτροπής .<br />
Συνηµµένα: πίνακας διοικητικών αποφάσεων έγκρισης εισόδου στο στόλο.<br />
Ε.∆.<br />
- Γραφείο Γενικού ∆ιευθυντού<br />
- ∆ιεύθυνση Θαλάσσιας Αλιείας<br />
Τµήµα 1 ο<br />
55
Τµήµα 2 ο<br />
Τµήµα 3 ο<br />
Τµήµα 4 ο<br />
56<br />
Ο ΓΕΝΙΚΟΣ ∆ΙΕΥΘΥΝΤΗΣ<br />
ΑΠ. ΤΣΙΩΚΑΣ
IRELAND<br />
ANNUAL REPORT ON <strong>THE</strong> IRISH FISHING FLEET FOR 2003<br />
(Pursuant to Articles 12 and 13 of Commission Regulation (EC) No 1438/2003)<br />
1. General description of the fishing fleet in relation to fisheries:<br />
A new policy governing the licensing and registration of Irish sea-fishing boats was introduced in 2003<br />
following the enactment of the Irish Fisheries (Amendment) Act 2003 and the adoption of Commission<br />
Regulation 1438/2003. (Further information in this regard is provided under section 5 below.) The new<br />
policy essentially retains the fleet segmentation from the Fourth EU Multi-Annual Guidance Programme<br />
and also provides for a separate new Aquaculture segment (aquaculture vessels had previously been<br />
licensed and registered as part of the Specific segment). An outline of the 5 fleet segments in the Irish<br />
fleet, and relevant developments, is provided below.<br />
(i) Refrigerated Seawater (RSW) Pelagic Segment: This segment contains 23 vessels engaged<br />
predominantly in fishing for pelagic species (herring, mackerel, horse mackerel and blue whiting<br />
mainly).<br />
(ii) Beam Trawler Segment: This contains 8 vessels, which are dedicated to beam trawling.<br />
(iii) Polyvalent Segment: This segment comprises 1,300 vessels, the vast majority of the fleet. These<br />
vessels are multi-purpose and include small inshore vessels (netters and potters), and medium and<br />
large offshore vessels targeting whitefish, pelagic fish and bivalve molluscs.<br />
A new scheme for the registration of previously unregistered traditional potting boats in the<br />
inshore fleet was introduced in 2003 following approval from the European Commission.<br />
Applications under this scheme are currently being processed to finality before entering eligible<br />
boats onto the Fishing Boat Register within the polyvalent segment. These vessels, which may<br />
only fish for non-quota species and by means of pots, are being ring-fenced within this segment<br />
and the capacity of these boats may not be used elsewhere in the segment for the purposes of<br />
compliance with the entry/exit scheme. A number of inshore boats licensed under a previous<br />
inshore scheme approved by the Commission have also to be entered on the Fishing Boat<br />
Register. There are 202 vessels remaining to be registered under this earlier scheme, with a total<br />
capacity of approximately 700 GT and 5,500 kW. Provision for the registration of inshore boats,<br />
to allow for final completion of these inshore schemes, is made in footnote (1) to Annex I of<br />
Commission Regulation 1438/2003 concerning reference levels for Member States’ fleets. The<br />
table separately provided by the Commission in relation to the calculation of the reference levels<br />
for Ireland makes provision for 3,904 GT and 35,914 kW in respect of completion of the<br />
registration of the inshore fishing vessels concerned. The Department has separately written to<br />
the Commission in relation to the position concerning registration of inshore vessels.<br />
(iv) Specific Segment: This segment contains 189 vessels, which can fish for bivalve molluscs and<br />
aquaculture species.<br />
Under the new EU fleet management<br />
policy this segment is for the first time subject to compliance with the entry/exit<br />
57
scheme. There had, however, already been in place, at national level, a moratorium<br />
on the licensing of further vessels in this segment, other than through the<br />
transfer of existing licence entitlements. This policy, which had been in place since April 1999,<br />
was designed to ensure the conservation and rational exploitation of bivalve mollusc stocks.<br />
(v) Aquaculture Segment: These vessels must be exclusively used in the management, development<br />
and servicing of aquaculture areas and can collect spat from wild mussel stocks as part of a<br />
service to aquaculture installations, subject to certain restrictions, as have been determined in the<br />
context of Article 1 of Commission Regulation 1438/2003. This segment, which currently contains<br />
8 vessels, is not subject to the entry / exit scheme.<br />
2. Impact, if any, of fishing effort reduction schemes:<br />
A fishing effort regime under Council Regulation 2341/2002 has applied to the Irish fishing fleet in respect<br />
of fishing activity in the specified area in Area VIa. Arrangements to implement the provisions of Annex<br />
XVII of this Regulation were put in place for fishing vessels operating in the specified area. No<br />
decommissioning scheme was introduced in respect of the Irish fishing fleet in 2003.<br />
3. Information on compliance with the entry/exit scheme and with the levels of reference:<br />
Fishing Capacity at 1 January 2003:<br />
The fishing capacity situation of the Irish fleet on 1 January 2003 is as follows:<br />
Segment GT kW<br />
Polyvalent 41,785 143,933<br />
Pelagic 31,996 47,837<br />
Beam Trawler 1,259 5,125<br />
Specific 7,484 30,999<br />
Total 82,524 227,894<br />
It should be noted, however, that the above fishing capacity figures are provisional and subject to adjustment.<br />
The figures will have to be revised to take account of the following :<br />
1. A number of vessels which were remeasured in GT but whose GT values were not yet entered<br />
on the register. (Some registered vessels remeasured in GT had their GT values entered on<br />
the register and are included in the above figures.)<br />
2. A number of inshore vessels which existed prior to 1 January 2003 and which remain to be<br />
registered.<br />
3. Fishing capacity which could be used in respect of the entry of vessels based on<br />
administrative decisions taken between 1 January 2000 and 31 December 2002, in accordance<br />
with Article 6 of Commission Regulation 1438/2003 (‘coup partis’). This ‘coup partis’<br />
provision is only relevant in an Irish context in relation to a maximum of 4,474 GT (arising<br />
from an administrative decision relating to the removal of MFV Veronica from the pelagic<br />
58
segment in 2002) and approximately 3,100 kW (arising from administrative decisions taken<br />
in respect of the polyvalent segment).<br />
The overall fishing capacity situation of the Irish fleet at 1 January 2003 (82,524 GT and 227,894 kW) is in<br />
any event within the reference levels of 86,981 GT and 230,226 kW set down in Annex I to Commission<br />
Regulation 1438/2003. It should be noted that there is sufficient ‘headroom’ between the fishing capacity<br />
situation on 1 January 2003 and the reference levels to cater for the introduction of relevant capacity<br />
under the ‘coup partis’ provision (see point 3 above) when the reference levels are adjusted upwards to<br />
take account of specific segment vessels (see paragraph below titled Specific Segment vessels).<br />
Fishing Capacity at 31 December 2003:<br />
The overall fishing capacity situation of the Irish fleet at 31 December 2003 is 84,892 GT and 227,154 kW.<br />
As with the total fishing capacity figures for 1 January 2003, these figures (which are also subject to<br />
revision – see below) are within the reference levels of 86,981 GT and 230,226 kW. It should be noted that<br />
there is sufficient ‘headroom’ between the fishing capacity situation on 31 December 2003 and the<br />
reference levels to allow for the introduction of relevant capacity under the ‘coup partis’ provision when<br />
the reference levels are adjusted upwards to take account of vessels remeasured in GT and whose GT<br />
values were entered on the register in 2003, specific segment vessels, and capacity which entered the fleet<br />
under the ‘coup partis’ provision in 2003 (see below).<br />
The fishing capacity situation for end 2003 and/or the reference levels require to be adjusted for the reasons set<br />
out hereunder.<br />
Remeasurement:<br />
A programme for remeasurement of the Irish fleet was essentially completed by the end of 2003. While<br />
virtually all vessels with an overall length of 15 metres or greater have been re-measured in GT (about 20<br />
boats not yet remeasured are being actively pursued), it has not yet been possible to enter all of these GT<br />
figures on the register, mainly due to a technical GRT/GT adjustment exercise which had to be carried<br />
out in conjunction with the Commission. This technical adjustment exercise has ultimately proved<br />
successful, if time-consuming, and means that the Irish and EU Registers should now be correctly aligned<br />
in respect of GT values for vessels under 15 metres. It is expected that this exercise will be fully completed<br />
very shortly and the remaining GT values determined in the remeasurement exercise for vessels of 15<br />
metres and more in overall length will then be entered on the register. This will allow the Commission to<br />
adjust the reference levels to take account of the re-measurement of the Irish fleet.<br />
Inshore Vessels:<br />
It is proposed to register all of these vessels, referred to earlier, as soon as possible. The reference levels<br />
will require to be adjusted on completion of this work.<br />
Specific Segment Vessels:<br />
The total capacity of vessels in the Specific (Z) segment of the Irish fleet on 31 December 2002 was 7,484<br />
GT and 30,999 kW. These figures, along with a list of the vessels’ internal numbers, were sent to the<br />
Commission electronically in July 2003. However, in calculating the reference levels for Ireland the<br />
Commission only included 6,706 GT and 28,259 kW in respect of these vessels. The reference levels<br />
require, therefore, to be adjusted upwards by 778 GT and 2,740 kW, in accordance with Footnote (1) to<br />
Annex I of Commission Regulation 1438/2003.<br />
Administrative Decisions:<br />
A total of 889 GT was used towards the entry of four vessels into the fleet under the ‘coup partis’<br />
provision in 2003. The internal fleet numbers of the vessels concerned, and the amount of tonnage used<br />
towards their introduction (arising from the administrative decision referred to earlier), are as follows:<br />
59
Internal Number GT<br />
IRL000I00852 109<br />
IRL000I00853 283<br />
IRL000I00955 283<br />
IRL000I1<strong>05</strong>27 214<br />
The Department is currently examining its records in order to confirm what kilowatt capacity entered the<br />
fleet in 2003 under the ‘coup partis’ provision. It is proposed to forward the relevant information to the<br />
Commission shortly.<br />
The following further information is also of relevance to the Commission in relation to monitoring<br />
compliance with the entry/exit scheme and the levels of reference:<br />
2. No increases in tonnage were granted in 2003 under the “safety tonnage” provisions in Article II<br />
(5) of Council Regulation 2371/2002 and Article 8 of Commission Regulation 1438/2003.<br />
3. No vessels left the Irish fleet with public aid in 2003.<br />
4. No vessels in the Irish fleet were approved for public aid in respect of renewal and modernisation<br />
after 31 December 2002.<br />
With regard to activity on the Irish register in 2003, it might be noted that the licensing (and consequent<br />
registration) of vessels was suspended for a number of months pending the introduction of the new EU<br />
implementing rules on fleet policy (Commission Regulation 1438/2003) and a new national policy on the<br />
licensing and registration of sea-fishing boats.<br />
4. Summary report on the weaknesses and strengths of the fleet management system:<br />
The Irish authorities introduced new software to manage the Irish Fishing Boat Register around the end<br />
of 2002. The incorporation of the historic records held in the old system into the new system has given<br />
rise to a number of difficult technical issues which are now substantially resolved. While this interim<br />
system facilitates timely communication of all fleet data to the Commission and as such meets the legal<br />
requirements in respect of the Fishing Boat Register, the Department has undertaken a comprehensive<br />
new software building programme to provide for an integrated fisheries information system.<br />
The Department is in the latter stages of building a new Integrated Fisheries Information System (IFIS). This new system, which is due to be<br />
operational towards the end of this year, will deliver comprehensive and integrated information on all aspects of fisheries management.<br />
IFIS will greatly support the Department’s business processes as it relates to:<br />
• Issuing of licences for sea-fishing boats<br />
• Registration of sea-fishing boats<br />
• Capacity management of the Irish fishing fleet<br />
• Monitoring the operational activities of fishing vessels via a link to the Irish Naval<br />
Service Lirguard System<br />
• Recording the declared landings of sea-fishing boats and shellfish gatherers as<br />
reported on EU log sheets<br />
• Compilation of statistics on fishing effort and catch for policy development and EU<br />
regulatory compliance<br />
Transmission of reports on vessel registration and fish catch to the EU FIDES II System.<br />
60
The Department has recognised deficiencies in the systems that currently support the key<br />
business processes of vessel licensing, vessel registration and sea fisheries management and<br />
control. The purpose of IFIS is to replace these systems with a single system which will<br />
integrate these related business processes, facilitate access to information for reporting<br />
purposes, enhance the ability of the Department to provide data to and access data from<br />
external agencies, and to maximise the potential for citizen access in line with the<br />
Government’s Action Plan for the Information Society in Ireland.<br />
The IFIS system will provide a single centrally stored database which will contain all<br />
information pertinent to sea fisheries administration and enforcement. The IFIS system will<br />
tightly integrate the currently disparate business processes around licensing, registration,<br />
management measures, vessel monitoring and log book recording, implicitly recognising the<br />
dependencies between these activities. IFIS users, subject to appropriate authorisation and<br />
security, and regardless of their location, will have access to the system via an Intranet<br />
browser on their desktop or portable device. It also means that aspects of the system can be<br />
exposed for citizen access over the public Internet infrastructure.<br />
5. Information on changes of the administrative procedures relevant to the management<br />
of the fleet:<br />
Significant administrative and procedural developments have taken place within the past year in relation<br />
to the management of the Irish fishing fleet. New primary legislation was introduced on 1 July last, in the<br />
form of the Fisheries (Amendment) Act 2003, which transferred functions in relation to the licensing of<br />
sea-fishing boats from the Minister for Communications, Marine and Natural Resources to a new legally<br />
independent Licensing Authority operating under the direction of the Registrar General of Fishing Boats,<br />
a senior Department official. The Licensing Authority is required to be independent in the exercise of its<br />
functions, subject to EU and international law. The Licensing Authority is also subject to such general<br />
policy directives as the Minister may give from time to time. The new legislation also established an<br />
independent appeals system in respect of decisions made by the Licensing Authority.<br />
The Minister introduced a comprehensive new national policy for the licensing and registration of seafishing<br />
boats in November 2003, with the following twin objectives:<br />
• To create a new open and transparent policy which will facilitate the achievement of a sustainable<br />
and viable livelihood for fishermen operating in the various types of fisheries, taking account of<br />
available fishing opportunities and resources<br />
• To ensure compliance with fleet capacity reference levels set down at EU level.<br />
The Licensing Authority is charged with implementing the new policy. This new administrative regime,<br />
which separates policy formulation from service delivery, represents a significant new departure in fleet<br />
management in Ireland. It is designed to meet the sustainable needs of individual fishermen in an<br />
equitable and transparent manner, play a key role in the conservation and management of fishery<br />
resources, and ensure compliance with relevant EU requirements.<br />
Department of Communications, Marine and Natural Resources<br />
Ireland<br />
61
ITALY<br />
Premessa<br />
RELAZIONE ANNUALE 2003 – ART. 12 REG. (CE) N. 1438/2003<br />
La flotta italiana è costituita prevalentemente da navi di piccole dimensioni che utilizzano<br />
nella maggior parte dei casi più di un sistema di pesca ed esercitano la propria attività nella<br />
fascia costiera.<br />
Il tonnellaggio medio è di 14 GT, la potenza motrice media è di 82 kW e l’età media è di 23<br />
anni con una percentuale di navi sotto i 10 anni pari a circa il 14% del totale.<br />
Punto A dell’art.13<br />
Nel corso del 2003 non ci sono state appezzabili variazioni nelle attività di pesca. La<br />
riduzione del numero totale delle navi è stata operata soprattutto nella fascia costiera come si<br />
evince dai dati riportati nella tabella seguente.<br />
Situazione 01/01/2003 Situazione 31/12/2003<br />
Categoria di programma<br />
N.<br />
navi<br />
TSL KW GT*<br />
N.<br />
navi<br />
TSL KW GT*<br />
Cost - Piccola pesca<br />
Costiera<br />
7.169 19.357 181.729 12.511 7.073 19.161 180.109 12.570<br />
Cost - Strascico 1.458 52.801 306.101 66.169 1.470 53.570 311.438 68.125<br />
Cost - Traino pelagico<br />
coppia<br />
4 211 1.361 287 4 211 1.361 287<br />
Cost - Attrezzi passivi 4.078 30.478 285.106 31.021 3.995 30.131 283.209 31.206<br />
Cost - Draga idraulica 672 6.944 72.060 8.715 674 6.962 72.433 8.766<br />
Cost - Polivalenti 1.975 46.235 317.996 56.988 1.958 46.032 316.923 57.431<br />
Med - Strascico e volante 72 11.933 35.621 12.145 75 12.280 36.923 12.808<br />
Med - Attrezzi passivi 6 758 3.037 1.147 9 989 4.503 1.812<br />
Med - Circuizione tonno 77 6.023 28.522 6.168 74 5.929 28.468 6.330<br />
Med - Spadare 0 0 0 0 0 0 0 0<br />
Oceanica 25 11.276 28.827 12.910 26 11.639 30.299 13.400<br />
Totale 15.536 186.016 1.260.360 208.061 15.358 186.904 1.265.666 212.735<br />
* I valori si riferiscono solo alle navi che risultano in possesso della stazzatura in GT.<br />
Punto B dell’art.13<br />
62
Gli effetti, sulla capacità di pesca, dei programmi di riduzione dello sforzo di pesca si possono evidenziare<br />
mettendo a confronto le variazioni intercorse nei singoli segmenti di flotta, dal 2000 al 2003, riportate nella<br />
tabelle seguenti:<br />
Situazione 31/12/2000 Situazione 31/12/2001<br />
Categoria di programma<br />
N.<br />
navi<br />
TSL KW GT*<br />
N.<br />
navi<br />
TSL KW GT*<br />
Cost - Piccola pesca<br />
Costiera<br />
7.820 21.332 195.348 13.179 7.423 20.071 186.007 12.736<br />
Cost - Strascico 1.684 63.969 354.772 75.7<strong>05</strong> 1.553 57.551 326.003 70.678<br />
Cost - Traino pelagico<br />
coppia<br />
6 282 2.090 376 6 282 2.090 376<br />
Cost - Attrezzi passivi 4.454 33.5<strong>05</strong> 303.419 32.192 4.192 30.453 282.456 30.108<br />
Cost - Draga idraulica 693 7.147 74.795 8.863 679 7.015 73.170 8.754<br />
Cost - Polivalenti 2.180 51.625 348.581 60.761 2.067 48.830 331.612 59.043<br />
Med - Strascico e volante 67 11.383 33.674 11.<strong>05</strong>8 75 12.607 37.148 12.730<br />
Med - Attrezzi passivi 6 667 2.728 8<strong>05</strong> 5 594 2.368 717<br />
Med - Circuizione tonno 42 5.016 21.291 4.923 76 6.033 28.486 6.170<br />
Med - Spadare 68 1.555 12.934 1.882 52 1.223 11.044 1.453<br />
Oceanica 23 11.011 26.287 11.822 21 10.131 24.415 11.035<br />
Totale 17.043 207.492 1.375.919 221.566 16.149 194.790 1.304.799 213.800<br />
Situazione 31/12/2002 Situazione 31/12/2003<br />
Categoria di programma<br />
N.<br />
navi<br />
TSL KW GT*<br />
N.<br />
navi<br />
TSL KW GT*<br />
Cost - Piccola pesca<br />
Costiera<br />
7.169 19.357 181.729 12.511 7.073 19.161 180.109 12.570<br />
Cost - Strascico 1.458 52.801 306.101 66.169 1.470 53.570 311.438 68.125<br />
Cost - Traino pelagico<br />
coppia<br />
4 211 1.361 287 4 211 1.361 287<br />
Cost - Attrezzi passivi 4.078 30.478 285.106 31.022 3.995 30.131 283.209 31.206<br />
Cost - Draga idraulica 672 6.944 72.060 8.715 674 6.962 72.433 8.766<br />
Cost - Polivalenti 1.975 46.235 317.996 56.988 1.958 46.032 316.923 57.431<br />
Med - Strascico e volante 72 11.933 35.621 12.145 75 12.280 36.923 12.808<br />
Med - Attrezzi passivi 6 758 3.037 1.147 9 989 4.503 1.812<br />
Med - Circuizione tonno 77 6.023 28.522 6.168 74 5.929 28.468 6.330<br />
Med - Spadare 0 0 0 0 0 0 0 0<br />
Oceanica 25 11.276 28.827 12.910 26 11.639 30.299 13.400<br />
Totale 15.536 186.016 1.260.360 208.062 15.358 186.904 1.265.666 212.735<br />
* I valori si riferiscono solo alle navi che risultano in possesso della stazzatura in GT.<br />
Dall’esame delle tabelle si evidenzia come la riduzione della capacità di pesca sia stata realizzata<br />
prevalentemente negli anni 2000,2001,2002 (numero di navi circa il 9%, TSL circa il 10%, kW circa il 9%, GT<br />
circa il 7%), mentre nel 2003 si registra una leggera inversione di tendenza determinata da varie cause (riapertura<br />
dei termini della circolare “arresto definitivo”; immissione in flotta di naviglio senza offerta di ritiro – attuazione<br />
normativa cosiddetti “Patti Territoriali”; applicazione integrale della normativa comunitaria in merito alle<br />
caratteristiche tecniche – GT in luogo di TSL, kW; etc.).<br />
Punto C dell’art. 13<br />
63
Se si prende in esame il periodo di riferimento 01/01/2003 - 31/12/2003, si evidenzia quanto<br />
01/01/2003 15.536 186.016 208.703 1.260.360<br />
31/12/2003<br />
segue:<br />
15.358 186.904 213.541 1.265.666<br />
* I valori si riferiscono solo alle navi che risultano in possesso della stazzatura in GT.<br />
Per le navi, per le quali si stanno ancora acquisendo i certificati di stazza internazionale, si<br />
possono stimare ulteriori 5.000 GT da aggiungere al totale.<br />
Per quanto riguarda la situazione della flotta italiana rispetto al livello di riferimento si evidenzia che a fronte dei<br />
valori già espressi non ci saranno problemi a rispettarlo entro il 1/1/20<strong>05</strong>, in quanto l’attuale capacità della flotta<br />
italiana è già abbondantemente al di sotto.<br />
Al fine di integrare i dati presenti nel Fleet Register, con le informazioni che attualmente non<br />
possono essere acquisite per via informatica (FIDES), in attesa della entrata in<br />
vigore del<br />
Reg. 26/2004, si comunica quanto segue:<br />
• non risultano agli atti navi che abbiano aumentato la stazza per motivi di sicurezza;<br />
• non risultano agli atti navi di stazza compresa tra 100 e 400 GT, entrate in flotta con<br />
aiuti pubblici a seguito di decisioni amministrative prese successivamente al 1/1/2003;<br />
• in allegato si invia l’elenco delle navi entrate in flotta dopo il 1/1/2003, a seguito di<br />
decisioni amministrative prese antecedentemente a tale data.<br />
Punto D dell’art. 13<br />
L’attuale sistema di gestione della flotta ha il suo punto di forza nella parità “offerta-ritiro”, per il quale<br />
l’Amministrazione è impegnata costantemente nel controllo dei movimenti della navi in flotta attraverso<br />
l’utilizzo di procedure informatizzate che allo stato, essendo ancora gestite a livello centrale, assicurano riscontri<br />
obiettivi.<br />
Peraltro, pur in virtù della gestione della flotta a livello nazionale, è da segnalare che la riconosciuta competenza<br />
delle regioni a statuto speciale comporta provvedimenti a livello normativo non allineati con la gestione centrale<br />
della flotta : ciò costituisce un evidente ostacolo alla corretta gestione della flotta.<br />
L’Amministrazione per ovviare a questa carenza sta adottando ogni utile iniziativa con un maggior<br />
coinvolgimento degli organi regionali.<br />
Punto E dell’art. 13<br />
N. NAVI TSL GT * KW<br />
Si segnala che non sono intervenuti cambiamenti nelle procedure amministrative relative alla gestione della<br />
flotta.<br />
64
NE<strong>THE</strong>RLANDS<br />
1. Algemene beschrijving in relatie tot herstelplannen/ General Description of the<br />
Fishing Fleet in relation to fisheries<br />
Opheffing MOP-inspanningsreductie<br />
De autonome Nederlandse zeedagenregeling dit tot en met 2003 van kracht was kende een<br />
aanvullende MOP-reductiefactor. Deze MOP-reductiefactor was per segment afhankelijk van<br />
de MOP-doelstelling. Deze is ook in 2003 voor de kotters nog toegepast, hoewel strikt<br />
genomen dit niet meer nodig zou zijn geweest omdat het communautaire MOP-instrument per<br />
1 januari 2003 is losgelaten en vervangen door het systeem van herstelplannen. In de<br />
'overgangssituatie' van het jaar 2003, en hangende nader verwachte uitwerking van de<br />
Commissie inzake de vlootregulerende regelgeving is in 2003 de MOP-reductiefactor<br />
vooralsnog gecontinueerd.<br />
Het voorlopig handhaven van de MOP-reductiefactor heeft overigens niet tot grote commotie<br />
geleid omdat de feitelijk beschikbare dagen uit het kabeljauw-herstelplan in redelijke mate<br />
overeen kwamen.<br />
Nagenoeg alle boomkorkotters waarop de nationale zeedagenregeling (en MOPreductiefactor)<br />
van toepassing is, vallen onder het herstelplan-regiem. In cijfers uitgedrukt is<br />
een voorlopige schatting dat ca. 10 van de ca. 330 betreffende kotters niet onder het<br />
herstelplan regiem vallen. Deze 10 vaartuigen werden wat betreft de toegestane inspanning<br />
gereguleerd door het nationale zeedagen regiem waarbij de MOP-reductie inbegrepen was.<br />
2. Inspanningsregiem kabeljauw herstelplan / Impact Fishing Effort Reduction<br />
Schemes<br />
Tijdens de Visserijraad van december 2002 is in een bijlage bij de TAC-Verordening (Annex<br />
XVII van Vo 2341/2002) een inspanningsregime geïntroduceerd in relatie met het herstel van<br />
kabeljauwbestanden op en rond de Noordzee. Deze Annex is in april 2003 en laatstelijk in<br />
december 2003 gewijzigd bij Vo 671/2003.<br />
De Nederlandse vloot heeft onder dit regime een communautaire zeedagenbeperking<br />
opgelegd gekregen. Hoewel in Nederland onder het MOP al eerder een inspanningsregime<br />
gold, heeft de introductie van de zeedagenbeperking een wijziging van beleid betekend,<br />
bijvoorbeeld in termen van een wijziging van de definitie van een zeedag.<br />
De grote meerderheid van de vaartuigen (die vissen met boomkorren met mazen van<br />
tenminste 80 mm) uit de Noordzeevloot werd hierdoor beperkt tot een maximuminzet van 165<br />
zeedagen voor de periode 1 februari – 31 december 2003. Op basis van de bepaling dat extra<br />
dagen konden worden toegekend vanwege eerdere saneringsprogramma’s, is de Nederlandse<br />
boomkorvloot in juli 2003 door de Europese Commissie 2 extra zeedagen toegekend.<br />
Een beperkt deel van de vloot heeft een zeedagenbeperking opgelegd gekregen in<br />
overeenstemming met het gebruik van andere vistuigen.<br />
79
Bij de implementatie heeft Nederland ervoor gekozen binnen de grenzen van de regelgeving<br />
zoveel mogelijk flexibiliteit toe te passen: zowel de onderlinge overheveling van dagen<br />
tussen vaartuigen als de overheveling tussen beheersperiodes is toegestaan.<br />
3. Vlootregulerend stelsel, Entry/Exit-regiem / Compliance with Entry/Exit Scheme<br />
De Basis-Verordening voor het GVB dat met ingang van 1 januari 2003 van kracht is<br />
geworden schrijft voor dat voorafgaand aan het toelaten van een nieuw vaartuig in de vloot er<br />
eerst minimaal evenveel capaciteit aan de vloot dient te zijn onttrokken.<br />
Om aan deze verplichting volledig uitvoering te kunnen geven heeft de Nederlandse overheid<br />
een drastische ingreep in het nationale vlootregulerend systeem doorgevoerd. Dit heeft om<br />
anticipatie te voorkomen zonder voorafgaand overleg met de sector op 28 februari 2003<br />
plaatsgevonden.<br />
De basis van het vlootregulerend systeem werd tot 28 februari in Nederland gevormd door het<br />
'Licentiestelsel'. De eigenaar van een vaartuig diende over een licentie te beschikken om de<br />
visserij te mogen uitoefenen. Licenties waren niet onlosmakelijk aan één vaartuig verbonden<br />
maar waren eigendom van de ondernemer. De licentie was een ‘individueel toegekend,<br />
splitsbaar en overdraagbaar’ eigendomsrecht. De licentie gold voor een specifieke<br />
hoeveelheid capaciteit (tonnage en motorvermogen).<br />
Hiernaast bestond in Nederland het communautair voorgeschreven register van<br />
'visvergunningen'. Deze zijn wel gekoppeld aan het vaartuig, en geen overdraagbaar<br />
eigendom van de ondernemer, maar worden gereguleerd door de overheid.<br />
De wijziging die is doorgevoerd is dat de 'licentie' als vlootregulerend systeem is losgelaten<br />
en volledig vervangen door het systeem van de 'visvergunningen' zoals hierboven<br />
gekarakteriseerd.<br />
Deze wijziging impliceerde naast de ingrijpende structuurwijziging, tevens dat de op dat<br />
moment bestaande omvang aan 'gereserveerde licenties' die eigendom waren van<br />
ondernemers, niet meer geldig waren. Derhalve kon de omvang van de vloot per definitie niet<br />
verder toenemen dan de omvang die op 1 januari 2003 actief was (“foto vloot 1/1/2003”).<br />
Bij deze ‘foto van de vloot’ op datum 1 januari 2003 (i.c. de toegestane basisomvang) moet<br />
wel de kanttekening geplaatst worden dat in de Commissie-Verordening van 12 augustus<br />
2003 de bepaling opgenomen is dat capaciteit volgend uit 'administratieve beslissingen tot 2<br />
jaar terug' nog kan worden toegevoegd aan de toegestane omvang. (Deze additionele omvang<br />
bedraagt 2.944 kW en 1.151 GT; deze informatie is in detail aan de Commissie doorgegeven<br />
in het kader van de “Implementing Rules for the Fleet Policy”, juni 2003).<br />
Aquacultuur-vloot<br />
In Nederland is het entry/exit-regiem op 28 februari 2003 ingevoerd door middel van een<br />
wijziging van de Regeling Visserijlicentie.<br />
In Nederland is de vloot ingedeeld in de segmenten 4J1 t/m 4J7 (de segmenten die onder het<br />
MOP gereguleerd werden) en het restsegment 4Jz. Dat laatste segment betreft vaartuigen die<br />
actief zijn in de schelpdier-aquacultuur, en de IJsselmeer-visserij.<br />
Op 12 augustus 2003 heeft de Europese Commissie de uitvoeringsbepalingen voor het<br />
vlootbeleid vastgesteld en daarbij uitdrukkelijk bepaald dat wat betreft de schelpdieraquacultuur<br />
visserij ook al deze vaartuigen onder het entry/exit-regiem vallen. Slechts voor de<br />
strikte aquacultuur, en de vaartuigen die gedurende een beperkte periode onder specifieke<br />
80
epalingen en vergunningen op mosselzaad vissen mogen worden uitgezonderd van het<br />
entry/exit-regiem.<br />
Aangezien de praktische en juridische uitsplitsing van de betreffende vaartuigen niet voor<br />
eind 2003 kon worden afgerond, heeft de Commissie op verzoek van Nederland voorlopig de<br />
gehele nationale schelpdierenvloot inbegrepen in het referentieniveau en reguleren de<br />
Nederlandse autoriteiten deze vloot vooralsnog volgens het entry/exit-regiem. In 2004 zal<br />
Nederland een definitieve opgave aan de Commissie doen welke van de betreffende<br />
vaartuigen aangemerkt kunnen worden als aquacultuur, en welke van deze vaartuigen<br />
definitief onder het entry/exit-regiem zullen worden gebracht. Op grond van deze lijst zal de<br />
corresponderende capaciteit in mindering worden gebracht op het thans voor Nederland<br />
geldende referentieniveau.<br />
Steun voor nieuwbouw, modernisering<br />
De Nederlandse autoriteiten verlenen geen steun voor nieuwbouw en/of modernisering.<br />
Veiligheidstonnage<br />
In het jaar 2003 heeft in Nederland geen toekenning van veiligheidstonnage plaatsgevonden.<br />
De Nederlandse autoriteiten voeren hierin en restrictief beleid, in strikte overeenstemming<br />
met de communautaire uitvoeringsbepalingen.<br />
Overigens rest enige onduidelijkheid inzake communautaire regels voor de aan een vaartuig<br />
toegekende additionele tonnage en het entry/exit-regiem wanneer dat vaartuig de vloot weer<br />
verlaat.<br />
Pelagisch segment<br />
In het referentieniveau voor de Nederlandse vloot is tevens opgenomen de capaciteit van de<br />
Nederlandse pelagische vloot. Hierover werden reeds sinds 1999 gesprekken met de<br />
Commissie gevoerd. Het betrof de pelagische vloot die voor de West-Afrikaanse kust actief<br />
is. Wat betreft het uitgangspunt dat deze uitbreiding niet mag en kan leiden tot een<br />
oneigenlijke toename van de visserij-druk in de Noord-Atlantische en Europese wateren, zijn<br />
bepalingen opgenomen in een aanpassing van de MOP IV-Beschikking die in 2004 is<br />
gepubliceerd.<br />
De inspanning voor het pelagisch segment wat betreft de EU- en Noord-Atlantische wateren<br />
is vanwege de aanzienlijke toename van de pelagische quota van 13,8 mln kWdagen (2002)<br />
licht verruimd naar 14,6 mln kWdagen (2003). De MOP IV-einddoelstelling bedroeg 17,1<br />
mln kWdagen. De inspanning in de West-Afrikaanse wateren is stabiel gebleven (2001: 11,2;<br />
2002: 12,5; 2003: 12,1 mln kWdagen).<br />
4. Compliance with Fleet Policy Instruments<br />
Zie hoofdstuk 3. Daaraan kan het volgende toegevoegd worden.<br />
Handhaven segmentsgrenzen<br />
Zoals voorzien in de 'basisVerordening van december 2002' is met de publicatie van het<br />
referentieniveau in de Commissieverordening van 12 augustus 2003, de voorheen<br />
voorgeschreven communautaire indeling van de vloot in 'segmenten' losgelaten.<br />
81
Analoog aan de afwegingen inzake de MOP-inspanningsreductie is in het jaar 2003 een<br />
zekere 'overgangssituatie' van kracht geweest. Dit hield in dat in 2003 de segmentsindelingen<br />
zoals die golden gedurende de MOP IV-periode nationaal nog van kracht waren.<br />
Deze specifieke nationale handhaving heeft een voorlopig karakter aangezien de juridische<br />
basis strikt genomen is weggevallen. De nationale beleidslijn inzake het handhaven van<br />
segmentsgrenzen is dat segmenten nog slechts dan worden toegepast als hier daadwerkelijke<br />
duurzaamheids-overwegingen aangetoond kunnen worden. Van groot belang is dat het<br />
loslaten van de segmentsgrenzen betekent dat capaciteitstransfers kunnen plaatsvinden van<br />
onrendabele vlootonderdelen (herstelplannen) naar rendabele vlootonderdelen. Deze<br />
mogelijkheid neemt de druk op de schaarse publieke middelen voor sanering weg. Dit beleid<br />
zal in 2004 verder uitgewerkt worden.<br />
5. Information on changes of the administrative procedures<br />
Zie hoofdstuk 3.<br />
82
PORTUGAL<br />
RELATORIO ANUAL FROTA DE PESCA PORTUGUESA 2003<br />
Como é do conhecimento desses serviços, a Direcção Geral das Pescas e<br />
Aquicultura (<strong>DG</strong>PA), nos finais de 2002 e durante o ano de 2003 teve grandes<br />
dificuldades no registo e gestão dos dados do ‘Ficheiro Frota‘ já que esteve<br />
envolvida na substituição do antigo sistema informático para um Sistema<br />
Integrado de Informação das Pescas.<br />
Dadas as dificuldades que surgiram durante aquele processo, verificaram-se<br />
atrasos no envio da informação, relativamente aos quais se agradece a<br />
compreensão e a colaboração desses serviços.<br />
Presentemente Portugal já enviou, via FRONT, a totalidade dos dados<br />
referentes ao ano de 2003, bem como procedeu ao envio das correcções que nos<br />
foram solicitadas.<br />
No cumprimento dos artigos 12 e 13 do regulamento (CE) 1438/2003 Portugal<br />
apresenta o Relatório Anual da Frota - 2003<br />
1. Descrição geral da frota por pescaria<br />
Os quadros I e II, em anexo, fazem o ponto de situação da frota Portuguesa<br />
ao início e fim do ano de 2003, contabilizando as entradas e saídas relativas<br />
a cada segmento. Identificam, igualmente, as variações e a situação face aos<br />
níveis de referência para a frota do continente e a situação relativa aos níveis<br />
dos objectivos do POP para as regiões ultraperiféricas dos Açores e Madeira.<br />
Como se pode constatar pelos referidos quadros Portugal respeitou os níveis<br />
de referência e o regime de entradas/saídas no que respeita à frota do<br />
Continente, bem como cumpriu os níveis dos objectivos do POP para as ilhas<br />
dos Açores e da Madeira.<br />
Verifica-se um decréscimo de 181 embarcações na totalidade da frota<br />
portuguesa, e, em termos da arqueação total (GT) e da potência total<br />
instalada (Kw), verifica-se igualmente um decréscimo na ordem dos 2,1% e<br />
2,9%, respectivamente.<br />
Constatam-se, ainda, decréscimos na maioria dos antigos segmentos com<br />
excepção da pequena pesca (embarcações < 12m de cff ) onde, muito embora<br />
83
tenha havido uma redução de 120 embarcações, aumentou ligeiramente a<br />
arqueação (0,7%) e a potência instalada (2,5%).<br />
Tal facto resulta da necessidade de dotar as novas embarcações,<br />
principalmente de condições de segurança, mas também das condições de<br />
trabalho e de conservação a bordo (questão várias vezes transmitida à<br />
Comissão).<br />
2. Regimes de redução da frota<br />
No ano de 2003 Portugal não teve de implementar nenhum plano de<br />
recuperação, pelo que não esteve sujeito a nenhuma redução suplementar da<br />
sua frota.<br />
Todavia, manteve as restrições à pescaria da sardinha, que tinham sido<br />
implementadas em 1998 (Plano Nacional de Recuperação da Sardinha) face<br />
ao estado preocupante do recurso. Tais medidas parecem ter sido adequadas,<br />
já que, actualmente, o estado do recurso sardinha parece encontrar-se mais<br />
estável.<br />
3. Informações complementares sobre o cumprimento do regime de<br />
entradas e saídas e dos níveis de referência<br />
Como referido no ponto 1 Portugal reduziu a sua frota quer em número de<br />
unidades, quer em termos de arqueação e de potência instalada, verificandose<br />
assim que cumpriu o regime de entradas e saídas e respeitou os níveis de<br />
referência.<br />
Para complementar os dados que permitem avaliar, em detalhe, o<br />
cumprimento do referido regime refere-se o seguinte:<br />
Aumento de arqueação bruta por motivos de segurança (artigo 11,<br />
paragrafo 5 do R (CE) 2371/2002, GTS .<br />
Portugal, praticamente, não aumentou a arqueação da frota existente de<br />
acordo com estas disposições, já que, sendo a frota, na sua maioria<br />
demasiadamente envelhecida e obsoleta, não se torna economicamente<br />
rentável investir na modificação dessas embarcações, justificando-se,<br />
apenas, a sua substituição.<br />
Todavia verificaram-se pequenos aumentos de arqueação e de potência,<br />
por motivos de segurança, principalmente na pequena pesca cuja relação<br />
GT/KW se encontra, ainda, abaixo do tecnicamente aconselhável.<br />
• Entradas com ajudas públicas de embarcações entre 100 e 400 GT se<br />
as decisões relativas tiverem sido tomadas após 01.01.2003<br />
84
Durante o ano de 2003, apenas entraram na frota 4 embarcações com<br />
arqueação entre 100 e 400 GT cujas decisões sobre a sua construção e<br />
respectivo apoio foram tomadas até 31.12.2002.<br />
Assim, e dado não ter havido entradas de novas embarcações cujas<br />
decisões tivessem ocorrido posteriormente àquela data, não se procedeu a<br />
deduções dos níveis de referência.<br />
• Capacidades entradas na frota no ano de 2003 cujas decisões<br />
administrativas foram tomadas até 13.12.2002<br />
Junta-se quadro <strong>III</strong> relacionando as entradas que ocorreram durante o ano<br />
de 2003 e as embarcações substituídas indicando a data da decisão<br />
administrativa.<br />
De referir, que as saídas das embarcações a substituir pelas novas<br />
entradas, ocorreram, algumas durante o ano de 2003 e outras tinham sido<br />
já abatidas (sem apoios) em anos anteriores ( 2000- 2002),<br />
principalmente as embarcações adicionais utilizadas para compensar os<br />
aumentos das novas unidades face às substituídas.<br />
4. Síntese sobre os pontes fortes e fracos do sistema de gestão da frota<br />
Como foi referido, repetidamente, durante as discussões sobre as alterações à<br />
política estrutural, o novo regime de gestão da frota acarreta para Portugal<br />
graves estrangulamentos e dificuldades.<br />
Sendo a frota portuguesa muito envelhecida, não se justifica economicamente<br />
a modernização e a criação de condições de segurança de uma boa parte das<br />
embarcações, já que o investimento necessário ultrapassaria largamente os<br />
50% do custo da construção.<br />
Assim, Portugal, acaba por não poder beneficiar da possibilidade de<br />
aumentos de GT por motivos de segurança.<br />
Por outro lado, quando se pretende construir novas embarcações com as<br />
devidas condições de segurança, de trabalho e habitabilidade e de<br />
conservação do pescado a bordo, torna-se necessário aumentar a arqueação e<br />
correspondentemente a potência instalada relativamente à embarcação a<br />
substituir – que não reúne essas condições mínimas: é de convés aberto, tem<br />
baixo pontal, não tem acomodações para a tripulação, não tem espaço para<br />
trabalhar, tem más condições para acondicionamento do pescado, etc., etc.<br />
Para cumprir o regime de entradas e saídas torna-se necessária a saída de<br />
outras embarcações além da que é substituída para compensar os aumentos<br />
de GT e KW . Tal exigência obriga a um investimento adicional por parte do<br />
armador na compra de outras embarcações, tornando muito difícil substituir<br />
as embarcações optando, os armadores, algumas vezes, por continuar a<br />
actividade com a embarcação envelhecida, cada vez com maiores riscos de<br />
segurança.<br />
85
A <strong>DG</strong>PA, a fim de apoiar o armamento na renovação da frota, contabiliza o<br />
conjunto das embarcações que são abatidas ao ficheiro frota sem apoios<br />
(embarcações cujos proprietários pretendem abandonar a pesca mas cujas<br />
embarcações não reúnem as condições para ser abatidas com ajudas públicas)<br />
para compensar uma parte dos aumentos de arqueação e potência das novas<br />
embarcações além das compensações apresentadas pelo armador.<br />
Neste sentido, Portugal ao longo dos últimos anos, de forma a poder construir as<br />
novas embarcações com as devidas condições, cumprindo os objectivos,<br />
contabilizou o abate de embarcações sem apoios para gerar saldos que<br />
compensassem os aumentos de arqueação e potência.<br />
Infelizmente, e embora tivesse sido um dos poucos Estados Membros que<br />
sempre cumpriu, integralmente, os objectivos do POP, o novo regime de<br />
entradas/saídas apenas considera a hipótese de utilização dos saldos obtidos<br />
durante os anos de 2000-2002 (uma pequena parcela da totalidade dos saldos<br />
existentes) o que dificulta a gestão da frota portuguesa.<br />
Assim, o sistema de entradas e saídas revela-se iníquo, penalizando os<br />
Estados Membros cujas frotas sejam mais envelhecidas, obrigando a<br />
investimentos adicionais por parte dos armadores, gerando desvantagens<br />
relativamente a armadores de outros Estados Membros.<br />
5. Alterações dos procedimentos administrativos relativos à gestão da frota<br />
Actualmente os procedimentos para os registos da frota no ficheiro<br />
comunitário e a actual estrutura do FRONT tornam complicada a gestão da<br />
frota no respeito das regras definidas.<br />
As alterações desses procedimentos e da nova estrutura do ficheiro, já<br />
aprovados, parecem vir melhorar a situação, facilitando as tarefas de execução e<br />
controlo do regime de gestão da frota.<br />
86
SWEDEN<br />
Annual report of the Swedish fishing fleet 2003<br />
(according to Articles 12 and 13 of Regulation (EC) 1438/2003)<br />
1. General development of the fisheries<br />
During 2003, there has been a decline in both the landed quantity and the landed value for the<br />
Swedish fishery. The only increase occurred in the industrial fishery, due to the expansion of<br />
the fishing for blue whiting. The decrease in landed value was 19% in total and was<br />
reinforced by the fact that the price per kg for almost all species was lower compared to the<br />
previous year. The total landed value and quantity for 2003 in comparison with the previous<br />
year is shown in the table below.<br />
Swedish fishing<br />
2003<br />
Ton<br />
Landings Landed value Share of total<br />
Compr<br />
prev.<br />
year<br />
KSEK<br />
87<br />
Compr<br />
prev.<br />
year SEK/Kg<br />
Compr<br />
prev.<br />
year Quantity Value<br />
Cod 14 181 -6% 207 778 -19% 14,65 -13% 5,1% 23,9%<br />
Herring 53 458 -15% 134 392 -32% 2,51 -21% 19,0% 15,5%<br />
Sprat 17 226 -28% 26 189 -38% 1,52 -14% 6,1% 3,0%<br />
Mackerel 4 235 -17% 27 103 -39% 6,40 -26% 1,5% 3,1%<br />
Salmon 195 -26% 5 806 -26% 29,77 0% 0,1% 0,7%<br />
Norway lobster 866 -14% 64 904 -32% 74,95 -21% 0,3% 7,5%<br />
Shrimp 2 216 3% 87 832 -5% 39,64 -8% 0,8% 10,1%<br />
Fodder 181 612 8% 2<strong>05</strong> 351 -3% 1,13 -10% 64,7% 23,6%<br />
Misc. 6 660 -6% 110 224 -13% 16,55 -8% 2,4% 12,7%<br />
TOTAL 280 649 -1% 869 579 -19% 3,10 -18%<br />
Landings in Sweden 106 011 -16% 589 655 -19% 5,56 -4% 37,8% 67,8%<br />
Landings abroad 174 638 10% 279 925 -19% 1,60 -26% 62,2% 32,2%<br />
Quotas in the Skagerrak, Kattegat and the North Sea, apart from the Norwegian Zone, for<br />
most species, such as cod, saithe, haddock, and sole were exhausted during the autumn which<br />
led to severe constraints for parts of the fleet. The cod fishery in the Baltic was closed by the<br />
Commission during the spring, due to high proportion juvenile cod. Through a reduction of<br />
the weekly quotas for each vessel, it was possible to continue this fishery to the end of the<br />
year. Long-term management plans have been established for most of the important species.<br />
Cod in the Skagerrak and the North Sea is managed by a recovery plan. For the cod in the<br />
Baltic a new management plan during 2003 has replaced the previous recovery plan from<br />
2001, which reflects a certain improvement.<br />
The capacity in relation to available resources is to some extent balanced within the Swedish<br />
fishing fleet. This is due to the possibility, in most cases, of moving from one type of fishery<br />
to another. In general, however, there is an overcapacity in most of the segments.<br />
With Council Regulation 2371/2002 the previous segments were abolished. In the Swedish<br />
fishing fleet a vessel was allocated to a segment based on records of previous fishing.<br />
Subsequently, during 2003 the fleet remained within the same segments as according to EU<br />
regulation 2091/98.
During 2003, there has been a discussion within the fishing administration and the fishing<br />
industry on how to formulate a new appropriate policy for the management of the fishing<br />
fleet. The fleet has been divided into five segments which are based on the previous ones, but<br />
adjusted to be better in line with the actual fishing patterns.<br />
Based on a national perspective and the general objectives and priorities for the fishery, a<br />
number of objectives for the national fishing fleet have been formulated. These will form the<br />
basis of and guidance for national policy for the development of the fishing fleet. The<br />
objectives are, in brief:<br />
o The size and capacity of the fleet shall be adjusted to available resources in order to create<br />
a sound and sustainable fishing.<br />
o A regionally based fishery should be prioritized in order to safeguard the presence of<br />
professional fishing along the Swedish coast. This will contribute to and enable a living<br />
coast and archipelagos as well as the general objective of creating local labour markets<br />
with basic services in all parts of the country.<br />
o When designing policy and priorities for the fishing fleet,consideration should be given to<br />
operating an environmentally appropriate fishery.<br />
o Fishing is primarily aimed at human consumption and the fishing fleet shall be designed<br />
to provide the processing industry and the market with fish of the best quality at the right<br />
time.<br />
o The Swedish fishing fleet shall be effective, economically viable, competitive and capable<br />
of providing for a selfgenerated renewal.<br />
2. Impact of fishing effort reduction schemes<br />
During 2003, there has been a programme for decommissioning vessels which resulted in the<br />
decommissioning of five vessels, four of them from the west coast. In total, the fleet was<br />
reduced by 792 GT and 2,576 kW.<br />
3. Compliance with entry/exit scheme<br />
Since joining the EU, Sweden has applied a strict entry/exit regime with a ratio of at least 1:1<br />
for all segments with the exception of segment 1 (passive fishing boats less than 12 m).<br />
Despite that, segment 1 has gradually decreased. Since 2003, the ratio of 1:1 has been<br />
applicable also for segment 1. For segment 3 (pelagic fishing vessels) an entry/exit ratio of<br />
1:1.3 had been in place since September 2001. At the end of 2003, a decision was taken,<br />
together with the establishment of five new national segments, to apply an entry/exit ratio of<br />
1:1.1 for all segments, except for segment 1 and for the entry of fishing vessels from other<br />
segments on the east coast where the ratio of 1:1 will be applied.<br />
During 2003 within the framework of the Management Committee’s task of forming<br />
implementing rules for the fleet, a list of vessels pending entry based on administrative<br />
decisions prior to 1 st of January was presented to the Commission. The list was presented in<br />
88
July 2003 and did not include vessels that had already entered the fleet during the period 1 st of<br />
January to the 30 th of June 2003, and was based on a previous exit and granted entry prior to<br />
1 st of January 2003. A list of these vessels is submitted with this report.<br />
Two fishing vessels have left the Swedish fishing fleet and joined the German fleet. They<br />
have for a period remained in the Swedish fleet but were, based on a request from the<br />
Commission, by a decision 18 of November 2003 withdrawn from the Swedish fleet. The date<br />
of exit in the fleet register was set to 25th of August 2002, the same date as they joined the<br />
German fleet. The companies have entitlements of entering capacity equivalent to the<br />
withdrawn capacity.<br />
Entry/Exit regime<br />
skrotning<br />
2003<br />
Country Months GT 1/1/2003 coups partis GT 03 GT a ∑GT a GT 100 0,35GT 100 ∑0,35GT 100 GT s ∆(GT-GRT) GT03 - GTa - 0,35GT100 + GTs + ∆(GT-GRT) GT t<br />
SWE 1/01/2003 44.847 0 44.875 0 0 0 0 0 0 0 44.875 44.847<br />
SWE 1/02/2003 0 0 44.917 0 0 0 0 0 0 13 44.930 44.801<br />
SWE 1/03/2003 0 0 45.230 0 0 0 0 0 0 0 45.243 44.956<br />
SWE 1/04/2003 0 0 45.274 0 0 0 0 0 0 0 45.287 44.789<br />
SWE 1/<strong>05</strong>/2003 0 0 45.294 0 0 0 0 0 0 0 45.307 44.749<br />
SWE 1/06/2003 0 0 45.318 0 0 0 0 0 0 42 45.373 44.816<br />
SWE 1/07/2003 0 0 45.397 0 0 0 0 0 0 7 45.459 44.887<br />
SWE 1/08/2003 0 0 45.418 271 271 0 0 0 0 0 45.209 44.616<br />
SWE 1/09/2003 0 0 45.434 0 0 0 0 0 0 2 45.227 44.615<br />
SWE 1/10/2003 0 0 45.443 0 0 0 0 0 0 0 45.236 44.392<br />
SWE 1/11/2003 0 0 45.482 0 0 0 0 0 0 0 45.275 44.049<br />
SWE 1/12/2003 0 0 45.514 119 119 0 0 0 0 0 45.188 43.933<br />
GT 03 : fishing capacity in terms of tonnage at 1st January 2003<br />
Gta: total tonnage of vessels leaving the fleet with public aid after 31 December 2002<br />
GT 100: 35% of the total tonnage of vessels of more than 100 GT entering the fleet with public aid granted after 31 December 2002<br />
Gts: total safety tonnage increase<br />
∆R(GT-GRT): adjustement in the final global objectives of MAGP as a result of the remeasurement of the fleet<br />
GTt = red: if GTt > GT03 - GTa - 0,35GT100 + GTs + ∆(GT-GRT)<br />
Months kW1/1/2003 coups partis kW03 kWa ∑kWa kW100 0,35kW100 ∑0,35kW100 kW03 - kWa - 0,35kW100 kWt 1/01/03 224.646 0 227.428 0 0 0 0 0 227.428 224.646<br />
1/02/03 0 0 228.279 0 0 0 0 0 228.279 224.464<br />
1/03/03 0 0 229.689 0 0 0 0 0 229.689 224.423<br />
1/04/03 0 0 230.353 0 0 0 0 0 230.353 223.161<br />
1/<strong>05</strong>/03 0 0 230.656 0 0 0 0 0 230.656 222.866<br />
1/06/03 0 0 231.182 0 0 0 0 0 231.182 223.207<br />
1/07/03 0 0 232.482 0 0 0 0 0 232.482 223.833<br />
1/08/03 0 0 232.701 632 632 0 0 0 232.069 223.409<br />
1/09/03 0 0 232.968 0 0 0 0 0 232.968 223.252<br />
1/10/03 0 0 233.753 0 0 0 0 0 233.753 222.499<br />
1/11/03 0 0 234.288 0 0 0 0 0 234.288 221.412<br />
1/12/03 0 0 234.746 410 410 0 0 0 234.336 221.262<br />
kW03 : fishing capacity in terms of engine power at 1st January 2003<br />
kWa: total power of vessels leaving the fleet with public aid after 31 December 2002<br />
kW100: 35% of the total power of vessels of more than 100 GT entering the fleet with public aid granted after 31 December 2002<br />
kWt = red: if kWt > kW03 - kWa - 0,35kW100<br />
89<br />
kW t = red : if kW t > kW 03 - kW a - 0,35kW 100
Reference levels<br />
Country Months R(GT) 03 GT a ∑GTa GT 100 0,35GT 100 ∑0,35GT 100 GT s ∑GT s ∆R(GT-GRT) R(GT) t GT t<br />
SWE 1/01/2003 51.993 0 0 0 0 0 0 0 0 51.993 44.847<br />
SWE 1/02/2003 51.993 0 0 0 0 0 0 0 13 52.006 44.801<br />
SWE 1/03/2003 52.006 0 0 0 0 0 0 0 0 52.006 44.956<br />
SWE 1/04/2003 52.006 0 0 0 0 0 0 0 0 52.006 44.789<br />
SWE 1/<strong>05</strong>/2003 52.006 0 0 0 0 0 0 0 0 52.006 44.749<br />
SWE 1/06/2003 52.006 0 0 0 0 0 0 0 42 52.048 44.816<br />
SWE 1/07/2003 52.048 0 0 0 0 0 0 0 7 52.<strong>05</strong>5 44.887<br />
SWE 1/08/2003 52.<strong>05</strong>5 271 271 0 0 0 0 0 0 51.784 44.616<br />
SWE 1/09/2003 51.784 0 0 0 0 0 0 0 2 51.786 44.615<br />
SWE 1/10/2003 51.786 0 0 0 0 0 0 0 0 51.786 44.392<br />
SWE 1/11/2003 51.786 0 0 0 0 0 0 0 0 51.786 44.049<br />
SWE 1/12/2003 51.786 119 119 0 0 0 0 0 0 51.667 43.933<br />
GT 03 : fishing capacity in terms of tonnage at 1st January 2003<br />
Gta: total tonnage of vessels leaving the fleet with public aid after 31 December 2002<br />
GT100: 35% of the total tonnage of vessels of more than 100 GT entering the fleet with public aid granted after 31 December 2002<br />
Gts: total safety tonnage increase<br />
∆R(GT-GRT): adjustement in the final global objectives of MAGP as a result of the remeasurement of the fleet<br />
90<br />
GTt = red: if GTt > R(GTt)<br />
R(kW) 03 kW a ∑kWa kW 100 0,35kW 100 ∑0,35kW 100 R(kW) t kW t<br />
261.028 0 0 0 0 0 261.028 224.646<br />
261.028 0 0 0 0 0 261.028 224.464<br />
261.028 0 0 0 0 0 261.028 224.423<br />
261.028 0 0 0 0 0 261.028 223.161<br />
261.028 0 0 0 0 0 261.028 222.866<br />
261.028 0 0 0 0 0 261.028 223.207<br />
261.028 0 0 0 0 0 261.028 223.833<br />
261.028 632 632 0 0 0 260.396 223.409<br />
260.396 0 0 0 0 0 260.396 223.252<br />
260.396 0 0 0 0 0 260.396 222.499<br />
260.396 0 0 0 0 0 260.396 221.412<br />
260.396 410 410 0 0 0 259.986 221.262<br />
kW 03 : fishing capacity in terms of engine power at 1st January 2003<br />
kW a: total power of vessels leaving the fleet with public aid after 31 December 2002<br />
kW 100: 35% of the total power of vessels of more than 100 GT entering the fleet with public<br />
aid granted after 31 December 2002<br />
kWt = red: if kWt > R(kWt)
ENTRY <strong>OF</strong> CAPACITY FROM <strong>THE</strong> FLEET 1 JANUARY - 30 JUNE 2003 REPLACING EXIT BEFORE 1 JANUARY 2003<br />
Internal number Segment District number Name of vessel GT kW Date of entry<br />
SWE000008244 4 GG 398 WESTERÖ 272 735 200303<strong>05</strong><br />
GBR000010<strong>05</strong>1 4 GG 250 ROXY 41 176 20030414<br />
SWE000007019 5 KA 5 ZELENA 14 88 20030318<br />
SWE000008014 4 GG 71 KRISTINA 18 200303<strong>05</strong><br />
327 1.017<br />
RETROACTIVE EXIT FROM <strong>THE</strong> FLEET<br />
SWE 000008025 4 GG 36 Kristin af Donsö 306 735<br />
Date of exit<br />
20020825<br />
SWE 000008077 4 GG 578 Vicoria av Öckerö 308 736 20020825<br />
91
IIA. SUMMARY <strong>OF</strong> <strong>THE</strong> COMMITTEE FOR FISHERIES AND AQUACULTURE, BRUSSELS,<br />
9 SEPTEMBER 2004<br />
1. Agenda item “Commission Annual Report on the fleets of the Member States for<br />
2003” :<br />
EC According to article 14 of Council Regulation (EC) No 2371/2002 and article<br />
12 of Commission Regulation (EC) No 1438/2003, the EC has to present its annual<br />
report ‘on Member States’ efforts during 2003 to achieve a sustainable balance<br />
between fishing capacity and fishing opportunities’ to the Committee for Fisheries<br />
and Aquaculture for consultation. <strong>DG</strong> FISH has asked for legal advice regarding the<br />
procedure and the status of the opinion from the Committee for Fisheries and<br />
Aquaculture as described in the above mentioned legislations.<br />
DEU, FRA, PRT, ITA expected a presentation of the annual report instead of a<br />
consultation. Therefore they ask for the possibility to give their opinion in writing.<br />
FRA would like to know the outcome of the legal advice regarding the legacy of the<br />
Committee’s opinion on the EC’s annual report 2003.<br />
EC indicates that several Member States have sent additional information after the<br />
draft report had been sent to them on 27 August. The Commission has prepared a<br />
document with these changes, which mainly concern additional information on<br />
entries in 2003 that were based on decisions taken before (“coups partis”) and on the<br />
results of the remeasurement of the fleet. This document has been circulated at the<br />
beginning of the meeting. It was very difficult to obtain all the information regarding<br />
“coups partis” and safety tonnage from the Member States. Even on the eve of the<br />
Committee a Member State sent revised figures regarding their “coups partis”.<br />
Regarding the remeasurement, it is difficult to find out if a “MOD”-declaration to the<br />
Fleet Register refers to the remeasurement of a vessel, to an increase in the tonnage<br />
value, or to a simple correction.<br />
ITA will send further documentation regarding the entry/exit regime and the “coups<br />
partis”. However Italy also reports organisational problems with management of such<br />
a big fleet. Therefore they find the EC’s conclusion ‘ITA does not comply’ too<br />
tough.<br />
GBR shows understanding for the frustration of the EC and also reports problems in<br />
matching the Community Fleet Register (CFR) with their own one. They will revise<br />
their figures again and announce some new information for the following week,<br />
namely on the licence entitlements (coups partis).<br />
FRA would like to know the impact of remeasurement, especially the parameters<br />
used for the calculation of it. Concerning exits with public aid, the relevant<br />
information is transmitted to the CFR only once the aid for the decommissioning has<br />
been granted, which can take up to one year from the date of exit of the vessel.<br />
Therefore an exit is first registered as an exit without public aid. This is the main<br />
reason why there are differences between the national fleet registers and the CFR.<br />
92
DNK thanks the Commission for the work on the annual report. Furthermore they<br />
declare that 9 vessels still have to be remeasured.<br />
DEU also expressed their thanks. The annual report will improve the transparency<br />
between the Member States.<br />
NLD mentions that this is the first report of the new Community Fleet Management<br />
System. Furthermore they would like to get some clarification from the EC<br />
concerning the date of the exit supported by public aid of a vessel from the CFR: is it<br />
the day when the application is made, the date when the vessel commercially leaves<br />
the active fleet, or the date when the last payment of the aid has been paid?<br />
On this EC replies that at the moment when an exit is declared to the Fishing fleet<br />
register, the exit must be labelled an exit with public aid according to the date of the<br />
administrative decision granting aid for this exit, even if the payments have not yet<br />
been made.<br />
EC announces that in the next Committee meeting the remeasurement issue will be<br />
discussed. Once more the Commission inform the MS that it was really very difficult<br />
to collect all information regarding the entitlements (coups partis) and the<br />
administrative data. The EC asks the MS how much extra time they would require in<br />
order to finalise this.<br />
SWE says that their fleet register department is preparing the transition towards the<br />
new FRONT application. Therefore it is not possible to keep the old CFR up to date<br />
at the same time. Furthermore they hope that the new system will be more efficient<br />
and user-friendly.<br />
NLD asks if the information regarding the fleet of the outermost regions (RUP) will<br />
also be included in the annual report in the future.<br />
EC states that article 14 does not exclude the RUP from the annual report, but the<br />
reference levels for 2003 are not yet fixed. For FRA and PRT, there is no problem<br />
because they had segments for the fleets of their RUP. However for ESP the<br />
negotiations are ongoing regarding the fixing of the reference levels for the Canary<br />
Islands. For the outermost regions a joint report for the years 2003 and 2004 will be<br />
done next year.<br />
DNK wants to see more information in the annual report on the main underlying<br />
objective for fleet policy, which is to reach a balance between the resources and the<br />
fishing capacity. Something could be added in this respect to the last paragraph of<br />
p. 6, especially in the sense that it is not enough to keep the balance between entries<br />
and exits, since without any capacity reductions the real fishing capacity increases<br />
because of technological progress.<br />
EC acknowledges Denmark’s remark and indicates that certain national reports<br />
indeed contain such information. All the national reports will be added to the final<br />
annual report by the Commission, so the MS’ opinions regarding the effectiveness of<br />
the entry/exits will be available for the Council and the European Parliament.<br />
Subsequently the MS’ tables are discussed one by one. MS are offered to give their<br />
comments on the figures mentioned in these tables.<br />
93
BEL, DEU, FRA and FIN : no comments.<br />
DNK: there is an additional 3.000 GT of remeasurement to take into account for the<br />
GT situation on 1 January 2003.<br />
ESP: the differences are not known yet, but probably it will be about a difference of<br />
approximately 400 GT for GTfr on 01/01/2003 due to errors in registration of small<br />
vessels.<br />
GBR: they are verifying detailed information on a vessel by vessel basis regarding<br />
the entitlements. [i.e. coups partis]<br />
EC states that for GBR the exits with aid are not taken from the CFR but from<br />
GBR’s annual report. The GTa amounts to 13.981 GT.<br />
IRL: there are minor differences between the figures in the CFR and those handled<br />
by Ireland.<br />
EC states that the corrections, including the remeasurement, do not affect the<br />
compliance.<br />
ITA: is aware that they have to back up the arrears regarding the CFR, but according<br />
to them they are apparently not the only one.<br />
NLD: does not have any comments on the figures. The only remark is that the<br />
different reports, like this one and others like FIFG, do not have the same figures<br />
because the reference date is different for all of them. Therefore a comparison<br />
between these reports or even a cross-check is simply not possible. Furthermore, the<br />
reference level fixed last year also contained the aquaculture vessels and the<br />
crustacean fleet. They now have detailed figures regarding this sector of the fleet and<br />
the reference levels can be adjusted. How and when do the EC want to get this<br />
information?<br />
EC replies that the adjustment of the reference levels should be done as soon as<br />
possible. Other MS concerned should also forward this information to the EC as soon<br />
as possible.<br />
PRT: there are differences for the GTfr and kWfr and the entries. They would like to<br />
discuss them bilaterally with the EC.<br />
SWE: they want to verify the entries and exits as mentioned in the draft annual<br />
report once more.<br />
EC reminds MS once more that all adjustments should be done via the old CFR<br />
reporting system. Information on the coups partis and GTs should be sent to the EC<br />
by e-mail. The deadline for MS to clarify and adjust their figures is the end of next<br />
week (17 September 2004)<br />
94
IIB. SUMMARY <strong>OF</strong> <strong>THE</strong> COMMITTEE FOR FISHERIES AND AQUACULTURE, BRUSSELS,<br />
13 OCTOBER 2004<br />
1. Agenda Item – Opinion of the Committee on the Commission’s Annual Report on<br />
the entry/exit regime and reference levels for the fleet<br />
COM -According to article 14 of Council Regulation (EC) No 2371/2002 and article 12<br />
of Commission Regulation (EC) No 1438/2003, the COM has to present its annual report,<br />
“on Member States’ efforts during 2003 to achieve a sustainable balance between fishing<br />
capacity and fishing opportunities”, to the Committee for Fisheries and Aquaculture for<br />
consultation. <strong>DG</strong> FISH has asked for legal advice regarding the procedure and the status<br />
of the opinion from the Committee for Fisheries and Aquaculture as described in the<br />
above mentioned legislations and the Legal Service of the European Commission states<br />
that no vote on the annual report from the Committee is required. The opinion of the<br />
Committee will be expressed in the minutes of its meeting. These minutes will be added<br />
to the COM’s annual report and those of the MS when it is transmitted to the EP and the<br />
Council.<br />
An amendment in the conclusion concerning IT has been added. Once more it is stated<br />
that the differences between the MS annual reports and the data from the Community<br />
Fleet Register are minor differences and above all, they do not influence the outcome of<br />
the report, except for IT.<br />
IT thanks the COM for reviewing the additional information. The transition to GT and<br />
some legislative difficulties prevented ITA from handing over all necessary information<br />
on time. ITA hopes that this additional information will be added to the summary of this<br />
meeting.<br />
FR cannot give an opinion because the document is not in French. They also ask once<br />
more for some additional information on the validation processes.<br />
COM indicates that translation takes a lot of time and then there would be no time left for<br />
discussion. Therefore the COM opts for a presentation of a single language version as<br />
soon as the report is ready in order to give the Committee more time for discussion. With<br />
regard to the validation process, COM states that this item is not a subject of this<br />
meeting. The validation programme is working well. There are still some small<br />
adaptations needed. However, the philosophy of the legislation is not always easy to<br />
translate in IT language. On the 25 th November a FRONT meeting will be held in<br />
Brussels, where this will be discussed in detail.<br />
ES agrees with FRA but wants nevertheless to show some flexibility. Although they<br />
would like to mention that the language regime was already decided in 1958 and the<br />
COM should respect it. Furthermore, they would like to know if the opinions of the MS<br />
will be added to the COM annual report and if it is necessary that all MS agree upon the<br />
contents of it.<br />
COM confirms that the opinions of the MS expressed in the Management Committee<br />
will be added to the COM’s annual report 2003 in the form of the minutes of the meeting.<br />
Furthermore the written opinion of the STEFC will also be added. The COM states once<br />
more that the annual report 2003 could only be presented in September because some MS<br />
95
did not respect the deadline for sending their annual reports to the COM. The COM will<br />
investigate if a presentation in all languages will be possible next month.<br />
DK states that the figures on kW do not correspond. Also the exits with public aid do not<br />
match the figures of their annual report. Furthermore, they want to see more in the annual<br />
report on the main underlying objective for fleet policy, which is to reach a balance<br />
between the resources and the fishing capacity. Something could be added in the sense<br />
that it is not enough to keep the balance between entries and exits, since without any<br />
capacity reductions the real fishing capacity increases because of technological progress.<br />
They also express their reservation on the figures mentioned in the COM’s annual report.<br />
COM confirms that some additional information was received from DK. The way the<br />
remeasurement of the tonnage capacity has been declared into the Community Fleet<br />
Register has influenced the determination of the tonnage capacity at 01/01/2003. A<br />
change of tonnage due to remeasurement should not be declared as a modification. For<br />
DNK a lot of vessels were remeasured during 2003 and therefore the differences in<br />
figures for 01/01/2003 are largely due to wrong declarations to the CFR.<br />
The CFR was the reference point for each MS data in the annual report, except for the<br />
capacity withdrawn from the fleet with public aid, because these data were not always<br />
actualised in the CFR. During a bilateral meeting with DK the EC will also discuss the<br />
difference in opinion regarding the date relevant for an exit with public aid in order to be<br />
accounted for in a given year.<br />
UK announces that they have updated the CFR and therefore the footnote for the exits<br />
with public aid can now be changed.<br />
IE states that there are some small discrepancies but they accept the figures as they are.<br />
To a question from NL on the management of entry/exits from the fleet with public aid in<br />
relation to the date of the event, COM restates that it is the date of the administrative<br />
decision which counts in the case of a vessel entry in the form of “coups partis”, but in<br />
the case of an exit with public aid, it is the date of the vessel’s exit which is important for<br />
the management of entry/exit regime. In other words, a vessel which leaves the fleet<br />
register after 1 January 2003 does not figure in the snapshot of the fleet on 1 January<br />
2003 and has to be deducted from the snapshot capacity at this date if the exit is with<br />
public aid, even if the full payments have not been implemented at this date.<br />
PT: there are differences but hopefully with the new CFR this will be resolved next year.<br />
COM expresses its conviction that next year’s annual report discussions will be easier<br />
thanks to the new CFR reporting system.<br />
96
<strong>III</strong>. Opinion of the STECF on Annual Report from the Commission to the Council and<br />
the European Parliament on Member States’ efforts during 2003 to achieve a<br />
sustainable balance between fishing capacity and fishing opportunities<br />
General comments<br />
The Commission should be commended on the new annual report on the EU fishing fleet, as it<br />
provides a good overall reflection of the new Community Fleet Policy framework, following<br />
the suspension of the MAGP at the end of 2002. The STECF also acknowledges that the<br />
quality of the report hinges on the accurate reporting of Member States and initial teething<br />
problems are probable in this regard. STECF nevertheless recommends that the following<br />
issues and comments be specifically considered in future reporting on the EU fishing fleet.<br />
8.1 Reference levels<br />
STECF understands the reference levels, and the reported compliance levels herewith, to be a<br />
transitional measure following the discontinuation of the MAGP at the end of 2002. STECF<br />
notes from the annual report that some Member States fleets are sufficiently below their<br />
reference levels that their fleet size is, in effect, not restricted, beyond limitations imposed by<br />
the entry/exit regime, while Member States with fleet sizes close to their reference levels are<br />
restricted, to a greater extent. If the long-term goal of balancing fleets with resources is to be<br />
reached, these reference levels should be suitably adapted and form the foundation to linking<br />
fishing capacity and fishing opportunities, as discussed below.<br />
8.2 Link between fishing capacity and fishing opportunities<br />
STECF finds that the annual report fails to give adequate information to reflect the demands<br />
of Commission Regulation (EC) No 1438/2003 of 12 August 2003 laying down implementing<br />
rules on the Community Fleet Policy as defined in Chapter <strong>III</strong> of Council Regulation (EC) No<br />
2371/2002, paragraph 12 (L 204/22), stating:<br />
“The annual reports and the summary thereof made by the Commission in accordance with<br />
Article 14 of Council Regulation (EC) No 2371/2002 should give a clear picture of the<br />
equilibrium between fleet fishing capacity and fishing opportunities”.<br />
STECF argues that an explicit link between fishing capacity and fishing opportunities, as<br />
called for in Article 14 of Council Regulation (EC) No 2371/2002 must be given due attention<br />
in future annual reporting on the EU fishing fleet. This is especially relevant where stock<br />
recovery plans and days at sea limitations have been implemented. Information on feasible<br />
analytical approaches should thus be sought to allow the assessment of the real balance<br />
between fishing fleets and fishing opportunities. However, further discussion among Member<br />
States will be required in order to reach a common approach.<br />
8.3 Entry/exit regime<br />
STECF considers that the adopted entry/exit regime and reporting is a step in the right<br />
direction, and provides a framework for information on the overall fleet situation in relation to<br />
public aid. The adopted regime should help ensure that public money earmarked for fleet<br />
renewal and modernisation does not lead to an increase in nominal or effective fishing<br />
capacity. Further, it should help confirm that vessels removed by public aid are not replaced<br />
and reference levels are lowered accordingly.<br />
97
STECF suggests that some form of analysis is undertaken to examine how more specified<br />
entry/exit regimes can be deployed for individual fleets and fisheries, where there may be a<br />
desire to either neutralise or reduce fishing capacity. This may be especially important where<br />
stock recovery plans are in force. Such analyses should also help to account for dynamic<br />
changes in effective fishing capacity due to, for example, technological progress, changes in<br />
fish stocks, impacts of days at sea limitations, etc. Currently, the entry/exit regime is strictly<br />
based on funding criteria and/or vessel characteristics including GT’s and kWs, and no<br />
attempt is made to manage fishing capacity in specific fisheries or fleet segments so as to<br />
achieve a sustainable balance between fishing capacity and fishing opportunities.<br />
STECF considers that an analysis of the impact of the currently adopted entry/exit regime on<br />
fleet structure and balance with fishing opportunities should provide valuable preliminary<br />
information for establishing future, more targeted, entry/exit regimes.<br />
8.4 Consideration of new Member State fleets<br />
To secure a sustainable balance between fishing capacity and fishing opportunities in EU<br />
waters, STECF recommends that the Commission explicitly consider the steps to incorporate<br />
the fleets of the new fishing nations, following the accession of 10 new Member States in<br />
2004.<br />
98