VOLUME 1 - Coffs Harbour City Council - NSW Government
VOLUME 1 - Coffs Harbour City Council - NSW Government
VOLUME 1 - Coffs Harbour City Council - NSW Government
- No tags were found...

Create successful ePaper yourself
Turn your PDF publications into a flip-book with our unique Google optimized e-Paper software.
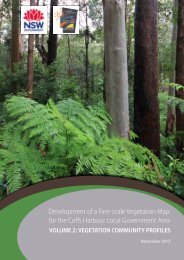
© Copyright State of <strong>NSW</strong> and the Office of Environment and Heritage, Department of Premier and Cabinetwith <strong>Coffs</strong> <strong>Harbour</strong> <strong>City</strong> <strong>Council</strong> and the Northern Rivers Catchment Management Authority.The authors are pleased to allow this material to be reproduced in whole or in part for educational and noncommercialuse, provided the meaning is unchanged and its source, publisher and authorship are acknowledged.The authors have compiled this report in good faith, exercising all due care and attention. No representation ismade about the accuracy, completeness or suitability of the information in this publication for any particularpurpose. The authors shall not be liable for any damage which may occur to any person or organisation takingaction or not on the basis of this publication. Readers should seek appropriate advice when applying theinformation to their specific needs.Requests for information regarding this document should be directed to one of the following:Head of Biodiversity Assessment UnitTeam Leader - BiodiversityRegional Operations - North East Region<strong>Coffs</strong> <strong>Harbour</strong> <strong>City</strong> <strong>Council</strong>Office of Environment and HeritageLocked Bag 155Locked Bag 914COFFS HARBOUR <strong>NSW</strong> 2450COFFS HARBOUR <strong>NSW</strong> 2450Email: coffs.council@chcc.nsw.gov.auPhone: (02) 6651 5946Phone: (02) 6648 4000Published by:Office of Environment and Heritage on behalf of <strong>Coffs</strong> <strong>Harbour</strong> <strong>City</strong> <strong>Council</strong> and the Northern Rivers CatchmentManagement Authority.Office of Environment and HeritageDepartment of Premier and Cabinet59–61 Goulburn StreetPO Box A290Sydney South 1232Phone: (02) 9995 5000 (switchboard)Fax: (02) 9995 5999TTY: (02) 9211 4723Email: info@environment.nsw.gov.auWebsite: www.environment.nsw.gov.auISBN 978 1 74293 941 4November 2012OEH 2012/0953Cover photograph: Shane Ruming
Development of a Fine-scale Vegetation Map for the<strong>Coffs</strong> <strong>Harbour</strong> Local <strong>Government</strong> Area<strong>VOLUME</strong> 1: PROJECT REPORTNovember 2012
Credits and AcknowledgementsThis project was funded by the <strong>Coffs</strong> <strong>Harbour</strong> <strong>City</strong> <strong>Council</strong>, with financial assistance from the Northern RiversCatchment Management Authority and the National Parks and Wildlife Service.The vegetation classification and mapping project involved many people with varied and specialised skills. TheOffice of Environment and Heritage (OEH) would like to acknowledge the main contributors to this project.OEH would like to acknowledge the contribution of Ernst Kemmerer (OEH) and Nigel Cotsell (<strong>Coffs</strong> <strong>Harbour</strong> <strong>City</strong><strong>Council</strong> [CHCC]) for co-ordinating the project.The main report was prepared by Ernst Kemmerer and Paul Sheringham, with assistance from Paul Houlder. OEHwould like to acknowledge the technical expertise of the Biodiversity Assessment Unit; Paul Sheringham, BrendanRennison, Karen Caves and Mark Cameron, and their contribution in compiling the Vegetation Community Profilesin Volume 2 of the report and providing the maps, figures and tables.Project specifications for the mapping and aerial photography interpretation work were completed by KarenCaves (OEH) and Brendan Rennison (OEH) with Mark Cameron (OEH) contributing to refinement of the vegetationboundaries, data processing and quality assurance. Paul Sheringham was principal botanist and patiently assistedthe team with vegetation classification questions, botanical identification and interpretation queries.Aerial photography interpretation (API) formed the backbone of this vegetation mapping project and the APIteam consisted of Karen Caves, Brendan Rennison, Mark Cameron, Paul Sheringham and contractors Mark Fisher,Rob Streeter, and Owen Maguire. Discussions and advice from Rob Streeter during the interpretation phase, andwith Adam Roff (OEH) on remote sensing techniques and species mapping, work were appreciated.Field verification is an essential component to API and the input of Damian Arnold (CHCC) is noted for hisextensive field survey efforts. OEH wishes to thank John Hunter and Stephanie Horton for providing advice on thedistribution of rainforest types in the Fridays Creek and Moleton mapsheets. OEH also appreciated the assistanceof Forests <strong>NSW</strong> for access to sites and information on road conditions.Flora surveys provide the evidence for vegetation community analysis and OEH would like to thank Phil Gilmour,Lachlan Copeland and Liz Brown (Eco Logical Australia) for their expertise in completing the majority of thesurveys, as well as the contributions of Peter Richards.OEH would also like to thank Jill Smith (OEH) for her assistance with the stratification and Doug Binns (Forests<strong>NSW</strong>) for his enthusiasm and assistance in completing the numerical vegetation classification analysis.This project would not have been possible without the vision of Ernst Kemmerer, Nigel Cotsell and Rachel Binskin(CHCC) to develop a product that could support a range of conservation initiatives for the local government area,and for the project support of Andrew McIntyre (OEH) and Gary Davey (Environment Protection Authority).
Table of ContentsSummaryi1. Introduction 11.1 Objectives of the study 21.2 Study area 21.3 Landforms 41.4 Geology and geomorphology 41.5 Soils and soil landscapes 71.6 Climate 71.7 Fire history 82. Methods 82.1 Trialling alternative mapping pathways 92.2 Land-cover mapping 92.3 Gap-filling flora surveys 112.4 Vegetation community classification 112.5 Vegetation mapping 122.6 Accuracy Assessment 153. Results 163.1 Selection of mapping pathways 163.2 Land-cover mapping 163.3 Gap-filling flora surveys 173.4 Vegetation classification 183.5 Vegetation mapping 183.6 Refinement of vegetation classification and map units 203.7 Accuracy Assessment 213.8 Native species and weeds recorded in surveys 213.9 Threatened species of the <strong>Coffs</strong> <strong>Harbour</strong> LGA 223.10 Endangered ecological communities of the <strong>Coffs</strong> <strong>Harbour</strong> LGA 233.11 Project management and costs 253.12 Research and development 253.13 Conclusion 264. References 27Appendix 1 <strong>Coffs</strong> <strong>Harbour</strong> Biodiversity Strategy 30Appendix 2 Previous vegetation mapping and flora surveys in the study area. 31Appendix 3 Mapping Specifications 33Appendix 4 Metadata Statement 35Appendix 5 Final vegetation community list for the <strong>Coffs</strong> <strong>Harbour</strong> LGA vegetation map. 38Appendix 6 EcoLogical: Map Accuracy Assessment 41
TablesTable 1 Landscapes of the <strong>Coffs</strong> <strong>Harbour</strong> LGA 2Table 2 Geological units of the <strong>Coffs</strong> <strong>Harbour</strong> LGA 5Table 3 Summary of land-cover classes used in the study 10Table 4 Summary of flora surveys supporting this study 11Table 5 API polygon attribution descriptions 13Table 6 Summary of land cover in the <strong>Coffs</strong> <strong>Harbour</strong> LGA 16Table 7 Summary of study area by tenure 17Table 8 Area of extant vegetation cover by polygon size classes (land-cover classification mapping) 17Table 9 Average site density and tenure sampling rates for sites used in the vegetation classification 17Table 10 Areas of formations and vegetation classes mapped across the <strong>Coffs</strong> <strong>Harbour</strong> LGA 20Table 11 Significant plants in the <strong>Coffs</strong> <strong>Harbour</strong> LGA 22Table 12 Vegetation communities likely to contain endangered ecological communities 24FiguresFigure 1 The study area and landscapes of <strong>Coffs</strong> <strong>Harbour</strong> LGA 3Figure 2 Major geological units of the <strong>Coffs</strong> <strong>Harbour</strong> LGA 6Figure 3 API map tiles used in the study 14Figure 4 Flora sites used in analysis and mapping 19List of abbreviations2D3DADS40APICMAEECLPMALGALiDARNPWS<strong>NSW</strong>OEHPATNROTAPSEPPUPGMAYETItwo-dimensionalthree-dimensionalairborne digital sensor (Leica Geosystems)aerial photograph interpretationCatchment Management Authorityendangered ecological communityLand and Property Management Authoritylocal government arealight detecting and ranging<strong>NSW</strong> National Parks and Wildlife Service (which now falls within Office of Environment andHeritage)New South WalesOffice of Environment and Heritagepattern analysis softwareRare or Threatened Australian PlantState Environmental Planning policyunweighted pair-group arithmetic averagingflora database held by OEH
SummaryA vegetation survey and mapping program was conducted for the <strong>Coffs</strong> <strong>Harbour</strong> <strong>City</strong> <strong>Council</strong> Local <strong>Government</strong>Area (<strong>Coffs</strong> <strong>Harbour</strong> LGA) using high resolution digital imagery. The main purposes of the program were toproduce a fine-scale ‘Class 5’ vegetation map suitable for <strong>Council</strong>’s planning and project requirements, and todevelop a survey and mapping methodology that could be more widely used by other local governments acrosscoastal New South Wales.The current native vegetation map used by <strong>Council</strong> is dated and requires upgrading to show current vegetationextant and landuses. This study sought to prepare a fine-scale vegetation map and provide up-to-date informationon the type and extent of vegetation in the <strong>Coffs</strong> <strong>Harbour</strong> LGA (the study area).The study was carried out in four main stages:• trial and select methods to map land cover and vegetation community boundaries• map broad land cover• develop a vegetation community classification for <strong>Coffs</strong> <strong>Harbour</strong> LGA• map vegetation communities.A number of techniques were trialled to determine the most efficient process for preparing the vegetation map.It was concluded that conventional aerial photography interpretation resulted in the most accurate linework andmethod for attributing vegetation communities. A total of 79 different vegetation communities were classifiedin the study area.Land cover was divided into 13 types, including the following cover classes and features: extant vegetationcover, cleared, horticulture/cropping, plantations, remnant trees, water bodies, estuaries and beaches. Over 88000 hectares of extant vegetation in the <strong>Coffs</strong> <strong>Harbour</strong> LGA were mapped at 1:5000 scale using API. During theAPI work the vegetation patterns were mapped and polygons attributed using the codes supplied for the 79vegetation communities.The classification and mapping program was supported by 3 754 survey sites. Data from 534 full floristic florasurvey sites were used for the vegetation community classification analysis. Information on dominant plantspecies only was gathered at 462 rapid data sites for interpolation and mapping purposes, 279 for accuracyassessment and 2 479 API survey sites were visited to ground truth the API work.To achieve an unbiased survey effort across all tenures, private landowners were invited to voluntarily have florasurveys conducted on their land. This resulted in a sampling rate of approximately one site per 60 hectares onCrown lands and one site per 76 hectares on freehold lands. Overall mapping accuracy was found to be 66% andwith subsequent revision giving an accuracy of 77% weighted by area of each vegetation class.Surveys conducted during this study, combined with previous work, have identified 53 significant plants and 10endangered ecological communities within the LGA. The endangered communities are likely to occur within 24different vegetation communities mapped in this study, and potentially cover up to 11 600 hectares in the LGA.The new <strong>Coffs</strong> <strong>Harbour</strong> Class 5 vegetation map will underpin a range of environmental planning and vegetationmanagement programs. The vegetation map is suitable for use at the 1:5000 scale and will support environmentalplanning at the whole-of-LGA level. The map may not be suitable for individual property or development planswhere further flora and fauna surveys may be required to meet the requirements of the Threatened SpeciesDevelopment of a Fine-scale Vegetation Map for the <strong>Coffs</strong> <strong>Harbour</strong> Local <strong>Government</strong> Areai
Conservation Act 1995. However, the mapping will have direct influence on the following <strong>Council</strong> strategies,planning instruments and guidelines:• <strong>Coffs</strong> <strong>Harbour</strong> Koala Plan of Management• Open Space Strategy• Biodiversity Information Sheets• <strong>Coffs</strong> <strong>Harbour</strong> Biodiversity Action Strategy 2012 - 2013• State of the Environment reporting• Draft <strong>Coffs</strong> <strong>Harbour</strong> Local Environmental Plan 2012• Draft Development Control Plan• Bushfire Mapping.The development of the Class 5 vegetation map has been a multi-agency initiative supported by <strong>Coffs</strong> <strong>Harbour</strong><strong>City</strong> <strong>Council</strong>, the Office of Environment Heritage and the Northern Rivers Catchment Management Authority. Itis anticipated that the fine-scale vegetation map will be adopted by a range of end-users and natural resourcemanagers.iiDevelopment of a Fine-scale Vegetation Map for the <strong>Coffs</strong> <strong>Harbour</strong> Local <strong>Government</strong> Area
1. IntroductionVegetation type and vegetation condition are widely used in combination as a surrogate for biodiversity. Assuch, maps of vegetation type and condition form the basis of most conservation management plans andenvironmental planning instruments. While vegetation mapping needs may vary between government agencies,a common theme is the need for complete and consistent maps of the area of interest.<strong>Coffs</strong> <strong>Harbour</strong> <strong>City</strong> <strong>Council</strong> (‘<strong>Council</strong>’) is currently using a composite vegetation map derived from a variety ofsources. The primary sources are Forest Type Mapping (Forestry Commission of <strong>NSW</strong> 1989), forest ecosystemmodels, vegetation type mapping by Fisher et al. (1996) — with supplementary aerial photograph interpretation(API) work by Kendall (2005) — and modelling interpretation work by Eco Logical Australia (2005).This composite vegetation map has limitations because the various map sections use different classificationssystems and map scales, resulting in edge mismatches between sections. A contiguous vegetation mapand classification is therefore required to overcome these issues and provide a common reference for futureenvironmental planning and management in the <strong>Coffs</strong> <strong>Harbour</strong> <strong>City</strong> <strong>Council</strong> Local <strong>Government</strong> Area (‘<strong>Coffs</strong><strong>Harbour</strong> LGA’). For example, <strong>Council</strong> recently released its ‘Biodiversity Action Strategy’ (CHCC 2012) which setsthe agenda and direction for biodiversity conservation planning and management throughout the <strong>Coffs</strong> <strong>Harbour</strong>LGA from 2012 to 2030 and beyond.The development of a contiguous, fine-scale vegetation map is fundamental to a number of major programswithin the Strategy, particularly for LGA-wide assessment programs such as:• mapping Koala habitat (to contribute to the development of <strong>Council</strong>’s Koala Plan of Management)• identifying and mapping high value habitats, including endangered ecological communities (includingSEPP26 areas), over-cleared vegetation communities, significant wetlands (including SEPP14), estuariesand riparian zones• identifying and mapping threatened and significant fauna habitat• identifying landscape connections.These programs will ultimately contribute to <strong>Council</strong>’s strategic and operational planning, including the LocalEnvironment Plan (2012) and associated Development Control Plan. Figure A5.1 (page 30) from the ‘BiodiversityAction Strategy’ (CHCC 2012) illustrates the role of the vegetation mapping in <strong>Council</strong>’s planning framework andhas been included here in Appendix 1.The National Parks and Wildlife Service (NPWS) also requires a consistent, up-to-date vegetation map of theentire <strong>Coffs</strong> Coast Regional Park, an area which is jointly managed by <strong>Council</strong> and NPWS. A contiguous, fine-scalevegetation map will support improved flora, fauna and fire management of the coastal vegetation and identifypotential impacts as well as opportunities for tourism in the region. The Environment Protection Authority andNorthern Rivers Catchment Management Authority (CMA) also have a vested interest in improving vegetationinformation to support the regulation, management, conservation and rehabilitation of vegetation.In addition, the Office of Environment and Heritage (OEH) has been seeking to improve vegetation mappingproducts across New South Wales and take advantage of the opportunities for fine-scale mapping presented bythe airborne digital sensor (ADS40) data captured by Land and Property Information since 2007 (Taunton 2010).The ADS40 is a high resolution, airborne digital camera that captures fine-scale, multi-spectral photography thatis able to be viewed in three dimensions. <strong>Council</strong> also acquired light imaging detecting and radar (LiDAR) data forthe LGA in 2005. LiDAR data produces high resolution models, including digital terrain (or ground) models, andsurface models (i.e. above ground) with vertical accuracies of ±15 centimetres.Development of a Fine-scale Vegetation Map for the <strong>Coffs</strong> <strong>Harbour</strong> Local <strong>Government</strong> Area 1
This new imagery provides an opportunity to research and develop methods to provide an integrated vegetationmap for coastal New South Wales using the best available technology and data. A multi-agency vegetationmapping program was therefore initiated in 2010. The aim of the program is to develop a fine-scale vegetationmap to support the requirements of the various government agencies by using the latest digital products. Theproject aims to explore various approaches to digital API and map production in order to recommend a model ormethodology to guide future vegetation mapping projects of this nature and at this scale of resolution.The fine-scale mapping project for the <strong>Coffs</strong> <strong>Harbour</strong> LGA is presented in two separate volumes: Volume 1 (thisvolume) – Project Report, and Volume 2 – Vegetation Community Profiles.1.1 Objectives of the studyThe objectives of this study are to:• produce contiguous map products at the 1:5000 scale for the <strong>Coffs</strong> <strong>Harbour</strong> LGA• produce a land cover map for <strong>Coffs</strong> <strong>Harbour</strong> LGA• develop a vegetation community classification for <strong>Coffs</strong> <strong>Harbour</strong> LGA• develop a fine-scale map of vegetation communities in the <strong>Coffs</strong> <strong>Harbour</strong> LGA• research and develop current technologies and test several approaches to fine-scale mapping1.2 Study areaThe <strong>Coffs</strong> <strong>Harbour</strong> LGA covers 117,300 hectares and is one of the few areas of coastal New South Wales where thehigh elevation landscapes of the Great Dividing Range are within close proximity to the coast. The diversity andextremes in landforms across the study area have produced a range of varied habitats containing a high diversityof flora and fauna. The area is within the New South Wales North Coast Bioregion and the majority of the area iswithin the <strong>Coffs</strong> Coast and Escarpment Subregion (Thackway & Cresswell 1995).The overall study area can be seen as consisting of three predominant topographical landscapes: coastal plains,midland hills and escarpment ranges (see Figure 1 and Table 1).Table 1 Landscapes of the <strong>Coffs</strong> <strong>Harbour</strong> LGALandscape Area (ha) Area (%)Coastal plains 32 150 27Midland hills 47 500 41Escarpment ranges 37 650 32Total 117 300 100Of these three landscapes, the coastal plains landscape is home to the majority of the LGA’s human populationand contains the least vegetated land. Conversely the midland hills, and to a greater extent the escarpmentranges, support a much lower density of population per square kilometre because most of these areas are ruralor village living. Accordingly, these landscapes — particularly the escarpment ranges — contain the highestamount of vegetated land within the study area. Major land uses in the LGA vary across the three landscapes. Thecoastal plains are dominated by urban and rural residential areas, with limited areas of horticulture, grazing andcropping. The midland hills and escarpment ranges are mostly rural, with some grazing and forestry, and limitedareas of horticulture (primarily bananas and blueberries).2Development of a Fine-scale Vegetation Map for the <strong>Coffs</strong> <strong>Harbour</strong> Local <strong>Government</strong> Area
Figure 1The study area and landscapes of <strong>Coffs</strong> <strong>Harbour</strong> LGADevelopment of a Fine-scale Vegetation Map for the <strong>Coffs</strong> <strong>Harbour</strong> Local <strong>Government</strong> Area 3
1.3 LandformsThe coastal plain is a low relief landscape with little variation in altitude. It gradually rises from sea level alongthe shoreline to around 50 metres elevation where it transforms into the midland hills landscape, usually within10 kilometres of the coast. Slopes are predominantly flat to gentle (0–5°) though some small hills with steeperslopes are found in this landscape. The coastline is approximately 80 kilometres in length and features a series ofprominent rocky headlands and beaches.The coastal plains landform may be divided into the Barcoongere Low Hills and Gleniffer Bonville Hills regionsdescribed by Milford (1999). These are characterised by low relief, undulating to rolling foothills and creeklinesdraining the coast range. Milford (1999) also names the <strong>Coffs</strong> <strong>Harbour</strong> Coast region as a landform and this containsthe unconsolidated alluvial, estuarine and coastal barrier sediments.The midland hills landscape is a moderately undulating landform and encompasses the foothills and low rangesbetween the coastal plains and the escarpment ranges. The western boundary roughly corresponds to the 250metre elevation contour. Land along major river valleys is relatively flat, with associated slopes being predominantlyslight to moderately steep (1–20 o ), though very occasional steep slopes (>40 o ) also occur. This landscape includessome geographic features associated with the coastal ranges, including sandstone escarpments in the northwest,and valleys, creeks and rivers draining northwards to the Clarence River.The midland hills landscape can be further subdivided into the distinctive sandstone landforms of the KremnosPlateau, and the steep metasedimentary and sedimentary hills of the Coast Range physiographic region. Milford(1999) also recognised the Orara, Corindi and Bellingen River Valley physiographic regions, which cross all threebroad landscape classes. These regions encompass flat to gently undulating floodplains, channels and swamps.The Orara River Valley drains a large proportion of the catchment of the study area.The escarpment ranges landscapes includes the steep hills of the Dorrigo and Orara escarpment regions as wellas the flatter, more undulating terrain of the eastern Dorrigo Plateau and Bobo River Valley. The escarpmentranges extend from around the 250 metre contour in the west of the study area rising steeply to high points suchas Mount Wondurrigah (820 m) and Mount Moombil (1042 m) in the south. Slopes are predominantly moderatelysteep to very steep (16–49 o ) with small areas of precipitous slopes along some cliffs associated with gorges. Someof the major gorges and canyons in this area include Wayper Creek, Shingleback Creek, Bangalore Creek, LittleNymbioda River and Urumbillum Creek.On the elevated western fall of the escarpment range there is a combination of large and relatively flat plateaus,interspersed with slight to moderate slopes in the valleys which form the eastern Dorrigo Plateau landscape. Thevegetation is influenced by the altitude and colder climate here, with significant areas of warm temperate andcool temperate rainforest. The southern boundary of the eastern Dorrigo Plateau and the LGA runs along theridgeline of mountain ranges bordering the Gleniffer and Crossmaglen valleys.1.4 Geology and geomorphologyThe overall geological history of the study area is that of older and stable weathered Permian and Carboniferousclastic metasedimentary rocks overlain by more-recent sedimentary rocks formed in the Clarence–Moreton Basin.The only examples of volcanic or plutonic activity in the study area are intrusions of monzogranite at DiggersPoint and Look-at-me-now Headland (Milford 1999). The geological history of the coast and floodplains is ofrecent deposition of Holocene and Pleistocene unconsolidated sediments. The rise in topography from east towest is due to uplift during the formation of the Great Escarpment which commenced about 80 million years ago(Oliver 1982).4Development of a Fine-scale Vegetation Map for the <strong>Coffs</strong> <strong>Harbour</strong> Local <strong>Government</strong> Area
Milford (1999) provides a more detailed account of the geology and describes the soil landscapes of the <strong>Coffs</strong><strong>Harbour</strong> 1:100,000 map sheet. The <strong>Coffs</strong> <strong>Harbour</strong> LGA is located within three major geological divisions ofsedimentary and metasedimentary rocks: the Clarence–Moreton Basin, Nambucca Block and Demon Block.Figure 2 shows the distribution of the major geological units across the landscape. Table 2 describes the maingeological units of the <strong>Coffs</strong> <strong>Harbour</strong> area, and the corresponding age and geographic/geomorphic group towhich they belong.Table 2 Geological units of the <strong>Coffs</strong> <strong>Harbour</strong> LGAGeological age Geographic/geomorphic group Geological unitHolocene Unconsolidated sediments Dunes and beachesSaline tidal areas (estuarine plains)Floodplains (alluvial plains)PleistoceneBackbarrier sand plains and freshwater wallumswampsTriassic/Jurassic Clarence–Moreton Basin sediments Kangaroo Creek SandstonesCorindi ConglomeratesWalloon Coal MeasuresUn-named granite intrusionEmerald Beach AdamellitePermian Nambucca Block metasediments Bellingen SlatesCarboniferous Demon Block metasediments Coramba BedsBrooklana BedsMoombill SiltstonesThe Demon Block contains Carboniferous metasediments of the <strong>Coffs</strong> <strong>Harbour</strong> Association. The <strong>Coffs</strong> <strong>Harbour</strong>metasediments are divided into three units (Milford 1999). The Coramba Beds is the most extensive and occursacross the plateau, escarpments and hills. The Brooklana Beds and Moombil Siltstones occur further south. Thesemetasediments, derived from old marine and/or riverine sediments, mainly support wet and dry sclerophyll forestswith pockets of rainforest in sheltered higher rainfall sites. More-exposed sites with shallow soils occasionallysupport open forest, woodland and shrubland vegetation.The Nambucca Block is characterised by more-recent metasediments of Permian age. The main geological unit(the Bellingen Slates) is restricted to the southern section of the study area and these metasediment areas formfine-grained quartz soils which, combined with sheltered aspects and high rainfall, can support tall wet eucalyptforest and rainforest.In the north–west of the study area are more recent Triassic and Jurassic sandstones and conglomerates of theClarence–Moreton Basin. The Kangaroo Creek Sandstones form undulating to rolling plateaus on the KremnosPlateau at Andersons Mountain and Dicks Knob. The sandstone environments support distinctive dry sclerophyllforest and woodlands growing in shallow high-quartz soils. Corindi Conglomerate outcrops occur throughout thenorth-west of the study area in Wedding Bells and Conglomerate state forests and generally support dry heathyand grassy dry sclerophyll forest, with wet sclerophyll elements in sheltered localities. The Walloon Coal Measuresunderlay the conglomerate geology and the generally steep and moist sheltered terrain provides habitat for tallwet sclerophyll forest and rainforest.Development of a Fine-scale Vegetation Map for the <strong>Coffs</strong> <strong>Harbour</strong> Local <strong>Government</strong> Area 5
Figure 2Major geological units of the <strong>Coffs</strong> <strong>Harbour</strong> LGA6Development of a Fine-scale Vegetation Map for the <strong>Coffs</strong> <strong>Harbour</strong> Local <strong>Government</strong> Area
A large percentage of the coastal plain is comprised of alluvial soils along major non-tidal drainage networks andvalleys, and sands and muds of coastal backbarriers and estuaries. Unconsolidated alluvial sediments have beendeposited in the valleys and floodplains of the Orara, Bobo and Corindi rivers and many coastal creeks. Theseareas support riparian forests, and forested and freshwater wetlands. Holocene estuarine sands, muds and clayshave deposited in the tidally influenced main creeks and rivers of the study area. Examples include the Corindi,Pine and Boambee creek estuaries, which support areas of saltmarsh, mangrove and saline swamp forests.Recent Holocene sand dunes have formed along the beaches. Located behind these are older, less fertile andpoorly drained backbarrier sands of Pleistocene age which support wallum heathland, swamp forest/woodland,littoral rainforest, and grasslands.1.5 Soils and soil landscapesThere are 44 soil landscapes recognised in the study area (Milford 1999). Soils have an important influence onthe distribution of vegetation in the study area. Soil formation is influenced by the parent material’s resistance toweathering, chemistry and mineral composition; slope and aspect; and soil moisture and permeability.For example, the shallow coarse-grained, high-quartz soils of the Kangaroo Creek Sandstones support distinctivedry sclerophyll forests and woodlands with a high level of species diversity. In areas of fine-grained low-quartzmetasedimentary geology, soils may vary from deep red soils in areas on sheltered slopes with high soil moisture,to shallow yellow earth on exposed slopes in drier locations. This is reflected in the distribution of tall moist forestand rainforests on the deep red soils in sheltered areas, to dry open forests on the shallow soils of exposed sites.Even the relatively infertile sandy soils of Holocene dunes may support luxuriant forms of littoral rainforest insheltered areas.1.6 ClimateContinental climatic patterns are controlled by the progression of high- and low-pressure systems and associatedtroughs across the country. Seasonal patterns of temperature and rainfall are driven by the north–south migrationof high-pressure systems. The effects of tropical cyclones and landforms also have an impact on the climate of theregion. Longer term trends in rainfall and temperature are influenced by the El Niño – Southern Oscillation, whichdetermines the circulation and strength of trade winds directing moisture across eastern Australia (NRAC 1996).In the study area, summers are generally hot and winters are moderate. The annual mean summer (February)maximum temperature for <strong>Coffs</strong> <strong>Harbour</strong> is 26.8 o C and the minimum is 19.5 o C. The annual mean winter (July)maximum and minimum temperatures at <strong>Coffs</strong> <strong>Harbour</strong> are 18.7 o C and 7.6 o C respectively (BOM 2012).Rainfall is highest in February and March and lowest in late winter to spring, with September being the driestmonth. The mean annual rainfall at <strong>Coffs</strong> <strong>Harbour</strong> is 1699 mm (BOM 2012).Topography and elevation play a significant role in the distribution of local climatic conditions across the studyarea — there is a clear correlation between increasing elevation and higher rainfall and lower maximum andminimum temperatures. For example, minimum winter temperatures range between 9.1 o C on the flatter, northerncoastal areas and 1.8 o C on the highest parts of the escarpment ranges, while maximum summer temperaturesrange between 19.5 o C and 14 o C between these same locations. Annual rainfall also varies across the study area,with over 1950 mm falling on the high elevation plateaus and 1310 mm falling in the northern inland parts of thestudy area (some 650 mm less).Development of a Fine-scale Vegetation Map for the <strong>Coffs</strong> <strong>Harbour</strong> Local <strong>Government</strong> Area 7
1.7 Fire historyMajor fires in the <strong>Coffs</strong> <strong>Harbour</strong> LGA occurred in 1977, 1990 and 1994. Generally, similar forest types emerge aftera fire, but in some cases fires can replace moist vegetation types with drier types, can convert areas of heathlandto grassland, or can change the structure of a vegetation community. For example, adult plants of Hakea actites(an emergent shrub) are killed by fire and this changes the structure of the heathland vegetation at Garby NatureReserve.Most of the largest wildfires in the study area occurred in the conglomerate and sandstone landscapes in the north,and the steep gorge country in the north-west. These areas support dry sclerophyll and heathland communitiesthat are adapted to fire and produce the major fuel loads needed for wildfires to occur. Predictably, areas thatare more fertile and support wet sclerophyll vegetation have historically very low fire frequencies. Coastal areashave experienced several wildfires, particularly in Moonee Beach Nature Reserve and Bongil Bongil and Yuraygirnational parks.Fire management, including selection of fire regimes (frequency, seasonality and duration), can exert changesin vegetation patterns. There is considerable variation in the fire requirements of the communities occurring inthe study area; from more fire-adapted dry sclerophyll forest and heathlands communities to those fire sensitivecommunities which require the exclusion of fire (e.g. littoral rainforests, forested wetlands, saltmarshes). Even themost fire-adapted communities are sensitive to inappropriate fire regimes.2. MethodsThe project was carried out in four main stages.1. Trial and select methods to develop a land cover map and delineate vegetation community boundaries (seeSection 2.1).2. Map broad land cover types, including areas of extant vegetation, remnant vegetation and paddock trees(see Section 2.2):• Definiens segmentation and development of algorithms• edit and refine Definiens segmentation.3. Develop a vegetation community classification for <strong>Coffs</strong> <strong>Harbour</strong> LGA:• conduct gap-filling flora surveys across the study area using stratified random sampling (see Section 2.3)• complete a numerical analysis of the flora survey site data to develop a vegetation classification for thestudy area (see Section 2.4)• refine the vegetation classification through expert review and field verification.4. Map vegetation communities (see Section 2.5):• extract boundary of extant vegetation (using Stage 2 land-cover product) to define the area to bemapped• apply API techniques to map vegetation communities using Stereo Analyst and Planar monitor/viewer• field reconnaissance surveys to support API and refinement of vegetation classification• refine vegetation boundaries.8Development of a Fine-scale Vegetation Map for the <strong>Coffs</strong> <strong>Harbour</strong> Local <strong>Government</strong> Area
2.1 Trialling alternative mapping pathwaysAn overall objective of the project was to develop a survey and mapping methodology that could be more widelyused by local governments across coastal New South Wales. Accordingly, a number of approaches to mappingwere trialled before a final method, or pathway, was established.Recent advances in image classification have shifted away from processing whole images to processing subsetsor smaller polygons called ‘objects’ — this process is called object recognition and classification. This technology,together with the availability of high resolution airborne digital sensor (ADS40) imagery and light detecting andranging (LiDAR) data, has led to the development of a number of techniques for automated or semi-automatedvegetation mapping. Furthermore, API has moved away from stereoscopes to the use of digital stereo viewing(Planar stereo/3D monitor by Planar Systems Inc.) which can now take full advantage of the high resolutionimagery available for interpretation. The Planar environment also allows the direct delineation and attribution ofpolygons in three-dimensional (3D) stereo view (Level 1 imagery) whilst simultaneously having a two-dimensional(2D) context view and any number of additional datasets to guide mapping decisions.Discussion groups were held in the early phase of the project to explore alternative methods for developing landcovermaps (including extant vegetation cover) and delineating vegetation community boundaries.As a result of the discussions, the following methods were trialled:• For land-cover mapping, Definiens (see below) segmentation and development of algorithms forclassification of vegetated versus non-vegetated lands.• Crown delineation modelling using Definiens and image processing software (ERDAS Imagine) toclassify tree crown types to species level as an input to vegetation community mapping.• Image enhancement techniques to exaggerate differences in spectral response of vegetation andthereby interpret different vegetation communities. Derived from manipulation of ADS40 multi-spectralimagery.• Delineation of vegetation communities by interpretation of 3D ADS40 imagery using Stereo Analystsoftware (ERDAS) and Planar stereo/3D monitors (Planar Systems Inc.).2.2 Land-cover mappingHigh resolution airborne digital sensor (ADS40) imagery supplied by the Land and Property ManagementAuthority and LiDAR data were used to map the broad land-cover types within the <strong>Coffs</strong> <strong>Harbour</strong> LGA. The ADS40sensors recorded land surface information at 50 centimetre resolution in four bands, including near-infrared, andwas flown between April 2009 and July 2010. The LiDAR data was supplied by <strong>Coffs</strong> <strong>Harbour</strong> <strong>City</strong> <strong>Council</strong> and wasflown in January 2007.The primary purpose of the land-cover mapping was to separate cleared areas from areas with extant vegetationcover. Thirteen classes for land-cover mapping were used as listed in Table 3.Ancillary data to complete the land-cover mapping included:• urban zone boundaries from <strong>Coffs</strong> <strong>Harbour</strong> LEP 2000• boundary of Sapphire to Woolgoolga Pacific Highway upgrade from <strong>NSW</strong> Roads and Maritime Services• Forests <strong>NSW</strong> plantation data as supplied in 2011• tenure boundary data (e.g. national parks and state forest) from OEH and Forests <strong>NSW</strong>.Development of a Fine-scale Vegetation Map for the <strong>Coffs</strong> <strong>Harbour</strong> Local <strong>Government</strong> Area 9
Definiens software (Definiens 2007a, 2007b) was used to produce the land-cover mapping. This software isbased on object-based image analysis. The two fundamental principles of this analysis are segmentation andclassification. Firstly, spatial data are segmented into smaller polygons (referred to as ‘objects’), by a range ofsegmentation algorithms. Secondly, the image objects are then classified using an array of hierarchical, temporal,spectral and spatial context tools.An important decision rule for inclusion in a Definiens rule set is the normalised difference vegetation index,especially for land cover. The effects of shadow were reduced using a combination of LiDAR parameters andDefiniens rule sets.The method chosen was to process each ADS40 tile separately in a Definiens Server framework. This required anintensive pre-processing strategy where LiDAR data were resized, formatted and collated to match ADS40 tiles sothat a customised import into the Definiens Server could be performed.After the segmentation was complete, the process of classifying the segmentations (or objects) was commenced.A rule set was developed to classify approximately 80% of an ADS40 tile’s objects accurately, so that the remaining20% could be finalised manually. The rule set was developed collectively and iteratively with experts reviewingand refining a centrally managed ‘master’ rule set. Experts also focussed their refinements on particular landscapefeatures (e.g. shadows, paddocks, horticulture). To assist in the manual work of classification, additional algorithmswere developed using object-orientated image processing. Further refinement was carried out using manualdigitising.Table 3 Summary of land-cover classes used in the studyCodeDescription1 Forest1a Urban & rural living vegetation remnant2 Forestry plantation2a Hardwood plantation2b Softwood plantation3 Trees–Shrubs4 Grasslands–Pasture5 Horticulture–Cropping6 Impervious–Surfaces7 Railways8 Water8a Lake8b Reservoir–Dam8c River8d Marsh–Wetland8e Estuary–Coastal Waters9 Sand–Beach10 Headland Rock11 Urban & rural living12 Pacific Highway13 Highway Upgrade 201110Development of a Fine-scale Vegetation Map for the <strong>Coffs</strong> <strong>Harbour</strong> Local <strong>Government</strong> Area
2.3 Gap-filling flora surveysThree tiers of survey were conducted during the study, as summarised in Table 4.Table 4 Summary of flora surveys supporting this studySurvey type No. of sites Description of surveyFull floristic surveys 534 All vascular species recorded within a quadratRapid data surveys 462 Recording of dominant species in each strata279 Set aside for Accuracy assessmentAPI site surveys (see Section 2.5) 2 479Ground truthing of API mapping and assignmentof vegetation community to a siteTotal 3 754Within the study area there were 393 existing full floristic survey sites from the YETI (Ellis et al. 2009) flora database,which equates to about one site per 300 hectares. This number of sites was insufficient to complete a mappingexercise for the LGA and additional full floristic surveys were required.A stratified random sampling technique was used to evenly allocate sites across the landscape. Spatial layers usedto develop the strata were a composite of geology, soil landscapes, solar radiation and topographic position. Tooptimise site location across the landscape, Survey Gap Analysis (Manion & Ridges 2009) software was used toefficiently allocate sites to strata.To ensure a balance of sampling across Crown lands and private property, <strong>Council</strong> invited landowners with overfive hectares of land to participate in the program by allowing a survey to be conducted on their property. Therewas a strong and positive response to this invitation. The surveys were conducted over the spring–summerseason of 2010/11.Full floristic survey data were generally collected within 20 x 50 metre nested quadrats (or 10 x 40 metre plotsin linear environments such as creeklines). The information was collected digitally and entered into an Accessdatabase compatible with the <strong>NSW</strong> <strong>Government</strong> central flora database, YETI (Ellis et al. 2009). An additional 141full floristic survey sites were surveyed within the LGA by Eco Logical Australia, giving a total of 534 full floristicflora sites available for the floristic analysis.During the full floristic surveys, 462 rapid data sites were also surveyed and this information was used to guide thevegetation mapping work by providing reference points for photo patterns. Rapid surveys collected informationon dominant species in each strata. The aim of rapid data site surveys was to cover as much ground as possible inthose areas that were easily accessible. Therefore, there is a tenure bias to that data, with limited plots collectedon private land or in more remote/off-road locations. Afterwards, a vegetation community was assigned to eachof these sites to guide and confirm API decision making.2.4 Vegetation community classificationVegetation classification involves a ‘cluster’ analysis which groups floristic sites that are similar (Dale 1995). Inthis study, a numerical PATN analysis (Belbin 1994) was undertaken using the available 534 full floristic sites todetermine the main floristic groups for the study area. PATN software requires the operator to select the numberof groups required in the output. A ‘100-group’ analysis was undertaken because over 60 forest types (ForestryCommission of <strong>NSW</strong>, 1989) occur within the forested landscapes of the study area without considering coastalheath and estuaries.Development of a Fine-scale Vegetation Map for the <strong>Coffs</strong> <strong>Harbour</strong> Local <strong>Government</strong> Area 11
A hierarchical agglomerative classification of sites (Belbin, 1991) was produced using a clustering strategywith a default Beta value of -0.1 in a flexible unweighted pair group method with arithmetic mean (UPGMA)clustering strategy. A dendrogram of one hundred floristic groups (100) was derived from the Bray Curtisassociation measure (Bray and Curtis, 1957) and UPGMA clustering at a dissimilarity measure of approximately0.75. Considerable refinement of the classification was done by deleting and merging of floristic groups, andremoval and reallocation of floristic sites using the results of a nearest neighbour analysis (Belbin 1994), fidelityanalysis (Bedward, unpublished software) and expert interpretation. Subsequent classification refinement andevaluation was carried out during the API mapping program and by testing the floristic communities in the field.As field evidence was collated during the API mapping process (see Ground truthing surveys section below) thenumerical vegetation classification was progressively reviewed and refined. This involved either re-allocation offlora plots to a neighbouring group in the dendrogram, or the un-allocation of plots if they were found not to berepresentative of the vegetation community, or the addition of a vegetation community not adequately sampledby existing flora surveys.2.5 Vegetation mappingAPI involves recognising patterns in the vegetation, understanding the species composition, delineatingcommunity boundaries, and assigning a suitable vegetation community label from the classification (Paine &Kiser 2012).Vegetation mapping using conventional API was undertaken using the following three steps:• Develop a draft vegetation community map (linework and attribution of data to polygons) using StereoAnalyst and Planar stereo/3D monitors.• Conduct ground truthing surveys and record the API site survey information.• Revisit vegetation map labels and refine vegetation boundaries.This process can be iterative between developing the linework and finalising the attribution.Develop a draft vegetation community mapStereo API techniques were applied in this study using Planar stereo/3D monitors and Stereo Analyst softwareon an ESRI ArcGIS 10.0 platform. Additional ancillary information was used to assist in the API work, including:• previous mapping and survey work in the study area (see Appendix 2)• full floristic flora survey site data with the allocated floristic group• image enhancement products — Stereo Analyst enhancement of ADS40 stereo imagery and asaturation stretch of ADS40 ortho-rectified imagery based on Roff (2009)• hillshade using LiDAR-derived digital terrain model to assist interpretation of topographic variables(aspect, slope, position on slope, ridges and gullies)• substrate information — quaternary near-surface geology where available (alluvial sediments) and soillandscapes or 1:250,000 geology in other areas.The API decision pathway and specifications were designed to facilitate a one-to-one match with the floristiccommunities derived during the vegetation classification. All specifications and the API decision pathway areshown in Appendix 3.12Development of a Fine-scale Vegetation Map for the <strong>Coffs</strong> <strong>Harbour</strong> Local <strong>Government</strong> Area
Ground truthing surveysGround truthing surveys consisted of API site surveys. Ground truthing in the field undertaken extensivelythroughout the project with a focus on publicly accessible areas and areas that were visually accessible frompublic roads or tracks. Field information was collected using a geographic positioning system (Pocket PC, ASUS A696) on an ArcPad platform and was recorded at 5–10 metre accuracy.API site surveys collected information on the vegetation community and dominant species in order to interpretthe vegetation patterns for a particular locality. The data from these points were viewed in the 3D Stereo Analystmapping environment to guide and confirm decision making.Completion of linework and attributionOnce linework was complete, a suitable vegetation community label from the vegetation classification wasassigned to polygons. Additional data included a reliability score from 1 to 4, an indication of dominant species(where required), an indication of disturbance, presence of weeds and other comments as required.Interpreters would use all available supporting data to attribute each polygon to one of the categories, and ifuncertain, or a mosaic of categories existed, a dual category would be assigned.Table 5 describes these additional attributes and their descriptions.Table 5 API polygon attribution descriptionsAttributeReliabilitySignificantdisturbanceRemnant treesDescription1 = Ground validation of polygon2 = High level of confidence (adjacent polygons have survey data or distinct photo pattern)3 = Moderate level of confidence (survey data in near vicinity)4 = Low level of confidence (lack of nearby survey data or indistinct photo pattern)Native vegetation with significant occurrence (30–50%) of environmental weeds or significantdisturbance defined as either:• loss of or >50% disturbance to canopy• removal of >50% of understory/ground coverSignificant disturbance where interpretation of vegetation community is no longer possible(significant alteration of structure and species composition)The mapping was undertaken by six different aerial photograph interpreters. The study area was divided intomanageable API tiles as shown in Figure 3, and tiles assigned to each interpreter. Consistency was achieved byhaving interpreters work in pairs during field surveys, and by regular calibration during the mapping exercise.Once all API tiles were completed, they were stitched together and effectively edge-matched through manualdigital editing in the 2D mapping environment with reference to the patterns in the 3D mapping environment.Final checking for global errors, gross errors, consistency in mapping and other logical checks were made. Datawas collected in the structure shown in Appendix 3. For details of the lineage of the data please refer to themetadata statement attached as Appendix 4.Development of a Fine-scale Vegetation Map for the <strong>Coffs</strong> <strong>Harbour</strong> Local <strong>Government</strong> Area 13
Figure 3API map tiles used in the study14Development of a Fine-scale Vegetation Map for the <strong>Coffs</strong> <strong>Harbour</strong> Local <strong>Government</strong> Area
2.6 Accuracy AssessmentAccuracy assessments for vegetation maps typically have three phases: a response design, a sampling design,and analysis and estimation (Stehman and Czaplewski, 1998). A response design can be a hard classification (ordeterministic with a binary choice) or using a soft classification (fuzzy set) to allow for natural variations withinvegetation and uncertainty in assigning a vegetation type (Schowengerdt, 1997). Accuracy assessments whichapply the deterministic approach generally use an error matrix (or confusion matrix) to arrive at statistics for ‘user’and ‘producer accuracy’ and ‘overall accuracy’. The diagonal elements of the error matrix represent agreementbetween the map and reference labels, and the off-diagonal elements reflect disagreements between the mapand the reference labels. In fuzzy sets the row and column additions do not match correctly if applied to an errormatrix and alternative methods are used to derive ‘overall accuracy’ (Stehman, et al 2007). For example, Gopaland Woodcock (1994) apply a ‘right’ function which is equivalent to the sum of the diagonal in an error matrix.In this study a fuzzy set was used in the response design, with a stratified random sampling design, and the Gopaland Woodock (1994) method was used for the estimation of overall accuracy. For the study area, a total of 279stratified random 1 plots, with a minimum of one plot per vegetation type and up to three plots for vegetationtypes with large areas were sampled. Plots were located at least 100m away from existing flora surveys (fullfloristic and rapid data points).A team independent of the map production process completed the accuracy assessment for the purpose ofconducting a “blind” test. To achieve this, only the polygon outlines (without labelled vegetation communities)were initially provided for the accuracy assessment by OEH and plot locations were also prepared independentlyby the sampling design team for the field assessors.The plots were assigned to a vegetation community type using a fuzzy set (see degree of correctness Appendix6 page 9). In the standards, a validation plot consists of recording the dominant species in each stratum, as wellas the percentage cover for each species, and assigning each vegetation type a degree of correctness in the field.In this study, variations to the standard occurred in two areas:1. Percentage cover of each stratum was recorded rather than for each dominant species, and2. Matching to vegetation type using the fuzzy set occurred in the office rather than in the field.Results from the validation exercise were included in the final map product to make use of the additional fieldinformation and this was conducted in three stages:1. Plots and polygon labels were compared with accuracy assessment (AA) and any inconsistencies werecorrected as follows:a. Point/polygon and AA in agreement – no changeb. Point/polygon and AA in disagreement (AA correct) – change mapped polygon (in part or all)c. Point/polygon and AA in disagreement (AA incorrect) – change AA but map is unchanged as original maplabel was found to be correct using information from the new and/or existing field data.2. Feedback from the public exhibition period were then included.3. Recommendations from the validation report implemented.The AA is for thematic map accuracy only, with no assessment of linework accuracy. The AA was reported usingthe following two statistics:1 Plots locations were constrained by proximity to the road network and away from existing surveys.Development of a Fine-scale Vegetation Map for the <strong>Coffs</strong> <strong>Harbour</strong> Local <strong>Government</strong> Area 15
1. Original Overall Accuracy (OOA) – the Gopal and Woodcock (1994) RIGHT function was reported as the OOA.2. Reviewed Overall Accuracy (ROA) – the ROA incorporates the above feedback and improvements to the map.Where no map changes can be justified from the field information available but the AA shows a mismatch,then the map was unchanged and the OOA reviewed to give the ROA. Revisions only applied to situationsdescribed by 1(c) above to arrive at the ROA statistic. This figure was also a weighted accuracy where theaccuracies of the individual classes were weighted by their areas (Gopal and Woodcock, 1994), so thatimprovements to vegetation classes with small areas only result in marginal improvements to ROA.3. Results3.1 Selection of mapping pathwaysAlternative mapping pathways (Section 2.1) showed promise for future development in a research environmentwith small study areas. However, only API using Stereo Analyst was demonstrated to be viable for vegetationmapping in an operational sense, and as such, this is the method we used to map vegetation in this study. TheDefiniens-based segmentation and classification technique was used for the land-cover mapping component ofthe project. Crown delineation modelling was not used because of the time and costs involved in calibrating eachimage or tile.3.2 Land-cover mappingThe land-cover mapping showed that 75% of the study area had extant vegetation cover and 21% was cleared(see Table 6). Horticulture and cropping was the third largest land use, covering just over 2% of the LGA, includingbanana plantations, blueberry farms and other crops. Land-cover mapping was completed by three geographicinformation system / Definiens operators within three months.Table 6 Summary of land cover in the <strong>Coffs</strong> <strong>Harbour</strong> LGALand-cover codes Land-cover class Area (ha) Area (%)1a,2,2a,2b,3 Extant vegetation cover 88 964 75.844,11 Cleared 24 050 20.505 Horticulture–Cropping 2 700 2.308e Estuary–Coastal Waters 390 0.338b Reservoirs–Dams 377 0.329 Sand–Beach 270 0.2313 Highway upgrade 2011 193 0.168c River 102 0.097 Railway strip 83 0.0712 Pacific Highway 76 0.0610 Headland Rock 59 0.058a Lake 28 0.028 Water 8 0.01Total 117 300 100%Land tenure was found to be almost equally divided between Crown land (48%) and freehold land (51%), however,almost half of the freehold land has been cleared as shown in Table 7.16Development of a Fine-scale Vegetation Map for the <strong>Coffs</strong> <strong>Harbour</strong> Local <strong>Government</strong> Area
Table 7Summary of study area by tenureTenure Area (ha) Area (%)NPWS estate 14 470 12%Forests <strong>NSW</strong> estate 40 240 34%Other Crown lands 2 040 2%Total Crown land 56 550 48%Freehold vegetated 32 400 28%Freehold cleared 28 150 24%Total Freehold 60 249 51%Total 117 300 100.0The fragmentation of remnant vegetation in some areas of the LGA was apparent. In the study area, 4 647 extantvegetation polygons were less than 5 hectares. The average remnant patch size was 2.4 hectares. There are just 28extant vegetation polygons that are greater than 100 hectares (if roads and powerlines are considered as polygonsub-divisions). It is important to note that these results are calculated from an image analysis segmentation ratherthan API. The final vegetation extent was edited and re-mapped in the rural and fragmented areas to betterreflect vegetation cover and the presence of significant remnant patches in those areas.Table 8 Area of extant vegetation cover by polygon size classes (land-cover classification mapping)Area class (ha) No. of polygons Area (ha) Area (%)0.2–5 4 647 2 878 3.25–10 147 1 030 1.210–100 143 3 701 4.2100–1000 22 5 632 6.31 000–10 000 4 11 646 13.110 000–34 000 2 64 077 72Total 4 965 88 964 100.03.3 Gap-filling flora surveysAn additional 141 full floristic sites and 741 rapid data sites were surveyed. Note that 279 rapid data sites were setaside for accuracy assessment or validation of the mapping at a later date.Sampling rates are higher on Crown land than freehold land when considering both full floristic surveys andrapid survey sites, with an average sample coverage of one site per 66 hectares for Crown land and one site per76 hectares for freehold land as shown in Table 9.Table 9 Average site density and tenure sampling rates for sites used in the vegetation classificationTenureNo. of fullfloristic sitesNo. of rapidsurvey sitesTotalsites% of totalsitesSampling rate(ha per site)NPWS estate 235 156 391 31%Forests <strong>NSW</strong> estate 110 246 356 28%Other Crown lands 15 89 104 8%Total Crown land 851 67% 66Freehold (vegetated) 174 250 424 33% 76Total 534 741 1275 100%Development of a Fine-scale Vegetation Map for the <strong>Coffs</strong> <strong>Harbour</strong> Local <strong>Government</strong> Area 17
The geographic spread of sites across the study area is show in Figure 4. The figure includes both flora sitescollected during the mapping project and existing data for the study.3.4 Vegetation classificationThe PATN analysis was set at a 100 floristic group level. During the mapping program the PATN-derived groupswere comprehensively tested and refined in the field. The result produced a list of 79 communities as listedin Appendix 5. This process was invaluable for the development of the final vegetation communities and thevegetation mapping classes.One of the main challenges during the mapping and testing of the community list, was to ensure that vegetationcommunities identified by PATN analysis could be recognised and accurately delineated from the ADS40 imagery.Some map units represented potential plant communities or previously recognised communities that were notdelineated by the PATN analysis due to lack of surveys or the restricted nature of the community.These results show the value of having previous studies, numerical analysis, and mapping to inform theclassification process. While it is desirable to have a fixed vegetation classification prior to mapping, deficienciesin the data used in the classification may be exposed by the mapping process. The final vegetation classificationand mapped units are described in Volume 2 – Vegetation Community Profiles.3.5 Vegetation mappingThe extent of vegetation in the study area was 88 964 hectares, with 18 311 polygons needing to be assignedto one of the 79 classified vegetation communities (see Appendix 5). The use of stereo API in combination withexisting mapping products and field validation resulted in the completion of the study area in a 12 month APIprogram. Table 10 summarises the area by vegetation formation and classes across the study area. Overall, 11formations were mapped across 24 different classes of native vegetation. In general, it was more difficult to assignvegetation to a community in fragmented and disturbed landscapes than in contiguous forested areas.Wet sclerophyll and rainforest formations dominate the landscape, covering over 60% (54 971 ha), and this ismainly due to the rich, fertile landscapes and high annual rainfall. Dry sclerophyll forests cover 19% (17 198 ha),while the coastal communities cover only 6% (5 274 ha) of the LGA. Derived communities including plantations,exotics and regenerating pioneers cover over 10% of the vegetated area in the LGA.The vegetation map (see http://maps.coffsharbour.nsw.gov.au/eview-html/index.html#) illustrates thebiodiversity of the <strong>Coffs</strong> <strong>Harbour</strong> LGA. Large areas of rainforest and wet sclerophyll forest are mapped in the westand south of the study area across the fertile areas of the eastern Dorrigo Plateau, escarpment ranges and the upperreaches of the Orara and Bucca valleys. In contrast, much of the sandstone and coastal metasediment-dominatedlandscapes in the north of the study area are mapped with large stands of dry sclerophyll forest, heathlands andforested wetlands. Overall, the variety of soil moisture gradients, geologies, altitudes and quaternary landscapessupport a diverse array of floristic communities.The final vegetation map shows that the major contributing influences to the floristic diversity are likely to bealtitude and geology, followed by coastal/marine processes. The coastal areas have the most complex vegetationpatterns and this is reflected by the number of communities mapped and the large numbers of small polygons.18Development of a Fine-scale Vegetation Map for the <strong>Coffs</strong> <strong>Harbour</strong> Local <strong>Government</strong> Area
Figure 4Flora sites used in analysis and mappingDevelopment of a Fine-scale Vegetation Map for the <strong>Coffs</strong> <strong>Harbour</strong> Local <strong>Government</strong> Area 19
Table 10 Areas of formations and vegetation classes mapped across the <strong>Coffs</strong> <strong>Harbour</strong> LGAFormation Class Class area (ha) Formation area (ha)Derived Exotic vegetation 3 288Native pioneer 209Plantation 6 501 9 998Dry Sclerophyll Forest North Coast Dry Sclerophyll Forest 16 710North Coast Dune Sclerophyll Forest 488 17 198Forested wetlands Coastal Floodplain Wetlands 289Coastal Swamp Forests 2 021Eastern Riverine Forests 576 2 886Freshwater Wetlands Coastal Heath Swamps 785Coastal Lagoons 27Derived Freshwater Wetlands 189 1 001Grasslands Maritime Grasslands 38 38Heathlands Coastal Headland Heaths 876Coastal Wallum Heaths 113Escapment rock outcrops 22Northern Montane Heaths 16 1 027Marine Marine vegetation 3 3Native remnant vegetation Native remnant vegetation 1 456 1 456Natural non-vegetated Rock outcrop 0.2Sand 26 26Rainforest Cool Temperate Rainforest 0.8Dry Rainforest 470Littoral Rainforest 225Subtropical Rainforest 4 324Warm Temperate Rainforest 5 631 1 0651Saline Wetlands Mangroves 146Saltmarsh 214 360Wet Sclerophyll Forest North Coast Wet Sclerophyll Forest 44 320 44 320Total 88 9643.6 Refinement of vegetation classification and map unitsAn iterative approach was taken to finalise the vegetation classification where the results of mapping and groundtruthing surveys informed the classification. During the mapping process some grouping and splitting of theoriginal classification occurred to better match communities identified from ground truthing.As a result, of the 79 vegetation communities, 66 were derived from the numerical analysis (using the 534 fullfloristic sites), and 14 were identified from API. This step-wise method of reviewing the vegetation classificationhighlighted areas where further botanical work would be beneficial to adequately describe the diversity withinthe landscape.Of particular note, the field ground truthing effort was extensive during the API mapping exercise with a total2 479 API sites surveyed. Together with the 534 full floristic sites and 462 rapid data sites, a total of 3 475 sites weresurveyed on the ground.20Development of a Fine-scale Vegetation Map for the <strong>Coffs</strong> <strong>Harbour</strong> Local <strong>Government</strong> Area
3.7 Accuracy AssessmentA full report of the independent accuracy assessment (AA) is provided in Appendix 6, with 279 plots contributingto the AA analysis. The result of the accuracy assessment was an Original Overall Accuracy (OOA) of 66%.To improve the map product, polygon labels were compared to field plots to determine if the polygon labelshould be amended. Of the 279 AA plots, 31 plots were located in polygons which required no change whenassessed against both new and existing field information, resulting in an improvement of 11% with a ReviewedOverall Accuracy (ROA) of 77% (area weighted).The discrepancy between OOA and ROA can be due to a number of factors such as natural variation within apolygon, context of a sample point within a polygon and its neighbouring polygons, relationship of a data pointto all existing data points in the vicinity, interpretation of the field plot information, and/or scoring vegetationtypes at the desktop rather than in the field. In these cases use of a mid-score is more applicable when using afuzzy set for vegetation types that may qualify for a site.As a result of recommendations from the AA report, edits to the vegetation map were made to Cool TemperateRainforest and Dunn’s White Gum Wet Forest. Firstly, Cool Temperate vegetation types (RF01, RF02) were relabelledas Warm Temperate Rainforest as these small areas were not detectable from aerial imagery, except for the mainlocation on Tucker’s Knob (RF01). The description of other locations referred to by local experts is given in thevegetation profiles. Secondly, some areas of the restricted Dunn’s White Gum Wet Forest (WSF13) were found tobe mislabelled due to crown dieback and disturbance and these have been corrected.Further improvements to the map product were made as a result of two submissions from the public exhibitionperiod. This included edits to recognise environmental plantings within riparian vegetation in the Orara Valley,and environmental plantings on a small property south of <strong>Coffs</strong> <strong>Harbour</strong>.Three aims of the vegetation study were to provide a contiguous thematic layer, develop a communityclassification for the LGA, and a developing a fine-scale map product. Given the size of the study area and thenumber of vegetation classes that needed to be identified from aerial interpretation an OOA of 66% (and ROA of77%) represents a major improvement in mapping quality for this LGA. A continuous improvement program willnow be undertaken by CHCC as more site specific information is obtained from development applications andother sources as part of its data maintenance program.3.8 Native species and weeds recorded in surveysIn the gap-filling surveys, 8 114 records of 689 plant taxa were made, including many species of conservationsignificance. Some of the most commonly recorded genera were Eucalyptus (23 taxa) and Acacia (17 taxa). TheLauraceae family (24 taxa) including Cryptocarya, Endiandra and Neolitsea were an abundant component of wetsclerophyll and rainforest communities. Other diverse plant families recorded across a range of wet and dryvegetation formations were Mrytaceae (74), Fabaceae (51), Poaceae (33), Cyperaceae (31) and Proteaceae (24).In addition, 67 weed species were recorded in the surveys. Lantana (Lantana camara) was the most commonlyrecorded weed species. Other commonly recorded, highly invasive weed species included Bitou bush(Chrysanthemoides monilifera), Camphor Laurel (Cinnamomum camphora), Broad-leaved Paspalum (Paspalummandicanum), Senna pendula var. glabrata, and Small Leaved Privet (Ligustrum sinense).Development of a Fine-scale Vegetation Map for the <strong>Coffs</strong> <strong>Harbour</strong> Local <strong>Government</strong> Area 21
3.9 Threatened species of the <strong>Coffs</strong> <strong>Harbour</strong> LGADuring the gap-filling floristic surveys several threatened species were recorded in the study area, includingnew records of Hakea ochroptera and Plectranthus cremnus. Overall, six threatened flora species and 12 rare orthreatened Australian plant (ROTAP) species were found during the <strong>Coffs</strong> <strong>Harbour</strong> LGA flora surveys. Additionally,in other recent surveys five threatened species and several ROTAP species were recorded, including Alexfloydiarepens, Pultenaea maritima, Lindsaea incisa and Ricinocarpos speciosus. There are now 53 known significant plantspecies in the <strong>Coffs</strong> <strong>Harbour</strong> LGA. These species are listed in Table 11.Table 11 Significant plants in the <strong>Coffs</strong> <strong>Harbour</strong> LGASpecies nameCommon nameThreatened SpeciesConservation ActROTAPcodeAcianthella amplexicaulis 3RC-Acomis acoma 3RC-Acronychia littoralis Scented Acronychia TSC-E 3ECiAlexfloydia repens Floyd’s Grass TSC-V 2KAllocasuarina defungens TSC-E 2EAlloxylon pinnatum Dorrigo Waratah 3RCaAnetholea anisata Ringwood 2RCaAngophora robur Sandstone Rough-barked Apple TSC-V 2RC-Austrobuxus swainii Pink Cherry 3RCaArthraxon hispidus Hairy Joint Grass TSC-V 3VC-+Arthrochilus prolixus 3KBoronia umbellata Orara Boronia TSC-V 2VC-Callistemon acuminatus Tapering-leaved Bottlebrush 3RC-Chamaesyce psammogeton TSC-ECorybas undulatus Tailed Helmet Orchid 3KC-Cryptocarya dorrigoensis Dorrigo Laurel 2RCaCryptostylis hunteriana Leafless Tongue Orchid TSC-V 3VC-Cupaniopsis newmanii 2RC-Elaeocharis tetraquetra Square-stemmed Spike Rush TSC-EEndiandra introrsa Dorrigo Plum 3RCaEucalyptus ancophila 2KEucalyptus dunnii Dunn’s White Gum 3RCaEucalyptus fusiformis Grey Ironbark 2RC-Eucalyptus rummeryi Steel Box 3RC-Gahnia insignis 3RCaGoodenia fordiana 2RC-Hakea ochroptera 2KLindsaea incisa Screw Fern TSC-EMarsdenia fraseri Narrow-leaved Milk Vine 3RCMarsdenia liisae Large-flowered Milk Vine 3RC-Marsdenia longiloba Slender Marsdenia TCS-E 3RC-22Development of a Fine-scale Vegetation Map for the <strong>Coffs</strong> <strong>Harbour</strong> Local <strong>Government</strong> Area
Species nameCommon nameThreatened SpeciesConservation ActNiemeyera whitei Rusty Plum, Plum Boxwood TSC-VOberonia titaniaROTAPcodeOlearia flocktoniae TSC-E 2ECiOlearia stillwelliae 3RCaParsonsia dorrigoensis Milky Silkpod TSC-V 2VCiPhaius australis Lesser Swamp Orchid TSC-E 3VCaPeristeranthus hillii Brown Fairy-chain Orchid TSC-VPlectranthus cremnus 3KPlectranthus suaveolens 3KC-Pultenaea maritima Coast Headland Pea TSC-VQuassia sp B TSC-ERicinocarpos speciosus 2RCiSarchochilus fitzgeraldii Ravine Orchid TSC-V 3VC-Schistostylis purpuratus 3RCiSenna acclinis Rainforest Senna TSC-E 3RC-Sophora tomentosa Silver Bush TSC-EThesium australe Austral Toadflax TSC-V 3VCi+Tinospora tinosporoides Arrow-head Vine TSC-V 3RC-Triplarina imbricata TSC-E 2ETyphonium sp aff brownii Black Lily TSC-ETylophora woollsii TSC-E 2EZieria prostrata TSC-ETSC-E = endangered species listed on Threatened Species Conservation Act 1995TSC-V = vulnerable species listed on Threatened Species Conservation Act 1995ROTAP codes - see Briggs and Leigh (1996).3.10 Endangered ecological communities of the <strong>Coffs</strong> <strong>Harbour</strong> LGASeveral of the classified vegetation communities are considered to be endangered ecological communities (EECs)or highly likely to contain EECs based on their substrate or altitudinal/landscape occurrence. Overall, 11 657hectares have floristic communities that may be EECs. Table 12 shows vegetation communities in the study areathat are likely to support threatened communities.Development of a Fine-scale Vegetation Map for the <strong>Coffs</strong> <strong>Harbour</strong> Local <strong>Government</strong> Area 23
Table 12 Vegetation communities likely to contain endangered ecological communities* Vegetation community CH_FW08 (Coastal Spike Rush Cumbungi Freshwater Wetland) covers 382 hectaresacross the LGA. Much of this includes farm dams and heavily disturbed creek lines where allocation as an EECrequires further field verification. For purposes of this report an area estimate has been omitted.‡ Rainforest communities CH_RF03, CH_RF04 and CH_RF12 only qualify as EECs if their occurrence is below600 m altitude, and areas have been calculated using this elevation threshold.Coastal Saltmarsh in the <strong>NSW</strong> North Coast, Sydney Basin and South East Corner bioregions EECCH_SW02 Estuarine Twig Rush Saltmarsh 47CH_SW03 Coastal Dune Sedgeland Soak 11CH_SW04 Coastal Dune Prickly Couch Grasslands 0.40CH_SW05 Coastal Headland Twig Rush Sedgeland Soak 4CH_SW06 Estuarine Sea Rush Saltmarsh 38CH_SW07 Estuarine Samphire - Saltwater Couch Saltmarsh 114214.4Freshwater Wetlands on Coastal Floodplains of the <strong>NSW</strong> North Coast, Sydney Basin and South East Corner bioregionsEECCH_FW07 Coastal Jointed Twig-rush Freshwater Wetland 27CH_FW08 Coastal Spike Rush Cumbungi Freshwater Wetland * Area notavailable27Littoral Rainforest in the <strong>NSW</strong> North Coast, Sydney Basin and South East Corner bioregions EECCH_RF07 Coastal Exposed Dune Littoral Rainforest 95CH_RF08 Coast Headland Brush Box Littoral Rainforest 42CH_RF13 Coastal Sheltered Dune Littoral Rainforest 93230Lowland Rainforest in the <strong>NSW</strong> North Coast and Sydney Basin bioregions EECCH_RF03 Plateau and Escarpment Coachwood Sassafras Warm Temperate Rainforest ‡ 1 201CH_RF04 Plateau and Escarpment Hoop Pine Dry Rainforest ‡ 54CH_RF05 Foothills Brown Myrtle Dry Rainforest 340CH_RF06 Escarpment Grey Mrytle Brush Box Dry Rainforest 76CH_RF11 Escarpment and Lowland Bangalow - Carabeen - Black Booyong Palm Gully Rainforest 4 271CH_RF12 Escarpment Coachwood - Sassafras - Brush Box Warm Temperate Rainforest ‡ 286CH_WSF15 Foothills Steel Box Brown Myrtle Wet Forest 5576 785Lowland Rainforest on Floodplain in the New South Wales North Coast Bioregion EECCH_FrW07 River Oak Riparian Forest of the Orara River Valley 189CH_RF09 Hinterland White Booyong Floodplain Rainforest 44233Subtropical Coastal Floodplain Forest of the <strong>NSW</strong> North Coast bioregion EECCH_DOF06 Lowlands Swamp Paperbark Red Gum Dry Forest 2 0132 01324Development of a Fine-scale Vegetation Map for the <strong>Coffs</strong> <strong>Harbour</strong> Local <strong>Government</strong> Area
Swamp Oak Floodplain Forest of the <strong>NSW</strong> North Coast, Sydney Basin and South East Corner bioregions EECCH_FrW10 Estuarine Swamp Oak Forest 202202Swamp Sclerophyll Forest on Coastal Floodplains of the <strong>NSW</strong> North Coast, Sydney Basin and South East Cornerbioregions EECCH_FrW01 Coastal Paperbark Swamp Oak Floodplain Forest 944CH_FrW02 Coastal Swamp Mahogany Forest 180CH_FrW03 Coastal Paperbark Bottlebrush Channel Forest 80CH_FrW04 Coastal Paperbark Sedgeland Dominated Forest 5291 733Themeda Grassland on Seacliffs and Coastal Headlands in the <strong>NSW</strong> North Coast, Sydney Basin and South East Cornerbioregions EECCH_H03: Kangaroo Grass Headland Grasslands 46CH_H06: Coastal Headland Banksia 4692White Gum Moist Forest in the <strong>NSW</strong> North Coast Bioregion EECCH_WSF13: Dunns White Gum Wet Forest 128TOTAL 11 6573.11 Project management and costsThe mapping program commenced in October 2011 and was completed by May 2012. As a general guide, ittook each interpreter around two months to map each API tile segment, including fieldwork. Additional to this,corrections, adjustments and checking took approximately one additional week per tile. Total costs of the projectwere $400,000, and effectively equated to $3.40 per hectare, including the floristic plots and analysis, or $2.32 perhectare for API mapping work.Before the mapping program commenced, a significant amount of preparation work, trials, research anddevelopment was undertaken to develop the best approach for fine-scale mapping. This added significantlyto the project timeframe but was, however, an invaluable exercise in determining the most appropriate use ofthe current technology available for Class 5 vegetation mapping. This process supported the development of aproposed methodology for Class 5 mapping projects that is the most efficient, practical and cost effective.3.12 Research and developmentOver the course of this project, several new approaches were tested for fine-scale, LGA-wide vegetation mapping.It was found that the use of conventional API techniques within the Stereo Analyst 3D environment with theuse of high resolution ADS40 imagery and LIDAR digital terrain models was the most accurate, efficient and costeffectiveapproach to vegetation mapping at this scale.The use of a computer-generated segmentation to delineate extant vegetation extent proved to be more timeconsuming than the conventional approach through API due to misalignment of the segmentation lines due toshadow or other anomalies with the imagery (smoke, haze or water bodies). This line work required extensiveediting by traditional API methods.Development of a Fine-scale Vegetation Map for the <strong>Coffs</strong> <strong>Harbour</strong> Local <strong>Government</strong> Area 25
Extensive work and research was carried out to determine a suitable image manipulation technique (stretch) tosee if communities, tree species and vegetation patterns in general could be highlighted to allow delineationin a 2D environment or alternatively to allow automated delineation of communities. It was found that themanipulation of the ADS40 imagery, in particular the near infra-red bands, displayed the contrasting vegetationpatterns well and, in some cases, illustrated the mix of species or at times the specific canopy species present inthe landscape. However, the automated delineation of communities was not accurate and the process was nottime-effective. Nonetheless, this research and development opportunity produced an additional highly usefuldata set that was referred to and utilised throughout the project to support traditional API mapping and editing.Future research and development work could be directed towards improving multi-scale segmentation techniquesfor coastal complexes, especially if combined with LiDAR information. For example, coastal heaths communitiescan in some cases be well differentiated using height information and spectral response. Automated segmentationmethods seemed to provide adequate delineation of vegetation communities, but the segmentation parametersonly applied to specific areas. A multi-scale approach would enable broader landscape patterns or context to beconsidered to refine the scale at which segmentation is applied.3.13 ConclusionA fine-scale map was produced for the <strong>Coffs</strong> <strong>Harbour</strong> LGA to support environmental planning purposes at the1:5000 scale. API was found to be the current best practice for fine-scale vegetation mapping for this coastal localgovernment area. This was largely due to the complexity of coastal vegetation communities where significantvegetation changes occur within short distances requiring numerous small polygons to describe the vegetationpatterns.The approach of using conventional API is labour intensive and resulted in relatively high costs per hectarecompared to modelled vegetation map products, but conventional API also results in significantly higher overallaccuracy.The Definiens segmentation, object-orientated approach was found to be useful for land-cover mapping but wasnot found to be useful for vegetation mapping over a large region. Further research is required to enable multiscalesegmentation processes to define community boundaries. This approach is most promising in coastal heathareas in conjunction with the use of LiDAR, as height differences are an important distinguishing feature.It was found that classification and mapping go ‘hand-in-hand’ and mapping does not necessarily followclassification in consecutive steps. The classification process was found to inform the mapping process and themapping process and field checking informed the classification.Intensive field sampling effort was required to achieve the desired mapping scale and accuracy of 77% for thiscoastal LGA. This was largely due to the varied landscapes within the study area the rapid changes in landformand elevation moving from east to west. Heathland and saline wetland types had the highest accuracy (87% and82%), whereas wet sclerophyll forest, rainforests, freshwater and forested wetlands had the lowest accuracy ofbetween 59% and 63%.Image enhancement techniques often provide important supplementary information for the interpreter, but notall differences shown in image stretches amount to floristic changes on the ground. Availability of additionalflora survey site data and ancillary information such as digital terrain models and access to previous vegetationmapping products were all found to be useful in the attribution and delineation of vegetation communities.26Development of a Fine-scale Vegetation Map for the <strong>Coffs</strong> <strong>Harbour</strong> Local <strong>Government</strong> Area
4. ReferencesAustin, MP and Heyligers, PC 1989, ‘Vegetation survey design for conservation: gradsect sampling of forests innorth-eastern New South Wales’, Biological Conservation, 50:13–32.Bale, CL, Charley, JL and White, GJ 1992, Bonville Beach Borefield Proposal: assessment of Vegetation Impacts,Botany Department, University of New England, on behalf of Mitchell McCotter and Associates Pty Ltd,Armidale, <strong>NSW</strong>.Bedward, unpublished software.Belbin, L 1994, PATN Pattern Analysis Package, CSIRO, Canberra.BOM—see Bureau of Meteorology.Bray, JR and Curtis, JT 1957, ‘An ordination of upland forest communities of southern Wisconsin’, EcologicalMonographs, 27:325-349.Briggs, JD and Leigh, JH 1996, Rare or Threatened Australian Plants. CSIRO Australia. Canberra ACT.Bureau of Meteorology 2012, <strong>Coffs</strong> <strong>Harbour</strong> Meteorological Office data, available at: , accessed 18 April 2012.Cameron, MA, Sheringham, PR, Hunter RJ and Smith, M, 2010, Survey and Mapping of the Vegetation of BongilBongil National Park, Department of Environment, Climate Change and Water <strong>NSW</strong>, <strong>Coffs</strong> <strong>Harbour</strong>, <strong>NSW</strong>.CHCC—see <strong>Coffs</strong> <strong>Harbour</strong> <strong>City</strong> <strong>Council</strong>Clancy, GP 1988, ‘Report on Survey of Vegetation and Fauna of Bonville Area’, unpublished report.Clode, D and Burgman, M 1997 Joint Old-growth Forest Project: summary report, <strong>NSW</strong> National Parks and WildlifeService and <strong>NSW</strong> State Forests, Sydney.<strong>Coffs</strong> <strong>Harbour</strong> <strong>City</strong> <strong>Council</strong> 2012, ‘<strong>Coffs</strong> <strong>Harbour</strong> Biodiversity Action Strategy 2012–2030’, CHCC.Dale, M 1995, ‘Evaluating classification strategies’, Journal of Vegetation Science, 6:437–440.DECCW—see Department of Environment, Climate Change and Water.Department of Environment, Climate Change and Water 2009, ‘Native Vegetation Type Mapping Strategy 2009–2013’, unpublished report, DECC, Sydney.Definiens 2007a, Developer 7 User Guide, Definiens AG, Munich, Germany.Definiens 2007b, Developer 7 Reference Book, Definiens AG, Munich, Germany.Eco Logical Australia 2005, ‘A Vegetation Map for the Northern Rivers Catchment Management Authority toSupport Application of the Biodiversity Forecasting Toolkit’, report prepared for the Northern RiversCatchment Management Authority, Eco Logical Australia, Sutherland, <strong>NSW</strong>.Elks, G 2006, ‘Site survey for a fire response and review of environmental factors’, unpublished report.Ellis, M, Bedward, M and Gleeson, P 2009, Yet Another Vegetation Survey Database, Version 3.2, <strong>NSW</strong> DepartmentDevelopment of a Fine-scale Vegetation Map for the <strong>Coffs</strong> <strong>Harbour</strong> Local <strong>Government</strong> Area 27
of Environment, Climate Change & Water, Sydney, accessed 18 November 2010 at .Fisher, M, Body, M and Gill, J 1996, ‘The Vegetation of the <strong>Coffs</strong> <strong>Harbour</strong> <strong>City</strong> <strong>Council</strong> LGA’, unpublished report to<strong>Coffs</strong> <strong>Harbour</strong> <strong>City</strong> <strong>Council</strong>.Floyd, AG 1990, Australian Rainforests in New South Wales, vols 1 & 2, Surrey Beatty and Sons, Chipping Norton,Sydney.Forestry Commission of <strong>NSW</strong> 1989, Forest Types in New South Wales, Research Note 17, Forestry Commission ofNew South Wales, Pennant Hills, Sydney.Gilmour, P, Helman, C 1991, ‘Clarence Valley Rainforest Remnants Rescue’, unpublished report to ClarenceEnvironment Centre, Grafton.Gopal, S and Woodcock, C 1994, Theory and methods for accuracy assessment of thematic maps using fuzzysets. Photogrammetric Engineering and Remote Sensing, 60(2):181-188.Griffith, SJ and Wilson, R 2007, ‘Coastal vegetation mapping project: table of communities & codes’, workingcopy of unpublished report.Griffith, SJ 2002, ‘Pattern and process in the wallum of north-eastern New South Wales’, thesis submitted for theDegree of Doctor of Philosophy of the University of New England, Armidale.Griffith, SJ 1984, ‘A survey of the vegetation of Yuraygir National Park’, report prepared for the National Parks andWildlife Service.Kendall, P 2005, ‘Environmental mapping from air photo interpretation for Corindi, Red Rock – extension to<strong>Coffs</strong> <strong>Harbour</strong> Local <strong>Government</strong> Area’, report prepared for <strong>Coffs</strong> <strong>Harbour</strong> <strong>City</strong> <strong>Council</strong>, Kendall andKendall Pty Ltd.Manion, G and Ridges, M 2009, ‘An optimisation of the survey gap analysis technique to minimisecomputational complexity and memory resources in order to accommodate fine grain environmental andsite data’, paper presented to the 18 th World IMACS/MODSIM Congress, Cairns, Australia, 13–17 July 2009,accessed at: .Milford, HB 1999, ‘Soil Landscapes of the <strong>Coffs</strong> <strong>Harbour</strong> 1:100,000 Sheet Report’, Department of Land and WaterConservation, Sydney.National Parks and Wildlife Service <strong>NSW</strong> 1994, ‘Flora of north-east <strong>NSW</strong> forests’, North East Forests BiodiversityStudy Report No.4.National Parks and Wildlife Service <strong>NSW</strong> 1999 ‘Forest ecosystem classification and mapping for the Upper andLower NortheEast CRA regions’, CRA unit, Northern Zone, <strong>NSW</strong> National Parks and Wildlife Service. <strong>Coffs</strong>harbour.Natural Resources Audit <strong>Council</strong> 1995, Vegetation Survey and Mapping of Upper North East New South Wales,a report by the New South Wales National Parks and Wildlife Service for the Natural Resources Audit<strong>Council</strong>, NPWS, Hurstville, Sydney.Natural Resources Audit <strong>Council</strong> 1996, Regional Report of Upper North East of Upper North East New South Wales:Physical attributes, vol. 2, chap. 1, Resource and Conservation Assessment <strong>Council</strong>, Sydney.28Development of a Fine-scale Vegetation Map for the <strong>Coffs</strong> <strong>Harbour</strong> Local <strong>Government</strong> Area
NPWS—see National Parks and Wildlife Service <strong>NSW</strong>.NRAC—see Natural Resources Audit <strong>Council</strong>.Ollier, CD, 1982, The Great Escarpment of eastern Australia: tectonic and geomorphic significance, Journal of theGeological Society of Australia, 29, 13-23.Paine, DP and Kiser, JD 2012, Aerial Photography and Image Interpretation, John Wiley and Sons.Roff, A 2009, ‘Floristics, fuel load and condition: object-based, hyperspectral remote sensing of nativevegetation’, PhD thesis, University of <strong>NSW</strong>, Sydney, Australia.Smith, AP, Andrews, S and Floyd A 1990, ‘Flora and fauna of the Orara and Bucca valleys’, a report to the <strong>Coffs</strong><strong>Harbour</strong> <strong>City</strong> <strong>Council</strong>, Austeco Pty Ltd.Stehman, SV, Arora MK, Kasetkasem, T and Varshney, PK 2007, Estimation of fuzzy error matrix accuracymeasures under stratified random sampling. Photogrammetric Engineering and Remote Sensing, 73(2):165-173.Stehman, SV and Czaplewski, RL 1998, Design and analysis for thematic map accuracy assessment: fundamentalprinciples, Remote Sensing of the Environment, 64:331-344.Schowengerdt, RA 1997, Remote Sensing: Models and Methods for Image Processing, Academic Press, San Diego,California.Taunton, G 2010, ‘ADS40 forward program’, Local <strong>Government</strong> Forward Program, Land and PropertyManagement Authority, Local <strong>Government</strong> Spatial Seminar 15–16 March 2010.Thackway, R and Cresswell, ID (eds) 1995, An Interim Biogeographic Regionalisation for Australia: A Frameworkfor Setting Priorities in the National Reserves System Cooperative Program, version 6.0, Australian NatureConservation Agency, Reserve Systems Unit, Canberra, accessed at: .Tweedie, TD, Bruskin, S, Chapman, WS and Heyward, RW 1995, Flora Survey, Urunga and <strong>Coffs</strong> <strong>Harbour</strong>Management Areas, State Forests of New South Wales, Northern Region, Sydney <strong>NSW</strong>.Development of a Fine-scale Vegetation Map for the <strong>Coffs</strong> <strong>Harbour</strong> Local <strong>Government</strong> Area 29
Appendix 1 <strong>Coffs</strong> <strong>Harbour</strong> Biodiversity StrategyFigure A5.1 from <strong>Coffs</strong> <strong>Harbour</strong> Biodiversity Action Strategy (2012)Regional Strategies· Northern Rivers CatchmentAction Plan· Draft Mid North Coast RegionalConservation Plan· Northern Rivers RegionalBiodiversity Management Plan· Mid North Coast RegionalStrategyBushfire Mapping<strong>Coffs</strong> <strong>Harbour</strong> 2030 Plan<strong>Coffs</strong> <strong>Harbour</strong> BiodiversityAction Strategy<strong>Coffs</strong> <strong>Harbour</strong> Class 5Vegetation MappingWE AREHEREStrategic Direction(2012)Scientific(2013)Koala Habitat· Requires bothvegetationmapping andpopulation datato derive ‘coreKoala habitat’PlantCommunities· EndangeredEcologicalCommunities· Over-cleared· Wetlands· Estuaries· Riparian buffers· SEPP 14&26Old GrowthForest· Refine oldgrowth andcandidate oldgrowth mappingfrom OEH spatiallayersThreatenedand SignificantFauna Habitat· Endangeredpopulations· Critical habitat(TSC Act)LandscapeConnectionsHigh Valued Habitats (HVH)Corridors FootprintBiodiversity AssetsEcological SignificancePriority Habitats & CorridorsStrategy (PHACS)Strategy(2013)Koala Plan ofManagementPreservation ofVegetation ClauseLEP 2012Planning Proposal Under Draft<strong>Coffs</strong> <strong>Harbour</strong> LEP (2012)Biodiversity GuidelinesDraft DevelopmentControl PlanOperations(2013)LEGEND:Spatial layer only (SDE)(with explanatory notes)Requires 28 days exhibition and<strong>Council</strong> resolution to proceed30Development of a Fine-scale Vegetation Map for the <strong>Coffs</strong> <strong>Harbour</strong> Local <strong>Government</strong> Area
Appendix 2 Previous vegetation mapping and flora surveys inthe study area.See the Reference section for full publication details.Author/CitationDescription/MethodAerial photograph interpretationForestry Commission of <strong>NSW</strong> (1989)Kendall (2005)Griffith & Wilson (2007)Research Note 17 Forest Type mapping. Complete for the following stateforests: Orara East, Conglomerate, Wedding Bells, Lower Bucca, Boambee,Orara West, Pine Creek, Nana Creek and Bagawa.Method: Traditional API methods. Stereoscopic API transposed to hard copymaps then subsequently digitised.Vegetation mapping of the Corindi and Red Rock extension to the <strong>Coffs</strong><strong>Harbour</strong> LGA. Mapped to classification used by Fisher et al. (1996).Method: Traditional stereoscopic API scanned, ortho-rectified and vectorised.API mapping of coastal reserves and Crown land on the north coast of <strong>NSW</strong>.Systematic survey and/or mappingGriffith (1984)Austin & Heyligers (1989)Gilmour & Helman (1991)NPWS (1994)NRAC (1995)Tweedie et al. (1995)Fisher et al. (1996)Clode & Burgman (1997)NPWS (1999)Griffith (2002)Cameron et al. (2010)Office of Environment and Heritage(in prep.)Systematic survey and mapping of the vegetation of Yuraygir National ParkA presence–absence gradsect survey of overstorey species undertaken toobtain a representative sample of the floristic variation in a forested area ofabout 20,000 square kilometres.Rainforest survey of remnant vegetation in the Clarence Valley.Systematic flora survey of north-east <strong>NSW</strong> as part of the <strong>NSW</strong> North East ForestBiodiversity Study.Systematic flora survey and multi-attribute mapping of north-east <strong>NSW</strong>.Floristic surveys done for a regional biodiversity audit in 1995.Systematic survey and analysis of vegetation in the <strong>Coffs</strong> <strong>Harbour</strong> – UrungaState Forest Management Area.Systematic survey and mapping of vegetation in the <strong>Coffs</strong> <strong>Harbour</strong> LGA.Systematic survey sites to characterise old-growth forest, as part of the NaturalResource Audit <strong>Council</strong>’s Joint Old -growth project.Systematic flora survey for north-east <strong>NSW</strong> supporting the Regional ForestAgreement process.Systematic survey and mapping of the wallum heath of north-east <strong>NSW</strong>.Systematic survey and mapping of the vegetation of Bongil Bongil NationalPark.Systematic gap-filling surveys for the North Coast Vegetation Classificationproject.Non-systematic survey and mappingWilliams (1958 to 1993)Clancy (1988)Rainforest species lists.Method: Random meanders.Recorded 280 plant taxa in a study area encompassing Bonville Beach.Development of a Fine-scale Vegetation Map for the <strong>Coffs</strong> <strong>Harbour</strong> Local <strong>Government</strong> Area 31
Author/CitationFloyd (1990)Smith et al. (1990)Bale et al. (1992)Elks (2006)Lunney (in prep.)Description/MethodSurveys of littoral rainforest at Bundagen Flora Reserve and Scrub Creek.Method: Random traverse.Flora and fauna survey of the Orara and Bucca valleys.Survey of the vegetation of the Bonville Beach Sand mass. A list of plant taxawas compiled and 19 vegetation communities were described.Site survey for a fire-response study and review of environmental factors thatincluded a vegetation assessment.Survey sites for Koala habitat assessment.Methods: canopy only survey.32Development of a Fine-scale Vegetation Map for the <strong>Coffs</strong> <strong>Harbour</strong> Local <strong>Government</strong> Area
Appendix 3 Mapping SpecificationsPolygon size and dimensions Coding of Exotic and disturbance featuresCoastal lowland, alluvial plains, sands and estuaries Exotic dominated (>50% of polygon) featuresReference scale for review of linework 1:4,000Exotic vegetation. Includes exotic dominated urban and rural residentialvegetation which has been delineated as native vegetation in the land-coverlayer. xFlor_groupfieldMinimum remnant size for floristic group attribution 0.2 ha Environmental weeds See belowMinimum size for delineation of community within largerpatch in coastal lowland ladscape 0.2 ha Native plantations PnMinimum width for linear feature in coastal lowlandlandscape 5m Pine / softwood planations PpCoastal foothills, escarpment and plateau forests andwoodlandsReference scale for review of linework 1:6,000Environmental plantings (revegetation areas, windbreaks, raodside plantings etc. PeNative vegetation with significant occurrence (30-50%) of environmental weedsor significant disturbance defined as either:a) Loss or >50% disturbance to canopy; orb) Removal of >50% of understorey/ground coverCommentsfieldMinimum remnant size for floristic group attribution 0.2 ha General disturbance DMinimum size for delineation of community within largerpatch in forest landscape 0.5 ha Environmental weeds See belowMinimum width for linear feature in forest landscape 10mSignificance disturbance where interpretation of vegetation community is nolonger possible (significant alteration of structure and species composition RtEnvironmental weeds or native pioneersDual coding of floristic communities Camphor laurel ClPolygons can be coded with dual floristic communities where they occuras a mosaic . Code should be denoted FGA/FGB. E.g. 17/16 where 17is the most likely or dominant group. At least 30% of each communityAcacia spp. Native pioneers (Not including FG 53 - Coast Wattle Shrublands).E.g. A. irrorata or A. melanoxylon. Acshould be present for a dual community code attribution. Bitou bush BbPrivet PrPolygon confidence Lantana LnGround validation of polygon 1 Groundsel GsHigh level of confidence (adjacent polygons within surveydata or distinct photo pattern) 2Pine species PpModerate level of confidence (survey data in near vicinity) 3 Horse-tail She-oak HsLow level of confidence (lack of nearby survey data orindistinct photo pattern) 4Development of a Fine-scale Vegetation Map for the <strong>Coffs</strong> <strong>Harbour</strong> Local <strong>Government</strong> Area 33
API flow chart for polygon attributionDelineated as native vegetation inLand-cover layer?Code with non-native or land-use attribute in‘flor_group’ fieldX Exotic generalYesPn Native plantationPp Pine plantationPe Environmental plantingCl Camphor laurelAc Acacia pioneersBb Bitou bushPr PrivetLn LantanaGs GroundselNoValidated as nativeVegetation by API?Yes Polygon boundaryYesrequires edit?NoModifypolygonboundarySmall urban orsemi-rural remnant?NoVegetation structureintact?YesYesYesSignificantdisturbance?Attribute with vegetationcommunity code in‘flor_group’ field.Attribute with disturbance code in‘comments’ fieldD – General disturbanceCl - Camphor laurelAc - Acacia pioneersBb - Bitou bushPr - PrivetLn - LantanaNoNoCode as ‘Remnant nativetrees’ (Rt) in ‘flor_group’field. Use for highlydisturbed native vegetation.Attribute with• Reliability code (1-4) (‘reliab’ field) and• Comments (‘comments’ field if appropriate)• Overstorey dominance (if required)34Development of a Fine-scale Vegetation Map for the <strong>Coffs</strong> <strong>Harbour</strong> Local <strong>Government</strong> Area
Appendix 4 Metadata Statement<strong>Coffs</strong> <strong>Harbour</strong> Vegetation MapDATASET <strong>Coffs</strong> <strong>Harbour</strong> <strong>City</strong> <strong>Council</strong> Floristic Vegetation Map - 2012CUSTODIANJURISDICTIONDESCRIPTION<strong>Coffs</strong> <strong>Harbour</strong> <strong>City</strong> <strong>Council</strong>New South WalesAbstractThis layer is a fine-scale floristic vegetation map of the <strong>Coffs</strong> <strong>Harbour</strong> Local <strong>Government</strong> Area. There are 92 mapcategories in total with almost all of these being the result of statistical analysis and field-based full floristicdata sites. Mapping was conducted by vegetation mapping experts in a digital three-dimensional (3D) Planarenvironment. Additionally, basic disturbance information was captured along with a selection of prominentweeds where discernible by interpreters.Geographic Extent NameGEN Category: Local <strong>Government</strong> Areas (LGA)GEN Custodial Jurisdiction: New South WalesGEN Name:<strong>Coffs</strong> <strong>Harbour</strong> Local <strong>Government</strong> AreaGeographic Extent PolygonGeographic Bounding BoxMin E: 480360.3Max E: 525096.1Max Y: 6692556.6Min Y: 6631522.8DATA CURRENCYBeginning Date 2009-09-01Ending Date 2012-04-07DATASET STATUSProgress:CompleteMaintenance and Update Frequency:As requiredACCESSStored Data Format: ESRI ArcSDEAvailable Format Type: DIGITAL - ESRI Geo-database/shapefileAccess Constraint: Contact the GIS Team Leader to discuss access and costsDATA QUALITYLineage: Source data for this layer has two components, the floristic field-based site data and the otherbeing high resolution aerial photography.Development of a Fine-scale Vegetation Map for the <strong>Coffs</strong> <strong>Harbour</strong> Local <strong>Government</strong> Area 35
SITE DATAAn initial site data audit from the <strong>NSW</strong> VIS Flora Survey database was conducted to determine the full floristic (FF)sites of sufficient quality available for PATN statistical analysis. Statistical gap analysis and stratification identifiedremaining ecological gaps and a further 180 FF sites (funded by <strong>Coffs</strong> <strong>Council</strong>) were funded to target these gaps.A subsequent further review of sites determined a total of 534 FF sites for PATN analysis. PATN analysis produced66 vegetation communities with floristic descriptions ready for mapping.In addition, a further 462 rapid data sites were funded by <strong>Coffs</strong> <strong>Council</strong> to inform the mapping. The rapid sitescollected up to 5 dominant species for 6 levels of vertical strata at each site. An enormous achievement of thisproject was site density is almost equal across both vegetated freehold and public tenures, a normally unavoidablebias that plagues most multi tenure mapping programs.AREIAL PHOTOGRAPHYThe <strong>NSW</strong> Land and Property Management Authority (LPMA) captures airborne ADS40 4-band digital imageryat 50 cm resolution for most of <strong>NSW</strong>. The <strong>Coffs</strong> <strong>Harbour</strong> (Sep 09), Dorrigo (Sep 09) and Bare Pt (June 10) 1:100kADS40 tiles covered the <strong>Coffs</strong> LGA. Two levels of imagery were utilised for the project, the 4-band 2-dimensionalorthorectified images and the Level 1 Rectified stereo image pair strips. The Level 1 data was used for 3-dimensional(3D) mapping in a GIS stereo environment. Significant spatial errors up to +- 30 metres between Level 1 and theorthorectified data were discovered.MAPPING PROCESSMapping was conducted by API/botanical experts in a stereo view workstation comprising of Planar stereo/3Dmonitors, ESRI ArcMap software and ERDAS Stereo Analyst software. The environment allows the directdelineation and attribution of polygons in 3D stereo view (Level 1 imagery) whilst simultaneously having a 2Dcontext view and any number of additional datasets to guide mapping decisions. Interpreters had at their disposalall site data (733 sites) in 3D. Interpreters routinely collected field check points with geographic positioningsystems to help extrapolate across areas of difficult interpretability. A total of 2479 check points were collectedfor the project but points were constrained to publicly accessible areas and areas that were visually accessiblefrom public roads or tracks. This fieldwork resulted in an additional 14 map units being added to the existing 66classified communities. The mapping was conducted on-screen at a range of scales but the final reference scaleis deemed to be 1:5000. Linework was digitised using live streaming with a stream tolerance average of 5 metres(i.e. a vertex every 5 metres).The study area was divided into 10 tiles for stereo mapping and the interpreters cross-referenced each otherwhenever possible to help guide their mapping decisions. The tiles were stitched together in GIS and interpretersthen reviewed the edges and re-mapped any inconsistencies. A final quality review of the stitched map wasconducted by examining each community in isolation and reviewing it for errors and ecological distributionanomalies. This review process fed back in further refinements. Vegetation clearing from the Sapphire-to-Woolgoolga highway upgrade was applied to the map. A Worldview2 image captured 7 April 2012 with 43 cmspatial resolution was the baseline for delineating the highway clearing footprint.Due to the spatial accuracy issue between the Level 1 and orthorectified products, a final linework adjustmentprocess for the study area was conducted using the orthorectified products as the accuracy reference. The focusof linework refinement was on vegetated/clearing interfaces, urban remnants, water bodies and other highcontrast edges. Linework accuracy within contiguous vegetated areas were not systematically reviewed. All datastored and edited within ESRI File Geo-database format.36Development of a Fine-scale Vegetation Map for the <strong>Coffs</strong> <strong>Harbour</strong> Local <strong>Government</strong> Area
Positional Accuracy:Accuracy is determined by the spatial accuracies of both the Level 1 and 2-dimensional orthorectified ADS40imagery supplied by <strong>NSW</strong> LPMA. Orthorectified imagery is +- 2metres and Level 1 accuracy is not known.Attribute Accuracy:In this study, a numerical PATN analysis (Belbin 1994) was undertaken using 534 full floristic sites to determinethe main floristic clusters for the study area. A 100-group analysis was undertaken. An agglomerative hierarchicalapproach was applied using the Bray-Curtis (Bray & Curtis1957) association measure to produce a dendrogram.In the agglomerative method, clustering is ‘bottom-up’ with the most similar sites being aggregated into largerclusters until there is a single cluster containing all sites. The dissimilarity between clusters was calculated usingaverage values (or unweighted pair group method with arithmetic mean — UPGMA), where two clusters withthe lowest average distance (with a beta value setting of -0.1) are merged to form the new cluster. To supportthe interpretation of the results a nearest neighbour analysis and fidelity was also carried out. 66 communitiesresulted with a further 14 map units added that resulted from findings in fieldwork. There are an additional 12units that relate to disturbance and non-vegetated characteristics which produced 92 map categories in all.Interpreters would use all available supporting data to attribute each polygon to one of the categories and ifuncertain or a mosaic of categories existed then a dual category would be assigned. Many factors affect theinterpreters reliability to assign a category to a polygon (i.e. disturbance factors, clearing, regrowth, accessibilityetc). For every polygon though, the interpreter was required to assign a reliability score from 1 to 4. The scoringis as follows: 1=Field survey confirmation; 2=high confidence; 3=moderate confidence; and 4=Low confidence.In reality, some areas are disturbed to the point where none of the 92 categories reflect entirely what is presenton the ground. Interpretation is then performed such that an expert needs to predict what occurred prior todisturbance in order to allocate to a category. This interpretation can occur within the 3D mapping environmentor in situ and should be reflected within the interpreters reliability score.Logical Consistency:Geodatabase XY tolerance set at 0.2 metres and the resolution set at 0.1 metres. Topology validation wasperformed with a tolerance of 0.2 metres and all subsequent gaps and overlapping polygons fixed. Topology iscorrect.Completeness:Vegetation for the entire <strong>Coffs</strong> <strong>Harbour</strong> Local <strong>Government</strong> area has been mapped and every polygon attributed.Non-natural areas devoid of vegetation have not been mapped.METADATA INFOMetadata Date: 24/5/12Development of a Fine-scale Vegetation Map for the <strong>Coffs</strong> <strong>Harbour</strong> Local <strong>Government</strong> Area 37
Appendix 5 Final vegetation community list for the <strong>Coffs</strong><strong>Harbour</strong> LGA vegetation map.Map code and name of floristic communityCH_DOF01 Coast and Escarpment Blackbutt Dry Forest 6 809CH_DOF02 Sandstone Bloodwood - Needlebark Stringybark Heathy Forest 3 382CH_DOF04 Hinterland Needlebark Stringybark - Scribbly Gum - Red Mahogany Dry Forest 163CH_DOF05 Foothills Grey Gum - Ironbark - Mahogany Dry Forest 1 998CH_DOF06 Lowlands Swamp Box - Paperbark - Red Gum Dry Forest 2 013CH_DOF07 Escarpment New England Blackbutt Dry Forest 37CH_DOF08 Coastal Sand Bloodwood - Banksia Forest 154CH_DOF09 Coast Sand Blackbutt - Bloodwood - Apple Forest 334CH_DOF10 Foothills Spotted Gum Mahogany Grey Gum Ironbark Dry Forest 2 248CH_DOF11 Northern Escarpment Mahogany Grassy Dry Forest 60CH_FrW01 Coastal Paperbark Swamp Oak Floodplain Forest 944CH_FrW02 Coastal Swamp Mahogany Forest 180CH_FrW03 Coastal Paperbark Bottlebrush Channel Forest 80CH_FrW04 Coastal Paperbark Sedgeland Dominated Forest 529CH_FrW05 Coastal Paperbark Swamp Box Littoral Forest 158CH_FrW06 Coastal Wallum Swamp Mahogany Paperbark Satinwood Forest 131CH_FrW07 River Oak Riparian Forest of the Orara River Valley 189CH_FrW08 Plateau Tea-tree Water Gum Riparian Shrubland 387CH_FrW09 Coastal Wallum Swamp Mahogany Sieber's Paperbark Forest 124CH_FrW10 Swamp Oak Forested Wetland 202CH_FrW11 Estuarine Paperbark Twig-rush Forest 87CH_FW01 Coastal Wallum Teatree Banksia Wet Heathland Shrubland 125CH_FW02 Coastal Wallum Paperbark Banksia Grass Tree Wet Heathland 290CH_FW03 Coastal Wallum Slender Twine Rush Sedgeland 33CH_FW04 Coastal Wallum Baumea Sedgeland 5CH_FW05 Coastal Wallum Paperbark Wet Shrubland 145CH_FW06 Coastal Wallum Teatree Tall Wet Shrubland 39CH_FW07 Coastal Jointed Twig-rush Freshwater Wetland 27CH_FW08 Coastal Freshwater Wetland 189CH_FW09 Coastal Wallum Fernland 24CH_G01 Strandline Grassland 30CH_G02 Maritime Grasslands - Offshore Islands 8CH_H01 Coast Banksia Shrubland on Holocene Dunes 404CH_H02 Coast Wattle Shrublands 273CH_H03 Kangaroo Grass Headland Grasslands 46Area(ha)38Development of a Fine-scale Vegetation Map for the <strong>Coffs</strong> <strong>Harbour</strong> Local <strong>Government</strong> Area
Map code and name of floristic communityCH_H04 Coastal She-oak Hakea Clay Heathland 62CH_H05 Coastal Dagger Hakea Clay Heathland 34CH_H06 Coastal Headland Banksia 46CH_H07 Coastal Headland Swamp Oak Shrublands 12CH_H08 Wallum Banksia Black She-oak Shrubland 113CH_H09 Plateau Teatree Rock Outcrop Shrubland 16CH_H10 Escarpment Tea-tree Rock Outcrop Shrubland 16CH_H11 Tall Tea Tree Crabapple Montane Closed Forest 6CH_RF01 Plateau Beech Cool Temperate Rainforest 1CH_RF02 Plateau Beech - Coachwood Cool Temperate Rainforest -CH_RF03 Plateau and Escarpment Coachwood Sassafras Warm Temperate Rainforest 3 952CH_RF04 Plateau and Escarpment Hoop Pine Dry Rainforest 54CH_RF05 Foothills Brown Myrtle Dry Rainforest 340CH_RF06 Escarpment Grey Mytle Brush Box Dry Rainforest 76CH_RF07 Coastal Exposed Dune Littoral Rainforest 95CH_RF08 Headland Brush Box Littoral Rainforest 42CH_RF09 Hinterland White Booyong Floodplain Rainforest 44CH_RF11 Escarpment and Lowland Bangalow - Carabeen - Black Booyong Palm Gully Rainforest 4 280CH_RF12 Escarpment Coachwood - Sassafras - Brush Box Warm Temperate Rainforest 1 679CH_RF13 Coastal Sheltered Dune Littoral Rainforest 87CH_SW01 Estuarine Mangrove Forest 146CH_SW02 Estuarine Twig Rush Saltmarsh 47CH_SW03 Coastal Dune Sedgeland Soak 11CH_SW04 Coastal Dune Prickly Couch Grasslands 0.4CH_SW05 Twig Rush Headland Sedgeland Soaks 4CH_SW06 Sea Rush Saltmarsh 38CH_SW07 Estuarine Samphire - Saltwater Couch Saltmarsh 114CH_WSF01 Coast and Hinterland Riparian Flooded Gum Bangalow Wet Forest 4 748CH_WSF02 Hinterland Blackbutt - Bangalow - Turpentine Wet Shrubby Tall Forest 3 902CH_WSF03 Foothills and Escarpment Blue Gum Tallowwood - Turpentine Wet Shrubby Forest 3 525CH_WSF05 Foothills to Escarpment Brush Box - Tallowwood - Blackbutt Wet Forest 4 774CH_WSF06 Plateau Blue Gum - Tallowwood - Flooded Gum Wet Shrubby Forest 3 956CH_WSF07 Plateau and Escarpment Rim Brush Box - Blackbutt Wet Forest 2 158CH_WSF08 Southern Foothills Blackbutt - Turpentine - Tallowwood Wet Ferny Forest 1 292CH_WSF09 Northern Escarpment Blackbutt - Apple Wet Ferny Forest 7 716CH_WSF10 Hinterland and Escarpment Tallowwood - Blackbutt - Blue Gum Wet Ferny Forest 5 035CH_WSF11 Foothills Spotted Gum - Mahogany - Grey Gum Wet Shrubby Forest 2 631CH_WSF12 Brush Box Corkwood Forest on Sand 10CH_WSF13 Dunns White Gum Wet Forest 128CH_WSF14 Coastal Headland Red Gum Forest 39Area(ha)Development of a Fine-scale Vegetation Map for the <strong>Coffs</strong> <strong>Harbour</strong> Local <strong>Government</strong> Area 39
Map code and name of floristic communityCH_WSF15 Foothills Steel Box Brown Myrtle Wet Forest 557CH_WSF16 Escarpment White Mahogany Wet Shrubby Forest 161CH_WSF17 Foothills Turpentine - Grey Gum - Ironbark Moist Shrubby Forest 3 053CH_WSF18 Escarpment New England Blackbutt Wet Ferny Forest 635CH_EX01 Bitou bush 2CH_EX02 Camphor laurel 633CH_EX03 Exotic vegetation 2 576CH_EX04 Lantana 62CH_EX05 Privet 13CH_MV01 Seagrass beds 3CH_NP01 Acacia pioneers 209CH_NRV01 Native remnant vegetation 1 456CH_P01 Plantation - native species 5 938CH_P02 Plantation - exotic/pine species 357CH_P03 Environmental plantings 206Area(ha)40Development of a Fine-scale Vegetation Map for the <strong>Coffs</strong> <strong>Harbour</strong> Local <strong>Government</strong> Area
Appendix 6 EcoLogical: Map Accuracy AssessmentMulti-agency Vegetation Mapping Program for <strong>Coffs</strong> <strong>Harbour</strong> Local<strong>Government</strong> AreaMap Accuracy AssessmentFinal report prepared for<strong>Coffs</strong> <strong>Harbour</strong> <strong>City</strong> <strong>Council</strong>8 h November 2012Development of a Fine-scale Vegetation Map for the <strong>Coffs</strong> <strong>Harbour</strong> Local <strong>Government</strong> Area 41
Multi-agency Vegetation Mapping Program for <strong>Coffs</strong> <strong>Harbour</strong> LGA – Map Accuracy AssessmentDOCUMENT TRACKINGITEMProject NameProject NumberFile locationDETAILMulti-agency Vegetation Mapping Program for <strong>Coffs</strong> <strong>Harbour</strong> Local <strong>Government</strong> Area– Map Accuracy Assessment11COFGIS-0008H:/synery/projects/11COFGIS/0008-<strong>Coffs</strong> <strong>Harbour</strong> Veg Map Accuracy AssessmentProject ManagerJulian WallPrepared by Julian WallStatusFINALVersion Number 1Last saved on 26 November 2012This report should be cited as ‘Eco Logical Australia 2012. Multi-agency Vegetation Mapping Programfor <strong>Coffs</strong> <strong>Harbour</strong> Local <strong>Government</strong> Area. Prepared for <strong>Coffs</strong> <strong>Harbour</strong> <strong>City</strong> <strong>Council</strong>.’ACKNOWLEDGEMENTSThis document has been prepared by Eco Logical Australia Pty Ltd with support from Ernst Kemmererand Mark Cameron of the <strong>NSW</strong> Office of Environment and Heritage, and Nigel Cotsell of <strong>Coffs</strong> <strong>Harbour</strong><strong>City</strong> <strong>Council</strong>.DisclaimerThis document may only be used for the purpose for which it was commissioned and in accordance with the contract betweenEco Logical Australia Pty Ltd and <strong>Coffs</strong> <strong>Harbour</strong> <strong>City</strong> <strong>Council</strong>. The scope of services was defined in consultation with <strong>Coffs</strong><strong>Harbour</strong> <strong>City</strong> <strong>Council</strong> by time and budgetary constraints imposed by the client, and the availability of reports and other data onthe subject area. Changes to available information, legislation and schedules are made on an ongoing basis and readers shouldobtain up to date information.Eco Logical Australia Pty Ltd accepts no liability or responsibility whatsoever for or in respect of any use of or reliance upon thisreport and its supporting material by any third party. Information provided is not intended to be a substitute for site specificassessment or legal advice in relation to any matter. Unauthorised use of this report in any form is prohibited.© ECO LOGICAL AUSTRALIA PTY LTDi42Development of a Fine-scale Vegetation Map for the <strong>Coffs</strong> <strong>Harbour</strong> Local <strong>Government</strong> Area
Multi-agency Vegetation Mapping Program for <strong>Coffs</strong> <strong>Harbour</strong> LGA – Map Accuracy AssessmentContents1 Introduction................................................................................................................................. 12 Study Area................................................................................................................................... 13 Vegetation classification ........................................................................................................... 34 Methods....................................................................................................................................... 74.1 Background......................................................................................................................74.2 Sample design ................................................................................................................. 74.3 Response design ............................................................................................................. 84.3.1 Field assessment ............................................................................................. 84.3.2 Degree of Correctness ..................................................................................... 94.4 Analysis and estimation................................................................................................... 94.4.1 Background ...................................................................................................... 94.4.2 Data Preparation .............................................................................................. 94.4.3 Data Analysis ................................................................................................... 95 Results....................................................................................................................................... 115.1 Response design ........................................................................................................... 115.1.1 Field assessment ........................................................................................... 115.1.2 Degree of Correctness ................................................................................... 115.1.3 Data analysis.................................................................................................. 135.1.4 Confusion matrix ............................................................................................ 166 Discussion................................................................................................................................. 197 Recommendations ................................................................................................................... 21References ............................................................................................................................................. 22Appendix A............................................................................................................................................. 23Appendix B............................................................................................................................................. 24© ECO LOGICAL AUSTRALIA PTY LTDiiDevelopment of a Fine-scale Vegetation Map for the <strong>Coffs</strong> <strong>Harbour</strong> Local <strong>Government</strong> Area 43
Multi-agency Vegetation Mapping Program for <strong>Coffs</strong> <strong>Harbour</strong> LGA – Map Accuracy AssessmentList of FiguresFigure 1 Study region – <strong>Coffs</strong> LGA ............................................................................................................2Figure 2 Survey locations across the <strong>Coffs</strong> LGA .....................................................................................12Figure 3. Summary of vegetation classification correctness....................................................................13List of TablesTable 1. Vegetation types mapped in <strong>Coffs</strong> LGA.......................................................................................3Table 2. Number of plots by structural formation (as mapped by OEH) and land tenure........................11Table 3. Magnitude of error table .............................................................................................................14Table 4. Comparison of “Max” and “Right” scores with user accuracy from the confusion matrix...........16AbbreviationsABBREVIATIONDESCRIPTIONAPICHCCGPSLGA<strong>NSW</strong>OEHPCTVCAAerial Photographic Interpretation<strong>Coffs</strong> <strong>Harbour</strong> <strong>City</strong> <strong>Council</strong>Global Positioning SystemLocal <strong>Government</strong> AreaNew South WalesOffice of Environment and HeritagePlant Community Type (vegetation type listed in the <strong>NSW</strong> VCA)Vegetation Classification and Assessment database (a module within the <strong>NSW</strong> VegetationInformation System© ECO LOGICAL AUSTRALIA PTY LTDiii44Development of a Fine-scale Vegetation Map for the <strong>Coffs</strong> <strong>Harbour</strong> Local <strong>Government</strong> Area
Multi-agency Vegetation Mapping Program for <strong>Coffs</strong> <strong>Harbour</strong> LGA – Map Accuracy Assessment1 IntroductionThe <strong>NSW</strong> Office of Environment and Heritage (OEH) recently completed fine-resolution vegetationmapping within the <strong>Coffs</strong> <strong>Harbour</strong> Local <strong>Government</strong> Area (LGA). This new mapping aims to capturethe distribution of vegetation types within the <strong>Coffs</strong> <strong>Harbour</strong> LGA using the <strong>NSW</strong> Native VegetationInterim Type Standard (Sivertsen 2009). The methodology involves manual (non-automated) on-screencapture of vegetation patterns using aerial photographic interpretation (API), a task performed byexperienced photogrammetry officers. The process is supported by 3-dimensional display of ADS-40ortho-photographic imagery on an ArcGIS platform.This project aims to assess the accuracy of the new vegetation map across the <strong>Coffs</strong> <strong>Harbour</strong> LGAusing an approach that adheres to the <strong>NSW</strong> Vegetation Type Standard (Sivertsen 2009). Broadly, theaccuracy assessment involves comparison of mapped vegetation types with classified referencelocalities obtained through field assessment. The extent to which mapped polygons and field pointscorrespond is a function of the map accuracy.2 Study AreaThe study area covers the <strong>Coffs</strong> <strong>Harbour</strong> LGA (Figure 1) which is administered by <strong>Coffs</strong> <strong>Harbour</strong> <strong>City</strong><strong>Council</strong> (CHCC). It encompasses 1,174 km 2 on the mid north coast of <strong>NSW</strong> and is henceforth referredto as “<strong>Coffs</strong> LGA”.© ECO LOGICAL AUSTRALIA PTY LTD1Development of a Fine-scale Vegetation Map for the <strong>Coffs</strong> <strong>Harbour</strong> Local <strong>Government</strong> Area 45
Multi-agency Vegetation Mapping Program for <strong>Coffs</strong> <strong>Harbour</strong> LGA – Map Accuracy AssessmentFigure 1 Study region – <strong>Coffs</strong> LGA© ECO LOGICAL AUSTRALIA PTY LTD246Development of a Fine-scale Vegetation Map for the <strong>Coffs</strong> <strong>Harbour</strong> Local <strong>Government</strong> Area
Multi-agency Vegetation Mapping Program for <strong>Coffs</strong> <strong>Harbour</strong> LGA – Map Accuracy Assessment3 Vegetation classificationA fine-resolution vegetation classification for the <strong>Coffs</strong> <strong>Harbour</strong> <strong>City</strong> <strong>Council</strong> (CHCC) study area wasdeveloped by OEH using a 100 group analysis. This was conducted because the results of the <strong>NSW</strong>PCT list was not yet available at the commencement of the mapping program. The analysis used atotal of 534 full floristic sites from 393 existing sites and 141 additional sites. This classification resultedin a total of 66 unique vegetation types that were used as the basis for API mapping and an additional14 were identified from API giving a total of 80 CHCC types. Native vegetation types and associatedmap codes are shown in Table 1.Table 1. Vegetation types mapped in <strong>Coffs</strong> LGARainforestsCommunity NameAntarctic Beech - Coachwood Warm/Cool Temperate RainforestAntarctic Beech - Sassafras Cool Temperate RainforestBrown Myrtle Dry Rainforest of Creeklines and Sheltered Slopes of the Bagawa Range and Madmans CreekBrush Box Littoral Rainforest on HeadlandsCoachwood - Callicoma - Sassafras - Hoop Pine Warm Temperate RainforestCoachwood - Sassafras - Prickly Ash - Brush Box Warm Temperate Rainforest of the Dorrigo EscarpmentGrey Myrtle - Brush Box Dry RainforestHoop Pine Dry Rainforest of steep slopes in the Little Nymboida River, Mt Coramba and Woolgoolga areasSmall-leaved Lilly Pilly - Pear-fruited Tamarind Sheltered Littoral RainforestTuckeroo - Beach Bird's Eye Exposed Littoral RainforestWhite Booyong - Maidens Blush Riparian Rainforest on FloodplainsYellow Carabeen - Black Booyong - Maidens Blush - Bangalow Palm Subtropical Lowland RainforestMAP CODECH_RF02CH_RF01CH_RF05CH_RF08CH_RF03CH_RF12CH_RF06CH_RF04CH_RF13CH_RF07CH_RF09CH_RF11Wet sclerophyll forestsCommunity NameBlackbutt - Bangalow Palm -Turpentine Sheltered Wet Shrubby Forest of the Escarpment HillsBlackbutt – Smooth-barked Apple - Rose Myrtle Ferny Forest of escarpment and hinterland metasedimentaryhillsBlackbutt - Turpentine - Tallowwood - Forest Oak Grassy Ferny Forest of southern foothills on metasedimentsBrush Box - Blackbutt Wet Forest to Warm Temperate Rainforest of exposed ridges and slopes of the plateauand escarpment rimBrush Box - Corkwood - Open Forest on SandMAP CODECH_WSF02CH_WSF09CH_WSF08CH_WSF07CH_WSF12© ECO LOGICAL AUSTRALIA PTY LTD3Development of a Fine-scale Vegetation Map for the <strong>Coffs</strong> <strong>Harbour</strong> Local <strong>Government</strong> Area 47
Multi-agency Vegetation Mapping Program for <strong>Coffs</strong> <strong>Harbour</strong> LGA – Map Accuracy AssessmentWet sclerophyll forests (cont’d)Community NameBrush Box - Tallowwood - Blackbutt - Flooded Gum Wet Shrubby Forest of sheltered gully heads and slopes onmetasedimentary geologyDunn's White Gum Tall Wet Forest of Creeklines and Lower Slopes of the Moleton and Little Nymboida HillsMAP CODECH_WSF05CH_WSF13Flooded Gum - Bangalow Palm Riparian Forest of Coastal and Hinterland FloodplainsFlooded Gum - Tallowwood - Brush Box Wet Shrubby Forest of metasedimentary foothillsForest Red Gum Wet Open Forest to Woodland on Metasedimentary HeadlandsNew England Blackbutt-Blackbutt - Smooth-barked Apple Tall Forest of the Orara and Dorrigo EscarpmentSpotted Gum - White Mahogany - Small-fruited Grey Gum Wet Shrubby Forest on metasediments andconglomerate of the Bagawa Range and Madmans Creek HillsSteel Box - Grey Gum - Brown Myrtle Wet Forest of the Bagawa Range and Madmans CreekSydney Blue Gum - Tallowwood Wet Shrubby Forest on sheltered metasedimentary hills of the Eastern DorrigoPlateauTallowwood - Blackbutt - Sydney Blue Gum Ferny Wet Forest of the Plateau Escarpment and Coastal FoothillsTurpentine - Sydney Blue Gum -Tallowwood Sheltered Wet Shrubby Forest of Metasedimentary HinterlandFoothills and EscarpmentTurpentine - Tallowwood - Small-fruited Grey Gum - Grey Ironbark - White Mahogany Wet Shrubby ForestWhite Mahogany Moist Shrubby Forest of steep sheltered slopes of the Little Nymboida River ValleyCH_WSF01CH_WSF04CH_WSF14CH_WSF18CH_WSF11CH_WSF15CH_WSF06CH_WSF10CH_WSF03CH_WSF17CH_WSF16Dry sclerophyll forestsCommunity NameBlackbutt - Turpentine - Pink Bloodwood Grassy Dry Open to Tall Open ForestNeedlebark Stringybark - Scribbly Gum – Red Mahogany Dry Open Forest on gentle slopes on clay and sandyriparian creek linesNew England Blackbutt - Blackbutt - Thick-leaved Mahogany Dry Tall Forest of the Orara EscarpmentPink Bloodwood - Blackbutt - Smooth-barked Apple Dry to Tall Open Forest on SandPink Bloodwood - Coast Banksia Shrubby Dry Open Forest on Holocene DunesRed Bloodwood - Needlebark Stringybark Heathy Dry Open Forest on sandstone and conglomerateSmall-fruited Grey Gum - Grey Ironbark - Thick-leaved Mahogany - Tallowwood Grassy Dry Open Forest ofridges and exposed slopes on metasedimentsMAP CODECH_DOF01CH_DOF04CH_DOF07CH_D0F09CH_D0F08CH_DOF02CH_DOF05Spotted Gum - Thick-leaved Mahogany - Small-fruited Grey Gum - Grey Ironbark Grassy Dry Open Forest ofcoastal foothills on exposed aspects on sediments and metasedimentsSwamp Box - Broad-leaved Paperbark - Forest Red Gum - Red Mahogany Transitional Dry Open Forest ofCoastal Lowlands and ValleysThick-leaved Mahogany Grassy Dry Open Forest of exposed slopes on shallow meta-sedimentary soils of theLittle Nymboida RiverCH_DOF10CH_DOF06CH_DOF11© ECO LOGICAL AUSTRALIA PTY LTD448Development of a Fine-scale Vegetation Map for the <strong>Coffs</strong> <strong>Harbour</strong> Local <strong>Government</strong> Area
Multi-agency Vegetation Mapping Program for <strong>Coffs</strong> <strong>Harbour</strong> LGA – Map Accuracy AssessmentForested wetlandsCommunity NameBroad-leaved Paperbark - Swamp Box Tall Forest with Littoral Rainforest Elements on Hind DunesBroad-leaved Paperbark - Swamp Oak - Willow Bottle Brush Forested Wetland on FloodplainBroad-leaved Paperbark - Twigrush Saline Swamp ForestBroad-leaved Paperbark - Willow Bottlebrush Channel Forested Wetland of near coastal creeksBroad-leaved Paperbark Sedge Forested Wetland of drainage linesRiver Oak Riparian Forest of the Orara River ValleySwamp Mahogany - Broad-leaved Paperbark - Satinwood - Tassell Rush Wallum Swamp Sclerophyll Shrublandto Open Forest on poorly drained sandy soilsSwamp Mahogany - Prickly-leaved Paperbark Forested Wetland on Sandy SoilsSwamp Mahogany - Willow Bottlebrush Forested Wetland of coastal creeksSwamp Oak - Sea Rush Saline Swamp ForestMAP CODECH_FrW05CH_FrW01CH_FrW11CH_FrW03CH_FrW04CH_FrW07CH_FrW06CH_FrW09CH_FrW02CH_FrW10Teatree - Water Gum Riparian Shrubland of the Eastern Dorrigo Plateau of the Bobo and Little Nymboida RiverValleysCH_FrW08Freshwater wetlandsCommunity NameBaumea rubiginosa - Lepyrodia scariosa Wallum Sedgeland of Coastal SandplainsCoral Fern - Saw Sedge - Freshwater WetlandJointed Twig-rush Freshwater WetlandLeptocarpus tenax Wallum Sedgeland of Coastal sandplainsPrickly-leaved Paperbark - Fern-leaved Banksia - Swamp Grasstree Wet Heathland of Coastal SandplainsSieber's Paperbark - Prickly-leaved Paperbark- Wallum Heathland to Tall Shrubland of Coastal SandplainsSpike Rush - Broadleaf Cumbungi Freshwater WetlandTantoon Tea-tree - Whites Tea-tree Tall Shrubland of Coastal SandplainsWhites Tea-tree - Olive Tea-tree - Fern-leaved Banksia Wet Heathland to Shrubland of Coastal SandplainsMAP CODECH_FW04CH_FW09CH_FW07CH_FW03CH_FW02CH_FW05CH_FW08CH_FW06CH_FW01© ECO LOGICAL AUSTRALIA PTY LTD5Development of a Fine-scale Vegetation Map for the <strong>Coffs</strong> <strong>Harbour</strong> Local <strong>Government</strong> Area 49
Multi-agency Vegetation Mapping Program for <strong>Coffs</strong> <strong>Harbour</strong> LGA – Map Accuracy AssessmentSaline wetlandsCommunity NameClub Rush Dune SoakPrickly Couch - Blue Couch Grassland/Saltmarsh of intermittent coastal lakes and lagoonsRiver Mangrove - Grey Mangrove Riparian Estuarine ForestSamphire - Saltwater Couch SaltmarshSea Rush SaltmarshTwig Rush SaltmarshTwig Rush Sedgeland Soaks on HeadlandsMAP CODECH_SW03CH_SW04CH_SW01CH_SW07CH_SW06CH_SW02CH_SW05HeathlandsCommunity NameBlack She-oak - Hakea laevipes subsp. laevipes - Horned Sedge Clay HeathlandCoast Banksia Shrubland on HeadlandsCoast Banksia Shrubland to Open Forest on Holocene DunesCoast Wattle Shrubland of Holocene DunesDagger Hakea Clay HeathlandMAP CODECH_H04CH_H06CH_H01CH_H02CH_H05Grey gum - White Mahogany- Tea-tree Open Woodland on Rocky Outcrops Tea Tree Rock Outcrop Shrublandof the Orara Escarpment with emergent Grey Gum and MahoganyCH_H10Kangaroo Grass Headland GrasslandCH_H03New England Tea-tree Open Shrubland on Rocky Outcrops of the Dorrigo EscarpmentCH_H09Swamp Oak- Broad-leaved Paperbark Low Closed Shrubland on HeadlandsWallum Banksia - Black She-oak Dry Heath to Shrubland of Pleistocene dunesCH_H07CH_H08GrasslandsCommunity NameMaritime Grasslands of Offshore IslandsStrandline GrasslandMAP CODECH_G02CH_G01© ECO LOGICAL AUSTRALIA PTY LTD650Development of a Fine-scale Vegetation Map for the <strong>Coffs</strong> <strong>Harbour</strong> Local <strong>Government</strong> Area
Multi-agency Vegetation Mapping Program for <strong>Coffs</strong> <strong>Harbour</strong> LGA – Map Accuracy Assessment4 Methods4.1 BACKGROUNDThe methods used for accuracy assessment of mapping in the <strong>Coffs</strong> LGA were developed inaccordance with Chapter 10 “Accuracy Assessment” of the Standards (Sivertsen 2009) to enableappropriate statistical analysis. It included three basic components:1. Sample design - the method by which sample units (field points) were selected;2. Response design – protocols used for capturing field data associated with the sampling unit,and rules for labelling each sampling unit with a ‘degree of correctness’.3. Analysis and estimation – the mathematic approach used to determine the overall level ofaccuracy of the map product, reported as a percentage.4.2 SAMPLE DESIGNA ‘blind’ vegetation map 1 , constituting the final line work assigned with numeric map units 1 to 80 wasprovided by OEH for undertaking site selection. A proportional sampling design was then employed inthe office in which field sites were pre-selected, guided by the following rules:oNumber of field plots for each map unit linked to the total area of the map unit:- minimum of 3 plots per map unit;- 4 plots for maps units with a combined area of 100 – 1,000 ha;- 5 plots for maps units with a combined area of 1,000 – 5,000 ha;- 6 plots for map units with a combined area > 5,000 ha.oootarget of 100 plots on private land, the remainder on public land;plots not to be located within 100 m of an existing full-floristic or rapid vegetation plot;sample relatively accessible areas only.1 A ‘blind’ map does not include vegetation descriptors, so that OEH’s attribution of plant communities to individualpolygons could not influence the assessment of the plant community in the field by the ecologist conducting thefield validation.© ECO LOGICAL AUSTRALIA PTY LTD7Development of a Fine-scale Vegetation Map for the <strong>Coffs</strong> <strong>Harbour</strong> Local <strong>Government</strong> Area 51
Multi-agency Vegetation Mapping Program for <strong>Coffs</strong> <strong>Harbour</strong> LGA – Map Accuracy Assessment4.3 RESPONSE DESIGN4.3.1 Field assessmentField reconnaissance for the <strong>Coffs</strong> LGA was undertaken by Senior Botanists Phil Gilmour and LachlanCopeland over three months commencing June 2012. It involved driving as close as possible to eachpre-selected site, then locating a plot on foot with assistance of a Global Positioning System (GPS) tothe pre-programmed waypoints. The validation plot was selected within a typical part of the targetpolygon (avoiding ecotones or atypical areas) as an area within a 15 m radius of the chosen point(approximately 175 m 2 ). A number of pre-selected plots for which access was initially sought were notable to be accessed due to landholder objections. Where possible these were replaced with alternativesites.A field validation proforma was provided by OEH for this project (Appendix A) onto which the followingfield attributes were recorded:- SiteID- Date- Observer- Coordinates- Photo Number- Location description- Topographic position- Exposure class- Geology (if known)- Disturbance type- Disturbance intensity- Disturbance history- Structural Class (m)- Five dominant species and stratum cover % in the canopy (if present)- Five dominant species and stratum cover % in the upper storey (if present)- Five dominant species and stratum cover % in mid layer 1 (if present)- Five dominant species and stratum cover % in the mid layer 2 (if present)- Five dominant species and stratum cover % in the lower layer 1 (if present)- Five dominant species and stratum cover % in the lower layer 2 (if present)- Vegetation community type- Vegetation community score (5-1)Field attributes recorded at each validation plot were entered into the YETI database.© ECO LOGICAL AUSTRALIA PTY LTD852Development of a Fine-scale Vegetation Map for the <strong>Coffs</strong> <strong>Harbour</strong> Local <strong>Government</strong> Area
Multi-agency Vegetation Mapping Program for <strong>Coffs</strong> <strong>Harbour</strong> LGA – Map Accuracy Assessment4.3.2 Degree of CorrectnessA key part of fieldwork was to record the ‘level of correctness’ of the vegetation community sampled inthe field to each of the vegetation types provided by OEH (Table 1). The following codes were appliedto each vegetation type at each plot (from Woodcock and Gopal 2000):1. Absolutely wrongMatch is completely wrong and absolutely unacceptable2. Understandable but wrongSomething that makes the match understandable, but there are much better options and thematch is wrong3. Reasonable/acceptableProbably not the best possible match, but it is acceptable, as it does not pose a problem to theuser when interpreting the map4. Mostly correctUser would be happy with this match5. Absolutely rightNo doubt about the match – a perfect fitThese data were entered into a MS Access database and exported into Excel as a crosstab table.4.4 ANALYSIS AND ESTIMATION4.4.1 BackgroundThe approach used in this assessment is based on fuzzy set theory and thematic mapping as outlinedin Gopal and Woodcock (1994) and Woodcock and Gopal (2000). Fuzzy set theory enables thematicmaps to be treated as a continuum of classes rather than a set of distinctive classes, and thus allows forassessment of the magnitude of error as part of map accuracy.4.4.2 Data PreparationOn completion of field assessment, the final vegetation map including type attribution was provided byOEH.GPS co-ordinates of the validation field plots were intersected with the vegetation polygons in ArcMapto enable assignment of the mapped vegetation units to each site recorded in the field.4.4.3 Data AnalysisAn analysis file was developed for this project in Microsoft Excel, named“<strong>Coffs</strong>_Accuracy_Assessment_ Final.xls”. Data analysis involved comparison of mapped vegetationunits with vegetation types observed in the field, and was facilitated using three tools: the ‘Max’ function,the “Right’ function, the confusion matrix and the “Difference” function (Woodcock and Gopal 2000).The ‘Max’ function was used to return a “match” where the most correct (or equally most correct)vegetation type recorded at the plot corresponded with the mapped vegetation type (or in the case of amosaic polygon, one of the mapped vegetation types) within which the plot was located. This suggestedthat the attribution of the polygon was “absolutely right”. Conversely, a “mismatch’ was returned wherethe most correct (or equally most correct) vegetation type recorded at the plot did not correspond withthe mapped vegetation type within which the plot was located.© ECO LOGICAL AUSTRALIA PTY LTD9Development of a Fine-scale Vegetation Map for the <strong>Coffs</strong> <strong>Harbour</strong> Local <strong>Government</strong> Area 53
Multi-agency Vegetation Mapping Program for <strong>Coffs</strong> <strong>Harbour</strong> LGA – Map Accuracy AssessmentThe ‘Right’ function was employed to measure the overall accuracy of the map by returning a “match”for each field plot where the mapped vegetation type (or in the case of a mosaic polygon, one of themapped vegetation types) within which the plot was located was equivalent to a vegetation typeidentified as being either ‘absolutely right’, ‘mostly correct’ or ‘reasonable/ acceptable’ in the degree ofcorrectness table (section 4.2.3).A confusion matrix was developed that summarised key information obtained from the sampling andresponse designs, where each row and column represented a unique CHCC vegetation type (79 intotal). Each cell in the confusion matrix was assigned a value that represented the number of times avegetation type allocated “maximum” within a field plot (column) corresponded with a vegetation unitmapped by OEH (row). This approach to accuracy assessment was most stringent because any cellvalue in the matrix that contributed to the accuracy score was reduced if more than one vegetation typewas assigned the ‘maximum value’ in the field plot (e.g. if three equally most correct vegetation typeswere assigned in the field, one of which matched the mapped vegetation type, then the cell score wouldbe 0.33 rather than 1.00).The ideal situation in map accuracy is where only the diagonal line in the confusion matrix (top left tobottom right) contains non-zero values. In this case the most correct (or equally most correct)vegetation community sampled at each plot would represent the respective map unit within which theplot was located. The confusion matrix was created as a separate worksheet in the final analysis file“<strong>Coffs</strong>_Accuracy_Assessment_Final.xlsx”The ‘Difference’ function was used to assess the overall ‘magnitude of error’ of the map product. A‘Difference’ value was determined for each plot as the difference between the score assigned to themapped community (1 to 5) and the highest score assigned to all other communities (1 to 5). Thehighest ‘Difference’ value (4) was assigned to plots in which the mapped vegetation community wasabsolutely right and all other communities in the ‘degree of correctness’ table were absolutely wrong;conversely the lowest ‘Difference’ value (-4) was assigned to plots in which the mapped vegetationcommunity was absolutely wrong and at least one community in the ‘degree of correctness’ table wasabsolutely right.The ‘Difference’ value for each mapped community was tallied using a crosstab query in MS Access. Aresultant matrix was derived that showed the number of plots in each mapped vegetation communityand the plots’ corresponding ‘Difference’ score. From this an 'arithmetic mean' was calculated indicatingthe 'magnitude of error' of each mapped community.© ECO LOGICAL AUSTRALIA PTY LTD1054Development of a Fine-scale Vegetation Map for the <strong>Coffs</strong> <strong>Harbour</strong> Local <strong>Government</strong> Area
Multi-agency Vegetation Mapping Program for <strong>Coffs</strong> <strong>Harbour</strong> LGA – Map Accuracy Assessment5 Results5.1 RESPONSE DESIGN5.1.1 Field assessmentA total of 279 plots were completed for this accuracy assessment. A number of plots that were identifiedfor visitation on private lands were not able to be accessed at the time of survey, and these werereplaced where possible. The number of plots sampled in different structural formations (according toOEH mapping), in private and public land, is shown in Table 2. The location of sites is illustrated inFigure 2.Table 2. Number of plots by structural formation (as mapped by OEH) and land tenureTenureFormation Public Private TotalRainforest 32 8 40Wet sclerophyll forest 39 36 75Dry open forest 28 9 37Forested wetland 21 8 29Freshwater wetland 32 10 42Saline wetland 15 2 17Heathland 29 2 31Grassland 6 0 6Other 1 1 2Total 203 76 2795.1.2 Degree of CorrectnessFor each field plot, a sub set of ‘correct’ vegetation communities was identified and assigned itsappropriate level of correctness of ‘3’ (acceptable), ‘4’ (right) or ‘5’ (absolutely right). A defaultcorrectness value of ‘1’ (absolutely wrong) was then uniformly applied to all other non-conformingcommunities (i.e. those not considered to be either 3, 4 or 5). Due to the large number of plots sampledand the large number of vegetation types for which level of correctness was required, upgrade from ‘1’(absolutely wrong) to ‘2’ (understandable but wrong) was not systematically carried out within thecorrectness matrix.Figure 3 summarises the level of correctness of the CHCC vegetation classification according to thefield assessment. Of the 279 plots sampled, only 1 plot contained vegetation that was not able to beallocated to a CHCC vegetation community with an accuracy of more than 2 (understandable butwrong). Of the remaining 278 plots, 26% were assigned to one or more CHCC vegetation types with acorrection level of 5 (absolutely right) and 54% were assigned to one or more CHCC vegetation typeswith a correction level of 4 (mostly right). In summary, the CHCC classification is reasonably stronglyrepresentative of the field plots that were sampled.© ECO LOGICAL AUSTRALIA PTY LTD11Development of a Fine-scale Vegetation Map for the <strong>Coffs</strong> <strong>Harbour</strong> Local <strong>Government</strong> Area 55
Multi-agency Vegetation Mapping Program for <strong>Coffs</strong> <strong>Harbour</strong> LGA – Map Accuracy AssessmentFigure 2 Survey locations across the <strong>Coffs</strong> LGA© ECO LOGICAL AUSTRALIA PTY LTD1256Development of a Fine-scale Vegetation Map for the <strong>Coffs</strong> <strong>Harbour</strong> Local <strong>Government</strong> Area
Multi-agency Vegetation Mapping Program for <strong>Coffs</strong> <strong>Harbour</strong> LGA – Map Accuracy AssessmentFigure 3. Summary of vegetation classification correctness5.1.3 Data analysisA summary of the main analysis for this project that includes application of the “Max”, “Right” and“Difference” commands is shown in Appendix B.. Application of the “Max” function found that 141 of the279 plots (50.5%) were located in a map unit that matched the most correct vegetation type (or equallymost correct type) associated with the plot. Application of the “Right” function found that 185 of the 279plots (66.3%) were located in a map unit that matched a vegetation type that was classed as “correct” inthe field (i.e. factor of 3, 4 or 5), but was not necessarily the most correct type.Using the “Right” command as the basis for accuracy, the overall level of attributional accuracy for theCHCC map product was 66%. An area-weighted application of the “Right” command resulted in anoverall level of spatial accuracy of 62%, slightly less than the attributional accuracy of 66%. This isbecause, as a general trend, the more extensively mapped vegetation types had lower accuracy thanthe more confined types.Analysis of accuracy by broad tenure found that mapping within private lands was lower (53%) thanmapping in public lands (71%). Analysis of map accuracy by vegetation formation revealed thataccuracy varied from 100% to less than 60%, with the following attributional accuracies observed:other types = 100% grassland types = 67% freshwater wetland types = 62%heathland types = 87% dry open forest types = 65% rainforest types = 60%saline wetland types = 82% wet sclerophyll forest types = 63% forested wetland types = 59%© ECO LOGICAL AUSTRALIA PTY LTD13Development of a Fine-scale Vegetation Map for the <strong>Coffs</strong> <strong>Harbour</strong> Local <strong>Government</strong> Area 57
Multi-agency Vegetation Mapping Program for <strong>Coffs</strong> <strong>Harbour</strong> LGA – Map Accuracy AssessmentIndividual correctness scores listed in Appendix B are shown as a ‘magnitude of error’ in Table 3 foreach map unit (or vegetation type), where 4.0 is the optimum score (completely right) and -4.0 is theworst score (completely wrong). Given that most types only had 3 or 4 plots completed, interpretation ofresults on a type by type basis needs to be taken with a level of caution.Table 3. Magnitude of error tableCommunity# PlotsMismatchesMatches‐4 ‐3 ‐2 ‐1 0 1 2 3 4Arithmetic MeanCH_DOF01 8 1 1 1 3 0 2 0 0 0 ‐1.3CH_DOF02 4 1 0 0 0 2 0 1 0 0 ‐0.5CH_DOF04 2 0 0 1 1 0 0 0 0 0 ‐1.5CH_DOF05 3 0 0 1 0 0 1 1 0 0 0.3CH_DOF06 3 0 2 1 0 0 0 0 0 0 ‐2.7CH_DOF07 3 1 1 0 0 0 1 0 0 0 ‐2.0CH_DOF08 4 0 0 0 1 1 1 1 0 0 0.5CH_DOF09 4 0 0 0 0 1 2 0 0 1 1.5CH_DOF10 4 0 2 0 1 0 1 0 0 0 ‐1.5CH_DOF11 2 0 0 0 0 0 0 2 0 0 2.0CH_FrW01 4 0 1 2 1 0 0 0 0 0 ‐2.0CH_FrW02 4 0 0 0 1 2 1 0 0 0 0.0CH_FrW03 3 0 0 1 0 0 0 2 0 0 0.7CH_FrW04 4 0 1 0 0 3 0 0 0 0 ‐0.8CH_FrW05 4 0 1 1 1 0 1 0 0 0 ‐1.3CH_FrW06 3 0 0 0 1 0 1 1 0 0 0.7CH_FrW07 4 1 0 0 0 1 0 0 1 1 0.8CH_FrW08 4 0 1 1 0 0 1 0 0 1 0.0CH_FrW09 4 0 0 3 0 0 0 1 0 0 ‐1.0CH_FrW10 5 0 0 1 1 2 0 0 0 1 0.2CH_FrW11 3 0 2 0 0 0 1 0 0 0 ‐1.7CH_FW01 4 0 0 2 0 1 0 1 0 0 ‐0.5CH_FW02 4 1 0 3 0 0 0 0 0 0 ‐2.5CH_FW03 3 0 1 0 1 0 1 0 0 0 ‐1.0CH_FW04 1 0 0 1 0 0 0 0 0 0 ‐2.0CH_FW05 5 1 0 3 1 0 0 0 0 0 ‐2.2CH_FW06 3 0 0 1 0 0 1 1 0 0 0.3CH_FW07 3 0 0 0 0 0 0 0 0 3 4.0CH_FW08 3 0 0 0 0 0 0 0 0 3 4.0CH_FW09 3 0 0 0 0 1 0 2 0 0 1.3CH_G01 3 0 0 0 0 1 1 0 1 0 1.3CH_G02 3 0 0 2 0 0 0 0 0 1 0.0CH_H01 5 0 0 0 1 0 1 2 1 0 1.4CH_H02 3 0 0 0 0 0 0 1 2 0 2.7CH_H03 3 0 0 1 0 0 0 0 0 2 2.0CH_H04 3 0 0 1 1 1 0 0 0 0 ‐1.0CH_H05 4 0 0 0 0 1 1 1 0 1 1.8© ECO LOGICAL AUSTRALIA PTY LTD1458Development of a Fine-scale Vegetation Map for the <strong>Coffs</strong> <strong>Harbour</strong> Local <strong>Government</strong> Area
Multi-agency Vegetation Mapping Program for <strong>Coffs</strong> <strong>Harbour</strong> LGA – Map Accuracy AssessmentCommunity# PlotsMismatchesMatches‐4 ‐3 ‐2 ‐1 0 1 2 3 4Arithmetic MeanCH_H06 4 0 1 0 0 1 1 0 0 1 0.5CH_H07 1 0 0 0 0 0 0 0 1 0 3.0CH_H08 3 0 0 0 0 0 0 0 2 1 3.3CH_H09 2 0 1 0 0 0 0 0 0 1 0.5CH_H10 3 0 0 0 0 1 0 2 0 0 1.3CH_NRV01 1 0 0 0 0 0 1 0 0 0 1.0CH_P03 1 0 0 0 0 0 0 1 0 0 2.0CH_RF01 3 1 1 1 0 0 0 0 0 0 ‐3.0CH_RF02 4 3 0 0 1 0 0 0 0 0 ‐3.3CH_RF03 4 0 1 0 1 0 0 1 0 1 0.5CH_RF04 2 0 0 0 0 2 0 0 0 0 0.0CH_RF05 3 0 1 0 1 0 0 0 1 0 ‐0.3CH_RF06 1 0 0 0 0 1 0 0 0 0 0.0CH_RF07 4 0 0 1 0 2 0 1 0 0 0.0CH_RF08 3 0 0 0 0 1 1 1 0 0 1.0CH_RF09 3 0 1 0 0 0 0 1 0 1 1.0CH_RF11 5 0 1 0 1 1 2 0 0 0 ‐0.4CH_RF12 5 2 0 0 3 0 0 0 0 0 ‐2.2CH_RF13 3 0 2 0 1 0 0 0 0 0 ‐2.3CH_SW01 4 0 1 0 0 0 0 0 0 3 2.3CH_SW02 3 0 0 0 2 0 1 0 0 0 ‐0.3CH_SW03 3 0 1 0 1 1 0 0 0 0 ‐1.3CH_SW06 3 0 0 0 0 0 1 1 1 0 2.0CH_SW07 4 0 0 0 1 0 0 0 2 1 2.3CH_WSF01 6 0 2 0 1 2 1 0 0 0 ‐1.0CH_WSF02 4 0 1 0 1 1 1 0 0 0 ‐0.8CH_WSF03 5 0 1 0 0 2 2 0 0 0 ‐0.2CH_WSF05 9 0 2 2 2 2 1 0 0 0 ‐1.2CH_WSF06 4 0 0 0 2 1 1 0 0 0 ‐0.3CH_WSF07 4 0 0 0 2 1 1 0 0 0 ‐0.3CH_WSF08 5 0 0 0 2 0 2 1 0 0 0.4CH_WSF09 7 0 3 0 2 0 1 1 0 0 ‐1.1CH_WSF10 8 1 3 1 0 1 2 0 0 0 ‐1.6CH_WSF11 2 0 1 1 0 0 0 0 0 0 ‐2.5CH_WSF13 3 0 2 0 0 0 0 0 0 1 ‐0.7CH_WSF14 3 0 0 1 0 0 0 1 0 1 1.3CH_WSF15 3 0 2 0 1 0 0 0 0 0 ‐2.3CH_WSF16 3 0 1 0 2 0 0 0 0 0 ‐1.7CH_WSF17 5 0 1 1 1 1 0 1 0 0 ‐0.8CH_WSF18 4 0 0 0 2 1 1 0 0 0 ‐0.3Total 279 13 43 35 45 39 38 29 12 25 ‐0.2© ECO LOGICAL AUSTRALIA PTY LTD15Development of a Fine-scale Vegetation Map for the <strong>Coffs</strong> <strong>Harbour</strong> Local <strong>Government</strong> Area 59
Multi-agency Vegetation Mapping Program for <strong>Coffs</strong> <strong>Harbour</strong> LGA – Map Accuracy Assessment5.1.4 Confusion matrixFor this project the confusion matrix was used to derive a level of ‘user accuracy’ for each map unit thatwas influenced by:- the proportion of plots located in a map unit in which the most correct vegetation type matchedthe map unit; and- whether any other vegetation type(s) associated with those plots were equally as correct, butdid not match the map unit.This metric of accuracy is more stringent in that it only allows a match with the best fit community (i.e.same as the “Max” function), but it also reduces accuracy based on the fuzziness of the vegetationclassification, when two or more vegetation communities are assigned the highest level of correctnessin the field, but only one matches the map unit. The overall level of accuracy of the vegetation map,based on results of the confusion matrix, was 43.6% (refer to the file <strong>Coffs</strong>_Accuracy_Assessment_final.xlsx that accompanies this report for a digital version of the confusion matrix).Table 4 compares the three reported levels of map accuracy (confusion matrix vs. “Max” vs. “Right”) foreach of the vegetation types, and collectively. This table can be used to assess which map units havebeen confidently mapped and which have not.Table 4. Comparison of “Max” and “Right” scores with user accuracy from the confusion matrixAccuracy (%)Map UnitUser accuracyExact matchCorrect matchNo plots(Vegetation Type)(from confusion matrix) (from “Max command) (from “Right” command)CH_DOF01 8 25.0 25.0 62.5CH_DOF02 4 50.0 75.0 75.0CH_DOF04 2 0.0 0.0 50.0CH_DOF05 3 66.7 66.7 66.7CH_DOF06 3 0.0 0.0 0.0CH_DOF07 3 33.3 33.3 33.3CH_DOF08 4 62.5 75.0 100.0CH_DOF09 4 87.5 100.0 100.0CH_DOF10 4 25.0 25.0 50.0CH_DOF11 2 100.0 100.0 100.0CH_FrW01 4 0.0 0.0 25.0CH_FrW02 4 45.8 75.0 100.0CH_FrW03 3 66.7 66.7 66.7CH_FrW04 4 37.5 75.0 75.0CH_FrW05 4 25.0 25.0 50.0CH_FrW06 3 66.7 66.7 100.0CH_FrW07 4 62.5 75.0 75.0CH_FrW08 4 50.0 50.0 50.0CH_FrW09 4 25.0 25.0 25.0© ECO LOGICAL AUSTRALIA PTY LTD1660Development of a Fine-scale Vegetation Map for the <strong>Coffs</strong> <strong>Harbour</strong> Local <strong>Government</strong> Area
Multi-agency Vegetation Mapping Program for <strong>Coffs</strong> <strong>Harbour</strong> LGA – Map Accuracy AssessmentAccuracy (%)Map UnitUser accuracyExact matchCorrect matchNo plots(Vegetation Type)(from confusion matrix) (from “Max command) (from “Right” command)CH_FrW10 5 31.7 60.0 80.0CH_FrW11 3 33.3 33.3 33.3CH_FW01 4 37.5 50.0 50.0CH_FW02 4 0.0 0.0 0.0CH_FW03 3 33.3 33.3 66.7CH_FW04 1 0.0 0.0 0.0CH_FW05 5 0.0 0.0 20.0CH_FW06 3 66.7 66.7 100.0CH_FW07 3 100.0 100.0 100.0CH_FW08 3 100.0 100.0 100.0CH_FW09 3 83.3 100.0 100.0CH_G01 3 83.3 100.0 100.0CH_G02 3 33.3 33.3 33.3CH_H01 5 80.0 80.0 100.0CH_H02 3 100.0 100.0 100.0CH_H03 3 66.7 66.7 66.7CH_H04 3 16.7 33.3 66.7CH_H05 4 83.3 100.0 100.0CH_H06 4 58.3 75.0 75.0CH_H07 1 100.0 100.0 100.0CH_H08 3 100.0 100.0 100.0CH_H09 2 50.0 50.0 50.0CH_H10 3 83.3 100.0 100.0CH_NRV01 1 100.0 100.0 100.0CH_P03 1 100.0 100.0 100.0CH_RF01 3 0.0 0.0 0.0CH_RF02 4 0.0 0.0 0.0CH_RF03 4 50.0 50,0 75.0CH_RF04 2 50.0 100.0 100.0CH_RF05 3 33.3 33.3 66.7CH_RF06 1 50.0 100.0 100.0CH_RF07 4 43.8 75.0 75.0CH_RF08 3 77.8 100.0 100.0CH_RF09 3 66.7 66.7 66.7CH_RF11 5 40.0 60.0 80.0CH_RF12 5 0.0 0.0 60.0CH_RF13 3 0.0 0.0 33.3CH_SW01 4 75.0 75.0 75.0CH_SW02 3 33.3 33.3 100.0CH_SW03 3 16.7 33.3 33.3CH_SW06 3 100.0 100.0 100.0CH_SW07 4 75.0 75.0 100.0© ECO LOGICAL AUSTRALIA PTY LTD17Development of a Fine-scale Vegetation Map for the <strong>Coffs</strong> <strong>Harbour</strong> Local <strong>Government</strong> Area 61
Multi-agency Vegetation Mapping Program for <strong>Coffs</strong> <strong>Harbour</strong> LGA – Map Accuracy AssessmentAccuracy (%)Map UnitUser accuracyExact matchCorrect matchNo plots(Vegetation Type)(from confusion matrix) (from “Max command) (from “Right” command)CH_WSF01 6 30.6 50.0 66.7CH_WSF02 4 50.0 50.0 75.0CH_WSF03 5 56.7 80.0 80.0CH_WSF05 9 22.2 33.3 55.6CH_WSF06 4 37.5 50.0 100.0CH_WSF07 4 37.5 50.0 100.0CH_WSF08 5 60.0 60.0 100.0CH_WSF09 7 28.6 28.6 57.1CH_WSF10 8 29.2 37.5 37.5CH_WSF11 2 0.0 0.0 0.0CH_WSF13 3 33.3 33.3 33.3CH_WSF14 3 66.7 66.7 66.7CH_WSF15 3 0.0 0.0 0.0CH_WSF16 3 0.0 0.0 66,7CH_WSF17 5 30.0 40.0 60.0CH_WSF18 4 37.5 50.0 100.0ALL 279 43.6 50.5 66.3© ECO LOGICAL AUSTRALIA PTY LTD1862Development of a Fine-scale Vegetation Map for the <strong>Coffs</strong> <strong>Harbour</strong> Local <strong>Government</strong> Area
Multi-agency Vegetation Mapping Program for <strong>Coffs</strong> <strong>Harbour</strong> LGA – Map Accuracy Assessment6 DiscussionThe accuracy assessment undertaken in this report finds the following in relation to the accuracy of theCHCC vegetation map for <strong>Coffs</strong> LGA:1. An overall attributional map accuracy of 66% from application of the “Right” command(where a vegetation type recorded as 3, 4 or 5 in a field plot matched the vegetation type(s)recorded in the map unit within which the plot was located). This value (66%) should be used asthe basis of reporting accuracy in relation to the CHCC map.2. An overall spatial map accuracy of 62% from area-weighted application of the “Right”command.3. An exact match for 51% of plots (where the most correct type or one of the most correct typesrecorded at a field plot match the/a vegetation type recorded within the map unit within whichthe plot was located).4. A ‘fuzzy’ accuracy of 44% from application of the confusion matrix, in which results of the exactmatch assessment (51%) are weighted down by fuzziness in the vegetation classification (i.e.where some equally as correct vegetation types did not match the map unit). This measure ofaccuracy is useful for establishing the complexity of the vegetation classification adopted (in thiscase, relatively complex).The 66% level of map accuracy obtained in this analysis using the “Right” algorithm is considered areasonable result given the fineness of resolution of the vegetation classification to which mapping wasundertaken. Consideration of the fuzziness of the vegetation classification 2 through application of theconfusion matrix provides lesser confidence in product accuracy, as in many cases non-matchedvegetation types could be equally as correct as matched vegetation types. However, the limitation ofapplying a fuzzy rather than binary dataset to the confusion matrix, particularly in relation to multiplevegetation types (mapped and surveyed), is acknowledged.Some general findings were that cool temperate rainforest types (CH_RF01 and CHRF-02) were overmappedalong the ranges, and that forest types had relatively lower accuracy than non-forest types.Mapping of some eucalypt forest types such as CH_DOF06, CH_WSF11, CH_WSF15 and CH_FW02need reviewing.Map accuracy would be improved by simplifying the vegetation classification so that it better servicesthe mapping process (yet still addresses community needs for a regional scale map). A glance throughthe list of vegetation types in Table 1 shows that within (and even between) broad forest formations,2 only 26% of plots were able to be assigned a single, absolutely right type, while 54% were able to be assignedone or more ‘almost right’ types and 20% were able to be assigned one or more ‘acceptable’ types© ECO LOGICAL AUSTRALIA PTY LTD19Development of a Fine-scale Vegetation Map for the <strong>Coffs</strong> <strong>Harbour</strong> Local <strong>Government</strong> Area 63
Multi-agency Vegetation Mapping Program for <strong>Coffs</strong> <strong>Harbour</strong> LGA – Map Accuracy Assessmentmany are floristically similar in the canopy and occupy the same or overlapping geographic areas 3 .Where floristic separation of these communities is driven foremost by understorey plants that aredifficult (if not impossible) to separate using API (interpretation is drive by the canopy floristic, notunderstorey floristic), there is good reason to amalgamate them for the purpose of mapping, if there isno specific requirement to otherwise retain them. A key output of the original floristic analysis, thedendrogram, might greatly assist in the lumping up of similar types for the purpose of mapping.Reduction in the number of map units will have a number of other benefits, as well as improving mapaccuracy:1. It will reduce significantly the cost of mapping. For example, a halving the number of map unitsfrom 80 to 40 in the <strong>Coffs</strong> LGA would result in an approximate 4-fold reduction in the complexity ofthe map line work, but still retain ecological diversity to level that satisfies constructive conservationand management objectives.2. It will reduce significantly the complexity of the accuracy assessment. Providing fewer vegetationtypes thus clearer separation between types will provide an opportunity to better replicate plotswithin types, and to reduce overall fuzziness of the dataset.3. It will encourage uptake and application by the local community. The major users of regionalvegetation maps are local councils, NRM bodies and the farming community. The more complexthe classification and line work, the less likely it is to be understood by people who require it themost, and the more cynical users may become about it (particularly if accuracy is poor in places).Major users need to be familiar with the characteristics of mapping units that are contained on aregional vegetation map, and on their properties. Even if fine-resolution types are available as partof the mapped product, for some audiences it may be better to present broader level types withinan established vegetation hierarchy.Any effort to map to Level 5 in future should be targeted and should take place at local scale, supportedby comprehensive ground reconnaissance. The often diffuse boundaries between similar vegetationtypes means that physically walking the ecotone may be required in some instances to adequately plot,define and map the boundary. Targeted local mapping can readily feed into a regional map product.3 For example, the number of forested wetlands seems excessive© ECO LOGICAL AUSTRALIA PTY LTD2064Development of a Fine-scale Vegetation Map for the <strong>Coffs</strong> <strong>Harbour</strong> Local <strong>Government</strong> Area
Multi-agency Vegetation Mapping Program for <strong>Coffs</strong> <strong>Harbour</strong> LGA – Map Accuracy Assessment7 RecommendationsThe following are recommended for consideration by OEH and <strong>Coffs</strong> <strong>Harbour</strong> <strong>City</strong> <strong>Council</strong>.Recommendation 1 – Define a list of broader mapping units for regional mappingA set of broader map units should be derived from the current CHCC classification in <strong>Coffs</strong> LGA(facilitated by expert interpretation of the dendrogram). It is strongly suggested that no more than 40 –50 types be defined in <strong>Coffs</strong> LGA for the purpose of mapping. Some broader units may be mosaics ofclosely related types (e.g. 2 or more wet sclerophyll forest types).Recommendation 2 – Simplify and review the vegetation mapThe vegetation map should be simplified based on the above revision of vegetation types, and reviewedin the context of findings in this report. New line work may not be necessary, although additional groundtruthing to correct some types (e.g., cool temperate rainforest) should be undertaken.Recommendation 3 – Accuracy assessmentA second accuracy assessment should be carried out upon completion of the final product, using thesame technique as presented in this report. OEH should aim for an overall accuracy of 85% using the“Right” command, and 70% using the confusion matrix.© ECO LOGICAL AUSTRALIA PTY LTD21Development of a Fine-scale Vegetation Map for the <strong>Coffs</strong> <strong>Harbour</strong> Local <strong>Government</strong> Area 65
Multi-agency Vegetation Mapping Program for <strong>Coffs</strong> <strong>Harbour</strong> <strong>City</strong> <strong>Council</strong> Local <strong>Government</strong> AreaReferencesBenson, J. S. (2006) New South Wales Vegetation Classification and Assessment: Introduction - theclassification, database, assessment of protected areas and threat status of plant communities.Cunninghamia, 9(3): 329-382.Benson, J.S. (2009) New South Wales Vegetation Classification and Assessment: Part 2 Plantcommunities of the <strong>NSW</strong> South-western Slopes Bioregion and update of <strong>NSW</strong> Western Plains plantcommunities, Version 2 of the <strong>NSW</strong>VCA database. Cunninghamia 10(4): 599-673.Gopal, C.E. and Woodcock, S.G. (2000). Fuzzy set theory and thematic maps: accuracy assessmentand area estimation. Geographical Information Science. 14: 153-172.Sivertsen, D (2009) Native Vegetation Interim Type Standard. Department of Environment, ClimateChange and Water <strong>NSW</strong>, Sydney.Woodcock, S.G. and Gopal, C.E. (1994). Theory and methods for accuracy assessment of thematicmaps using fuzzy sets. Photogrammetry Engineering and Remote Sensing. 60: 181-188.© ECO LOGICAL AUSTRALIA PTY LTD2266Development of a Fine-scale Vegetation Map for the <strong>Coffs</strong> <strong>Harbour</strong> Local <strong>Government</strong> Area
Multi-agency Vegetation Mapping Program for <strong>Coffs</strong> <strong>Harbour</strong> <strong>City</strong> <strong>Council</strong> Local <strong>Government</strong> AreaAppendix AField Validation Proforma© ECO LOGICAL AUSTRALIA PTY LTD23Development of a Fine-scale Vegetation Map for the <strong>Coffs</strong> <strong>Harbour</strong> Local <strong>Government</strong> Area 67
Multi-agency Vegetation Mapping Program for <strong>Coffs</strong> <strong>Harbour</strong> LGA – Map Accuracy AssessmentAppendix BSummary of plot resultsPlot No Map Unit Exact match A Correctness B Acceptable C Formation TenureMap Unitarea (ha)1 CH_WSF01 no ‐3 no Wet sclerophyll forest Private 47422 CH_WSF05 no ‐3 no Wet sclerophyll forest Private 47823 CH_WSF03 yes 1 yes Wet sclerophyll forest Private 35044 CH_FrW07 yes 4 yes Freshwater wetland Private 135 CH_WSF09 no ‐3 no Wet sclerophyll forest Private 77036 CH_WSF10 no ‐3 no Wet sclerophyll forest Private 50307 CH_WSF03 no ‐3 no Wet sclerophyll forest Private 35048 CH_WSF01 no ‐1 yes Wet sclerophyll forest Private 47429 CH_WSF10 no ‐3 no Wet sclerophyll forest Private 503010 CH_WSF09 no ‐3 no Wet sclerophyll forest Private 770311 CH_WSF05 no ‐2 no Wet sclerophyll forest Private 478212 CH_WSF05 no ‐2 no Wet sclerophyll forest Private 478213 CH_DOF01 yes 1 yes Dry sclerophyll forest Private 680418 CH_RF01 no ‐2 no Rainforest Public 319 CH_RF01 no ‐4 no Rainforest Public 320 CH_RF01 no ‐3 no Rainforest Public 321 CH_G02 no ‐2 no Grassland Public 822 CH_G02 no ‐2 no Grassland Public 823 CH_G02 yes 4 yes Grassland Public 824 CH_SW03 yes 0 yes Saline wetland Public 1125 CH_DOF09 yes 4 yes Dry sclerophyll forest Public 32727 CH_G01 yes 1 yes Grassland Public 3030 CH_SW03 no ‐1 no Saline wetland Public 1131 CH_SW03 no ‐3 no Saline wetland Public 1132 CH_FrW03 no ‐2 no Freshwater wetland Public 1333 CH_FW07 yes 4 yes Forested wetland Public 2735 CH_FrW05 no ‐1 yes Freshwater wetland Public 1336 CH_RF07 no ‐2 no Rainforest Public 9737 CH_FW04 no ‐2 no Forested wetland Public 538 CH_FW05 no ‐1 yes Forested wetland Public 16539 CH_FrW09 no ‐2 no Freshwater wetland Public 1340 CH_H03 no ‐2 no Heathland Public 4643 CH_H05 yes 2 yes Heathland Public 3345 CH_H04 yes 0 yes Heathland Public 8047 CH_FrW10 yes 0 yes Freshwater wetland Public 1348 CH_SW02 yes 1 yes Saline wetland Public 4749 CH_DOF06 no ‐2 no Dry sclerophyll forest Public 202150 CH_DOF01 no ‐1 yes Dry sclerophyll forest Public 680451 CH_DOF01 no ‐1 yes Dry sclerophyll forest Public 6804© ECO LOGICAL AUSTRALIA PTY LTD2468Development of a Fine-scale Vegetation Map for the <strong>Coffs</strong> <strong>Harbour</strong> Local <strong>Government</strong> Area
Multi-agency Vegetation Mapping Program for <strong>Coffs</strong> <strong>Harbour</strong> LGA – Map Accuracy AssessmentPlot No Map Unit Exact match A Correctness B Acceptable C Formation TenureMap Unitarea (ha)53 CH_H05 yes 0 yes Heathland Public 3354 CH_H05 yes 1 yes Heathland Public 3355 CH_FW05 no ‐4 no Forested wetland Public 16556 CH_P03 yes 2 yes Other Public 20657 CH_G01 yes 3 yes Grassland Public 3058 CH_H02 yes 3 yes Heathland Public 27359 CH_H07 yes 3 yes Heathland Public 1260 CH_RF07 yes 0 yes Rainforest Public 9761 CH_FrW01 no ‐2 no Freshwater wetland Public 1362 CH_H06 no ‐3 no Heathland Public 4663 CH_WSF14 yes 2 yes Wet sclerophyll forest Public 3964 CH_H01 yes 2 yes Heathland Public 40265 CH_RF08 yes 0 yes Rainforest Public 4266 CH_H10 yes 2 yes Heathland Public 1067 CH_H10 yes 2 yes Heathland Public 1068 CH_H10 yes 0 yes Heathland Public 1072 CH_WSF02 no ‐1 yes Wet sclerophyll forest Public 391773 CH_DOF01 no ‐1 yes Dry sclerophyll forest Public 680474 CH_DOF05 yes 2 yes Dry sclerophyll forest Public 197776 CH_H09 no ‐3 no Heathland Public 1777 CH_WSF06 yes 0 yes Wet sclerophyll forest Public 392678 CH_H09 yes 4 yes Heathland Public 1780 CH_WSF07 no ‐1 yes Wet sclerophyll forest Public 215481 CH_WSF07 yes 0 yes Wet sclerophyll forest Public 215484 CH_FrW09 no ‐2 no Freshwater wetland Public 1385 CH_FW09 yes 0 yes Forested wetland Public 9186 CH_DOF09 yes 0 yes Dry sclerophyll forest Public 32787 CH_FW01 no ‐2 no Forested wetland Public 12688 CH_H04 no ‐1 yes Heathland Public 8090 CH_FW09 yes 2 yes Forested wetland Public 9191 CH_DOF09 yes 1 yes Dry sclerophyll forest Public 32793 CH_H08 yes 3 yes Heathland Public 11394 CH_FW02 no ‐2 no Forested wetland Public 27095 CH_FW09 yes 2 yes Forested wetland Public 9196 CH_FrW01 no ‐3 no Freshwater wetland Public 13104 CH_FW05 no ‐2 no Forested wetland Public 165106 CH_FW01 no ‐2 no Forested wetland Public 126107 CH_FW02 no ‐2 no Forested wetland Public 270111 CH_H01 no ‐1 yes Heathland Public 402112 CH_RF07 yes 0 yes Rainforest Public 97113 CH_H01 yes 1 yes Heathland Public 402114 CH_FW07 yes 4 yes Forested wetland Public 27115 CH_FrW04 yes 0 yes Freshwater wetland Public 13116 CH_FrW05 yes 1 yes Freshwater wetland Public 13© ECO LOGICAL AUSTRALIA PTY LTD25Development of a Fine-scale Vegetation Map for the <strong>Coffs</strong> <strong>Harbour</strong> Local <strong>Government</strong> Area 69
Multi-agency Vegetation Mapping Program for <strong>Coffs</strong> <strong>Harbour</strong> LGA – Map Accuracy AssessmentPlot No Map Unit Exact match A Correctness B Acceptable C Formation TenureMap Unitarea (ha)119 CH_H06 yes 1 yes Heathland Public 46120 CH_H03 yes 4 yes Heathland Public 46121 CH_FW07 yes 4 yes Forested wetland Public 27122 CH_H05 yes 4 yes Heathland Public 33123 CH_H08 yes 4 yes Heathland Private 113125 CH_FW03 no ‐3 no Forested wetland Private 33127 CH_FW03 no ‐1 yes Forested wetland Private 33128 CH_FW02 no ‐2 no Forested wetland Private 270130 CH_FrW04 no ‐3 no Freshwater wetland Private 13131 CH_FrW05 no ‐2 no Freshwater wetland Private 13132 CH_H01 yes 2 yes Heathland Public 402134 CH_FW03 yes 1 yes Forested wetland Private 33135 CH_FW02 no ‐4 no Forested wetland Private 270136 CH_H08 yes 3 yes Heathland Private 113139 CH_RF09 yes 2 yes Rainforest Public 38141 CH_DOF10 no ‐3 no Dry sclerophyll forest Public 2163143 CH_WSF10 no ‐3 no Wet sclerophyll forest Public 5030149 CH_WSF10 no ‐4 no Wet sclerophyll forest Public 5030150 CH_WSF08 yes 1 yes Wet sclerophyll forest Public 1292151 CH_WSF01 yes 1 yes Wet sclerophyll forest Public 4742152 CH_RF09 no ‐3 no Rainforest Public 38153 CH_RF09 yes 4 yes Rainforest Public 38154 CH_FrW09 no ‐2 no Freshwater wetland Public 13155 CH_FW01 yes 2 yes Forested wetland Public 126156 CH_DOF09 yes 1 yes Dry sclerophyll forest Public 327157 CH_FrW02 no ‐1 yes Freshwater wetland Public 13158 CH_SW06 yes 1 yes Saline wetland Public 38159 CH_SW07 no ‐1 yes Saline wetland Public 114160 CH_FrW10 no ‐1 yes Freshwater wetland Public 13161 CH_FrW11 no ‐3 no Freshwater wetland Public 13163 CH_FrW01 no ‐1 yes Freshwater wetland Public 13164 CH_SW06 yes 2 yes Saline wetland Public 38165 CH_FrW11 yes 1 yes Freshwater wetland Public 13166 CH_FrW06 yes 2 yes Freshwater wetland Public 13167 CH_FrW10 yes 4 yes Freshwater wetland Public 13169 CH_FW06 yes 2 yes Forested wetland Public 39170 CH_FW01 yes 0 yes Forested wetland Public 126171 CH_FW06 yes 1 yes Forested wetland Public 39172 CH_FrW01 no ‐2 no Freshwater wetland Public 13173 CH_SW01 yes 4 yes Saline wetland Private 146174 CH_RF03 no ‐1 yes Rainforest Private 3378175 CH_WSF06 yes 1 yes Wet sclerophyll forest Private 3926176 CH_RF02 no ‐1 no Rainforest Private 573178 CH_WSF07 no ‐1 yes Wet sclerophyll forest Private 2154© ECO LOGICAL AUSTRALIA PTY LTD2670Development of a Fine-scale Vegetation Map for the <strong>Coffs</strong> <strong>Harbour</strong> Local <strong>Government</strong> Area
Multi-agency Vegetation Mapping Program for <strong>Coffs</strong> <strong>Harbour</strong> LGA – Map Accuracy AssessmentPlot No Map Unit Exact match A Correctness B Acceptable C Formation TenureMap Unitarea (ha)183 CH_RF03 no ‐3 no Rainforest Private 3378184 CH_WSF06 no ‐1 yes Wet sclerophyll forest Private 3926185 CH_RF12 no ‐1 yes Rainforest Public 1734186 CH_WSF18 yes 1 yes Wet sclerophyll forest Public 635190 CH_RF12 no ‐4 no Rainforest Public 1734192 CH_WSF09 no ‐1 yes Wet sclerophyll forest Private 7703193 CH_WSF11 no ‐3 no Wet sclerophyll forest Private 2656194 CH_WSF03 yes 0 yes Wet sclerophyll forest Private 3504196 CH_RF11 no ‐3 no Rainforest Public 4226197 CH_WSF17 no ‐1 yes Wet sclerophyll forest Private 3061199 CH_WSF17 yes 0 yes Wet sclerophyll forest Private 3061200 CH_WSF15 no ‐3 no Wet sclerophyll forest Private 568210 CH_WSF03 yes 0 yes Wet sclerophyll forest Public 3504211 CH_WSF10 no ‐2 no Wet sclerophyll forest Private 5030212 CH_RF11 yes 1 yes Rainforest Private 4226213 CH_WSF05 yes 0 yes Wet sclerophyll forest Private 4782214 CH_DOF02 yes 0 yes Dry sclerophyll forest Private 3460215 CH_DOF05 no ‐2 no Dry sclerophyll forest Private 1977216 CH_WSF11 no ‐2 no Wet sclerophyll forest Private 2656217 CH_WSF17 no ‐3 no Wet sclerophyll forest Private 3061222 CH_DOF05 yes 1 yes Dry sclerophyll forest Private 1977223 CH_WSF17 no ‐2 no Wet sclerophyll forest Private 3061224 CH_DOF10 no ‐3 no Dry sclerophyll forest Private 2163225 CH_FW08 yes 4 yes Forested wetland Private 189226 CH_WSF05 no ‐1 yes Wet sclerophyll forest Private 4782227 CH_WSF17 yes 2 yes Wet sclerophyll forest Private 3061228 CH_WSF05 yes 1 yes Wet sclerophyll forest Private 4782229 CH_WSF02 yes 1 yes Wet sclerophyll forest Private 3917234 CH_RF12 no ‐1 yes Rainforest Public 1734235 CH_WSF18 no ‐1 yes Wet sclerophyll forest Public 635236 CH_RF05 no ‐3 no Rainforest Public 342240 CH_DOF10 no ‐1 yes Dry sclerophyll forest Public 2163241 CH_RF05 yes 3 yes Rainforest Public 342242 CH_RF05 no ‐1 yes Rainforest Public 342243 CH_WSF15 no ‐1 no Wet sclerophyll forest Public 568244 CH_FrW08 no ‐2 no Freshwater wetland Private 13245 CH_RF02 no ‐4 no Rainforest Private 573246 CH_RF03 yes 4 yes Rainforest Private 3378247 CH_WSF07 yes 1 yes Wet sclerophyll forest Private 2154248 CH_FW08 yes 4 yes Forested wetland Private 189249 CH_DOF02 no ‐4 no Dry sclerophyll forest Private 3460250 CH_DOF01 no ‐4 no Dry sclerophyll forest Private 6804251 CH_DOF06 no ‐3 no Dry sclerophyll forest Private 2021258 CH_FrW06 no ‐1 yes Freshwater wetland Public 13© ECO LOGICAL AUSTRALIA PTY LTD27Development of a Fine-scale Vegetation Map for the <strong>Coffs</strong> <strong>Harbour</strong> Local <strong>Government</strong> Area 71
Multi-agency Vegetation Mapping Program for <strong>Coffs</strong> <strong>Harbour</strong> LGA – Map Accuracy AssessmentPlot No Map Unit Exact match A Correctness B Acceptable C Formation TenureMap Unitarea (ha)259 CH_FrW03 yes 2 yes Freshwater wetland Public 13260 CH_DOF08 yes 2 yes Dry sclerophyll forest Public 155261 CH_WSF08 yes 2 yes Wet sclerophyll forest Public 1292262 CH_WSF08 no ‐1 yes Wet sclerophyll forest Public 1292274 CH_WSF03 yes 1 yes Wet sclerophyll forest Private 3504275 CH_WSF08 no ‐1 yes Wet sclerophyll forest Private 1292276 CH_WSF01 no ‐3 no Wet sclerophyll forest Private 4742277 CH_WSF01 yes 0 yes Wet sclerophyll forest Private 4742287 CH_FrW02 yes 0 yes Freshwater wetland Private 13289 CH_FrW05 no ‐3 no Freshwater wetland Private 13290 CH_RF07 yes 2 yes Rainforest Private 97291 CH_H01 yes 3 yes Heathland Public 402292 CH_G01 yes 0 yes Grassland Public 30293 CH_FW08 yes 4 yes Forested wetland Private 189298 CH_DOF11 yes 2 yes Dry sclerophyll forest Public 60300 CH_RF04 yes 0 yes Rainforest Public 54302 CH_WSF16 no ‐1 yes Wet sclerophyll forest Public 175303 CH_WSF16 no ‐1 yes Wet sclerophyll forest Public 175306 CH_RF04 yes 0 yes Rainforest Public 54308 CH_WSF13 no ‐3 no Wet sclerophyll forest Public 147311 CH_DOF11 yes 2 yes Dry sclerophyll forest Public 60312 CH_WSF16 no ‐3 no Wet sclerophyll forest Public 175313 CH_FrW08 yes 4 yes Freshwater wetland Public 13314 CH_WSF13 no ‐3 no Wet sclerophyll forest Public 147315 CH_WSF13 yes 4 yes Wet sclerophyll forest Public 147316 CH_RF13 no ‐3 no Rainforest Public 93318 CH_FrW02 yes 0 yes Freshwater wetland Public 13320 CH_FrW04 yes 0 yes Freshwater wetland Public 13321 CH_FrW06 yes 1 yes Freshwater wetland Public 13323 CH_SW07 yes 3 yes Saline wetland Private 114324 CH_WSF14 yes 4 yes Wet sclerophyll forest Public 39325 CH_WSF14 no ‐2 no Wet sclerophyll forest Public 39326 CH_H06 yes 4 yes Heathland Public 46327 CH_RF08 yes 2 yes Rainforest Public 42328 CH_RF13 no ‐1 yes Rainforest Public 93329 CH_RF08 yes 1 yes Rainforest Public 42330 CH_DOF10 yes 1 yes Dry sclerophyll forest Public 2163331 CH_WSF08 yes 1 yes Wet sclerophyll forest Public 1292332 CH_WSF18 no ‐1 yes Wet sclerophyll forest Public 635333 CH_WSF18 yes 0 yes Wet sclerophyll forest Public 635334 CH_WSF15 no ‐3 no Wet sclerophyll forest Public 568335 CH_WSF05 yes 0 yes Wet sclerophyll forest Public 4782336 CH_FW05 no ‐2 no Forested wetland Public 165337 CH_SW02 no ‐1 yes Saline wetland Public 47© ECO LOGICAL AUSTRALIA PTY LTD2872Development of a Fine-scale Vegetation Map for the <strong>Coffs</strong> <strong>Harbour</strong> Local <strong>Government</strong> Area
Multi-agency Vegetation Mapping Program for <strong>Coffs</strong> <strong>Harbour</strong> LGA – Map Accuracy AssessmentPlot No Map Unit Exact match A Correctness B Acceptable C Formation TenureMap Unitarea (ha)338 CH_SW07 yes 4 yes Saline wetland Public 114339 CH_SW01 yes 4 yes Saline wetland Public 146340 CH_SW06 yes 3 yes Saline wetland Public 38341 CH_DOF04 no ‐2 no Dry sclerophyll forest Public 145342 CH_SW02 no ‐1 yes Saline wetland Public 47344 CH_FrW10 yes 0 yes Freshwater wetland Public 13345 CH_FrW10 no ‐2 no Freshwater wetland Public 13347 CH_SW01 no ‐3 no Saline wetland Public 146348 CH_FrW07 yes 3 yes Freshwater wetland Private 13349 CH_FrW07 no ‐4 no Freshwater wetland Private 13350 CH_WSF01 yes 0 yes Wet sclerophyll forest Private 4742352 CH_FrW02 yes 1 yes Freshwater wetland Public 13353 CH_DOF08 yes 0 yes Dry sclerophyll forest Public 155354 CH_DOF08 yes 1 yes Dry sclerophyll forest Public 155355 CH_DOF08 no ‐1 yes Dry sclerophyll forest Public 155356 CH_RF13 no ‐3 no Rainforest Public 93357 CH_FrW03 yes 2 yes Freshwater wetland Public 13358 CH_H03 yes 4 yes Heathland Public 46360 CH_SW07 yes 3 yes Saline wetland Public 114361 CH_SW01 yes 4 yes Saline wetland Public 146362 CH_H04 no ‐2 no Heathland Public 80370 CH_DOF01 yes 1 yes Dry sclerophyll forest Public 6804371 CH_DOF02 yes 0 yes Dry sclerophyll forest Public 3460372 CH_DOF02 yes 2 yes Dry sclerophyll forest Public 3460373 CH_DOF04 no ‐1 yes Dry sclerophyll forest Public 145374 CH_RF06 yes 0 yes Rainforest Public 76375 CH_DOF01 no ‐3 no Dry sclerophyll forest Public 6804382 CH_FW05 no ‐2 no Forested wetland Public 165383 CH_FW06 no ‐2 yes Forested wetland Public 39384 CH_DOF07 no ‐3 no Dry sclerophyll forest Public 44385 CH_DOF07 yes 1 yes Dry sclerophyll forest Public 44386 CH_WSF09 no ‐3 no Wet sclerophyll forest Private 7703387 CH_WSF10 yes 0 yes Wet sclerophyll forest Public 5030388 CH_DOF07 no ‐4 no Dry sclerophyll forest Public 44391 CH_RF12 no ‐4 no Rainforest Public 1734393 CH_FrW04 yes 0 yes Freshwater wetland Public 13394 CH_FrW07 yes 0 yes Freshwater wetland Private 13395 CH_FrW11 no ‐3 no Freshwater wetland Public 13396 CH_WSF09 yes 1 yes Wet sclerophyll forest Public 7703397 CH_RF11 no ‐1 yes Rainforest Public 4226398 CH_DOF06 no ‐3 no Dry sclerophyll forest Private 2021403 CH_FrW09 yes 2 yes Freshwater wetland Public 13404 CH_H02 yes 2 yes Heathland Public 273405 CH_H06 yes 0 yes Heathland Public 46© ECO LOGICAL AUSTRALIA PTY LTD29Development of a Fine-scale Vegetation Map for the <strong>Coffs</strong> <strong>Harbour</strong> Local <strong>Government</strong> Area 73
Multi-agency Vegetation Mapping Program for <strong>Coffs</strong> <strong>Harbour</strong> LGA – Map Accuracy AssessmentPlot No Map Unit Exact match A Correctness B Acceptable C Formation TenureMap Unitarea (ha)406 CH_RF02 no ‐4 no Rainforest Public 573407 CH_RF11 yes 0 yes Rainforest Public 4226409 CH_WSF10 yes 1 yes Wet sclerophyll forest Public 5030410 CH_DOF01 no ‐2 no Dry sclerophyll forest Public 6804411 CH_WSF09 yes 2 yes Wet sclerophyll forest Public 7703412 CH_RF12 no ‐1 yes Rainforest Public 1734413 CH_FrW08 yes 1 yes Freshwater wetland Private 13414 CH_WSF05 no ‐3 no Wet sclerophyll forest Public 4782415 CH_WSF02 yes 0 yes Wet sclerophyll forest Public 3917416 CH_RF11 yes 1 yes Rainforest Public 4226417 CH_RF02 no ‐4 no Rainforest Private 573419 CH_RF03 yes 2 yes Rainforest Public 3378420 CH_WSF06 no ‐1 yes Wet sclerophyll forest Public 3926421 CH_H02 yes 3 yes Heathland Public 273422 CH_NRV01 yes 1 yes Other Private 1445423 CH_FrW08 no ‐3 no Freshwater wetland Public 13589 CH_WSF10 yes 1 yes Wet sclerophyll forest Public 5030857 CH_WSF09 no ‐1 yes Wet sclerophyll forest Public 7703858 CH_WSF02 no ‐3 no Wet sclerophyll forest Public 3917860 CH_WSF05 no ‐1 yes Wet sclerophyll forest Public 4782A. Based on application of the “Max” commandB. Based on application of the “Difference” commandC. Based on application of the “Right” command© ECO LOGICAL AUSTRALIA PTY LTD3074Development of a Fine-scale Vegetation Map for the <strong>Coffs</strong> <strong>Harbour</strong> Local <strong>Government</strong> Area
Multi-agency Vegetation Mapping Program for <strong>Coffs</strong> <strong>Harbour</strong> LGA – Map Accuracy AssessmentHEAD OFFICESuite 4, Level 12-4 Merton StreetSutherland <strong>NSW</strong> 2232T 02 8536 8600F 02 9542 5622SYDNEYLevel 6299 Sussex StreetSydney <strong>NSW</strong> 2000T 02 8536 8650F 02 9264 0717ST GEORGES BASIN8/128 Island Point RoadSt Georges Basin <strong>NSW</strong> 2540T 02 4443 5555F 02 4443 6655CANBERRALevel 211 London CircuitCanberra ACT 2601T 02 6103 0145F 02 6103 0148NEWCASTLESuites 28 & 29, Level 719 Bolton StreetNewcastle <strong>NSW</strong> 2300T 02 4910 0125F 02 4910 0126NAROOMA5/20 Canty StreetNarooma <strong>NSW</strong> 2546T 02 4476 1151F 02 4476 1161COFFS HARBOUR35 Orlando Street<strong>Coffs</strong> <strong>Harbour</strong> Jetty <strong>NSW</strong> 2450T 02 6651 5484F 02 6651 6890ARMIDALE92 Taylor StreetArmidale <strong>NSW</strong> 2350T 02 8081 2681F 02 6772 1279MUDGEEUnit 1, Level 179 Market StreetMudgee <strong>NSW</strong> 2850T 02 4302 1230F 02 6372 9230PERTHSuite 1 & 249 Ord StreetWest Perth WA 6005T 08 9227 1070F 08 9322 1358WOLLONGONGSuite 204, Level 262 Moore StreetAustinmer <strong>NSW</strong> 2515T 02 4201 2200F 02 4268 4361GOSFORDSuite 5, Baker One1-5 Baker StreetGosford <strong>NSW</strong> 2250T 02 4302 1220F 02 4322 2897DARWIN16/56 Marina BoulevardCullen Bay NT 0820T 08 8989 5601BRISBANEPO Box 1422Fortitude Valley QLD 4006T 0400 494 366© ECO LOGICAL AUSTRALIA PTY LTD31Development of a Fine-scale Vegetation Map for the <strong>Coffs</strong> <strong>Harbour</strong> Local <strong>Government</strong> Area 75