Spatial drivers of deforestation in Suriname - Centro de ...
Spatial drivers of deforestation in Suriname - Centro de ...
Spatial drivers of deforestation in Suriname - Centro de ...
- No tags were found...

Create successful ePaper yourself
Turn your PDF publications into a flip-book with our unique Google optimized e-Paper software.
SPATIAL DRIVERS OF DEFORESTATION IN SURINAMESARA OLGA RAMIREZ-GOMEZPARAMARIBO, SEPTEMBER 2011CENTER FOR AGRICULTURE RESEARCH IN SURINAMETROPENBOS SURINAME2 | P a g e
AKNOWLEDGMENTSI thank the Center for Agricultural Research <strong>of</strong> Sur<strong>in</strong>ame CELOS where I <strong>de</strong>veloped this research andNARENA for welcom<strong>in</strong>g me as part <strong>of</strong> the team. Tropenbos Sur<strong>in</strong>ame for the f<strong>in</strong>ancial support toaccomplish this research project and for the permanent guidance and feedback. To Ro<strong>de</strong>rick Zagt fromTropenbos International for the substantial comments on the draft version <strong>of</strong> this report. To the CapacityBuild<strong>in</strong>g Funds for Forest and Nature (CBN) for facilitat<strong>in</strong>g the tra<strong>in</strong><strong>in</strong>g on D<strong>in</strong>amica EGO. To theFoundation for Forest Management and Production Control SBB for the data about timber activities andto WWF for facilitat<strong>in</strong>g the use <strong>of</strong> the data about gold m<strong>in</strong><strong>in</strong>g areas. To the Amazon Conservation TeamACT for the <strong>in</strong>vitation to the CLASLite tra<strong>in</strong><strong>in</strong>g.From the <strong>Centro</strong> do Sensoramiento Remoto, Universidad Fe<strong>de</strong>ral M<strong>in</strong>as Gerais I thank Renzo Giudicefor the permanent technical support about the use <strong>of</strong> D<strong>in</strong>amica EGO and for his valuable feedback, I alsothank Jean Mas and Dr. Britaldo Soares Filho for their important comments and technical support dur<strong>in</strong>gthe mo<strong>de</strong>l<strong>in</strong>g process. From the Carnegie Institution for Science I acknowledge John Clark for the support<strong>in</strong> the use <strong>of</strong> CLASLite dur<strong>in</strong>g the remote sens<strong>in</strong>g phase <strong>of</strong> this project.I would like to thank Dr.David Hammond for his comments about the contribution <strong>of</strong> gold m<strong>in</strong><strong>in</strong>gactivities to <strong><strong>de</strong>forestation</strong> <strong>in</strong> Sur<strong>in</strong>ame. Sarah Crabbe for her permanent <strong>in</strong>terest and her time fordiscuss<strong>in</strong>g i<strong>de</strong>as. To Suzette Flantua and Milton Hernan Romero for their will<strong>in</strong>gness and support withremote sens<strong>in</strong>g techniques. To Mauricio Castillo for his help with statistics and for his general support.3 | P a g e
TABLE OF CONTENTS1. INTRODUCTION ................................................................................................................................ 82 STUDY AREA ................................................................................................................................... 103. FOREST COVER MAP ..................................................................................................................... 123.1. Process<strong>in</strong>g <strong>of</strong> satellite images and assessment <strong>of</strong> fractional cover classes. ................................ 123.3 Clouds and shadow mask<strong>in</strong>g ....................................................................................................... 143.4 Mosaic<strong>in</strong>g .................................................................................................................................... 143.5 Mapp<strong>in</strong>g forest cover .................................................................................................................. 164 SPATIAL EXPLICIT SIMULATION OF DEFORESTATION ........................................................ 184.1 MODEL DEVELOPMENT AND METHODS .......................................................................... 184.2 CARTOGRAPHIC DATASET .................................................................................................. 225. RESULTS AND DISCUSION ........................................................................................................... 245.1. Deforestation results for the entire study area. ............................................................................ 245.1.1. Deforestation around the savanna area ................................................................................... 275.2. <strong>Spatial</strong> patterns <strong>of</strong> <strong><strong>de</strong>forestation</strong>: qualitative assessment ............................................................ 285.3. Drivers <strong>of</strong> <strong><strong>de</strong>forestation</strong> .............................................................................................................. 316. CONCLUSIONS ................................................................................................................................. 374 | P a g e
LIST OF FIGURES.Figure 1. Study area. ................................................................................................................................... 10Figure 2. Flow chart forest cover assessment ............................................................................................. 12Figure 3. Band analysis-pixel fractional cover pr<strong>of</strong>ile <strong>in</strong>dicat<strong>in</strong>g total error image ................................... 13Figure 4. Fractional cover image after two mask<strong>in</strong>g process performed with<strong>in</strong> CLASLite.. ..................... 14Figure 5. Cloud free fractional cover image for Afobaka subset. ............................................................... 15Figure 6. Cloud free fractional cover image for Atjoni subset. .................................................................. 15Figure 7 Forest cover maps Afobaka subset. .............................................................................................. 17Figure 8 Forest cover maps Atjoni subset ................................................................................................... 17Figure 9. Mo<strong>de</strong>l fitness based on the fuzzy similarity method. .................................................................. 19Figure 10. <strong>Spatial</strong> probability <strong>of</strong> <strong><strong>de</strong>forestation</strong>. . ........................................................................................ 20Figure 11. Weights <strong>of</strong> Evi<strong>de</strong>nce (W + ) Afobaka subset. .............................................................................. 21Figure 12. Weights <strong>of</strong> Evi<strong>de</strong>nce (W + ) Atjoni subset. .................................................................................. 22Figure 13. Some <strong>of</strong> the spatial variables used dur<strong>in</strong>g the simulation process for Afobaka subset.. ........... 24Figure 14. Deforestation occurred between 2005and 2009 for Afobaka subset (red). ............................... 25Figure 15. Deforestation occurred between 2005 and 2009 for Atjoni subset.. .......................................... 27Figure 16. Simulated landscape for 2020 un<strong>de</strong>r the historical scenario for Afobaka subset ...................... 28Figure 17. Simulated landscape for 2020 un<strong>de</strong>r the historical scenario for Atjoni subset .......................... 29Figure 18. Characteristic spatial <strong><strong>de</strong>forestation</strong> patterns .............................................................................. 30Figure 19. Representation <strong>of</strong> the fragmentation pattern due to gold m<strong>in</strong><strong>in</strong>g activities ............................... 31Figure 20. Area <strong>de</strong>dicated to gold m<strong>in</strong><strong>in</strong>g, observations for two time periods <strong>in</strong> the study area.. .............. 335 | P a g e
LIST OF TABLESTable 1. Land cover area for 2005 and 2009 <strong>in</strong> every subset <strong>of</strong> the study area .......................................... 16Table 2. Cartographic dataset used <strong>in</strong> the simulation ................................................................................. 23Table 3. Total <strong><strong>de</strong>forestation</strong> between 2009 and 2020. ................................................................................ 266 | P a g e
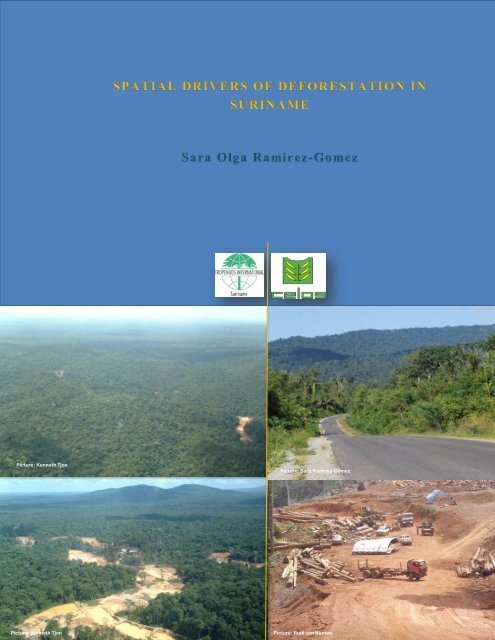
ABSTRACTIn many tropical countries forest are <strong>de</strong>stroyed to expand timber, m<strong>in</strong><strong>in</strong>g and agricultural <strong>in</strong>dustries andare affected by <strong>in</strong>frastructure <strong>in</strong>vestments such roads and dams. Deforestation rates <strong>in</strong> Sur<strong>in</strong>ame havebeen historically low due to the low population pressure and relative remoteness. Sur<strong>in</strong>ame’s status asHigh Forest Low Deforestation (HFLD) country is set to change if planned <strong>in</strong>frastructure <strong>in</strong>vestments (ahydrodam, a road to Brazil and agriculture extension with prospects for bi<strong>of</strong>uels) through the heart <strong>of</strong> thecountry realize, moreover, if low <strong>in</strong>stitutional capacity and environmental regulations cont<strong>in</strong>ue <strong>in</strong>hibit<strong>in</strong>gthe capacity response <strong>of</strong> governments to control the <strong>de</strong>struction <strong>of</strong> tropical forest overlapp<strong>in</strong>g greenstone<strong>de</strong>posits.Analytical and empirical studies have shown that an important <strong>de</strong>term<strong>in</strong>ant <strong>of</strong> <strong><strong>de</strong>forestation</strong> is theimproved access to previously <strong>in</strong>accessible forested areas alongsi<strong>de</strong> low governance gradients with highsocio-economic value. Timely <strong>in</strong>formation about the un<strong>de</strong>rly<strong>in</strong>g and proximate <strong>drivers</strong> <strong>of</strong> actual andfuture <strong><strong>de</strong>forestation</strong> and on the location and extent <strong>of</strong> expected <strong><strong>de</strong>forestation</strong> is one condition to properlymanage this process <strong>of</strong> forest cover <strong>de</strong>struction. Therefore, this study uses spatial <strong><strong>de</strong>forestation</strong> mo<strong>de</strong>ls toassess the <strong>in</strong>fluence <strong>of</strong> environmental <strong>drivers</strong> on forest cover change and to project future <strong><strong>de</strong>forestation</strong>trends.Dur<strong>in</strong>g the first stage <strong>of</strong> this project, forest cover maps were <strong>de</strong>veloped for 2005 and 2009 based onLandsat 5TM images. The result<strong>in</strong>g forest cover maps were used <strong>in</strong> a spatial explicit mo<strong>de</strong>l whichcalculates forest change rates and simulates <strong><strong>de</strong>forestation</strong> between 2009 and 2020 based on the spatialdistribution <strong>of</strong> spatial variables and a historical <strong><strong>de</strong>forestation</strong> scenario assum<strong>in</strong>g that <strong><strong>de</strong>forestation</strong>trajectories <strong>in</strong>to the future will cont<strong>in</strong>ue un<strong>de</strong>r the historical trend found between the period analyzed.The mo<strong>de</strong>l <strong>de</strong>monstrates how land use, <strong>in</strong>frastructure, socio-economic aspects and biophysical featuresdrive forest loss <strong>in</strong> Sur<strong>in</strong>ame. With the outcomes <strong>of</strong> this research the researchers expect to be able to<strong>de</strong>monstrate the potential <strong>of</strong> this type <strong>of</strong> studies to visualize the effects <strong>of</strong> land use <strong>de</strong>cisions on forestconservation along future <strong>in</strong>frastructure <strong>de</strong>velopments <strong>in</strong> the country, and to <strong>in</strong>form these <strong>de</strong>cisions sothat they m<strong>in</strong>imize undue negative impacts on forest-<strong>de</strong>pen<strong>de</strong>nt people and forest.Key words: Sur<strong>in</strong>ame, simulation <strong>of</strong> <strong><strong>de</strong>forestation</strong>, <strong>drivers</strong> <strong>of</strong> forest change, <strong>in</strong>frastructure <strong>in</strong>vestments.7 | P a g e
<strong><strong>de</strong>forestation</strong> over the period 2005-2009; 2) to estimate the <strong><strong>de</strong>forestation</strong> rate across the study area; 3) toassess the causes (<strong>drivers</strong>) <strong>of</strong> <strong><strong>de</strong>forestation</strong> and 4) to predict future <strong><strong>de</strong>forestation</strong> trajectories based onscenario assumptions.The issue that this work addresses is that <strong>in</strong> view <strong>of</strong> the prospects to pursue economic <strong>de</strong>velopment <strong>in</strong>Sur<strong>in</strong>ame based on natural resource exploitation and <strong>in</strong> view <strong>of</strong> the commitment <strong>of</strong> the NationalGovernment and conservation agencies for a REDD+ mechanism, it is critical to produce knowledgeabout the proximate and the un<strong>de</strong>rly<strong>in</strong>g forces threaten<strong>in</strong>g the forest ecosystem <strong>in</strong>tegrity <strong>in</strong> the mid andlong term.This work <strong>de</strong>scribes and mo<strong>de</strong>ls <strong><strong>de</strong>forestation</strong> processes across an area where important economicactivities <strong>de</strong>velop such timber, gold m<strong>in</strong><strong>in</strong>g, sand m<strong>in</strong><strong>in</strong>g and hydropower. The study area overlaps withthe so called greenstone belt and is crossed by a road l<strong>in</strong>k<strong>in</strong>g the capital Paramaribo with <strong>in</strong>landssettlements. The landscape <strong>in</strong> the zone is relatively high fragmented as the cumulative result <strong>of</strong> past landuses associated with agriculture, abandoned plantations, fire and m<strong>in</strong><strong>in</strong>g from where <strong><strong>de</strong>forestation</strong> hasexpan<strong>de</strong>d outwardly.The present study used standard approaches implemented <strong>in</strong> land use-cover change studies (Soares Filhoet al 2004, 2006). First the assessment <strong>of</strong> forest cover change by apply<strong>in</strong>g multi-temporal analysis <strong>of</strong>satellite images and second by <strong>in</strong>corporat<strong>in</strong>g a spatial explicit simulation mo<strong>de</strong>l <strong>of</strong> <strong><strong>de</strong>forestation</strong> to assessthe <strong>drivers</strong> <strong>of</strong> change and to simulate future <strong><strong>de</strong>forestation</strong> trajectories. This work discusses the spatialpatterns, process and <strong>drivers</strong> <strong>of</strong> <strong><strong>de</strong>forestation</strong> as well as the <strong><strong>de</strong>forestation</strong> frontier across a strategic zone <strong>in</strong>Sur<strong>in</strong>ame <strong>in</strong> or<strong>de</strong>r to help un<strong>de</strong>rstand the si<strong>de</strong> effects <strong>of</strong> land uses <strong>in</strong> the country and to encourage the use<strong>of</strong> these approaches <strong>in</strong> <strong>de</strong>velopment plann<strong>in</strong>g and conservation strategies countrywi<strong>de</strong>.9 | P a g e
2 STUDY AREAThe study area is located <strong>in</strong> eastern Sur<strong>in</strong>ame between the settlements Paranam and Djumu (Fig 1a). Thetotal study area was divi<strong>de</strong>d <strong>in</strong>to two subset named Afobaka and Atjoni subset. Afobaka has a total area<strong>of</strong> 3,052 km 2 and Atjoni 7,975 km 2 . Regard<strong>in</strong>g geomorphology and soils, the study area comprises twomajor zones: the savanna belt <strong>in</strong> the northern part and the <strong>in</strong>terior uplands <strong>of</strong> the Precambrian GuianaShield toward the south. The southern part <strong>of</strong> the area overlaps with the so called greenstone belt which isan area <strong>of</strong> 24,000 km 2 located <strong>in</strong> eastern Sur<strong>in</strong>ame form<strong>in</strong>g part <strong>of</strong> a nearly cont<strong>in</strong>uous, E-W to SE-NWstrik<strong>in</strong>g green stone belt along the NE marg<strong>in</strong> <strong>of</strong> the Guiana Shield, splitt<strong>in</strong>g <strong>in</strong>to two branches fromFrench Guiana eastwards and cont<strong>in</strong>u<strong>in</strong>g <strong>in</strong>to NE Brazil The characteristic geology <strong>of</strong> the GSB besi<strong>de</strong>sthe <strong>de</strong>posits <strong>of</strong> gold, is reflected <strong>in</strong> its geomorphology, hydrology, and vegetation as rock composition<strong>de</strong>term<strong>in</strong>es weather<strong>in</strong>g patterns (M<strong>in</strong>istry <strong>of</strong> Labour, Technological Development and Environment,2003).With<strong>in</strong> the study area the vegetation types <strong>in</strong>clu<strong>de</strong>savanna forest, creek forest, high forest, open savannavegetation and forest re-growth. There are two protectedareas: the Br<strong>in</strong>ckheuvel Nature Reserve (60km 2 ) <strong>in</strong> theAfobaka Subset and the Brownsberg National Park (122km 2 ). The area has an extensive network <strong>of</strong> navigablecreeks and two major rivers: the Saramacca and theSur<strong>in</strong>ame River. Most important land uses consist <strong>of</strong> goldm<strong>in</strong><strong>in</strong>g which is closely associated with the distribution<strong>of</strong> the green stone belt (GSB), timber extraction, stoneand sand m<strong>in</strong><strong>in</strong>g, abandoned plantation and shift<strong>in</strong>gcultivation. The population is comprised by maroonsgroups with transient migrants from Brazil(Garimpeiros).The study area is crossed by the Afobaka road whichl<strong>in</strong>ks Paranam Alum<strong>in</strong>ium ref<strong>in</strong>ery with the hydropowerdam and crossed by the road from Brownsweg to Atjoni.The entire road track from Paranam to Atjoni is one <strong>of</strong>Figure 1. Study area: red box Afobaka subset,green box Atjoni (Source: Narena).the most important transport corridors <strong>in</strong> the country because <strong>of</strong> its current and future importance <strong>in</strong> theeconomic <strong>de</strong>velopment <strong>of</strong> the country. This corridor creates access to Brokopondo dam, to m<strong>in</strong><strong>in</strong>g sitesand to timber concessions. It also represents the transportation corridor l<strong>in</strong>k<strong>in</strong>g the <strong>in</strong>terior humanpopulation with Paramaribo. Furthermore, the road will cont<strong>in</strong>ue <strong>in</strong> the future from Atjoni southwards tothe bor<strong>de</strong>r with Brazil nearby the village <strong>of</strong> Vier Gebroe<strong>de</strong>rs at the foot <strong>of</strong> the Tumucumac Mounta<strong>in</strong>range and it would eventually connect with the BR-210 and BR-163 (van Dijck 2010). The entire stretchis the so called North-South Corridor which is consi<strong>de</strong>red to have the potential for improv<strong>in</strong>g theeconomic competitiveness <strong>of</strong> the country. This on the other hand may expose the region to environmentalchange because this road will cut <strong>of</strong>f though well preserved-environmentally sensitive areas <strong>of</strong> TropicalRa<strong>in</strong> Forest with high biodiversity and high availability <strong>of</strong> water resources, high ecologically and highcultural assets. Moreover, the area along the road have high socio-economic value, with rich areas <strong>of</strong>10 | P a g e
forestry resources and large reserves <strong>of</strong> gold and <strong>in</strong>dustrial m<strong>in</strong>erals such as bauxite, copper, iron ore,marble, manganese and z<strong>in</strong>c.11 | P a g e
content; the NPV spectrum is associated with <strong>de</strong>ad or senescent vegetation characteristic <strong>of</strong> plant carboncompounds and B is associated with exposed m<strong>in</strong>eral soil and rocks. The AutoMCU iteratively selects aPV, NPV and B spectrum from each library, and unmixes the pixel reflectance <strong>in</strong>to constituent coverfractions (see Asner et al 2009 for <strong>de</strong>tailed explanation). The process <strong>of</strong> random selection is repeated untilthe solution converges on a mean value for each surface cover fraction. CLASLite consi<strong>de</strong>rs 30 iterationsper pixel sufficient to achieve a stable solution based on the Monte Carlo approach. Per pixel iterationsproduce a standard <strong>de</strong>viation for the estimates <strong>of</strong> B, PV and NPV which is used <strong>in</strong> the f<strong>in</strong>al analysis <strong>of</strong> thefit <strong>of</strong> the mo<strong>de</strong>led spectrum.Ten fractional cover images for both subsets <strong>in</strong> the selected years were automated generated with<strong>in</strong>CLASLite. They were <strong>de</strong>pict<strong>in</strong>g primary forest or late secondary forest (PV >90%, NPV 0-10% and B 0-10% on a pixel basis) and <strong><strong>de</strong>forestation</strong> (PV 0-10%, NPV >80% and B >10% on a pixel basis). Theseimages were the ma<strong>in</strong> <strong>in</strong>put to generate the forest cover and <strong><strong>de</strong>forestation</strong> map after they un<strong>de</strong>rwent aprocess <strong>of</strong> secondary mask<strong>in</strong>g <strong>of</strong> clouds and shadows and subsequent mosaic<strong>in</strong>g to generate an <strong>in</strong>itial andf<strong>in</strong>al forest landscape for 2005 and 2009 respectively (see sessions below) which were nee<strong>de</strong>d dur<strong>in</strong>g theland cover change assessment.3.2 Mo<strong>de</strong>l fitTo analyze the accuracy <strong>of</strong> the AutoMCU on a pixel by pixel basis, I exam<strong>in</strong>ed the fractional coverclassification to look for the total error image which shows the total error expressed as Root Mean Square(RMS) error and i<strong>de</strong>ntify areas <strong>of</strong> concern. A pixel with a low Total Error <strong>in</strong>dicates that the solution isgood, whereas high Total Error suggests that the solution is not good and should either be discar<strong>de</strong>d orused with cautions (Asner et al 2009). An example<strong>of</strong> this procedure is shown <strong>in</strong> figure 3. The spectralpr<strong>of</strong>ile shows that the fractional value for B is 70%(band 1), 45% for PV (band 2) and 1% for NPV(band 3). The next three bands (4, 5, 6) <strong>in</strong>dicate thestandard <strong>de</strong>viation <strong>of</strong> the respective fractions, theresults show that the <strong>de</strong>viation from the mean islow for the 30 iterations, show<strong>in</strong>g that the solutionfor the three fractions (PV, NPV and B) wasconsistent. Band 7 <strong>in</strong>dicates the total error (RMSE)which is relative low <strong>in</strong> my results, <strong>in</strong>ferr<strong>in</strong>g thatthe spectral pr<strong>of</strong>ile that was created dur<strong>in</strong>g theAuto MCU analysis was very close to the actualspectra <strong>of</strong> the pixel, therefore, I can be confi<strong>de</strong>nt <strong>in</strong>the ability <strong>of</strong> the fractions to reproduce theFigure 3. Band analysis-pixel fractional cover pr<strong>of</strong>ile<strong>in</strong>dicat<strong>in</strong>g total error imagereflectance <strong>of</strong> the pixel´s spectra. I performed this analysis throughout the images; the RMSE (band 7)was generally high for clouds and water that were not properly masked out dur<strong>in</strong>g the automated process.In that case I carried out additional mask<strong>in</strong>g <strong>of</strong> contam<strong>in</strong>ated pixels.13 | P a g e
4 SPATIAL EXPLICIT SIMULATION OF DEFORESTATION4.1 MODEL DEVELOPMENT AND METHODS4.1.1 General approachIn the previous chapter two forest cover maps were <strong>de</strong>veloped from 2005 and 2009. These two mapsconstitute, respectively, the <strong>in</strong>itial and f<strong>in</strong>al landscapes dur<strong>in</strong>g the simulation process. The spatial explicitsimulation <strong>of</strong> <strong><strong>de</strong>forestation</strong> used exist<strong>in</strong>g mo<strong>de</strong>ls available with<strong>in</strong> D<strong>in</strong>amica EGO version 1.6.2 withparameters customized for the study area. D<strong>in</strong>amica EGO is a georeferenced stochastic cellular automatamo<strong>de</strong>l that simulates <strong><strong>de</strong>forestation</strong> and other multi-scale environmental dynamics based on the empiricalrelationship between spatial- explanatory variables (Soares-Filho et al 2002).The general mo<strong>de</strong>l<strong>in</strong>g approach encompassed two ma<strong>in</strong> steps. The first step comprised the calculation <strong>of</strong>annual <strong><strong>de</strong>forestation</strong> rates , the estimation <strong>of</strong> spatial probabilities <strong>of</strong> <strong><strong>de</strong>forestation</strong> and consequently theassessment <strong>of</strong> the <strong>drivers</strong> <strong>of</strong> forest cover change <strong>in</strong> the study areas us<strong>in</strong>g cartographic data for land uses,roads, settlements, protected areas and biophysical features (slope and vegetation) with<strong>in</strong> a raster gridmap <strong>of</strong> 30x30 m resolution. The second step <strong>in</strong>volved the projection <strong>of</strong> <strong><strong>de</strong>forestation</strong> trajectories up to2020 based on the projection <strong>of</strong> historical <strong><strong>de</strong>forestation</strong> rates from four years between 2005 and 2009.Deforestation trajectories based on historical trends assumed that <strong><strong>de</strong>forestation</strong> rates rema<strong>in</strong> constantthrough the simulation process un<strong>de</strong>r the assumption that neither future land use <strong>in</strong> the country nor anyother policy <strong>de</strong>cision will trigger an <strong>in</strong>crease or <strong>de</strong>crease <strong>in</strong> the <strong><strong>de</strong>forestation</strong> rates further than the currentvalue.This study support the argument that <strong><strong>de</strong>forestation</strong> is an <strong>in</strong>ertial process by which the areas mostlikely to be <strong>de</strong>forested are those located closer to the forest areas already <strong>in</strong>tervened. Deforestation is<strong>de</strong>f<strong>in</strong>ed <strong>in</strong> this study as the conversion from primary or late secondary forest to bare and shrubbyland.4.1.2 Mo<strong>de</strong>l calibration, parametrisation and validationThe calculation <strong>of</strong> <strong><strong>de</strong>forestation</strong> rates was the first step <strong>in</strong> the simulation processes. Deforestation rates arecalculated with<strong>in</strong> D<strong>in</strong>amica EGO by compar<strong>in</strong>g the <strong>in</strong>itial landscape (2005) and the f<strong>in</strong>al (2009) for everystudy area measur<strong>in</strong>g the percentage <strong>of</strong> forest that is chang<strong>in</strong>g to <strong>de</strong>forested each year between the period<strong>of</strong> analysis. D<strong>in</strong>amica EGO computes <strong><strong>de</strong>forestation</strong> rates by solv<strong>in</strong>g a matrix that <strong>de</strong>scribe a system thatchanges over discrete time <strong>in</strong>crements, <strong>in</strong> which the value <strong>of</strong> any variable (<strong><strong>de</strong>forestation</strong> area <strong>in</strong> this case)<strong>in</strong> a given time period t n is the sum <strong>of</strong> fixed percentages <strong>of</strong> values <strong>in</strong> time t n-1 as follow (Soares-Filho et al2009):18 | P a g e
Similarity %( √ )In this case the matrix was solvedfor the transition forest to <strong>de</strong>forested(2 to 1 accord<strong>in</strong>g to the land coverclass values <strong>in</strong> the correspond<strong>in</strong>gmaps). The annualized <strong><strong>de</strong>forestation</strong>rates for Afobaka and Atjoni subsetare 0.00113864 and 0.0006838 or0.11% and 0.06% respectively. Thecalculated rates reflect four yearhistory <strong>of</strong> <strong><strong>de</strong>forestation</strong> and areassumed here as the local historical<strong><strong>de</strong>forestation</strong> rates for the studyareas (Table 3).Mo<strong>de</strong>l fitness10080604020030 90 150 210 270 330 390 450 510<strong>Spatial</strong> resolution (meters)Figure 9. Mo<strong>de</strong>l fitness based on the fuzzy similarity method.The simulation <strong>of</strong> <strong><strong>de</strong>forestation</strong> for the period between 2005-2009 receives as <strong>in</strong>puts the <strong>in</strong>itial landscape(2005), the explanatory variables (Fig 13), the weights <strong>of</strong> evi<strong>de</strong>nce coefficients and the <strong><strong>de</strong>forestation</strong> rate,and iterates four times (four years). In this calibration step the mo<strong>de</strong>l produces the “distance to<strong>de</strong>forested” variable, the transition probability maps and simulated maps for each time step which areused dur<strong>in</strong>g the mo<strong>de</strong>l validation. The validation method used image similarity tests based on a fuzzymultiple resolution comparison between the <strong>in</strong>itial and f<strong>in</strong>al real landscape (2005 with 2009) and the<strong>in</strong>itial real landscape (2005) and the simulated one (2009). The mo<strong>de</strong>l achieved a spatial agreement up to80% (Fig 9) with<strong>in</strong> at w<strong>in</strong>dow size <strong>of</strong> 17 x 17 cells which is acceptable based on other results obta<strong>in</strong>edus<strong>in</strong>g D<strong>in</strong>amica EGO (Soares-Filho et al 2006, Guidice et al 2009). As the mo<strong>de</strong>l runs, <strong><strong>de</strong>forestation</strong><strong>in</strong>itiates adjacent to those exist<strong>in</strong>g <strong><strong>de</strong>forestation</strong> patches and expands onwards <strong>de</strong>pend<strong>in</strong>g upon theprobability map. The future spatial distribution <strong>of</strong> <strong><strong>de</strong>forestation</strong> is conditioned by the explanatoryvariables and by the <strong><strong>de</strong>forestation</strong> rates used dur<strong>in</strong>g the simulation.Simulation <strong>of</strong> future <strong><strong>de</strong>forestation</strong> trajectories are predicted with<strong>in</strong> D<strong>in</strong>amica EGO us<strong>in</strong>g the mo<strong>de</strong>lparameters expla<strong>in</strong>ed above except for the times <strong>of</strong> iteration. The simulation process starts with the realf<strong>in</strong>al landscape (2009) and iterates 11 times (11 years) until 2020. The mo<strong>de</strong>l runs with the historical ratefound over the period <strong>of</strong> analysis rema<strong>in</strong><strong>in</strong>g constant <strong>in</strong>to the future, these are 0.00113864 and 0.0006838for Afobaka and Atjoni respectively.<strong>Spatial</strong> distribution <strong>of</strong> <strong><strong>de</strong>forestation</strong>The spatial distribution <strong>of</strong> <strong><strong>de</strong>forestation</strong> was calculated <strong>in</strong> D<strong>in</strong>amica EGO by simulat<strong>in</strong>g the transitionfrom forest to <strong>de</strong>forested which is <strong>de</strong>term<strong>in</strong>ed by discrete-step-generated transition probability maps(Soares-Filho et al 2002). These spatial probabilities are produced based on a map <strong>of</strong> changes between19 | P a g e
a)b)Figure 10. <strong>Spatial</strong> probability <strong>of</strong> <strong><strong>de</strong>forestation</strong>. a) Afobaka subset, b) Atjoni subset. High probabilities area located aroundpreviously <strong>de</strong>forested areas.2005 and 2009 and by calculat<strong>in</strong>g the weights <strong>of</strong> evi<strong>de</strong>nce <strong>of</strong> spatial variables. Weights <strong>of</strong> Evi<strong>de</strong>nce(W<strong>of</strong>E) is a method wi<strong>de</strong>ly used <strong>in</strong> spatial explicit simulation to calculate, <strong>in</strong> this case, the spatialprobability <strong>of</strong> <strong><strong>de</strong>forestation</strong> occurrence based on a set <strong>of</strong> “evi<strong>de</strong>nce” variables (e.g distance to roads,distance to settlements, distance to navigable rivers, distance to previously <strong>de</strong>forested areas, slope, landuses, vegetation types and protected areas). The weights are calculated us<strong>in</strong>g Bayesian rules that expla<strong>in</strong>the occurrence <strong>of</strong> an event <strong>in</strong> the light <strong>of</strong> updated evi<strong>de</strong>nce (Romero-Calcerreda and Luque 2006). Dur<strong>in</strong>gthe process, the predictor variables are comb<strong>in</strong>ed <strong>in</strong> a multiple map overlay operation with<strong>in</strong> D<strong>in</strong>amicaEGO, where the posterior probability <strong>of</strong> <strong><strong>de</strong>forestation</strong> occurs giv<strong>in</strong>g the presence or absence <strong>of</strong> a predictorvariable (Soares-Filho et al 2010).A W<strong>of</strong>E analysis results <strong>in</strong> a set <strong>of</strong> statistical measures <strong>of</strong> association: Weights (W + and W - ), Contrast (C)and Significance. The weights, W + and W − , represent measures <strong>of</strong> the spatial ten<strong>de</strong>ncy <strong>of</strong> f<strong>in</strong>d<strong>in</strong>g one<strong>de</strong>forested pixel giv<strong>in</strong>g the presence <strong>of</strong> the predictor variable. If more <strong>de</strong>forested pixels occur with<strong>in</strong> thespatial pattern than would be expected by chance, then W + is positive and W − is negative. Conversely, W +is negative and W − is positive when fewer <strong>de</strong>forested pixels occur with<strong>in</strong> an evi<strong>de</strong>nce pattern than wouldbe expected by chance (Giudice et al 2009). The contrast “C” provi<strong>de</strong>s a measure <strong>of</strong> spatial association orrepell<strong>in</strong>g effect between the <strong>de</strong>forested pixel and an evi<strong>de</strong>nce pattern. It is <strong>de</strong>noted by C = W + −W − ,therefore the larger and more positive the value, the greater is the <strong>in</strong>fluence <strong>of</strong> the evi<strong>de</strong>nce pattern <strong>in</strong><strong><strong>de</strong>forestation</strong>, on the other hand, the larger and more negative the value the greater is the repell<strong>in</strong>g effect,near zero there is no effect at all.20 | P a g e
The Significance is the variance <strong>of</strong> the Contrast (C) and it <strong>in</strong>forms that (C) is significantly different fromzero or that the association is likely to be “real”. If not significant association is found, the variable has tobe removed as it was the case with the variable “protected areas”. An over or un<strong>de</strong>r estimation <strong>of</strong> theWeights can occur if there is no <strong>in</strong><strong>de</strong>pen<strong>de</strong>nce between the evi<strong>de</strong>nce variables which could affect the<strong><strong>de</strong>forestation</strong> probability map. Therefore D<strong>in</strong>amica EGO analyses the correlation between variables us<strong>in</strong>ga set <strong>of</strong> statistical tests to assess this assumption (Soares-Filho et al 2009). In this case was used the Jo<strong>in</strong>t-Uncerta<strong>in</strong>ty <strong>in</strong>formation which tests correlation between two evi<strong>de</strong>nce maps based on a scale 0 to 1 withhigher values <strong>de</strong>not<strong>in</strong>g a higher correlation (Appendix 1). A value <strong>of</strong> 0.5 was <strong>de</strong>ci<strong>de</strong>d as the thresholdbased on similar studies (Giudice et al 2009). None <strong>of</strong> the evi<strong>de</strong>nce variables was correlated therefore allevi<strong>de</strong>nce variables were reta<strong>in</strong>ed to build up the probability maps (Fig 10).Figure 11. Weights <strong>of</strong> Evi<strong>de</strong>nce (W + ) Afobaka subset for the variables distance to Afobaka road, distance to secondary roads,distance to <strong>de</strong>forested and land use: AP-Abandoned plantation, SC-Shift<strong>in</strong>g cultivation. SF-A-State farm agriculture. SF-C-Statefarm cattle. GM-Gold m<strong>in</strong><strong>in</strong>g and LG-Logg<strong>in</strong>g.The highest probabilities <strong>of</strong> <strong><strong>de</strong>forestation</strong> are found <strong>in</strong> red around previously <strong>de</strong>forested patches, with<strong>in</strong>short distances from roads and settlements <strong>in</strong> the case <strong>of</strong> the Atjoni subset. This result is a directconsequence <strong>of</strong> the weights <strong>of</strong> evi<strong>de</strong>nce coefficients (fig 11 and 12) which also reflect that the variables“distance to <strong>de</strong>forested areas”, “distance to Afobaka road”, “distance to secondary roads” and “land usegoldm<strong>in</strong><strong>in</strong>g” are the ma<strong>in</strong> factors <strong>de</strong>term<strong>in</strong><strong>in</strong>g <strong><strong>de</strong>forestation</strong> for the Afobaka subset. In the case <strong>of</strong> Atjonisubset, the ma<strong>in</strong> <strong>de</strong>term<strong>in</strong><strong>in</strong>g factors are “distance to <strong>de</strong>forested areas”, “distance to Atjoni road”,“distance to secondary roads”, “distance to settlements” and “land use-gold m<strong>in</strong><strong>in</strong>g”. Likewise, theanalysis showed that for both study areas, <strong><strong>de</strong>forestation</strong> is not correlated with logg<strong>in</strong>g activities nor withagricultural uses and it is not strongly l<strong>in</strong>ked with proximity to navigable rivers over the period analyzed.21 | P a g e
In summary, from the analysis can be retrieved that <strong><strong>de</strong>forestation</strong> is highly probable with<strong>in</strong> the first 2 kmfrom ma<strong>in</strong> and secondary roads, settlements (only for the case <strong>of</strong> Atjoni) and it expands outwardly fromexist<strong>in</strong>g <strong>de</strong>forested patches. The calculation <strong>of</strong> future <strong><strong>de</strong>forestation</strong> (2009-2020) used the same weightsand probabilities as the simulation run dur<strong>in</strong>g the calibration procedure for 2005 and 2009, only the<strong><strong>de</strong>forestation</strong> rate changed.Figure 12. Weights <strong>of</strong> Evi<strong>de</strong>nce (W + ) Atjoni subset for the variables distance to Atjoni road, distance to navigable rivers(Sur<strong>in</strong>ame and Saramacca river), distance to secondary roads, distance to settlements, distance to <strong>de</strong>forested and land use: GM-Gold m<strong>in</strong><strong>in</strong>g, SC-Shift<strong>in</strong>g cultivation and LG-Logg<strong>in</strong>g.4.2 CARTOGRAPHIC DATASETThe spatial explicit simulation <strong>of</strong> <strong><strong>de</strong>forestation</strong> <strong>in</strong>corporated biophysical and proximate variables that areknown for driv<strong>in</strong>g tropical <strong><strong>de</strong>forestation</strong> (Geist and Lamb<strong>in</strong> 2002) and that have been used <strong>in</strong> other<strong><strong>de</strong>forestation</strong> mo<strong>de</strong>ls (SoaresFilho et al 2004, 2006; Etter et al 2006 and Guidice 2009). Ten spatialvariables were consi<strong>de</strong>red to simulate <strong><strong>de</strong>forestation</strong> <strong>in</strong> the study area: distance to previously <strong>de</strong>forestedland (m), distance to settlements (m), distance to navigable rivers (m), distance to ma<strong>in</strong> roads (m),22 | P a g e
distance to secondary roads (m) and distance to railways (m). These variables were <strong>de</strong>rived from maps <strong>of</strong>roads, settlements, railways and rivers and transformed to cont<strong>in</strong>uous distance to feature maps us<strong>in</strong>gD<strong>in</strong>amica EGO algorithms account<strong>in</strong>g for the Eucli<strong>de</strong>an distance <strong>in</strong> meters between a pixel and theclosest pixel represent<strong>in</strong>g the feature. Other variables <strong>in</strong>clu<strong>de</strong>d slope, vegetation types, protected areasand land uses (Fig 13). The land use variable was built by append<strong>in</strong>g agricultural uses (abandonedplantation, state farm agriculture, state farm cattle and shift<strong>in</strong>g cultivation), gold m<strong>in</strong><strong>in</strong>g and logg<strong>in</strong>gareas. To obta<strong>in</strong> logg<strong>in</strong>g areas, polygons were drawn <strong>in</strong> ArcGis 9.2 represent<strong>in</strong>g the highest Kernel<strong>de</strong>nsity <strong>of</strong> logged trees.These spatial variables were <strong>in</strong>troduced <strong>in</strong> the simulation to quantify and <strong>in</strong>tegrate their <strong>in</strong>fluence on thespatial prediction <strong>of</strong> <strong><strong>de</strong>forestation</strong>. They are known as predictor variables. To <strong>in</strong>corporate them <strong>in</strong> thesimulation, all layers represent<strong>in</strong>g the variables were converted to raster format with 30 m resolutionus<strong>in</strong>g ArcGIS 9.2. The cartographic dataset was stored with<strong>in</strong> a raster cube dataset with all raster mapshav<strong>in</strong>g the same number <strong>of</strong> rows and columns and tied to the same coord<strong>in</strong>ate system.Table 2. Cartographic dataset used <strong>in</strong> the simulationLAYERForest cover mapsRoadsRailwaysSettlementsRiversLogg<strong>in</strong>gM<strong>in</strong><strong>in</strong>gAgricultureVegetationProtected areasBiomassSOURCEElaborated with<strong>in</strong> the current project.Division <strong>of</strong> Natural Resources and Environmental Assessment <strong>of</strong> Sur<strong>in</strong>ame (NARENA).NARENANARENANARENAFoundation for forest management and production control SBB.National Forest Office <strong>of</strong> French Guiana, WWF-Guianas.NARENANARENANARENASarvision, Conservation International Sur<strong>in</strong>ame23 | P a g e
Figure 13. Some <strong>of</strong> the spatial variables used dur<strong>in</strong>g the simulation process for Afobaka subset. The same variables were used forAtjoni area. All variables are tied to the same coord<strong>in</strong>ate system and have the same number <strong>of</strong> rows and columns. The biomasslayer was obta<strong>in</strong>ed from the Wood Hole Research Institute (2011) and used at the end <strong>of</strong> the simulation to predict emissions <strong>of</strong>Carbon dioxi<strong>de</strong> (see below).5. RESULTS AND DISCUSION5.1. Deforestation results for the entire study area.Forest area loss between 2005 and 2009 is spatially <strong>de</strong>picted <strong>in</strong> figure 14 with <strong><strong>de</strong>forestation</strong> ratessummarized <strong>in</strong> table 3. Figure 15 represents the forest landscape for 2020. Deforestation is grow<strong>in</strong>g<strong>in</strong>ertially around areas <strong>of</strong> previous <strong><strong>de</strong>forestation</strong> extend<strong>in</strong>g <strong>in</strong>si<strong>de</strong> Brownsberg Natural Park andBr<strong>in</strong>ckheuvel nature reserve. The simulated landscape <strong>in</strong> 2020 shows how far the new <strong><strong>de</strong>forestation</strong>extends across the study area with the same spread<strong>in</strong>g <strong><strong>de</strong>forestation</strong> pattern. Locations with<strong>in</strong> the socalled“Green stone belt” show a higher relation with the occurrence <strong>of</strong> <strong><strong>de</strong>forestation</strong>. Approximately44% <strong>of</strong> the <strong><strong>de</strong>forestation</strong> between the period analyzed (2005-2009) was concentrated with<strong>in</strong> the GrosRosebel m<strong>in</strong>es; 33% <strong>in</strong> M<strong>in</strong>dr<strong>in</strong>itie; 12% <strong>in</strong> Brownsweg and 11% distributed along roads, rivers andaround the savannahs <strong>of</strong> Zan<strong>de</strong>rij. These areas were act<strong>in</strong>g as centers <strong>of</strong> diffusion for <strong><strong>de</strong>forestation</strong> andare the areas that hold the largest probability <strong>of</strong> <strong><strong>de</strong>forestation</strong> (Fig 10).24 | P a g e
Between 2005 and 2009 there was a loss <strong>of</strong> 1182 hectares <strong>in</strong> Afobaka subset and 1500 hectares <strong>in</strong> Atjoni.The average annual <strong><strong>de</strong>forestation</strong> rate was 295,5 and 374, 98 hectares for Afobaka and Atjonirespectively. The mo<strong>de</strong>l estimates that after 11 years the forest will <strong>de</strong>cl<strong>in</strong>e roughly 4000 hectares for theentire study area un<strong>de</strong>r a historical trend. This trend assumes an annual rate <strong>of</strong> gross <strong><strong>de</strong>forestation</strong> <strong>in</strong>-0,11% for Afobaka and -0.06% for Atjoni. This <strong><strong>de</strong>forestation</strong> is still below to what is consi<strong>de</strong>red high(>1.5%). Some <strong>of</strong> the reasons that expla<strong>in</strong> low <strong><strong>de</strong>forestation</strong> rates <strong>in</strong> the study zones resi<strong>de</strong> <strong>in</strong><strong>de</strong>mographic factors, high proportion <strong>of</strong> forest cover and relatively low economic <strong>de</strong>velopment.Population <strong>de</strong>nsity across the country is 3.3 people per sq. km, one <strong>of</strong> the lowest <strong>in</strong> the world (WorldBank 2010) with most population located <strong>in</strong> the coastal zone. The entire study area <strong>in</strong>clu<strong>de</strong>s a majorproportion <strong>of</strong> the <strong>in</strong>terior 1 settlements along the Sur<strong>in</strong>ame and Saramacca river. Deforestation aroundthese settlements, partially attributed toshift<strong>in</strong>g cultivation, does not extendbeyond 2 km from the village with<strong>in</strong> theperiod analyzed (2005-2020).Additionally, <strong><strong>de</strong>forestation</strong> rates varyspatially and are closely related to theproportion <strong>of</strong> forest cover with ratespeak<strong>in</strong>g if less than 80% cover (Lu<strong>de</strong>keet al 1990, Lamb<strong>in</strong> and Ehrlich 1997,Etter et al 2005). Forest cover <strong>in</strong> Afobakasubset is approximately 90% <strong>of</strong> the entirearea and approximately 97% <strong>of</strong> the totalarea <strong>in</strong> Atjoni Subset. Likewise economic<strong>de</strong>velopment has been relatively low eventhough the zone is the area where manyimportant economic activities take place:timber, m<strong>in</strong><strong>in</strong>g, quarry<strong>in</strong>g andhydropower generation but they have notbeen extensive enough as to have aneffect on <strong><strong>de</strong>forestation</strong> at the scale <strong>of</strong> thisanalysis.However, two issues raise concern <strong>in</strong> thisrespect. First, gold m<strong>in</strong><strong>in</strong>g activities arethe ma<strong>in</strong> source <strong>of</strong> <strong><strong>de</strong>forestation</strong> and it isspread<strong>in</strong>g at an alarm<strong>in</strong>g rate acrossprist<strong>in</strong>e forest endowed with gold<strong>de</strong>posits. In the year 2000 the areaFigure 14. Deforestation occurred between 2005and 2009 forAfobaka subset (red).<strong>de</strong>dicated to gold m<strong>in</strong><strong>in</strong>g was approximately 8295 hectares and <strong>in</strong> 2008 the gold m<strong>in</strong><strong>in</strong>g area wasexten<strong>de</strong>d to 27.253 hectares, three-fold <strong>in</strong>crease <strong>in</strong> eight years (WWF 2011). Over the last <strong>de</strong>ca<strong>de</strong> theprice <strong>of</strong> gold has <strong>in</strong>creased 360% and cont<strong>in</strong>ue to set new records rais<strong>in</strong>g to 1813,5 to August 2011(World1 Interior refers to every part <strong>of</strong> the country that is not the coastal zone.25 | P a g e
Gold Council 2011). Similarly, <strong>in</strong> the second quartier <strong>of</strong> 2011 the gold <strong>de</strong>mand was 919.8 Tonnes worthUS$44.5bn, the second highest quarterly value on record with Ch<strong>in</strong>a and India as the major contributorsto growth. As a response, there has been a compell<strong>in</strong>g economic <strong>in</strong>centive to mass exploitation <strong>of</strong> lowergra<strong>de</strong> gold <strong>de</strong>posits (Swenson et al 2011) which <strong>in</strong>clu<strong>de</strong>s the Guiana Shiled region (Hammond et al2007).The second issue that raises concern is the high <strong>de</strong>gree <strong>of</strong> lawleness and the difficulty <strong>of</strong> the Nationalgovernment to regulate this activity which prevents the country from manag<strong>in</strong>g how natural resources areextracted to meet a strong market <strong>de</strong>mand. Deforestation is expected to <strong>in</strong>crease due to gold m<strong>in</strong><strong>in</strong>g <strong>in</strong> thelack <strong>of</strong> appropriate regulation and if remote forest areas become accessible with the plans to communicateParamaribo with Santarem <strong>in</strong> Brazil which eventually would facilitate the movement <strong>of</strong> <strong>in</strong>formal m<strong>in</strong>ersand m<strong>in</strong><strong>in</strong>g companies.Table 3. Total <strong><strong>de</strong>forestation</strong> between 2009 and 2020.AfobakaAtjoniAnnual rate <strong>of</strong> gross <strong><strong>de</strong>forestation</strong> (%) -0,11 -0.06Avarage annual <strong><strong>de</strong>forestation</strong> (Ha.yr-1) -295.5 -374,98Area loss 2020 1056 3805,81Other “low-governance” regions <strong>in</strong> the Amazon where land uses are not well regulated provi<strong>de</strong> withexamples <strong>of</strong> <strong>in</strong>creas<strong>in</strong>g <strong><strong>de</strong>forestation</strong> and ecosystem <strong>de</strong>struction <strong>in</strong> response to recent record high goldprices and extension <strong>of</strong> road <strong>in</strong>frastructure. In the <strong>de</strong>partment <strong>of</strong> Madre <strong>de</strong> Dios, Peru, the largest producer<strong>of</strong> gold <strong>in</strong> the country, recent m<strong>in</strong><strong>in</strong>g is convert<strong>in</strong>g primary forest at a non-l<strong>in</strong>ear rate alongsi<strong>de</strong> <strong>in</strong>creas<strong>in</strong>ggold prices (Swenson et al 2011). In conjunction with annual rate <strong>of</strong> <strong>in</strong>crease <strong>in</strong> gold price <strong>of</strong> ~18%,<strong><strong>de</strong>forestation</strong> <strong>in</strong>creased six-fold from 2003-2006 (292/ha/year) to 2006-2009 (1915 ha/year). Accord<strong>in</strong>g tothe author, gold m<strong>in</strong><strong>in</strong>g <strong>in</strong> the region seems to be relatively <strong>in</strong><strong>de</strong>pen<strong>de</strong>nt from the location <strong>of</strong> roads,however, large cont<strong>in</strong>ental-scale multi-faceted <strong>in</strong>frastructure projects are provid<strong>in</strong>g new access for goldm<strong>in</strong>ers to Peru´s lowland Amazon.Protected areas do not seem to counteract effectively the effects <strong>of</strong> m<strong>in</strong>ers across gold bear<strong>in</strong>g regions <strong>in</strong>the Amazon. In Sur<strong>in</strong>ame, we found forest conversion <strong>in</strong>si<strong>de</strong> Brownsberg Nature Park and Br<strong>in</strong>kheuvelNature Reserve between 2005 and 2009. With<strong>in</strong> the limits <strong>of</strong> these legally protected areas we found highspatial probability <strong>of</strong> <strong><strong>de</strong>forestation</strong> (Fig 10). Our mo<strong>de</strong>l estimates that for 2020, <strong><strong>de</strong>forestation</strong> <strong>in</strong>crease 5%<strong>in</strong>si<strong>de</strong> Brownsweg Natural Park and, <strong>in</strong> Br<strong>in</strong>kheuvel Nature Reserve <strong><strong>de</strong>forestation</strong> will occur but someregeneration as well. The transition matrix <strong>in</strong>dicates that there is regeneration dur<strong>in</strong>g the years <strong>of</strong> the analysis,however, dur<strong>in</strong>g the simulation; I only focused on the pixels chang<strong>in</strong>g from forest to <strong>de</strong>forest. The protection<strong>of</strong> legally protected areas <strong>in</strong> Sur<strong>in</strong>ame is h<strong>in</strong><strong>de</strong>red by the lack <strong>of</strong> law enforcement, lack <strong>of</strong> fund<strong>in</strong>g andlack <strong>of</strong> <strong>in</strong>stitutional capacity, as well as the difficulty to monitor remote land use activities. Monitor<strong>in</strong>g <strong>of</strong>gold m<strong>in</strong><strong>in</strong>g <strong>in</strong>si<strong>de</strong> reserves, would be feasible with frequent high resolution (e.g < 10m) satellite26 | P a g e
Figure 16. Simulated landscape for 2020 un<strong>de</strong>r the historical scenario for Afobaka subsetInformation on the vulnerability <strong>of</strong> areas to threats such as forest clear<strong>in</strong>g due to gold m<strong>in</strong><strong>in</strong>g has beeni<strong>de</strong>ntified as important for prioritiz<strong>in</strong>g conservation action. <strong>Spatial</strong> explicit assessments <strong>of</strong> <strong><strong>de</strong>forestation</strong>are important plann<strong>in</strong>g tools <strong>in</strong>dicat<strong>in</strong>g where conversion <strong>of</strong> forested ecosystems is more likely to occur <strong>in</strong>the near future. Although the predictions <strong>in</strong> this study need to be ref<strong>in</strong>ed as improved data for futureprojection becomes available, the areas predicted as vulnerable are consistent with the actual patterns <strong>of</strong><strong><strong>de</strong>forestation</strong> <strong>in</strong> Sur<strong>in</strong>ame.5.1. <strong>Spatial</strong> patterns <strong>of</strong> <strong><strong>de</strong>forestation</strong>: qualitative assessment-Accord<strong>in</strong>g to the different types <strong>of</strong> clearance shown <strong>in</strong> figure 18 an island-pattern <strong>of</strong> <strong><strong>de</strong>forestation</strong> isobserved with conversion <strong>of</strong> the <strong>in</strong>terior core <strong>in</strong>to edge habitat particularly with <strong><strong>de</strong>forestation</strong> m<strong>in</strong><strong>in</strong>g.Along the upper Sur<strong>in</strong>ame river a typical diffuse-pattern is recognized, <strong>in</strong> which small patches are<strong>de</strong>forested for subsistence. Along roads a narrow corridor-pattern is i<strong>de</strong>ntified and associated with a veryslow progress<strong>in</strong>g colonization frontier, especially along the Afobaka road. A more geometric-pattern <strong>of</strong><strong><strong>de</strong>forestation</strong> occurs <strong>in</strong> the “open savanna” area. This geometric case is commonly associated with largescaleclear<strong>in</strong>gs for mo<strong>de</strong>rn sector activities, but <strong>in</strong> the present case this shape is connected with acomb<strong>in</strong>ation <strong>of</strong> human factors and biophysical features related to fire prone vegetation.28 | P a g e
Figure 17. Simulated landscape for 2020 un<strong>de</strong>r the historical scenario for Atjoni subset29 | P a g e
Figure 18. Characteristic spatial <strong><strong>de</strong>forestation</strong> patterns recognized across the tropical belt (Mertens and Lamb<strong>in</strong> 1997 <strong>Spatial</strong>patterns <strong>of</strong> <strong><strong>de</strong>forestation</strong>, p 149 ). The patterns observed <strong>in</strong> the study area are geometric, corridor, diffuse and Island.In general the <strong><strong>de</strong>forestation</strong> pattern is one <strong>of</strong> a cont<strong>in</strong>uous matrix <strong>of</strong> forest perforated with island <strong>of</strong><strong><strong>de</strong>forestation</strong> and white sand “open savannah” areas. Deforestation patterns are spatial <strong>in</strong>dicators <strong>of</strong> the<strong><strong>de</strong>forestation</strong> processes or events that are lead<strong>in</strong>g the <strong>de</strong>cay <strong>of</strong> the forest ecosystem and therefore an<strong>in</strong>dication <strong>of</strong> the evolv<strong>in</strong>g <strong><strong>de</strong>forestation</strong> frontier. Usually <strong><strong>de</strong>forestation</strong> is localized <strong>in</strong> frontiers which areareas that respond to the dynamics <strong>of</strong> the <strong>drivers</strong> <strong>of</strong> change. In this study the <strong><strong>de</strong>forestation</strong> frontier islocalized <strong>in</strong> the forest edges surround<strong>in</strong>g Gros Rosebel, Brownsweg and M<strong>in</strong>dr<strong>in</strong>itie m<strong>in</strong><strong>in</strong>g sites fromwhere forest cover removal is progress<strong>in</strong>g outwardly.Deforestation tends to spread from previous forest clear<strong>in</strong>gs where more edge per unit area is exposed andthus hold<strong>in</strong>g a high spatial probability <strong>of</strong> forest loss (Fig 10). The results <strong>of</strong> the analysis show that by2020 <strong><strong>de</strong>forestation</strong> would expand up to 1 km from previously <strong>de</strong>forested patches. Cont<strong>in</strong>uous areas <strong>of</strong>forest overlapp<strong>in</strong>g with the greenstone belt <strong>in</strong> Sur<strong>in</strong>ame are be<strong>in</strong>g perforated and progressively creat<strong>in</strong>gedge habitat. Altered physical conditions nearby the edges may affect structure, reproduction anddistribution <strong>of</strong> vegetation. Also tree fall and mortality <strong>in</strong>creases and substantial effects <strong>in</strong> the reproduction<strong>of</strong> plants may occur. Sensitive plants species <strong>de</strong>cl<strong>in</strong>e or become absent <strong>in</strong> the edges (Laurance et al.2002).30 | P a g e
ForestedgeFigure 19. Representation <strong>of</strong> the fragmentation pattern due to gold m<strong>in</strong><strong>in</strong>g activities5.2. Drivers <strong>of</strong> <strong><strong>de</strong>forestation</strong>Proximate <strong>drivers</strong>Proximate factors <strong>of</strong> <strong><strong>de</strong>forestation</strong> are those orig<strong>in</strong>ated from human activities that have an immediatedirect effect on forest cover change. In other words, proximate factors are land uses that cause a change<strong>in</strong> land cover. In terms <strong>of</strong> scale they are seen to operate at the local level (Geist and Lamb<strong>in</strong> 2001).RoadsRoad build<strong>in</strong>g has been a key <strong>de</strong>term<strong>in</strong>ant <strong>of</strong> <strong><strong>de</strong>forestation</strong> <strong>in</strong> the Amazon (Mertens and Lamb<strong>in</strong>, 1997;Kaimowitz and Angelsen, 1998; Nepstad et al 2001; Laurence et al 2002, 2009; Soares-Filho et al 2004,2006,). However, roads alonedo not expla<strong>in</strong> <strong><strong>de</strong>forestation</strong>;they work <strong>in</strong> comb<strong>in</strong>ation withother proximate factors (e.g.soil fertility) and un<strong>de</strong>rly<strong>in</strong>gforces (e.g. economic growth,production <strong>in</strong>centives, marketexpansions, populationSource: Sara Ramirez-Gomezpressure). The effects <strong>of</strong> theroads (namely Paranam-Afobaka and Brownsweg-Atjoniroads) on forest cover change <strong>in</strong> Sur<strong>in</strong>ame over the period analyzed <strong>de</strong>creases rapidly beyond distances <strong>of</strong>1 to 2 kilometer from the road (Fig 14) <strong>in</strong> contrast similar studies have found that <strong>in</strong> the Amazon (Brazil31 | P a g e
and Peru) the probability <strong>of</strong> <strong><strong>de</strong>forestation</strong> is high with<strong>in</strong> 20 km from the ma<strong>in</strong> road <strong>in</strong> average (Laurenceet al 2001, Soares-Filho et al 2006, Guidice et al 2009).In Sur<strong>in</strong>ame, between 2005 and 2020 little correlation between <strong><strong>de</strong>forestation</strong> and distance to ma<strong>in</strong> roadwas observed. The ma<strong>in</strong> reason that could expla<strong>in</strong> this fact is that <strong>in</strong> the forested part <strong>of</strong> the country thereis low population pressure as the 90% <strong>of</strong> the total population is located <strong>in</strong> the coastal zone. Therefore,there is very little colonization and no <strong>in</strong>centives to move the <strong><strong>de</strong>forestation</strong> front <strong>de</strong>ep <strong>in</strong>to the forest<strong>in</strong>terior as there is plenty <strong>of</strong> land to colonize parallel to the ma<strong>in</strong> road. Regard<strong>in</strong>g distance to secondaryroads, the situation is similar. Secondary roads <strong>in</strong> the study area are built to reach m<strong>in</strong>eral exploitationsites or logg<strong>in</strong>g areas and due to low <strong>de</strong>mographic pressure, no mov<strong>in</strong>g colonization front was observed.Notwithstand<strong>in</strong>g, it is important to note that this study is not observ<strong>in</strong>g the effect <strong>of</strong> road pav<strong>in</strong>g as thepavement <strong>of</strong> Afobaka road f<strong>in</strong>ished by the end <strong>of</strong> 2009 and the pav<strong>in</strong>g <strong>of</strong> the road to Atjoni is still un<strong>de</strong>rway. Dur<strong>in</strong>g field trips <strong>in</strong> the study area <strong>in</strong> the first semester <strong>of</strong> 2010, some land claims were <strong>de</strong>tectedmost probable people claim<strong>in</strong>g ancestral rights (Kennet Tjon, pers. Comm.). New large clear<strong>in</strong>gs werealso observed along the paved Afobaka road for hous<strong>in</strong>g projects.In synthesis, accord<strong>in</strong>g to this analysis, the road from Paranam to Atjoni has not been a strong driver <strong>of</strong><strong><strong>de</strong>forestation</strong> over the period <strong>of</strong> observation (2005-2009). However, the landscape observed <strong>in</strong> 2005reflects cumulative <strong><strong>de</strong>forestation</strong> prior to 2005. Thus, it is likely that before 2005 the correlation between<strong><strong>de</strong>forestation</strong> and distance to roads was stronger and expla<strong>in</strong><strong>in</strong>g the <strong>de</strong>forested patches along the roadsprior to that year. In a similar way, the results <strong>of</strong> the analysis regard<strong>in</strong>g road could be different if weperform this study with<strong>in</strong> two or three years more (e.g. 2005-2013) which could reflect the cumulative<strong><strong>de</strong>forestation</strong> after road pav<strong>in</strong>g. Hence, the driv<strong>in</strong>g forces <strong>of</strong> <strong><strong>de</strong>forestation</strong>, for <strong>in</strong>stance roads, result fromthe complex <strong>in</strong>teraction <strong>of</strong> socio-political and economic processes act<strong>in</strong>g at multi-temporal and multispatialscales, therefore, it will be simplistic to conclu<strong>de</strong> that roads do not exert an effect on forest coverchange <strong>in</strong> Sur<strong>in</strong>ame; more variables over different time periods would have to be analyzed (Etter et al2005).Likewise, the situation could turn <strong>in</strong>to a dist<strong>in</strong>ctive pattern as the road is exten<strong>de</strong>d to the Southern part <strong>of</strong>the country and furthermore if this is connected with roads <strong>in</strong> Brazil. The extension and pavement <strong>of</strong> theroads <strong>in</strong> the <strong>in</strong>terior <strong>of</strong> the country would undoubtedly create access for poachers, m<strong>in</strong>ers, loggers, oilcorporations and agribus<strong>in</strong>ess to remote and well preserved forest areas <strong>of</strong> the country. This can beforeseen un<strong>de</strong>r a policy climate <strong>of</strong> economic growth based on natural resource extraction, s<strong>in</strong>ce the impact<strong>of</strong> road construction on <strong><strong>de</strong>forestation</strong> <strong>de</strong>pends on the economic activities <strong>in</strong> a given region (e.g m<strong>in</strong>eralexploitation vs logg<strong>in</strong>g) (Lamb<strong>in</strong> and Ehrlich 1997). Road construction <strong>in</strong> forested areas <strong>de</strong>term<strong>in</strong>ately<strong>in</strong>creases the <strong>in</strong>centives to convert them to other uses by <strong>of</strong>fer<strong>in</strong>g improved market<strong>in</strong>g opportunities andlower<strong>in</strong>g the cost <strong>of</strong> access and land clear<strong>in</strong>g (either for productive or speculative purposes).In<strong>de</strong>ed, the <strong>de</strong>velopment and improvement <strong>of</strong> transportation <strong>in</strong>frastructure tends to be one <strong>of</strong> the mosteffective policy tools for <strong>in</strong>fluenc<strong>in</strong>g the spatial distribution <strong>of</strong> agricultural, m<strong>in</strong><strong>in</strong>g and forestry activities.But the role and impact <strong>of</strong> roads will <strong>de</strong>pend on the type <strong>of</strong> road, the stage <strong>of</strong> <strong>de</strong>velopment <strong>of</strong> the frontierarea and especially, it will <strong>de</strong>pend on the policy-economic climate (see session below about un<strong>de</strong>rly<strong>in</strong>g<strong>drivers</strong>).32 | P a g e
In the case <strong>of</strong> other accessibility variables like distance to rivers, <strong><strong>de</strong>forestation</strong> was found positivecorrelated at major distances from navigable rivers > 2 km. This pattern was found <strong>in</strong> the Atjoni subsetand it was expected s<strong>in</strong>ce the Sur<strong>in</strong>ame River is the ma<strong>in</strong> transportation <strong>in</strong>frastructure for <strong>in</strong>habitants <strong>in</strong>the area. Furthermore, people can access major distance towards the forest <strong>in</strong>terior us<strong>in</strong>g navigabletributaries. Incentives to <strong>de</strong>forest at major distances from navigable rivers are connected to shift<strong>in</strong>gcultivation activities.Gold m<strong>in</strong><strong>in</strong>gGold m<strong>in</strong><strong>in</strong>g is <strong>in</strong>si<strong>de</strong> the group <strong>of</strong> proximate <strong>drivers</strong> <strong>of</strong> <strong><strong>de</strong>forestation</strong>, particularly referr<strong>in</strong>g to theextension <strong>of</strong> private enterprise <strong>in</strong>frastructure (Geist and Lamb<strong>in</strong> 2001). M<strong>in</strong><strong>in</strong>g is an important economicactivity <strong>in</strong> Sur<strong>in</strong>ame where Precambrian rocks hold strategically important reserves <strong>of</strong> <strong>in</strong>dustrial m<strong>in</strong>eralsthat have become essential for mo<strong>de</strong>rn technology (gold, bauxite, iron ore, manganese, z<strong>in</strong>c and copper).Although the greatest volume <strong>of</strong> gold is produced by <strong>in</strong>dustrial m<strong>in</strong>es, small-scale gold m<strong>in</strong><strong>in</strong>g is acommon activity <strong>in</strong> the Amazon where gold m<strong>in</strong>ers extract the m<strong>in</strong>eral from alluvial sediments us<strong>in</strong>grudimentary m<strong>in</strong><strong>in</strong>g technology andmercury to amalgamate the gold.Gold m<strong>in</strong><strong>in</strong>g <strong>in</strong> the study area hasfound to be the ma<strong>in</strong> direct precursor<strong>of</strong> <strong><strong>de</strong>forestation</strong> over the periodanalyzed (2005-2009). This can beseen <strong>in</strong> the weights <strong>of</strong> evi<strong>de</strong>ncecoefficient (Fig 11 and 12 ), whichreflects that most pixels chang<strong>in</strong>gfrom forest to <strong>de</strong>forested over 2005 to2009 where located <strong>in</strong>si<strong>de</strong> goldm<strong>in</strong><strong>in</strong>g areas. As expla<strong>in</strong>ed <strong>in</strong>Source: Kenneth Tjonprevious sessions, these hot spots <strong>of</strong><strong><strong>de</strong>forestation</strong> co<strong>in</strong>ci<strong>de</strong> with the Gros Rosebel, Brownsweg and M<strong>in</strong>dr<strong>in</strong>itie m<strong>in</strong><strong>in</strong>g sites.Gold m<strong>in</strong><strong>in</strong>g <strong>in</strong> the study area spans large areas <strong>of</strong> forest, leav<strong>in</strong>g bare surface scars <strong>of</strong> up to 5 kilometerswi<strong>de</strong> with almost no rema<strong>in</strong><strong>in</strong>g tree cover. The area <strong>de</strong>dicated to gold m<strong>in</strong><strong>in</strong>g <strong>in</strong> the study subsets, has<strong>in</strong>creased up to 5,421.8 hectares from 2000 to 2008 (Fig20), reflect<strong>in</strong>g a threefold <strong>in</strong>crease approximately. M<strong>in</strong><strong>in</strong>gis caus<strong>in</strong>g <strong><strong>de</strong>forestation</strong> by tree fell<strong>in</strong>g and land stripp<strong>in</strong>g <strong>in</strong>preparation for m<strong>in</strong><strong>in</strong>g (Heemskerk 2001). Results <strong>of</strong> thisanalysis show that m<strong>in</strong><strong>in</strong>g operations <strong>of</strong>ten radiates beyondm<strong>in</strong><strong>in</strong>g sites, the best example <strong>of</strong> it is gold m<strong>in</strong><strong>in</strong>g <strong>in</strong>si<strong>de</strong>Brownsberg Nature Park where dur<strong>in</strong>g the past 10 yearssmall scale-gold m<strong>in</strong><strong>in</strong>g has been illegally practiced with<strong>in</strong>this park (Arets et al 2006). It has been estimated from<strong><strong>de</strong>forestation</strong> scars <strong>in</strong> satellite picture (Tjon andAtmopawiro 2006) that <strong>in</strong> year 1999, 571 hectares (4% <strong>of</strong>Figure 20. Area <strong>de</strong>dicated to gold m<strong>in</strong><strong>in</strong>g,observations for two time periods <strong>in</strong> the studyarea. WWF 2010.33 | P a g e
the total area <strong>of</strong> the park) were directly affected by gold m<strong>in</strong><strong>in</strong>g, <strong>in</strong> 2002 the area expan<strong>de</strong>d 43.4 hectaresand <strong>in</strong> 2004 46.4 hectares more were directed impacted.The synergies between gold m<strong>in</strong><strong>in</strong>g prices and <strong><strong>de</strong>forestation</strong> could be threaten<strong>in</strong>g forest ecosystemoverlay<strong>in</strong>g with greenstone formation <strong>in</strong> Sur<strong>in</strong>ame. Therefore, sound forest management effectiveness isun<strong>de</strong>r pressure if the surface and subsurface land uses overlap (Hammond et al 2007). The clash isexacerbated with the participation <strong>of</strong> cooperative m<strong>in</strong>ers from Brazil known as garimpeiros who have ahistory <strong>of</strong> creat<strong>in</strong>g “gold rushes” <strong>in</strong> the Amazon wil<strong>de</strong>rness; the <strong>in</strong>tensity <strong>of</strong> garimpeiros m<strong>in</strong><strong>in</strong>gfluctuates with the <strong>in</strong>ternational price <strong>of</strong> gold (Killeen 2007). Similarly, the conflict between gold m<strong>in</strong><strong>in</strong>gand protected areas management is an issue that should be resolved, so that m<strong>in</strong><strong>in</strong>g exempt from any sort<strong>of</strong> activity <strong>in</strong>si<strong>de</strong> legally protected ecosystems.Logg<strong>in</strong>gSource: Sarah Crabbeexpands (Merry et al 2009).Wood extraction is a proximate driver <strong>of</strong> <strong><strong>de</strong>forestation</strong><strong>of</strong> high relevance <strong>in</strong> tropical forest regions (Geist andLamb<strong>in</strong>, 2001). Unlike other Amazon countries likeBrazil, <strong>in</strong> the study area there was no a positivecorrelation between logg<strong>in</strong>g operations and<strong><strong>de</strong>forestation</strong> over the period 2005-2009. Logg<strong>in</strong>goperations exert an effect on <strong><strong>de</strong>forestation</strong> when<strong>in</strong>tense activity cause collateral damage to trees,canopy damage and forest impoverishment leav<strong>in</strong>g theforest susceptible to fire un<strong>de</strong>r dry climatic conditions(Nepstad et al 2001). If canopy damage level is low,then selective logg<strong>in</strong>g has relatively small immediateand long term impacts on forest resources (Asner et al2006). Likewise, <strong><strong>de</strong>forestation</strong> and logg<strong>in</strong>g activitiesare usually positive correlated when there are otherpr<strong>of</strong>itable <strong>in</strong>centives encourag<strong>in</strong>g the conversion <strong>of</strong>forest <strong>in</strong>to other land uses (e.g agriculture, large scaleplantation), if roads are built and population pressureIn Sur<strong>in</strong>ame, logg<strong>in</strong>g operations have been low impact activities carried out <strong>in</strong> a selective way by smallscalecompanies and are characterized by low harvest<strong>in</strong>g <strong>in</strong>tensities. Vegetation recoveries <strong>in</strong> gaps and onskid trails have followed timber extraction because <strong>of</strong> the low timber <strong>in</strong>tensity (25 years-cutt<strong>in</strong>g cycle). Ingeneral the forest <strong>in</strong> Sur<strong>in</strong>ame is un<strong>de</strong>rutilized regard<strong>in</strong>g timber production; the susta<strong>in</strong>able potential <strong>of</strong>the forest <strong>in</strong> the country could be few times larger than the current production level <strong>of</strong> 150,000 m 3<strong>in</strong>clud<strong>in</strong>g the present area issued for exploitation (SBB, 2006-National Forest Policy <strong>of</strong> Sur<strong>in</strong>ame).Large scale timber companies (e.g. Ch<strong>in</strong>ese) have faced constra<strong>in</strong>ts to be able to operate because theyhave not met the required criteria from the National government and, <strong>in</strong> the other hand, local companiesface difficulties because the policy climate regard<strong>in</strong>g the timber sector, has not favored availability <strong>of</strong>34 | P a g e
credit. Another relevant limitation has been the lack <strong>of</strong> appropriate <strong>in</strong>frastructure (Kenneth Tjon, pers.Comm.). Timber exploitation <strong>in</strong> Sur<strong>in</strong>ame might be stimulated with <strong>in</strong>vestment capital, knowledge andaccess <strong>of</strong> <strong>in</strong>ternational markets, the capacity to manage large company and enforcement <strong>of</strong> humancapacity. Timber production may also be stimulated with the expansion <strong>of</strong> roads (IIRSA roads and theNorth-South Corridor) which is expected to improve the quality <strong>of</strong> <strong>in</strong>frastructure for heavy transport.The above mentioned reasons could have <strong>in</strong>fluenced the non-exist<strong>in</strong>g effects <strong>of</strong> logg<strong>in</strong>g on <strong><strong>de</strong>forestation</strong>dur<strong>in</strong>g this analysis and. Deforestation was not <strong>de</strong>tected because it is not carried out <strong>in</strong> large scales,because the <strong>in</strong>tensity <strong>of</strong> the activities are too low to cause forest damage and consequently a forestdieback (see Nepstad et al 2008 for the dieback concept) and because there are no other variables, likefragmentation, population pressure and policy-<strong><strong>de</strong>forestation</strong> <strong>in</strong>centive, play<strong>in</strong>g a role <strong>in</strong> the synergismbetween timber production and <strong><strong>de</strong>forestation</strong>.Nevertheless, more accurate conclusions about the impact <strong>of</strong> logg<strong>in</strong>g on forest cover change could bedrawn if the assessment is done by high-resolution satellite analysis able to <strong>de</strong>tect skid trails and logland<strong>in</strong>gs and if the forest cover change assessment <strong>in</strong>clu<strong>de</strong>s <strong>de</strong>gradation by forest impoverishment,canopy damage and <strong>in</strong>duced tree mortality. It is important to mention that these conclusions are based onthe results over the period <strong>of</strong> study (2005-2009). Some relatively large logg<strong>in</strong>g related <strong><strong>de</strong>forestation</strong> was<strong>de</strong>tected dur<strong>in</strong>g a field trip <strong>in</strong> 2010 to the study area <strong>in</strong>si<strong>de</strong> a timber concession.Un<strong>de</strong>rly<strong>in</strong>g <strong>drivers</strong> <strong>of</strong> <strong><strong>de</strong>forestation</strong>Un<strong>de</strong>rly<strong>in</strong>g <strong>drivers</strong> <strong>of</strong> <strong><strong>de</strong>forestation</strong> are the political, <strong>in</strong>stitutional and economic factors that uncha<strong>in</strong> theproximate <strong>drivers</strong> <strong>of</strong> forest cover change (Geist and Lamb<strong>in</strong>, 2001). The ma<strong>in</strong> un<strong>de</strong>rly<strong>in</strong>g factor <strong>de</strong>f<strong>in</strong>ed<strong>in</strong> this work is the unstable policy climate prompt<strong>in</strong>g forest mismanagement.The <strong>drivers</strong> <strong>of</strong> <strong><strong>de</strong>forestation</strong> <strong>in</strong>advertently pose a significant challenge <strong>in</strong> the management <strong>of</strong> naturalresources because lack <strong>of</strong> capacity and appropriate policies <strong>in</strong> the country can stimulates the expand<strong>in</strong>gnatural resources exploitation like the ongo<strong>in</strong>g gold rush across greenstone <strong>de</strong>posits. In the case <strong>of</strong> goldm<strong>in</strong><strong>in</strong>g, the challenge resi<strong>de</strong>s <strong>in</strong> the Government capacity to mitigate this global driver <strong>of</strong> change bystrengthen<strong>in</strong>g regulatory policies and re<strong>in</strong>forc<strong>in</strong>g forest governance capacity. Overall the challengeresi<strong>de</strong>s, especially regard<strong>in</strong>g illegal gold m<strong>in</strong><strong>in</strong>g, <strong>in</strong> the alleviation <strong>of</strong> poverty, <strong>in</strong> <strong>de</strong>terr<strong>in</strong>g unemployment,enhanc<strong>in</strong>g quality <strong>of</strong> life and <strong>in</strong> improv<strong>in</strong>g education and social awareness (Heemskerk 2001).Unsusta<strong>in</strong>able land use practices like high-impact gold m<strong>in</strong><strong>in</strong>g are fostered by a climate <strong>of</strong> poor<strong>in</strong>stitutional performance, lack <strong>of</strong> technical capacity and <strong>in</strong>effective laws. Un<strong>de</strong>r this policy climate theeffectiveness to manage large areas <strong>of</strong> <strong>in</strong>tact tropical forest overlapp<strong>in</strong>g with primary m<strong>in</strong><strong>in</strong>g targets isunlikely to succeed as the gold rush cont<strong>in</strong>ues. In Sur<strong>in</strong>ame, there is an urgent need to re<strong>in</strong>force regulation<strong>of</strong> m<strong>in</strong><strong>in</strong>g concessions and operations both <strong>in</strong> protected and unprotected forest. It is relevant to <strong>de</strong>sign and<strong>in</strong>corporate land use zon<strong>in</strong>g <strong>in</strong>clud<strong>in</strong>g the creation <strong>of</strong> protected areas <strong>of</strong> different categories. It is alsorelevant to <strong>de</strong>velop the capacity <strong>of</strong> governmental <strong>in</strong>stitutions to effectively manage forest and effectivelycoord<strong>in</strong>ate conflict<strong>in</strong>g land use allocation through balanced land-use zon<strong>in</strong>g process. Moreover, toenhance the management <strong>of</strong> exist<strong>in</strong>g protected areas overlapp<strong>in</strong>g with greenstone <strong>de</strong>posits. It isimperative the need <strong>of</strong> creat<strong>in</strong>g new areas <strong>of</strong> protection that can buffer the rapid change <strong>in</strong> forest cover35 | P a g e
due to gold m<strong>in</strong><strong>in</strong>g activities. These areas could also eventually buffer the effect <strong>of</strong> future <strong>in</strong>frastructure<strong>de</strong>velopments which are expected to trigger the dormant impacts <strong>of</strong> roads <strong>in</strong> the study area.36 | P a g e
6. CONCLUSIONSDeforestation rates <strong>in</strong> the study area are closely related to the spatial patterns <strong>of</strong> forest cover encountered<strong>in</strong> the region where cont<strong>in</strong>uous areas <strong>of</strong> forest experience change at a relatively low rate. However, goldforest areas overlapp<strong>in</strong>g with the greenstone belt <strong>in</strong> Sur<strong>in</strong>ame are be<strong>in</strong>g perforated and progressivelycreat<strong>in</strong>g edge habitat. From these exposed edges the probability <strong>of</strong> <strong><strong>de</strong>forestation</strong> maximizes po<strong>in</strong>t<strong>in</strong>g out<strong><strong>de</strong>forestation</strong> hot spots <strong>in</strong> the country.The driv<strong>in</strong>g forces <strong>of</strong> <strong><strong>de</strong>forestation</strong> <strong>in</strong> this study result from the <strong>in</strong>teraction <strong>of</strong> socio-political an<strong>de</strong>conomic processes with land uses. The major driver <strong>of</strong> <strong><strong>de</strong>forestation</strong> is gold m<strong>in</strong><strong>in</strong>g with concentration<strong>of</strong> forest cover change with<strong>in</strong> the Gros Rosebel, Brownsweg and M<strong>in</strong>dr<strong>in</strong>itie regions which is consistentwith the location <strong>of</strong> gold <strong>de</strong>posits. These areas might constitute the spread<strong>in</strong>g source <strong>of</strong> future<strong><strong>de</strong>forestation</strong> trajectories. Some <strong><strong>de</strong>forestation</strong> is also found along the savanna-forest ecotone where the<strong>de</strong>struction <strong>of</strong> savanna forest is progressively spread<strong>in</strong>g out a savannization process.Little correlation was found between roads and <strong><strong>de</strong>forestation</strong> over the period analyzed, thus roads are notthe ma<strong>in</strong> driver <strong>of</strong> <strong><strong>de</strong>forestation</strong> <strong>in</strong> this analysis. However, they may exert a major impact as Sur<strong>in</strong>ame’seconomy grows and moreover if road networks extent to neighbour<strong>in</strong>g countries which would add a newdimension to the socio-economic dynamics <strong>of</strong> forest cover change <strong>in</strong> Sur<strong>in</strong>ame.Deforestation reaches <strong>in</strong>si<strong>de</strong> protected areas which reflects low level <strong>of</strong> protection. Governance can beviewed not only as a factor <strong>in</strong>hibit<strong>in</strong>g the effects <strong>of</strong> economic activities along <strong><strong>de</strong>forestation</strong> frontiers butalso as a force counteract<strong>in</strong>g the spread<strong>in</strong>g effect <strong>of</strong> <strong><strong>de</strong>forestation</strong> <strong>in</strong>si<strong>de</strong> natural protected areas.Deforestation <strong>in</strong> the study area is and will be stimulated by a gold rush on greenstone <strong>de</strong>posits at a scaleand rates that policy <strong>in</strong>terventions have not been effective to foreseen and mitigate. Deforestation tends to<strong>in</strong>crease as economic forces prompt<strong>in</strong>g market growth exert pressure. The results <strong>of</strong> this analysis showthat as this trend cont<strong>in</strong>ues, as the force <strong>of</strong> governance grows more slowly than the force <strong>of</strong> exploitation,the forest overlapp<strong>in</strong>g the greenstone belt is un<strong>de</strong>r serious threat with all the un<strong>de</strong>sirable consequences forthe forest ecosystem services and livelihoods. This type <strong>of</strong> study can be used as an <strong>in</strong>strument to supportconservation management <strong>of</strong> this vital ecosystem.37 | P a g e
REFERENCESArets, E, van <strong>de</strong>r Meer, P. Natural recovery <strong>of</strong> vegetation at abandoned m<strong>in</strong><strong>in</strong>g sites at BrownsbergNatural Park. In: Arets, E., van <strong>de</strong>r Meer P.J., van <strong>de</strong>n Br<strong>in</strong>ks, N.W., Tjon, K., Atmopawiro, V. andOuboter, P.E. 2006. Assessment <strong>of</strong> the impacts <strong>of</strong> gold m<strong>in</strong><strong>in</strong>g on soil and vegetation <strong>in</strong> BrownsbergNatural Park. Alterra Publication, Wagenn<strong>in</strong>gen, NL.Asner, G.P., E.N. Broadbent, P.J.C. Oliveira, D.E. Knapp, M. Keller, and J.N. Silva. 2006. Condition andfate <strong>of</strong> logged forest <strong>in</strong> the Brazilian Amazon. Proceed<strong>in</strong>gs <strong>of</strong> the National Aca<strong>de</strong>my <strong>of</strong> Sciences.103(34):12947-12950Asner, G.P., D.E. Knapp, A. Balaji, G. Páez-Acosta. 2009. Automated mapp<strong>in</strong>g <strong>of</strong> tropical <strong><strong>de</strong>forestation</strong>and forest <strong>de</strong>gradation: CLASlite. Journal <strong>of</strong> Applied Remote Sens<strong>in</strong>g, vol. 3 (033543), 24pp.Donselaar, J. v., and B. Hu<strong>in</strong><strong>in</strong>k 1966. Structure, root systems and periodicity <strong>of</strong> savanna plants andvegetation <strong>in</strong> Northern Sur<strong>in</strong>ame. Van Ee<strong>de</strong>nfonds, Amsterma, Netherland.Etter, A., C. McAlp<strong>in</strong>e, K. Wilson, S. Ph<strong>in</strong>n, and H. Poss<strong>in</strong>gham. 2006. Regional patterns <strong>of</strong> agriculturalland use and <strong><strong>de</strong>forestation</strong> <strong>in</strong> Colombia. Agriculture, Ecosystems and Environment 114:369-386.Etter, A., C. McAlp<strong>in</strong>e, S. Ph<strong>in</strong>n, D. Pullar and H. Poss<strong>in</strong>gham 2006. Unplanned land clear<strong>in</strong>g <strong>of</strong>Colombian ra<strong>in</strong>forest: spread<strong>in</strong>g like disease? Landscape and Urban Plann<strong>in</strong>g 77: 240-254.Foley JA, DeFries R, Asner GP, et al. 2005. Global consequences <strong>of</strong> land use. Science 309: 570–74.Foley JA, Asner GP, Costa MH, et al. 2007. Amazonia revealed:forest <strong>de</strong>gradation and loss <strong>of</strong> ecosystemgoods and services <strong>in</strong> the Amazon Bas<strong>in</strong>. Front Ecol Environ 5: 25–32.Geist, H. J. & Lamb<strong>in</strong>, E. F. 2001. What drives tropical <strong><strong>de</strong>forestation</strong>. A metaanalysis <strong>of</strong> proximate andun<strong>de</strong>rly<strong>in</strong>g causes <strong>of</strong> <strong><strong>de</strong>forestation</strong> based on subnational case study evi<strong>de</strong>nce. In: LUCC Report, p. 116.Louva<strong>in</strong>-la-Neuve: LUCC International Project.Giudice, R 2009. Conservation <strong>in</strong> Southeastern Peruvian Amazon: Two approaches. Thesis (Msc). School<strong>of</strong> Biological Sciences. University <strong>of</strong> East Anglia.Hammond, D., Gond, V., <strong>de</strong> Thoisy, B., Forget, P.M and De Dijn B. 2007. Causes and consequences <strong>of</strong> atropical gold rush <strong>in</strong> the Guiana Shield, South America. AMBIO: A Journal <strong>of</strong> the Human Environment36(8):661-670.Heemskerk, M. 2001. Do <strong>in</strong>ternational commodity prices drive natural resource booms? An empiricalanalysis <strong>of</strong> small-scale gold m<strong>in</strong><strong>in</strong>g <strong>in</strong> Sur<strong>in</strong>ame. Ecol. Econ. 39:295–308.Heyligers, P. C. 1963. Vegetation and soil <strong>of</strong> a white-sand savanna <strong>in</strong> Sur<strong>in</strong>ame. Van Ee<strong>de</strong>nfondsAmsterdam .38 | P a g e
Jansma, R. 1994. Ecology <strong>of</strong> some Northern Sur<strong>in</strong>ame Savannas. Koeltz Scientific Books, Koenigste<strong>in</strong>,Germany.Kaimowitz, D. & Angelsen, A. 1998. Economic mo<strong>de</strong>ls <strong>of</strong> tropical <strong><strong>de</strong>forestation</strong>: a review. Bogor,Indonesia: CIFOR.Killeen TJ 2007. A Perfect Storm <strong>in</strong> the Amazon Wil<strong>de</strong>rness: Development and Conservation <strong>in</strong> theContext <strong>of</strong> the Initiative for the Integration <strong>of</strong> the Regional Infrastructure <strong>of</strong> South America (IIRSA).Wash<strong>in</strong>gton DC: Conservation International. 79 p.Kitco.2005. Gold Prices: London PM Fix, 1995−Present (http://www.kitco.com)Lamb<strong>in</strong>, E.F., Ehrlich, D., 1997. The i<strong>de</strong>ntification <strong>of</strong> tropical <strong><strong>de</strong>forestation</strong> fronts at broad spatial scales.Int. J. Remote Sens. 18, 3551–3568.Laurance, W. F., Cochrane, M. A., Bergen, S., Fearnsi<strong>de</strong>, P. M., Delamonica, P., Barber, C., D'Angelo, S.& Fernan<strong>de</strong>s, T. 2001. Environment: The Future <strong>of</strong> the Brazilian Amazon. Science 291(5503): 438-439.Laurance, W. F., A. K. Albernaz, G. Schroth, P. Fearnsi<strong>de</strong>, S. Bergen, E. M. Ventic<strong>in</strong>que, and C. DaCosta. 2002. Predictors <strong>of</strong> <strong><strong>de</strong>forestation</strong> <strong>in</strong> the Brazilian Amazon. Journal <strong>of</strong> Biogepgraphy 29:737-748Laurance, W. F 2008. The real cost <strong>of</strong> m<strong>in</strong>erals. NewScientist. Volume 2669 (issue August 16).Laurance; W. F., Goosem; M. and Laurance. W. 2009. Impacts <strong>of</strong> roads and l<strong>in</strong>ear clear<strong>in</strong>gs on tropicalforest. Trends In Ecology & Evolution; Volume:24 (Issue:12) Pages:659-669,Lu<strong>de</strong>ke, A.K., Maggio, R.C., Reid, L.M., 1990. An analysis <strong>of</strong> anthropogenic <strong><strong>de</strong>forestation</strong> us<strong>in</strong>g logisticregression and GIS. J.Environ. Manage. 31, 247–259.Merry, F.; Soares Filho, B. S.; Nepstad, D.; Amacher, G.; Rodrigues, H. 2009. Balanc<strong>in</strong>g Conservationand Economic Susta<strong>in</strong>ability: The Future <strong>of</strong> the Amazon Timber Industry. Environmental Management,EUA, 44 (3): 395-407.Mertens, B., and E. F. Lamb<strong>in</strong>. 1997. <strong>Spatial</strong> mo<strong>de</strong>l<strong>in</strong>g <strong>of</strong> <strong><strong>de</strong>forestation</strong> <strong>in</strong> southern Cameroon. <strong>Spatial</strong>disaggregation <strong>of</strong> diverse <strong><strong>de</strong>forestation</strong> processes. Applied Geography 14:143-162MEA (Millenium Ecosystem Assessment) 2005. Global assessment reports. Island Press.M<strong>in</strong>istry <strong>of</strong> Labour, Technological Development and Environment. National Institute for Environmentand Development <strong>in</strong> Sur<strong>in</strong>ame. 2003. Greenstone belt gold m<strong>in</strong><strong>in</strong>g. Regional environmental assessment.PlantProp Paramaribo, Sur<strong>in</strong>ame.Myers, N., 1993. Tropical forest: the ma<strong>in</strong> <strong><strong>de</strong>forestation</strong> fronts. Environ.Conserv. 20, 9–1639 | P a g e
National Institute for Space Research <strong>of</strong> Brazil (INPE) http://www.<strong>in</strong>pe.br/<strong>in</strong>gles/<strong>in</strong><strong>de</strong>x.php (June 2010)Nepstad, D., G. Carvalho, A. Barros, A. Alencar, J. Capobianco, J. Bishop, P. OMout<strong>in</strong>ho, P.Lefebvre, U.L. Silva, and E. Pr<strong>in</strong>s. 2001. Road pav<strong>in</strong>g, fire regime feedbacks, and the future <strong>of</strong> Amazon forest. ForestEcology and Management 154:395-407.Nepstad DC, Stickler CM, Soares-Filho B, and Merry F. 2008. Interactions among Amazon land use,forest and climate: prospects for a near-term forest tipp<strong>in</strong>g po<strong>in</strong>t. Philos T Roy Soc B 363: 1737–46.Ramankutty N, Gibbs HK, Achard F, et al. 2007. Challenges to estimat<strong>in</strong>g carbon emissions from tropical<strong><strong>de</strong>forestation</strong>. GlobChange Biol 13: 51–66.Romero-Calcerrada, R. and Luque, S. 2006. Habitat quality assessment us<strong>in</strong>g Weights-<strong>of</strong>-Evi<strong>de</strong>nce basedGIS mo<strong>de</strong>ll<strong>in</strong>g: The case <strong>of</strong> Picoi<strong>de</strong>s tridactylus as species <strong>in</strong>dicator <strong>of</strong> the biodiversity value <strong>of</strong> theF<strong>in</strong>nish forest. Ecological Mo<strong>de</strong>ll<strong>in</strong>g 196 62-76.SBB (Foundation for Forest Management and Production Control) and M<strong>in</strong>istry from Natural Resources2005. National Forest Policy <strong>of</strong> Sur<strong>in</strong>ame.Soares-Filho, B. S., Cerqueira, G. C. & Pennach<strong>in</strong>, C. L. 2002 DINAMICA – a stochastic cellularautomata mo<strong>de</strong>l <strong>de</strong>signed to simulate the landscape dynamics <strong>in</strong> an Amazonian colonization frontier.Ecological Mo<strong>de</strong>ll<strong>in</strong>g 154(3): 217-235.Soares-Filho, B., Alencar, A., Nepstad, D., Cerqueira, G., Diaz, M. D. V., Rivero, S., Solorzano, L. &Voll, E. 2004 Simulat<strong>in</strong>g the response <strong>of</strong> landcover changes to road pav<strong>in</strong>g and governance along a majorAmazon highway: the Santarem-Cuiaba corridor. Global Change Biology 10(5): 745-764Soares-Filho, B. S., Nepstad, D. C., Curran, L. M., Cerqueira, G. C., Garcia, R.A., Ramos, C. A., Voll, E.,McDonald, A., Lefebvre, P. & Schles<strong>in</strong>ger, P. (2006) Mo<strong>de</strong>ll<strong>in</strong>g conservation <strong>in</strong> the Amazon bas<strong>in</strong>.Nature 440(7083): 520-523.Soares-Fihlo, B. S., Rodrigues, H., Falieri, A. & Costa, W. L. 2008. DINAMICA EGO Tutorial. BeloHorizonte, MG: <strong>Centro</strong> <strong>de</strong> Sensoramiento Remoto, Universida<strong>de</strong> Fe<strong>de</strong>ral <strong>de</strong> M<strong>in</strong>as Gerais.Soares-Filho, B S., Rodriguez, H.,Costa, W.2009. Mo<strong>de</strong>l<strong>in</strong>g Environmental Dynamics with D<strong>in</strong>amicaEGO. Available at www.csr.ufmg.br/d<strong>in</strong>amica.. ISBN: 978-85-910119-0-2.Soares-filho, B.S., Mount<strong>in</strong>ho, P, Nepstad, D, An<strong>de</strong>rson, A., Rodrigues, H. Garcia, R. Dietzsch, L., MerryF., Bowman, M., Hissa, L., Silvestr<strong>in</strong>i, R., Maretti, C. 2010. Role <strong>of</strong> Brazilian Amazon protected areas <strong>in</strong>climate change mitigation. Proc Natl. Acad. Sci..Swenson, J., Carter, C., Domec, J-C, Delgado, C. 2011 Gold M<strong>in</strong><strong>in</strong>g <strong>in</strong> the Peruvian Amazon: GlobalPrices, Deforestation, and Mercury Imports. PLoS ONE 6(4):40 | P a g e
Tjon, K. and Atmopawiro, V. Area affected by gold m<strong>in</strong><strong>in</strong>g <strong>in</strong> and around Brownsberg Natural Park. In:Arets, E., van <strong>de</strong>r Meer P.J., van <strong>de</strong>n Br<strong>in</strong>ks, N.W., Tjon, K., Atmopawiro, V. and Ouboter, P.E. 2006.Assessment <strong>of</strong> the impacts <strong>of</strong> gold m<strong>in</strong><strong>in</strong>g on soil and vegetation <strong>in</strong> Brownsberg Natural Park. AlterraPublication, Wagenn<strong>in</strong>gen, NLVan Dijck, P . The IIRSA-Guiana Shield Hub, the case <strong>of</strong> Sur<strong>in</strong>ame <strong>in</strong> press.World Bank 2010. Population Statistics. http://data.worldbank.org/<strong>in</strong>dicator/EN.POP.DNST (acce<strong>de</strong>d onAugust 2011)World Gold Council 2011. Gold <strong>de</strong>mands trends second quartier 2011. www.gold.org (acce<strong>de</strong>d on Mayand August 2011).41 | P a g e
APPENDIX 1:Weights <strong>of</strong> evi<strong>de</strong>nce correlation between selected variables. Values above 0.5 <strong>in</strong>dicate correlation.First variableSecond variableJo<strong>in</strong>t <strong>in</strong>formationUncerta<strong>in</strong>tyDistance to navigable rivers Distance to Atjoni road 0,077469Distance to secondary roads 0,0617479Distance to settlements 0,2564Land use 0,0741825Vegetation types 0,0411763Distance to preoviously <strong>de</strong>forested areas 0,0137744Distance to Atjoni road Distance to secondary roads 0,363089Distance to settlements 0,0866021Land use 0,06945Vegetation types 0,0230762Distance to preoviously <strong>de</strong>forested areas 0,0169631Distance to secondary roads Distance to settlements 0,0529264Land use 0,0914002Vegetation types 0,0243419Distance to preoviously <strong>de</strong>forested areas 0,0164596Distance settlements Land use 0,0964414Vegetation types 0,0638578Distance to preoviously <strong>de</strong>forested areas 0,016412Land use Vegetation types 0,478704Distance to preoviously <strong>de</strong>forested areas 0,0237892Vegetation types Distance to preoviously <strong>de</strong>forested areas 0,03376442 | P a g e