Bogoliubov Excitations of Inhomogeneous Bose-Einstein ...
Bogoliubov Excitations of Inhomogeneous Bose-Einstein ...
Bogoliubov Excitations of Inhomogeneous Bose-Einstein ...

You also want an ePaper? Increase the reach of your titles
YUMPU automatically turns print PDFs into web optimized ePapers that Google loves.
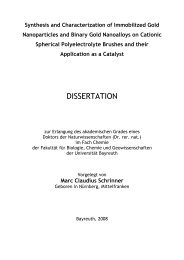
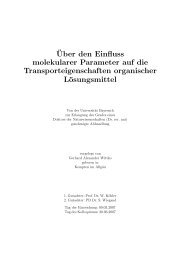
nnc(V )−nnc(0)<br />
nnc(0)<br />
1.2<br />
1.15<br />
1.1<br />
1.05<br />
0.002 0.004 0.006 0.008 0.01<br />
4.3. Numerical study <strong>of</strong> the speed <strong>of</strong> sound<br />
V 2<br />
µ 2<br />
Figure 4.11: Relative increase <strong>of</strong> the<br />
non-condensed density nnc due to<br />
disorder. With the parameters <strong>of</strong><br />
the present section σ = ξ = L/200.<br />
Note that the increase and the reference<br />
nnc(V = 0) both depend on<br />
the system size L/ξ.<br />
proportionality factor that depends logarithmically on L). As function <strong>of</strong><br />
disorder strength, the non-condensed fraction increases, but it stays within<br />
the same order <strong>of</strong> magnitude, at least in the range <strong>of</strong> parameters <strong>of</strong> the<br />
present section.<br />
4.3.4. Speed <strong>of</strong> sound as function <strong>of</strong> the correlation length<br />
Having checked the prediction at one particular value <strong>of</strong> the disorder correlation<br />
length, we now investigate different regimes <strong>of</strong> length scales. Given<br />
the condition kξ = 0.05 ≪ 1, the correlation length σ can be the shortest <strong>of</strong><br />
all length scales, larger than the healing length but shorter than the wave<br />
length, or the largest <strong>of</strong> all length scales.<br />
In the intermediate range, the full integral (3.60) interpolates between the<br />
hydrodynamic limit (4.15) and the limit <strong>of</strong> low-energy excitations (4.31).<br />
In the first case, the prediction (4.31) from section 4.2 holds (green dashed<br />
line in figure 4.2). In the last case, the hydrodynamic limit (4.14) from<br />
section 4.1 is applicable (blue dotted line in figure 4.2). In-between, the full<br />
formula from subsection 3.4.5 has to be evaluated (solid line in figure 4.2). In<br />
figure 4.2 numerical data averaged over 50 realizations <strong>of</strong> disorder is shown<br />
together with the perturbative prediction from subsection 3.4.5. We find<br />
good agreement, both for V0 > 0 and V0 < 0.<br />
101