Haynes International, Inc.
Haynes International, Inc.
Haynes International, Inc.
- No tags were found...

Create successful ePaper yourself
Turn your PDF publications into a flip-book with our unique Google optimized e-Paper software.
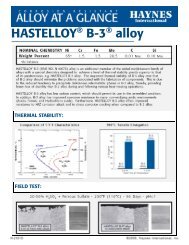
ISO-CORROSION DIAGRAMSEach of these iso-corrosion diagrams was constructed using numerous corrosion rate values,generated at different acid concentrations and temperatures. The blue line represents thosecombinations of hydrochloric acid concentration and temperature at which a corrosion rate of 0.1mm/y (4 mils per year) is expected, based on laboratory tests. Below the line, rates under 0.1 mm/yare expected. Similarly, the red line indicates the combinations of acid concentration andtemperature at which a corrosion rate of 0.5 mm/y (20 mils per year) is expected. Above the redline, rates of over 0.5 mm/y are expected. Between the blue and red lines, corrosion rates areexpected to fall between 0.1 and 0.5 mm/y.AnnealedHAYNES ® C-22HS® alloy 8