Georgia Gaming Market Assessment - Pennsylvania Treasury
Georgia Gaming Market Assessment - Pennsylvania Treasury
Georgia Gaming Market Assessment - Pennsylvania Treasury

You also want an ePaper? Increase the reach of your titles
YUMPU automatically turns print PDFs into web optimized ePapers that Google loves.
Census Bureau or Bureau of Economic Research. Average household income and effective<br />
buying income are two statistics that help to get a general feel for specific markets in terms of<br />
potential gaming revenue.<br />
Average Household Income<br />
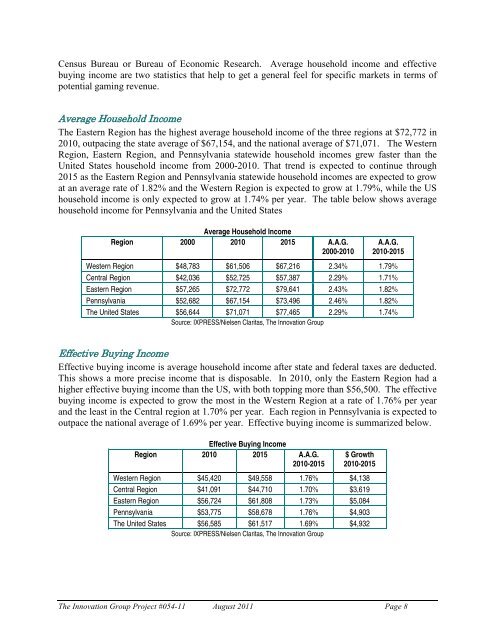
The Eastern Region has the highest average household income of the three regions at $72,772 in<br />
2010, outpacing the state average of $67,154, and the national average of $71,071. The Western<br />
Region, Eastern Region, and <strong>Pennsylvania</strong> statewide household incomes grew faster than the<br />
United States household income from 2000-2010. That trend is expected to continue through<br />
2015 as the Eastern Region and <strong>Pennsylvania</strong> statewide household incomes are expected to grow<br />
at an average rate of 1.82% and the Western Region is expected to grow at 1.79%, while the US<br />
household income is only expected to grow at 1.74% per year. The table below shows average<br />
household income for <strong>Pennsylvania</strong> and the United States<br />
Average Household Income<br />
Region 2000 2010 2015 A.A.G.<br />
2000-2010<br />
A.A.G.<br />
2010-2015<br />
Western Region $48,783 $61,506 $67,216 2.34% 1.79%<br />
Central Region $42,036 $52,725 $57,387 2.29% 1.71%<br />
Eastern Region $57,265 $72,772 $79,641 2.43% 1.82%<br />
<strong>Pennsylvania</strong> $52,682 $67,154 $73,496 2.46% 1.82%<br />
The United States $56,644 $71,071 $77,465 2.29% 1.74%<br />
Source: IXPRESS/Nielsen Claritas, The Innovation Group<br />
Effective Buying Income<br />
Effective buying income is average household income after state and federal taxes are deducted.<br />
This shows a more precise income that is disposable. In 2010, only the Eastern Region had a<br />
higher effective buying income than the US, with both topping more than $56,500. The effective<br />
buying income is expected to grow the most in the Western Region at a rate of 1.76% per year<br />
and the least in the Central region at 1.70% per year. Each region in <strong>Pennsylvania</strong> is expected to<br />
outpace the national average of 1.69% per year. Effective buying income is summarized below.<br />
Effective Buying Income<br />
Region 2010 2015 A.A.G.<br />
2010-2015<br />
$ Growth<br />
2010-2015<br />
Western Region $45,420 $49,558 1.76% $4,138<br />
Central Region $41,091 $44,710 1.70% $3,619<br />
Eastern Region $56,724 $61,808 1.73% $5,084<br />
<strong>Pennsylvania</strong> $53,775 $58,678 1.76% $4,903<br />
The United States $56,585 $61,517 1.69% $4,932<br />
Source: IXPRESS/Nielsen Claritas, The Innovation Group<br />
The Innovation Group Project #054-11 August 2011 Page 8