- Page 2 and 3:
“Quality is never an accident;it
- Page 4 and 5:
3▼Chapter 1Janitza electronics ®
- Page 6 and 7:
5▼Chapter 1Janitza’s ®3P-Strat
- Page 8 and 9:
▼Chapter 2Power Quality Monitorin
- Page 10 and 11:
▼Chapter 2Overview of universal m
- Page 12 and 13:
11▼Chapter 2Overview of universal
- Page 14 and 15:
▼Chapter 2Universal measuring ins
- Page 16 and 17:
▼Chapter 2Functions and technical
- Page 18 and 19:
▼▼Chapter 2UMG 103Mounting illu
- Page 20:
▼▼Chapter 2Power analyserexcess
- Page 23 and 24:
▼UMG 104Technical dataSupply volt
- Page 25 and 26:
UMG 604PQM - Power Quality Monitori
- Page 27 and 28:
UMG 604DIN rail mounting (6 units):
- Page 30 and 31:
▼Chapter 2Product variants and te
- Page 32 and 33:
▼▼Chapter 2UMG 604Connectionill
- Page 34:
▼Chapter 2Power quality analyserU
- Page 37 and 38:
▼UMG 605Measurement valuesVoltage
- Page 39 and 40:
PQM - Power Quality MonitoringUnive
- Page 41 and 42:
UMG 96L / UMG 96Measurement value d
- Page 43 and 44:
▼UMG 96L / UMG 96Typical connecti
- Page 45 and 46:
UMG 96SPQM - Power Quality Monitori
- Page 47 and 48:
UMG 96SData storage / memoryUp to 1
- Page 50 and 51:
▼Chapter 2Product variants and te
- Page 52 and 53:
▼Chapter 2UMG 96Smax. 6Connection
- Page 54 and 55:
▼Chapter 2Power analyserUMG 503Th
- Page 57 and 58:
▼UMG 503Overview of product varia
- Page 59 and 60:
▼UMG 503PeripheryDigital inputs (
- Page 61 and 62:
UMG 505PQM - Power Quality Monitori
- Page 63 and 64:
UMG 505Measurement value displays a
- Page 66 and 67:
▼Chapter 2Product variants and te
- Page 68 and 69:
▼Chapter 2UMG 505Dimensionaldrawi
- Page 70 and 71:
▼Chapter 2Power analyserUMG 507 p
- Page 74 and 75:
▼Chapter 2Product variants and te
- Page 76 and 77:
▼Chapter 2UMG 507CommunicationInt
- Page 78:
▼Chapter 2Main features and custo
- Page 81 and 82:
▼UMG 508Technical dataSupply volt
- Page 83 and 84:
UMG 511PQM - Power Quality Monitori
- Page 85:
UMG 511Display examplesThe backligh
- Page 88 and 89:
▼Chapter 2Product variants and te
- Page 90 and 91:
▼▼Chapter 3Power ManagementAn o
- Page 93 and 94:
PM - Power ManagementElectronic ene
- Page 95 and 96:
Product variants andtechnical dataO
- Page 97 and 98:
Module technologyCommunication modu
- Page 99 and 100:
Product variants andtechnical dataO
- Page 101 and 102:
UMG 507EmaxPM - Power ManagementUMG
- Page 103 and 104:
UMG 507EmaxFunctional principleThe
- Page 105 and 106:
UMG 507EmaxUMG 507Emax product vari
- Page 107 and 108:
ProData ®PM - Power ManagementProD
- Page 109: ProData ®Analogue inputs1 analogue
- Page 113: PQS - Power Quality SolutionsPQS -
- Page 117 and 118: Prophi ®power factor controllerVen
- Page 119 and 120: Prophi ®power factor controllerMea
- Page 121 and 122: PQS - Power Quality SolutionsPower
- Page 123 and 124: Can-type capacitor in aluminium hou
- Page 125 and 126: PQS - Power Quality SolutionsAutoma
- Page 127 and 128: Compact designAutomatic PFC in comp
- Page 129 and 130: Mounting plateAutomatic PFC system
- Page 131 and 132: PQS - Power Quality SolutionsDe-tun
- Page 133 and 134: De-tuned power factorcorrection (wi
- Page 135 and 136: ▼Extractable modular design7% De-
- Page 137 and 138: ▼Extractable modular designDe-tun
- Page 139 and 140: Dynamic (fast switching)power facto
- Page 141 and 142: ▼Extractable modular designDe-tun
- Page 143 and 144: ▼Extractable modular design7% De-
- Page 145 and 146: ▼Capacitor modules and accessorie
- Page 147 and 148: SoftwareSoftware solutions - especi
- Page 149 and 150: GridVisSoftwareGrid visualisationfo
- Page 151 and 152: GridVisProgramming and configuratio
- Page 153 and 154: GridVisReporting and statistical fu
- Page 155 and 156: OPC serverSoftwareGLTIntranetModbus
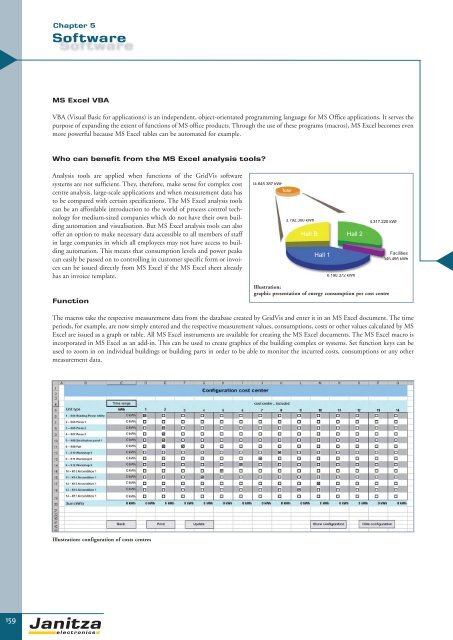
- Page 157: MS Excel analysis toolsSoftwareCust
- Page 162 and 163: ▼▼Chapter 6AccessoriesCurrent t
- Page 164 and 165: Chapter 6AccessoriesRemote maintena
- Page 166 and 167: ▼Chapter 6Moulded case current tr
- Page 168 and 169: ▼Chapter 6Moulded case current tr
- Page 170 and 171: ▼Chapter 6Cable split core CTs▼
- Page 172 and 173: ▼Chapter 6Split core current tran
- Page 174 and 175: ▼Chapter 6Current transformersDIN
- Page 176 and 177: ▼Chapter 6Current transformer acc
- Page 178 and 179: ▼Chapter 6Mechanical accessoriesM
- Page 180 and 181: ▼Chapter 6Mechanical accessoriesA
- Page 182 and 183: ▼Chapter 6Field bus componentsDe-
- Page 184 and 185: ▼Chapter 6Field bus componentsDe-
- Page 186 and 187: ▼Chapter 6Field bus componentsAcc
- Page 188 and 189: ▼Chapter 6Field bus componentsJaT
- Page 190 and 191: ▼Chapter 6Field bus componentsM-B
- Page 192 and 193: ▼Chapter 6Field bus componentsPea
- Page 194 and 195: ▼Chapter 6NTP serverInstallationT
- Page 196 and 197: ▼Chapter 6ServerWe leave you also
- Page 198 and 199: ▼▼Chapter 6ServerApplicationAny
- Page 200 and 201: ▼Chapter 6Touch panelsGeneralJPC1
- Page 202 and 203: ▼Chapter 6Touch panelsApplication
- Page 204 and 205: ▼Chapter 6Touch panels (HMI)Touch
- Page 206 and 207: ▼Chapter 7AppendixApplication at
- Page 208 and 209: ▼Chapter 7Cable diameters & fuse
- Page 210 and 211:
▼Chapter 7Fixed compensationSelec
- Page 212 and 213:
▼Chapter 7Communication▼Connect
- Page 214 and 215:
▼Chapter 7Logistics informationCa
- Page 216 and 217:
▼Chapter 7Application example▼
- Page 219:
Project description - BankThe probl
- Page 222 and 223:
221▼Janitza electronics ®
- Page 224 and 225:
223▼Janitza electronics ®
- Page 226 and 227:
225▼Janitza electronics ®
- Page 228:
Janitza electronics GmbHVor dem Pol